

Sample Category Title
GBP/USD Weekly Outlook
GBP/USD stayed in range trading inside 1.1932/2666 last week and outlook is unchanged. Initial bias stays neutral this week first. Outlook stays bearish as long as 1.2666 resistance holds. On the downside, break of 1.1932 will resume larger down trend from 1.4248. However, firm break of 1.2666 will suggest medium term bottoming and bring stronger rebound back towards 1.3158 support turned resistance.
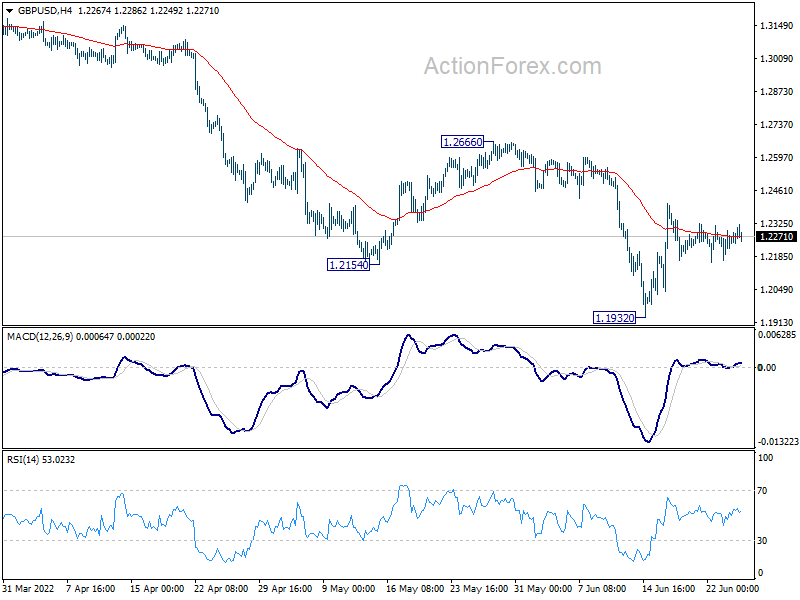
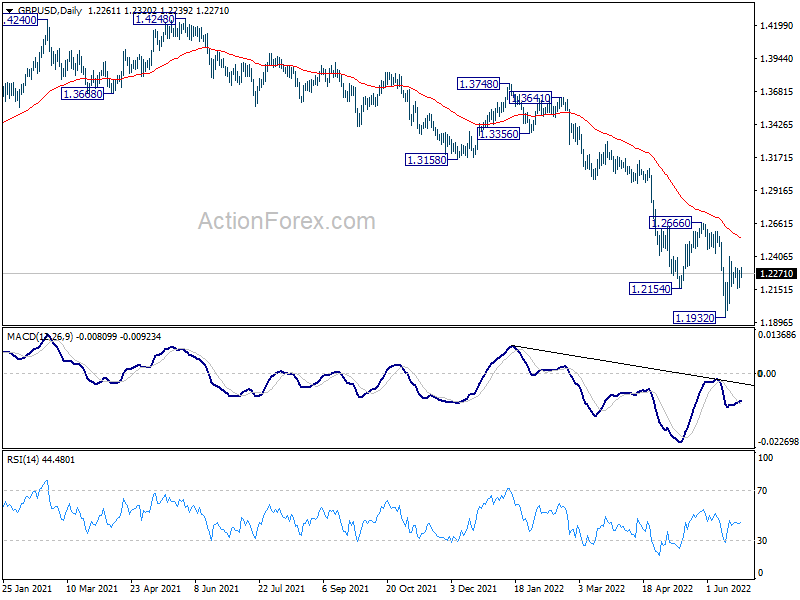
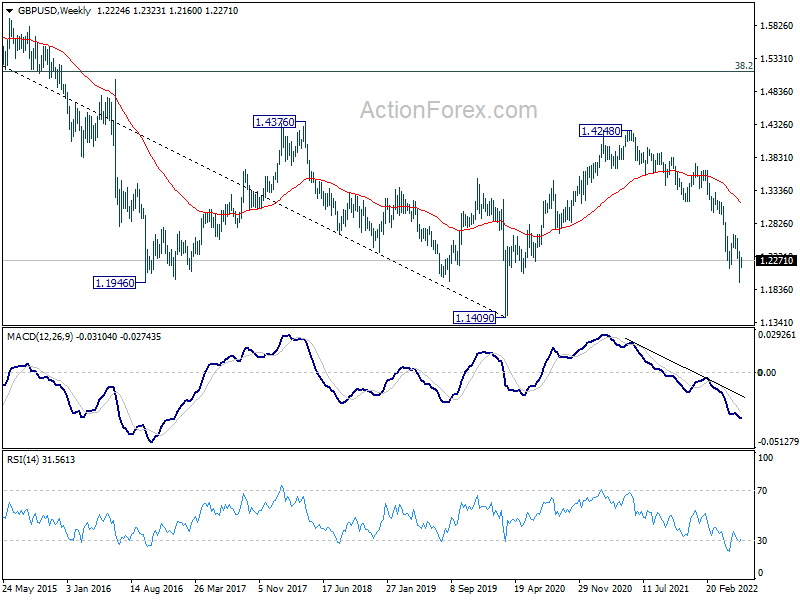
In the bigger picture, fall from 1.4248 (2018 high) could be a leg inside the pattern from 1.1409 (2020 low), or resuming the longer term down trend. Deeper decline is expected as long as 1.2666 resistance holds. Next target is 1.1409 low. However, firm break of 1.2666 will bring stronger rise back to 55 week EMA (now at 1.3140).
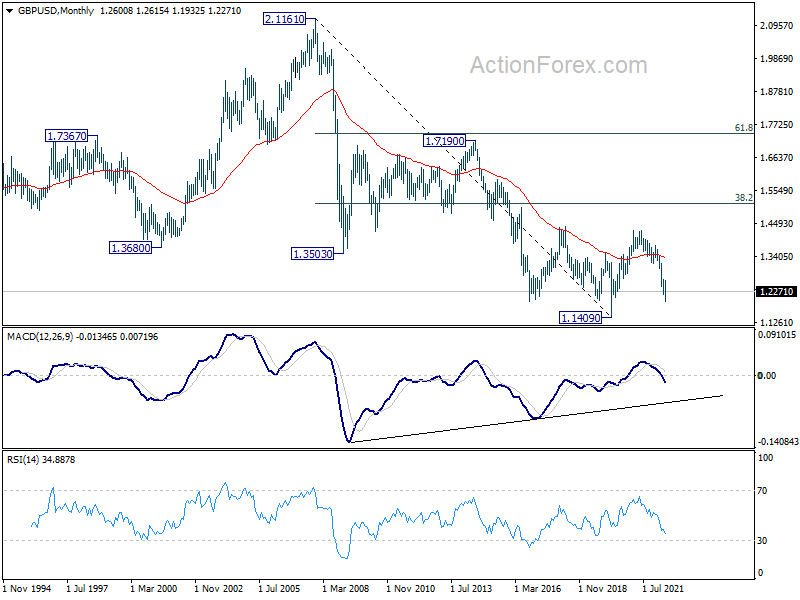
In the longer term picture, rebound from 1.1409 long term bottom should have completed at 1.4248 already, well ahead of 38.2% retracement of 2.1161 to 1.1409 at 1.5134. The development argues that price actions from 1.1409 are developing into a corrective pattern only. That is, long term bearishness is retained for resuming the down trend from 2.1161 (2007 high) at a later stage.
USD/CHF Weekly Outlook
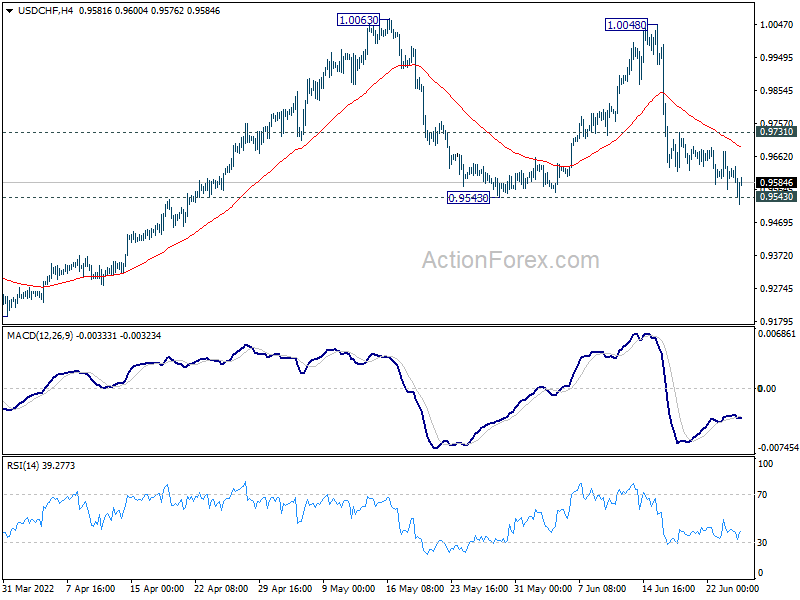
USD/CHF's fall from 1.0048 extended lower last week. For now, such decline is still seen as the third leg of the consolidation pattern from 1.0063. Strong support should be seen around 0.9543 to bring rebound. On the upside, above 0.9731 minor resistance will turn bias back to the upside for retesting 1.0063 resistance. However, sustained break of 0.9543 will bring deeper fall back to 0.9459 resistance turned support.
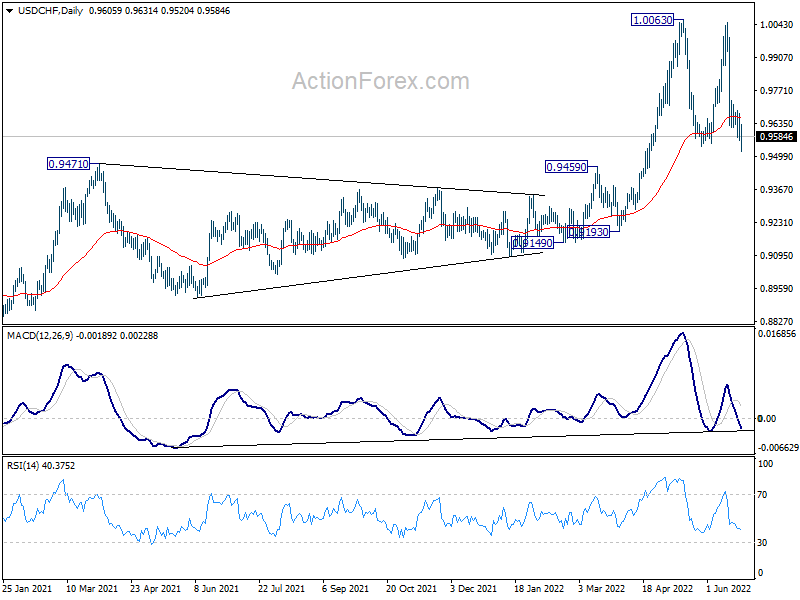
In the bigger picture, down trend from 1.0342 (2016 high) should have completed with three waves down to 0.8756 (2021 low) already. Rise from 0.8756 is likely a medium term up trend of its own. Next target is 1.0237/0342 resistance zone. This will remain the favored case as long as 0.9471 resistance turned support holds. However, sustained break of 0.9471 will extend long term range trading with another falling leg.
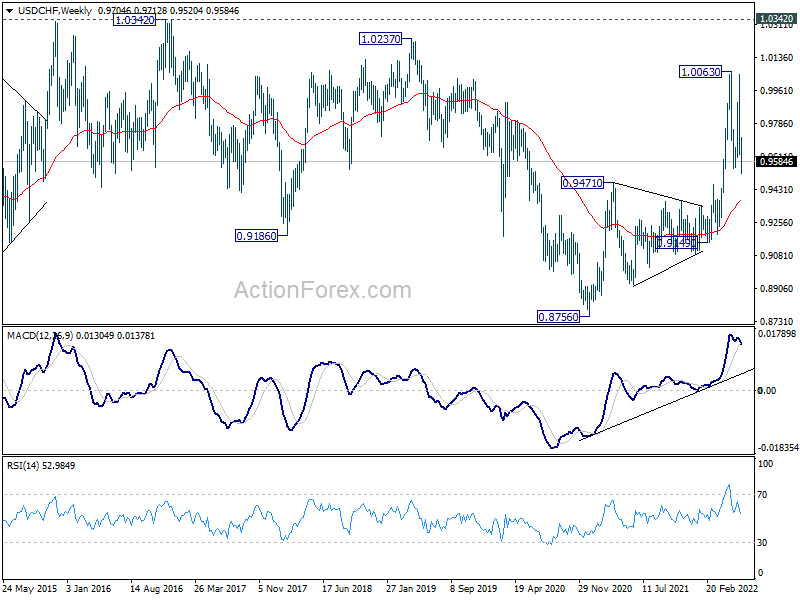
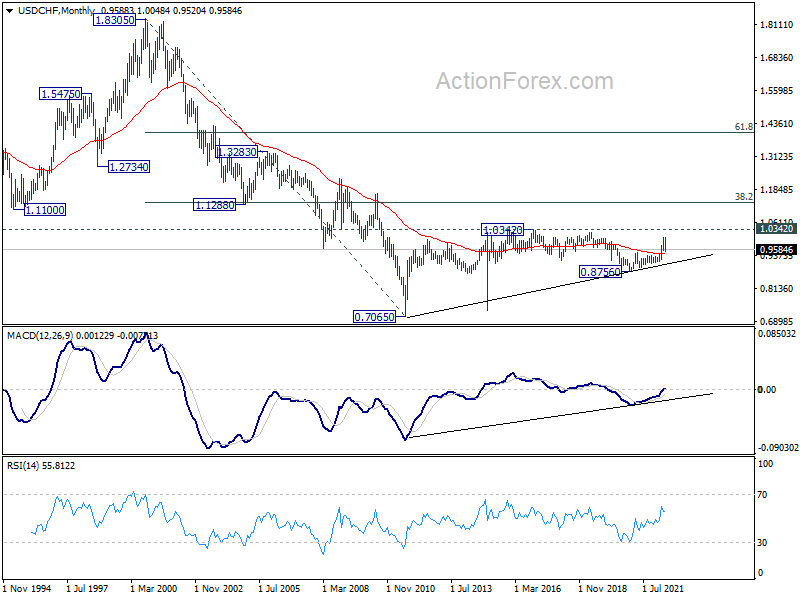
In the long term picture, current development argues that the correction from 1.0342 (2016 high) has completed at 0.8756 (2020 low) already. Rise from 0.7065 (2011 low) might be ready to resume. Firm break of 1.0342 will confirm and target 38.2% retracement of 1.8305 (2000 high) to 0.7065 at 1.1359.
AUD/USD Weekly Outlook
AUD/USD stayed in sideway trading last week. Initial bias remains neutral this week first. downside, firm break of 0.6828 support will resume larger fall from 0.8006. Next target is 0.6756/60 cluster support. On the upside, above 0.7068 minor resistance will bring stronger rebound to 0.7282 resistance first. Firm break there will be a sign of bullish reversal and bring stronger rebound to 0.7666 resistance.
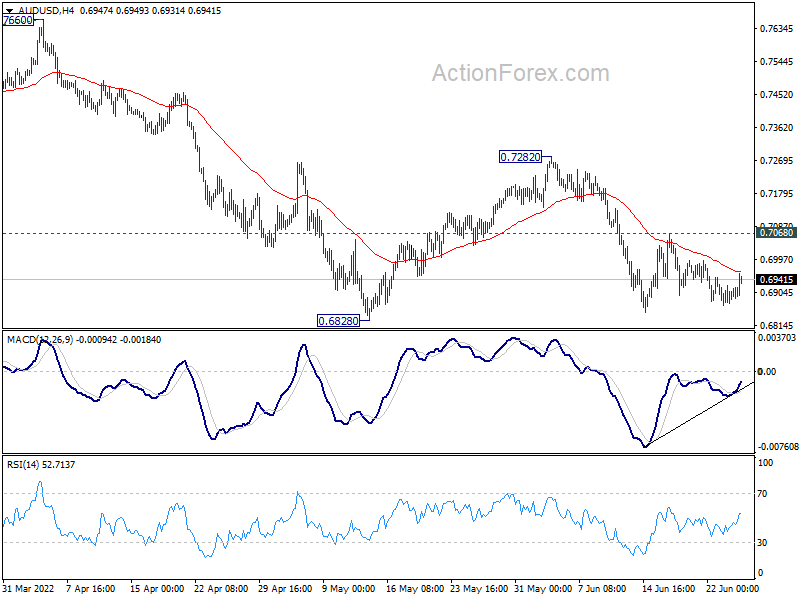
In the bigger picture, price actions from 0.8006 are seen as a corrective pattern to rise from 0.5506 (2020 low). Deeper fall could still be seen to 50% retracement of 0.5506 to 0.8006 at 0.6756. This coincides with 100% projection of 0.8006 to 0.7105 from 0.7660 at 0.6760. Strong support is expected from 0.6756/60 cluster to contain downside to complete the correction. Meanwhile, firm break of 0.7660 resistance will confirm that such corrective pattern has completed, and larger up trend is ready to resume.
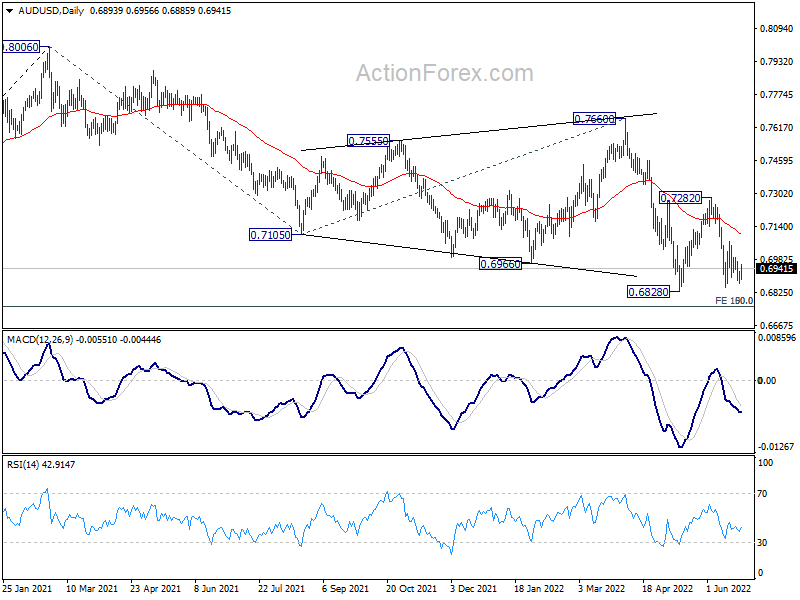
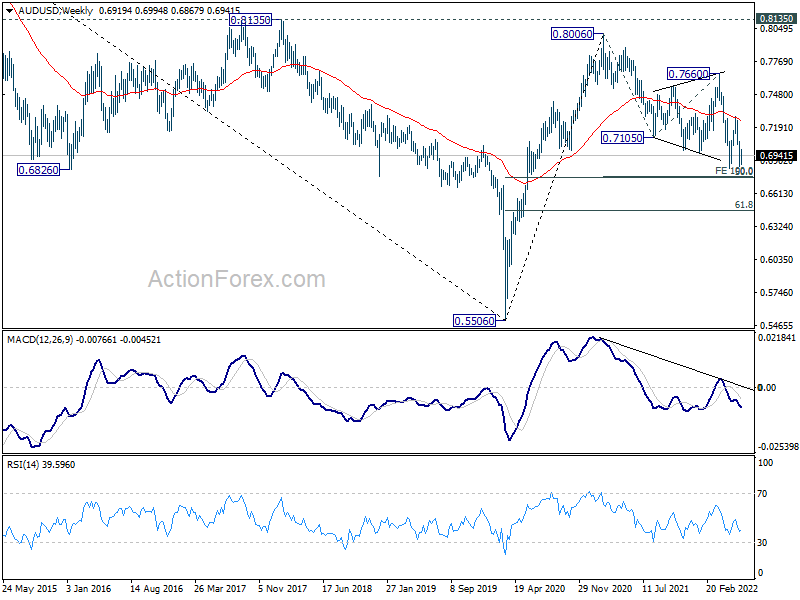
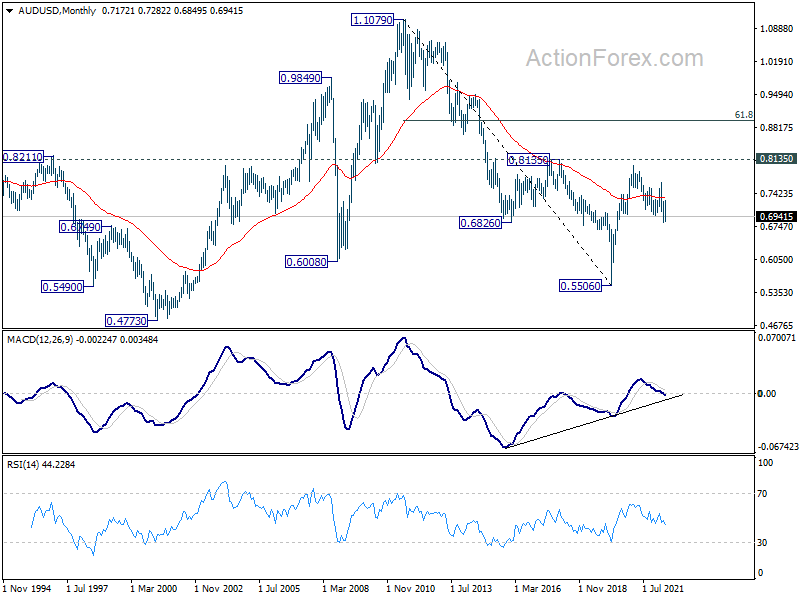
In the longer term picture, focus remains on 0.8135 structural resistance. Decisive break there will argue that rise from 0.5506 is developing into a long term up trend that reverses whole down trend from 1.1079 (2011 high). However, rejection by 0.8135 will keep long term outlook neutral at best.
USD/CAD Weekly Outlook
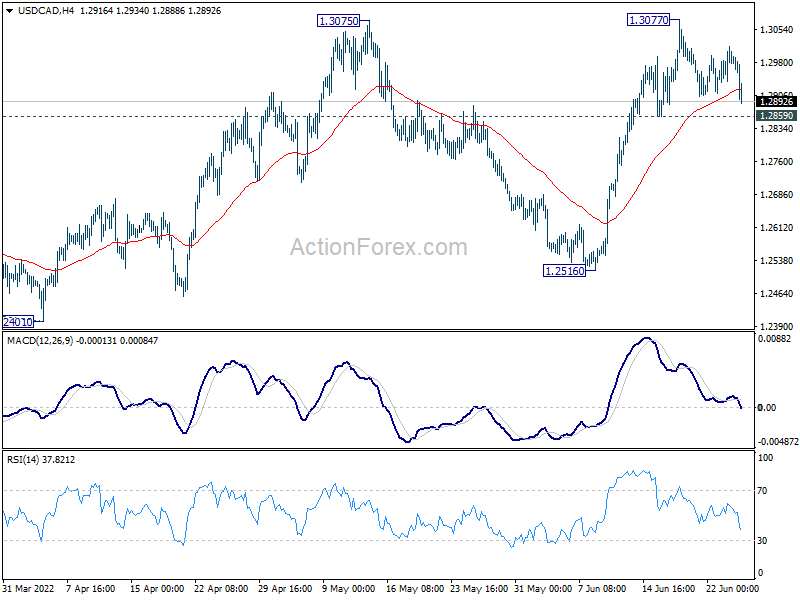
USD/CAD rose further to 1.3077 last week but failed to sustain above 1.3022 fibonacci level and retreated. Initial bias remains neutral this week first. On the upside, break of 1.3077 and sustained trading above 1.3022 fibonacci level will carry larger bullish implications. Next target is 100% projection of 1.2005 to 1.2947 from 1.2401 at 1.3343. However, break of 1.2859 minor support will turn bias back to the downside for 1.2516 support instead.
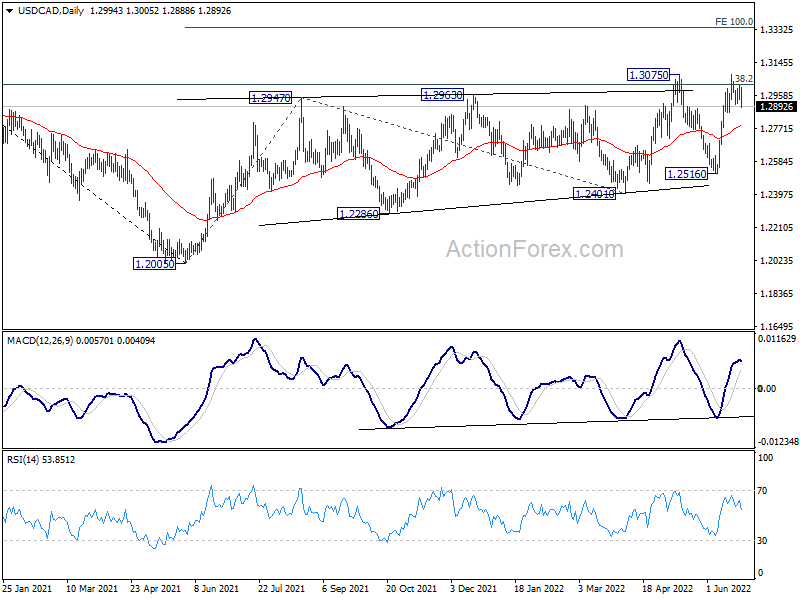
In the bigger picture, focus stays on 38.2% retracement of 1.4667 (2020 high) to 1.2005 (2021 low) at 1.3022. Sustained break there should confirm that the down trend from 1.4667 has completed after defending 1.2061 long term cluster support. Further rise would then be seen towards 61.8% retracement at 1.3650. However, rejection by 1.3022 will maintain medium term bearishness.
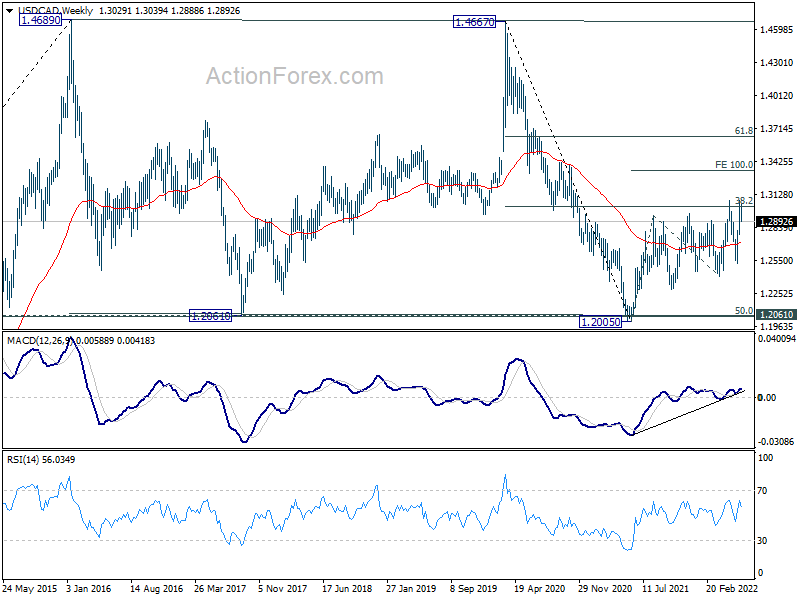
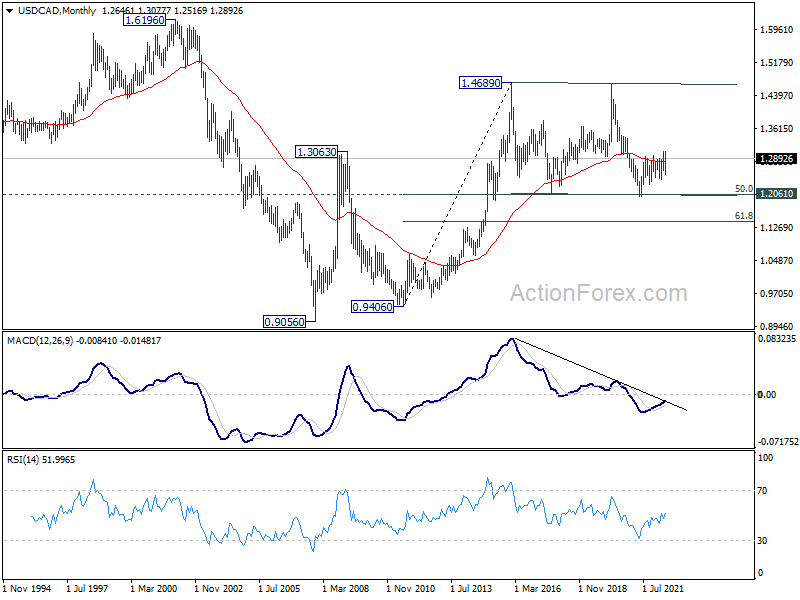
In the longer term picture, price actions from 1.4689 (2016 high) are seen as a consolidation pattern only. That is, up trend from 0.9506 (2007 low) is still expected to resume at a later stage. This will remain the favored case as long as 1.2061 support holds, which is close to 50% retracement of 0.9406 to 1.4689 at 1.2048. However, firm break of 1.2061 support will argue that USD/CAD has already started a long term down trend. Next target is 61.8% retracement of 0.9406 to 1.4689 at 1.1424.
GBP/JPY Weekly Outlook
GBP/JPY rose further last week but failed to break through 168.67 resistance. Initial bias remains neutral this week first. On the upside, decisive break of 168.67 resistance will resume larger up trend. Next near term target is 100% projection of 155.57 to 168.67 from 159.97 at 173.07. On the downside, below 164.45 minor support will turn bias back to the downside for 159.97 support instead.
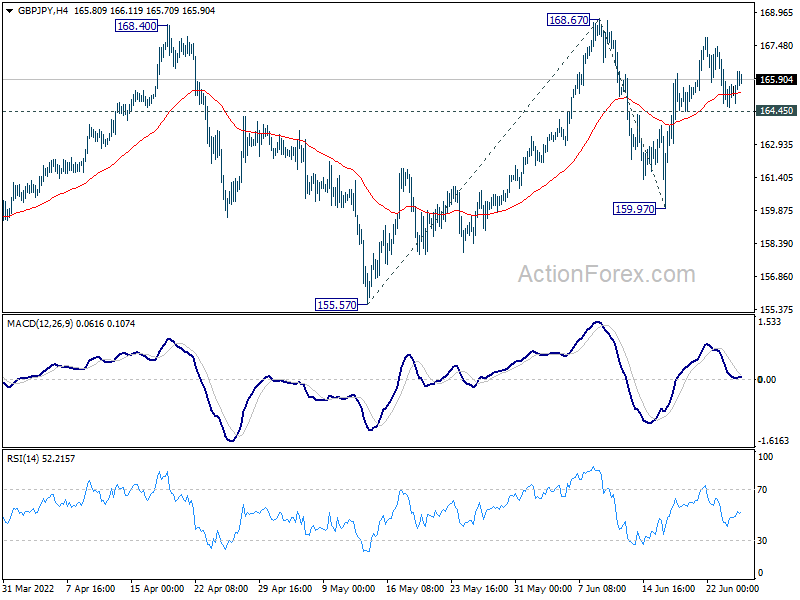
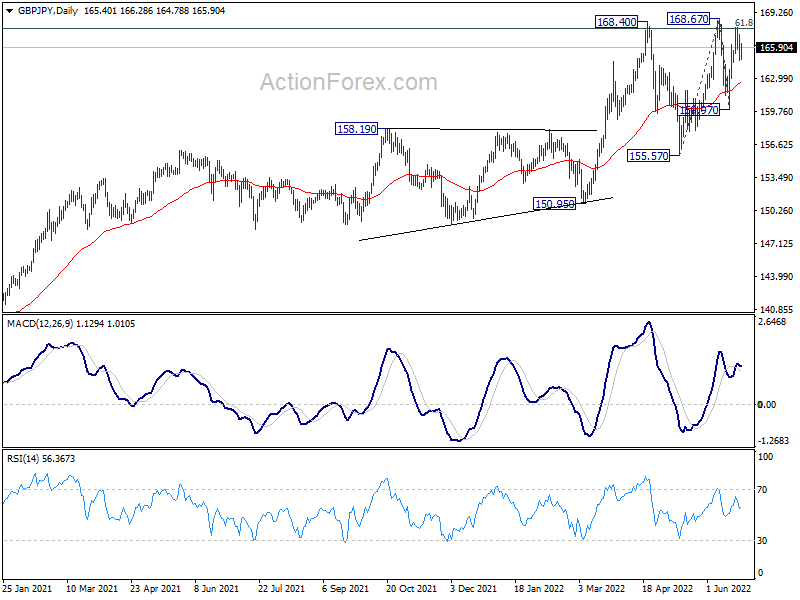
In the bigger picture, up trend from 123.94 (2020 low) is still in progress. Sustained break of 61.8% retracement of 195.86 (2015 high) to 122.75 (2016 low) at 167.93 will be a long term bullish signal, and could pave the way back to 195.86 high. This will now remain the favored case as long as 155.57 support holds, even in case of deep pull back.
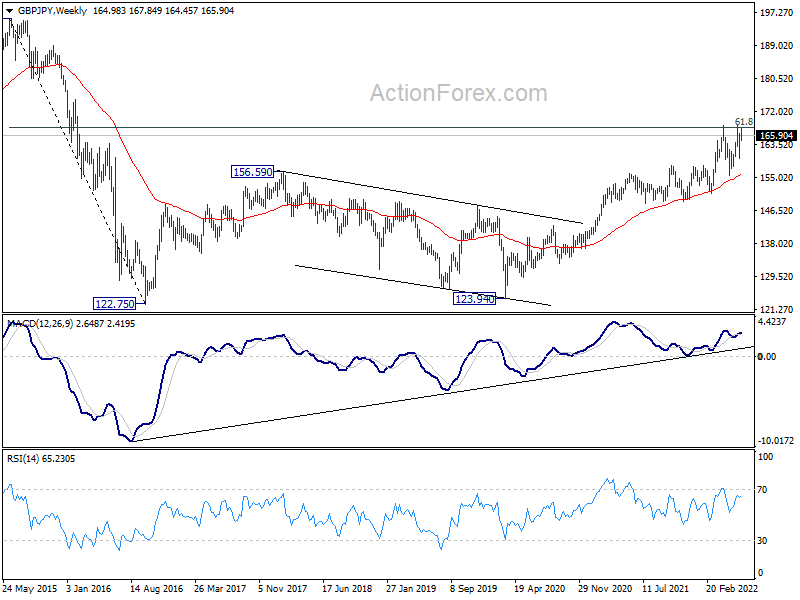
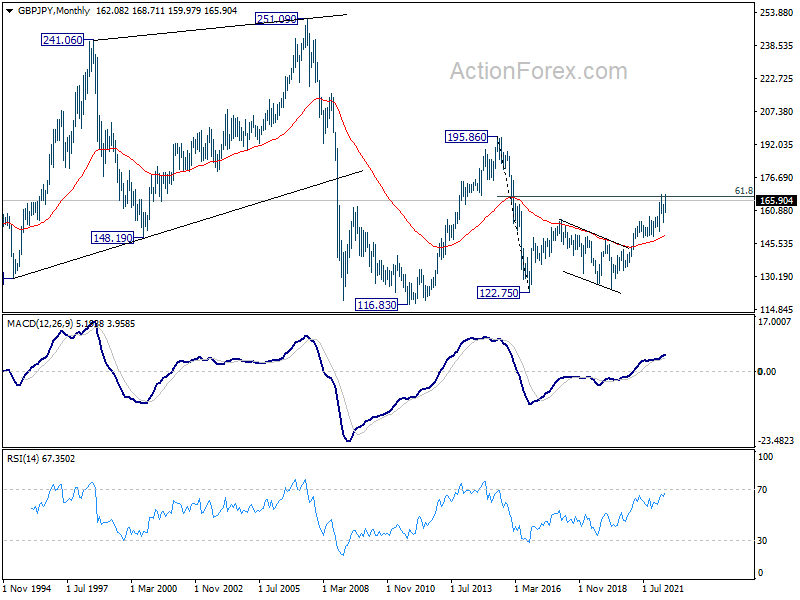
In the longer term picture, rise from 122.75 could be the third leg the the pattern from 116.83 (2011 low). Further rise will remain in favor as long as 55 month EMA (now at 149.32) holds. Sustained break of 61.8% retracement of 195.86 to 122.75 at 167.93. will pave the way to 195.86 (2015 high).
EUR/JPY Weekly Outlook
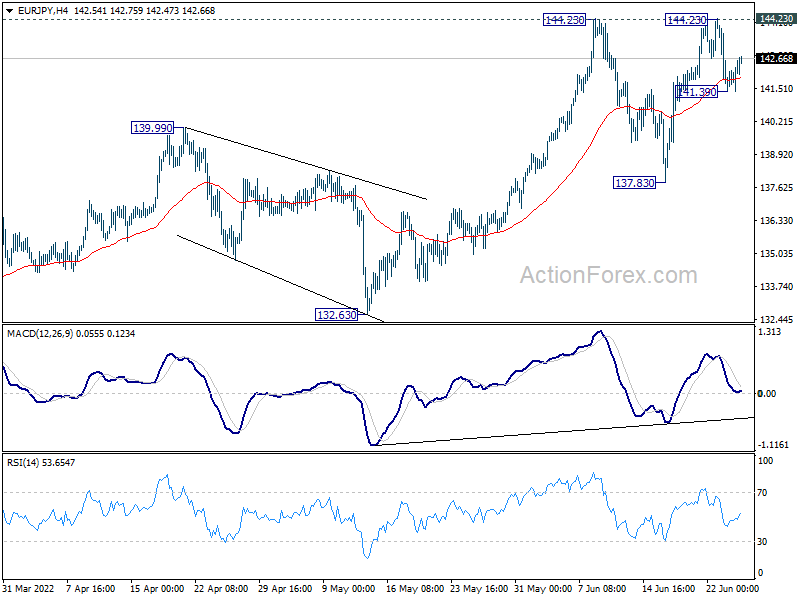
EUR/JPY rose further last week but failed to break through 144.23 resistance. Subsequent retest was supported support by 4 hour 55 EMA. Initial bias is neutral this week first. On the upside, decisive break of 144.23 will resume larger up trend. On the downside, below 141.39 minor support will bring deeper fall, to extend the corrective pattern from 144.23.
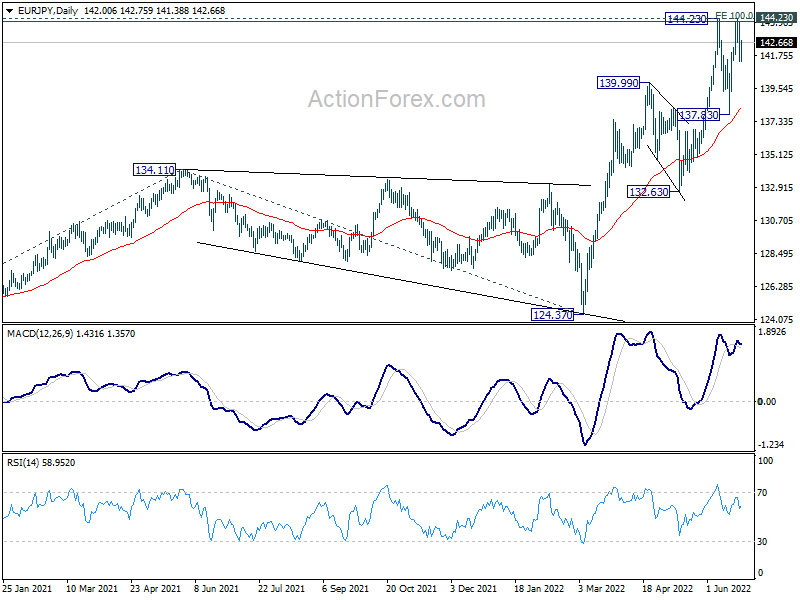
In the bigger picture, up trend from 114.42 (2020 low) is in progress. Such rise is seen as the third leg of the pattern from 109.30 (2016 low). Sustained trading above 100% projection of 114.42 to 134.11 from 124.37 at 144.06 will indicate upside acceleration and target 149.76 long term resistance (2014 high). In any case, outlook will now remain bullish as long as 132.63 support holds, in case of deep pull back.
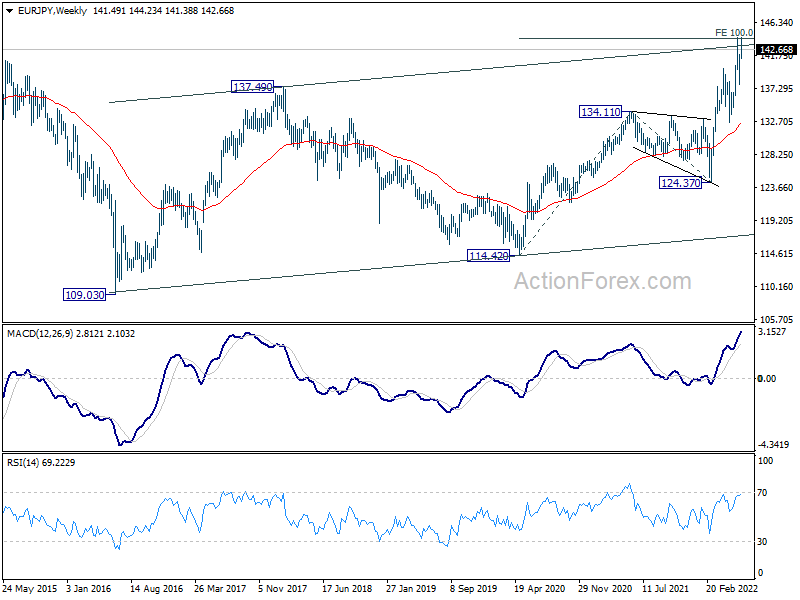
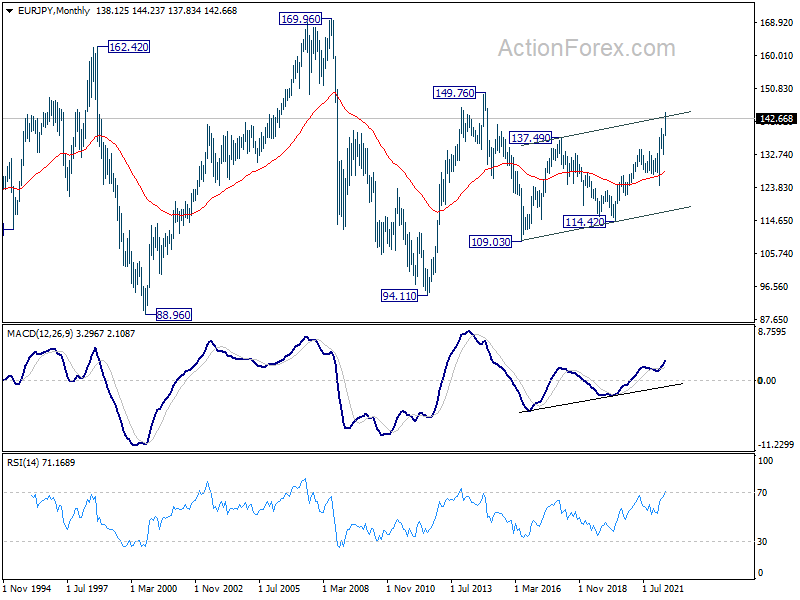
In the long term picture, current rally could be resuming whole rise from 94.11 (2012 low). Further rally would be seen to 149.76 resistance (2014 high) and above. This will remain the favored case as long as 132.63 support holds.
EUR/GBP Weekly Outlook
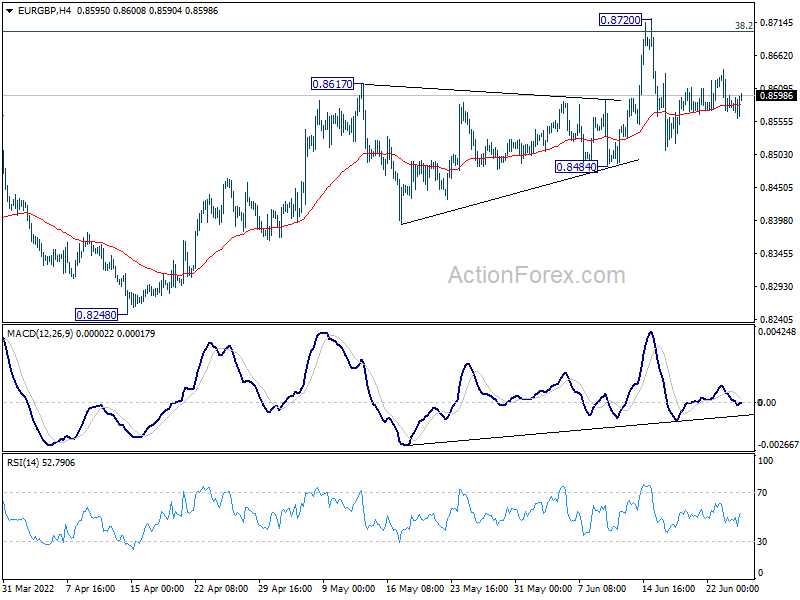
EUR/GBP stayed in range of 0.8848/8720 last week and outlook is unchanged. Initial bias remains neutral this week first. Further rise is expected as long as 0.8484 support holds. Break of 0.8720 and sustained trading above 0.8697 medium term fibonacci level will carry larger bullish implication. Next target is 0.9003 fibonacci level. However, break of 0.8484 will indicate rejection by 0.8697 and turn near term outlook bearish.
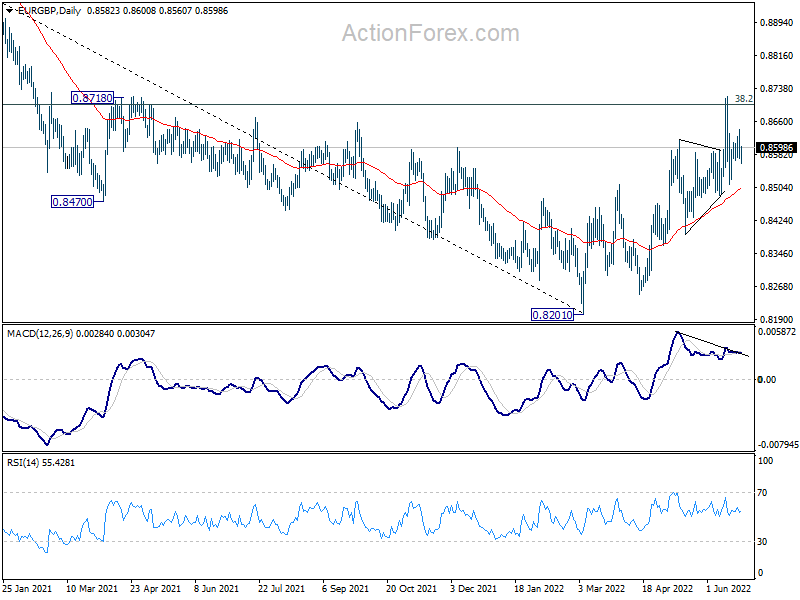
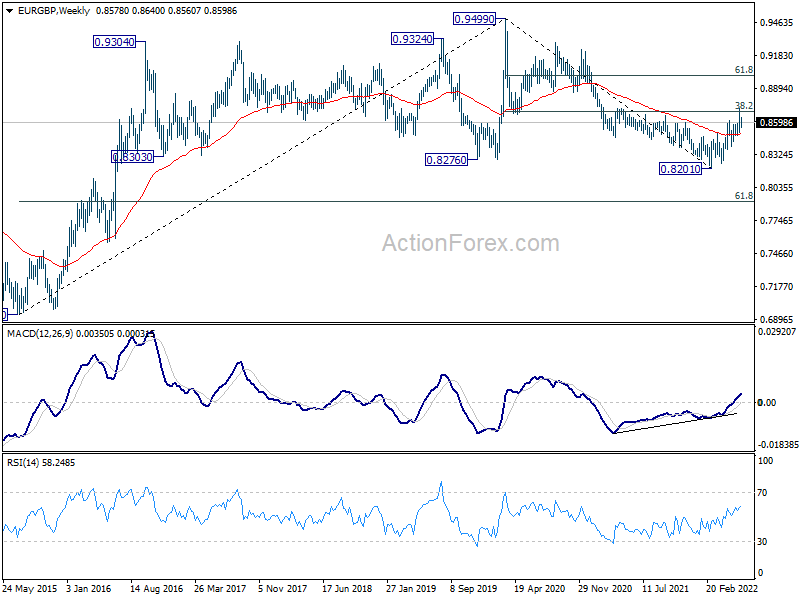
In the bigger picture, rise from 0.8201 medium term bottom could could either be a correction to the down trend from 0.9499 (2020 high), or a medium term up trend itself. Sustained break of 38.2% retracement of 0.9499 to 0.8201 at 0.8697 will affirm the latter case, and pave the way to 61.8% retracement at 0.9003. However, rejection by 0.8697 will maintain medium term bearishness.
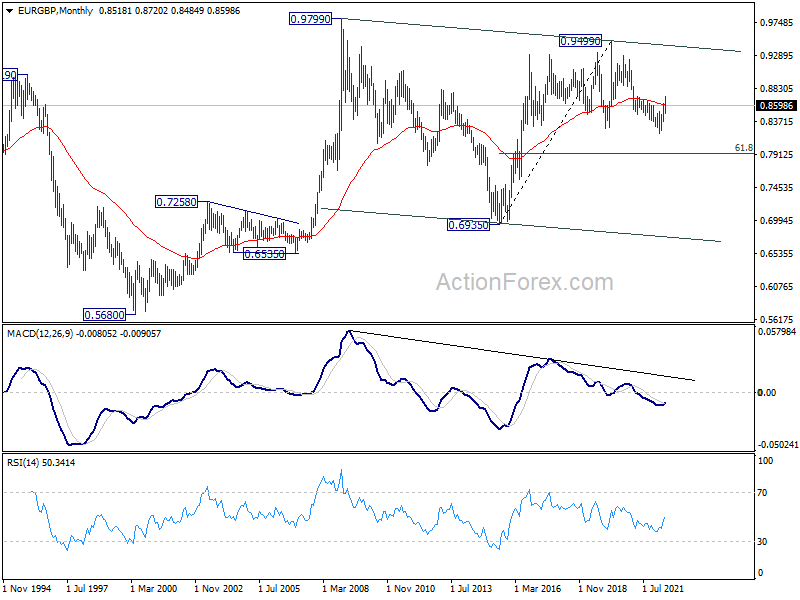
In the long term picture, the lack of medium term downside momentum suggests that fall from 0.9499 (2020 high) is merely a correction to rise from 0.6935 (2015 high). In case of another fall, downside should be contained by 61.8% retracement of 0.6935 to 0.9499 at 0.7917 to bring rebound. Sustained trading above 55 month EMA (now at 0.8604) will indicate that the correction has completed and bring retest of 0.9499.
EUR/AUD Weekly Outlook
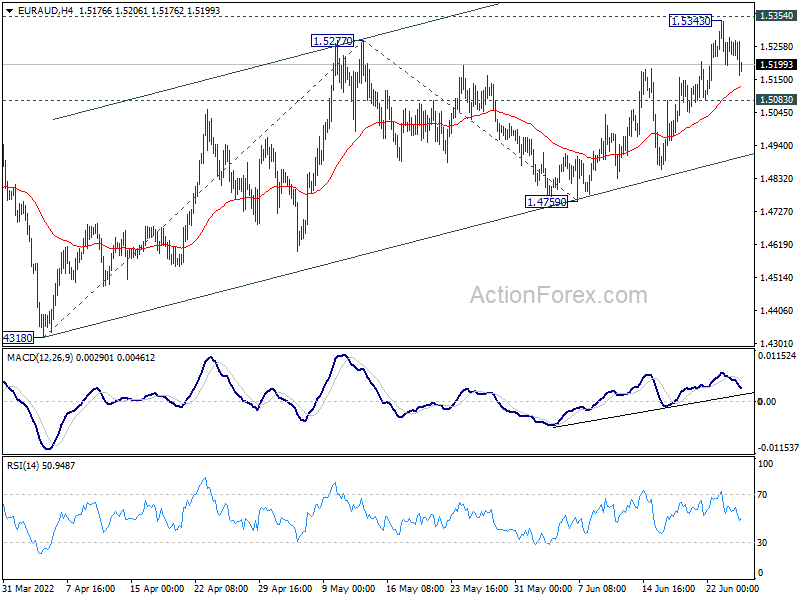
EUR/AUD rose further to 1.5343 last week but retreated ahead of 1.5354 support turned resistance. Initial bias is neutral this week first. On the upside, sustained break of 1.5354 will indicate medium term bottoming at 1.4318. Stronger rally would be seen back to 100% projection of 1.4318 to 1.5277 from 1.4759 at 1.5718. On the downside, however, break of 1.5083 minor support will retain medium term bearishness, and turn bias back to the downside for 1.4759 support instead.
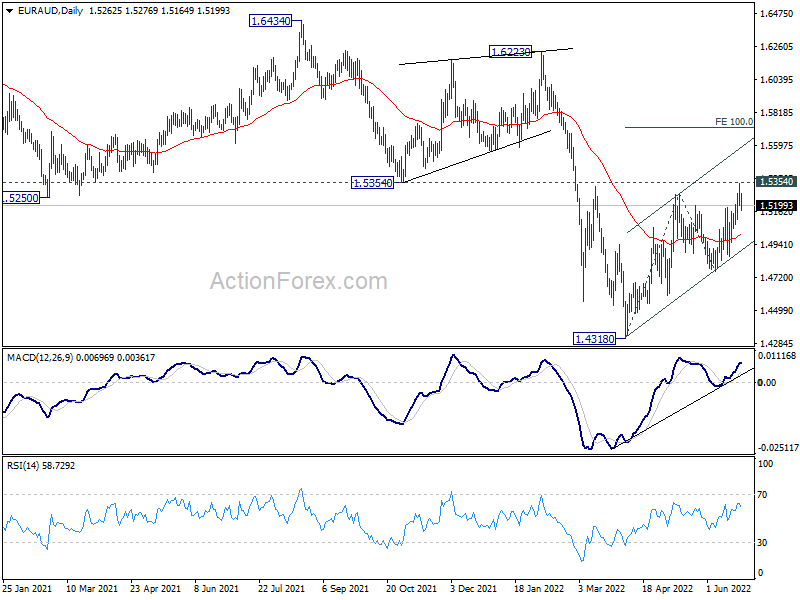
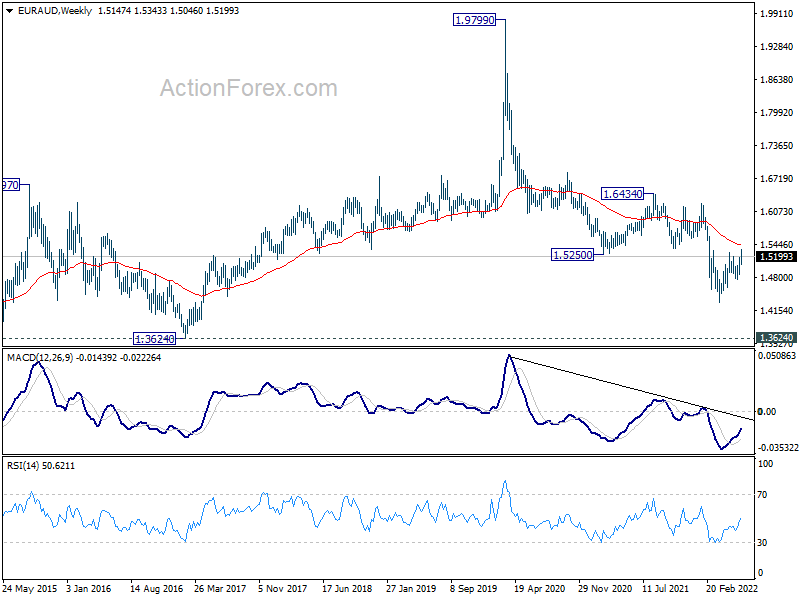
In the bigger picture, as long as 1.5354 support turned resistance holds, larger down trend from 1.9799 (2020 high) is still expected to continue. On resumption, next target is 61.8% projection of 1.9799 to 1.5250 from 1.6434 at 1.3623, which is close to 1.3624 long term support (2017 low). However, firm break of 1.5354 will indicate medium term bottoming and bring stronger rally back to 1.6434 key resistance.
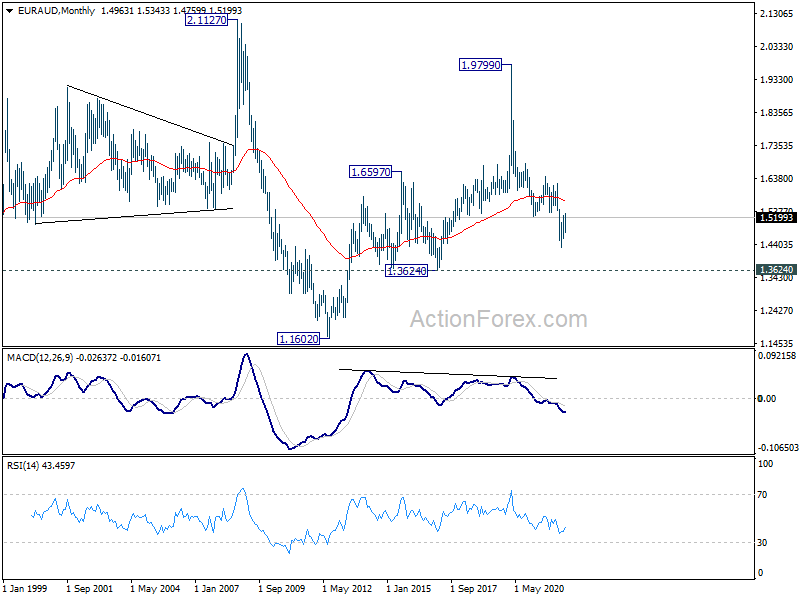
In the longer term picture, fall from 1.9799 (2020 high) is seen as the third leg of the pattern from 2.1127 (2008 high). Deeper fall should be seen to 1.3624 support. Decisive break there would pave the way back to 1.1602 (2012 low). This will remain the favored case as long as 55 month EMA (now at 1.5713) holds.
EUR/CHF Weekly Outlook
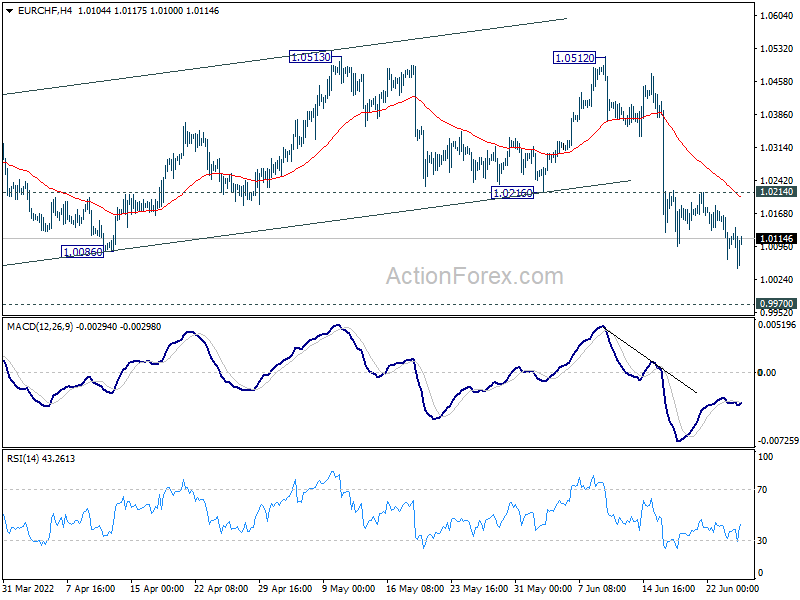
EUR/CHF's fall from 1.0512 extended lower last week after brief consolidations. Initial bias stays on the downside this week for retesting 0.9970 low. Decisive break there will resume larger down trend. On the upside, however, above 1.0214 minor resistance will delay the bearish case, and turn bias back to the upside for stronger rebound.
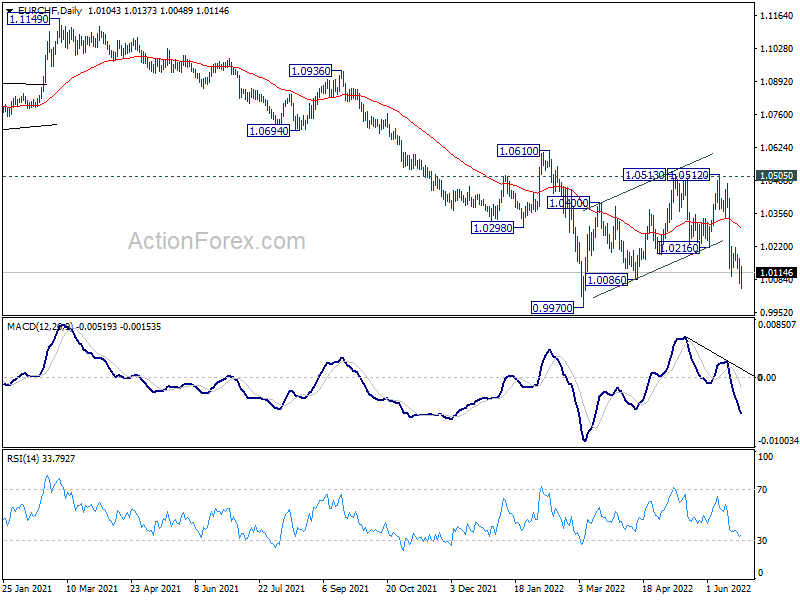
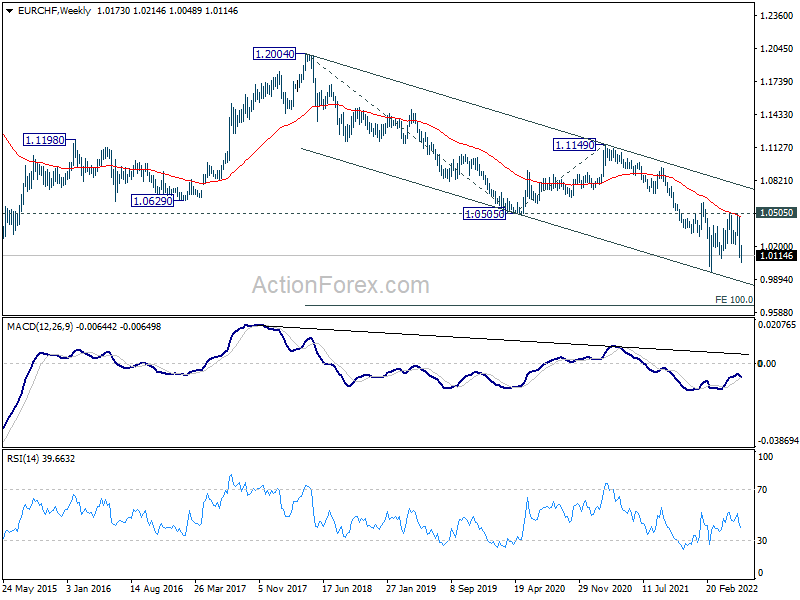
In the bigger picture, as long as 1.0505 support turned resistance (2020 low) holds, long term down trend from 1.2004 (2018 high) is expected to continue. Next target is 100% projection of 1.2004 to 1.0505 to 1.1149 at 0.9650. However, firm break of 1.0505 will suggest medium term bottoming, and bring stronger rebound towards 1.1149 structural resistance.
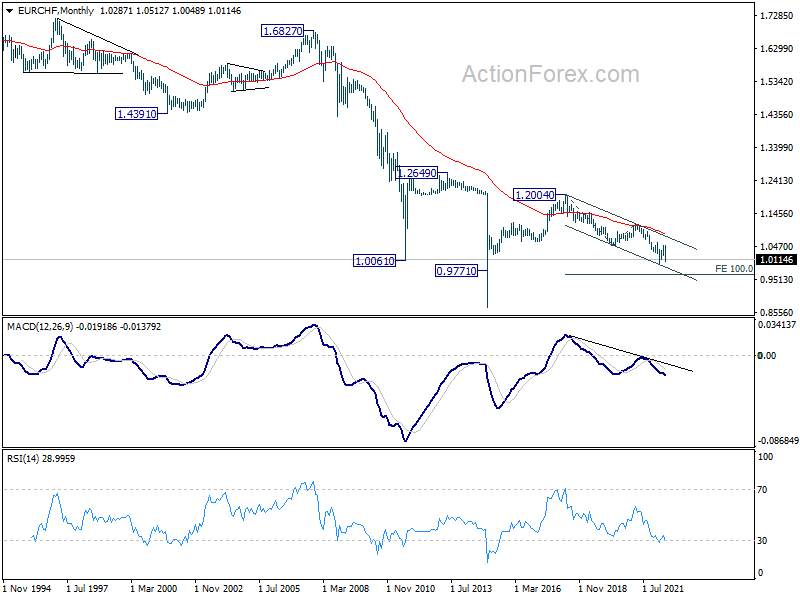
In the long term picture, capped below 55 month EMA, EUR/CHF is seen as extending the multi-decade down trend. There is no prospect of a bullish reversal until some sustained trading above the 55 month EMA (now at 1.0846).
Falling Commodity Prices Support Sentiment, Dollar Downside Risk Increasing
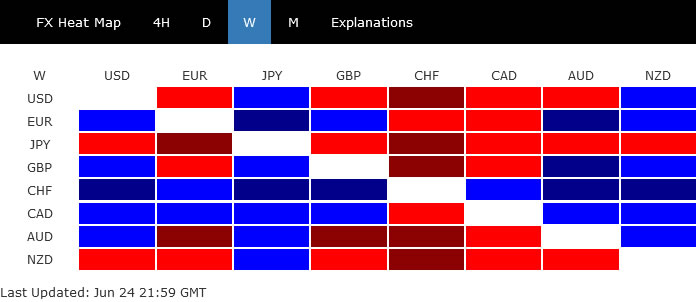
The forex markets were rather mixed last week. Yen ended as the worst performer, but Swiss Franc was the best. Canadian Dollar rose against all but Franc, while Aussie and Kiwi were weak. Euro was mixed together with Sterling wile Dollar was ended lower against all but Yen and Kiwi.
Overall, there were hints of a turnaround in sentiment, as manifested in the late rebound in stocks. Tumbling commodity and energy prices raised hope that inflation is nearing its peak, which is also reflected in pull back in treasury yields. The upcoming developments in the last week of the quarter, and the first of next would reveal more on what next.
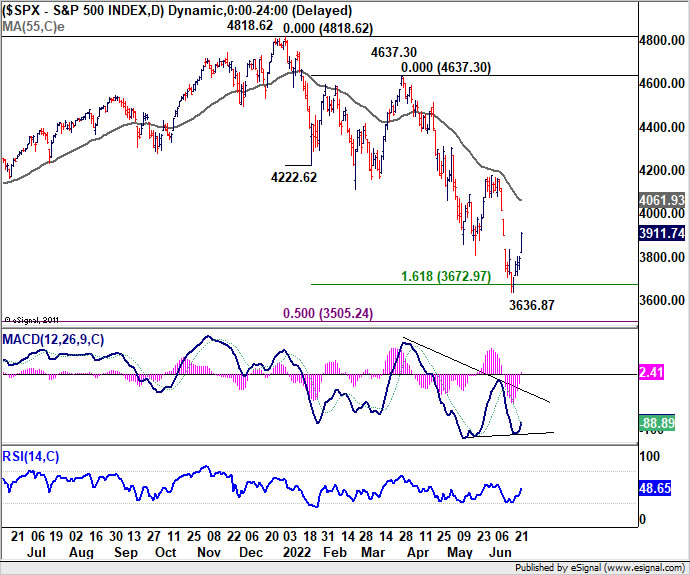
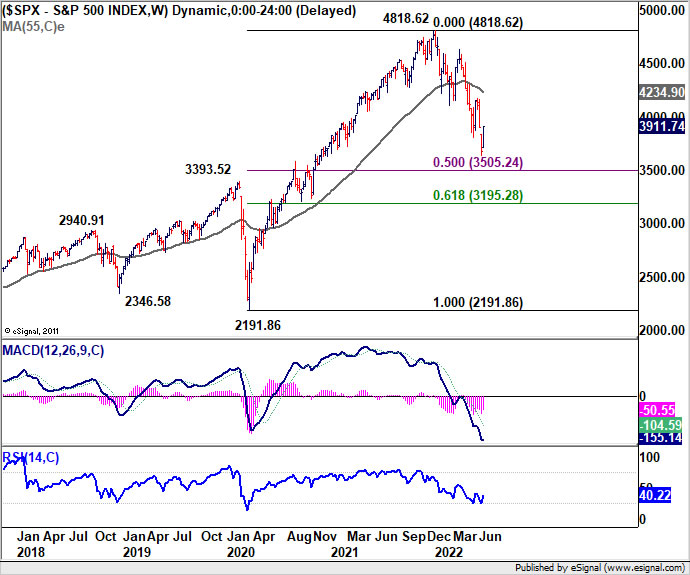
S&P 500 bottomed for the near term
After being pressured for most of the week, US stocks staged a strong rebound on Friday. S&P 500 snapped a three-week losing streak and closed the week notably higher. There is also hope that a recession could be avoided in the US with soft landing achieved. Also, a key driving factor was the optimism that the economy could finally be seeing lights out of the inflation tunnel, following the deep decline in commodity prices. Further fall in commodity and energy prices could give sentiments more lifts.
A short term bottom should at least be in place at 3636.87. Considering bullish convergence condition in daily MACD, it's possible that whole correction from 4818.62 has completed with three waves down, after hitting 161.8% projection of 4868.62 to 4222.62 from 4637.30 at 3672.97. Further rise is now in favor for the near term for 55 day EMA (now at 4061.93). Reaction from there would tell whether it's just another oversold bounce, or it's already in near term bullish reversal.
Copper heading back to pre-pandemic level
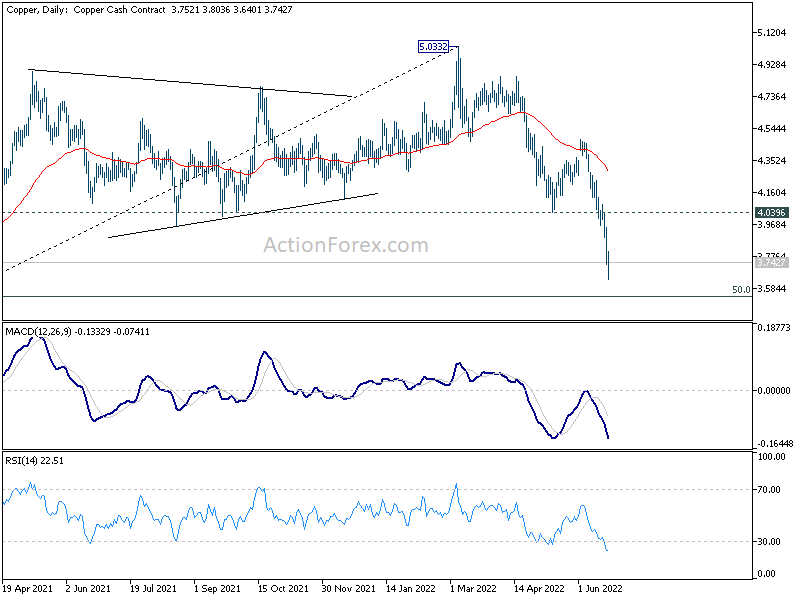
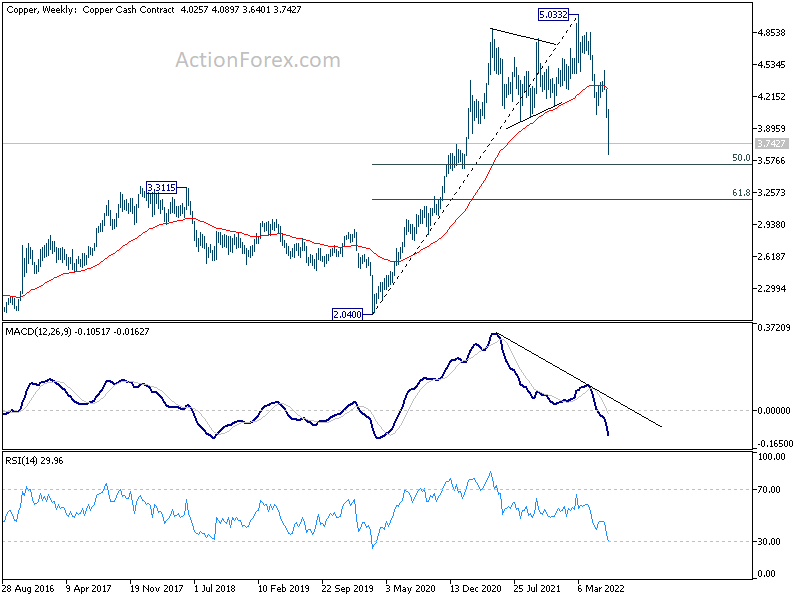
Copper's selloff accelerated for another week, and closed at the lowest level in 16 months. 5.0332 high made in March is definitely a medium term top. The fall from there could be attributed to resumption of global supply, as the industry normalized out of the pandemic. On the other hand, there is bearish pressure from deteriorating demand from China.
50% retracement of 2.0400 to 5.0332 at 3.5366 might provide an initial floor. But break of 4.0396 support turned resistance is needed to be the first sign of reversal, or risk will stay on the downside. Copper might to 61.8% retracement at 3.1834 before bottoming. But, anyway, that was still slightly above pre-pandemic range which was below 3. So, it's not unreasonable.
Natural gas correcting whole up trend since pandemic
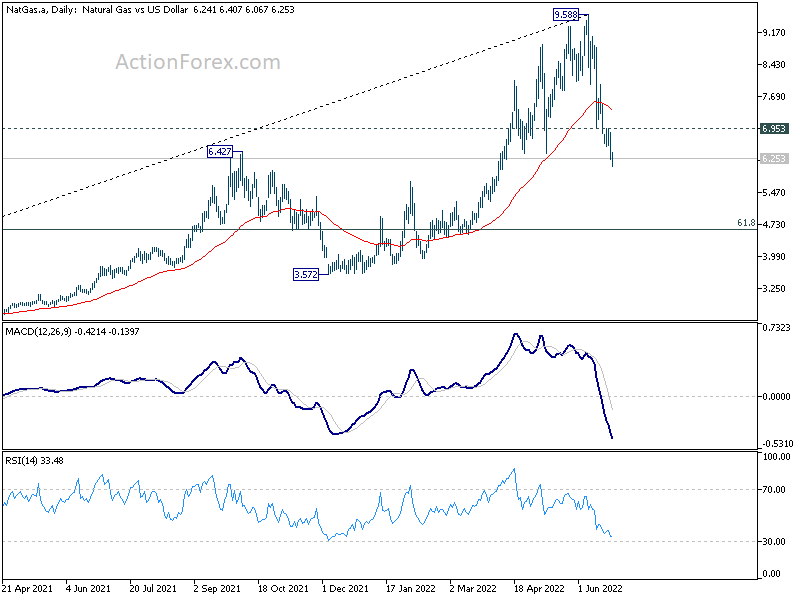
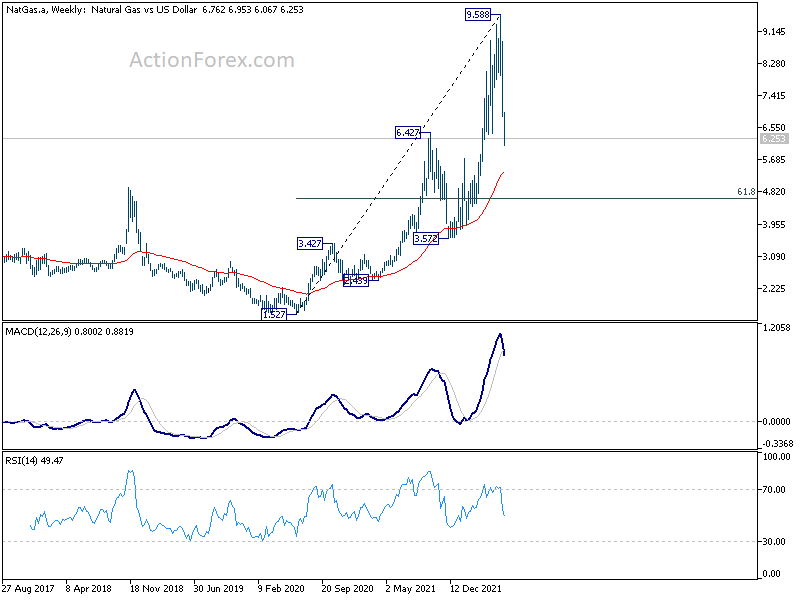
Natural gas also extended the steep decline from 9.588 high, made earlier this month. It has been reversing the rally since Russian invasion of Ukraine, as Germany, the Netherlands and Austria are reverting to coal power, rather than turning to gas. Technically, with the break of 6.427 (2021 high), it could now be correcting the whole up trend that started back at 1.527 in 2020, after the start of the pandemic. Near term outlook will stay bearish as long as 6.953 resistance holds. Next target is 55 week EMA (now at 5.353).
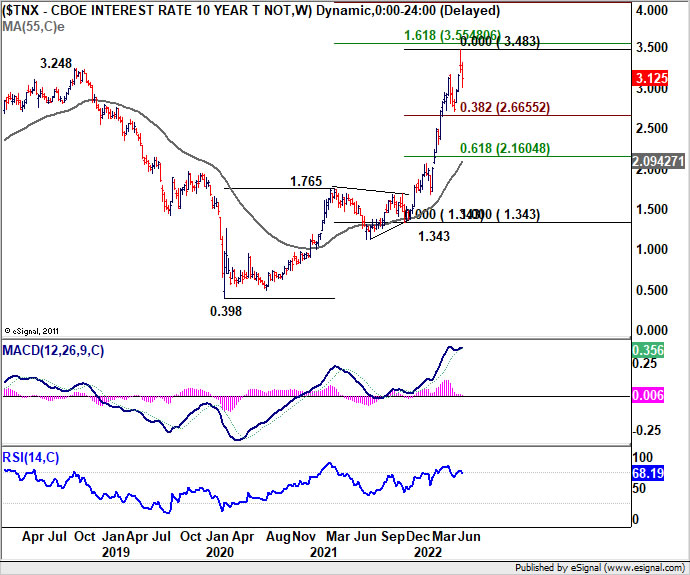
10-year yield probably started medium term correction
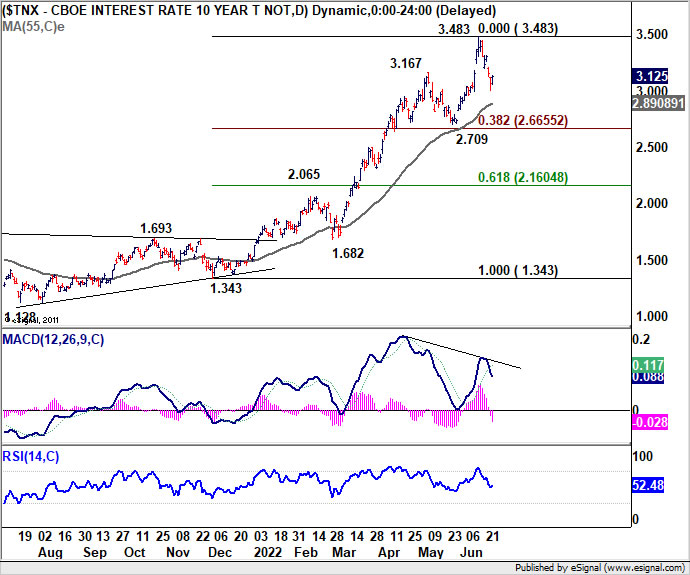
US 10-year yield gyrated further lower last week as pull back from 3.483 extended. Considering bearish divergence condition in daily MACD. 3.483 could be a medium term top, just ahead of 161.8% projection of 0.398 to 1.765 from 1.343 at 3.554. It's possibly already in correction to whole five-wave rally from 1.343 already.
Deeper fall is likely to 55 day EMA (now at 2.890) and possibly below. But there is little scope of breaking through 2.709 support, which is close to 38.2% retracement of 1.343 to 3.483 at 2.665.
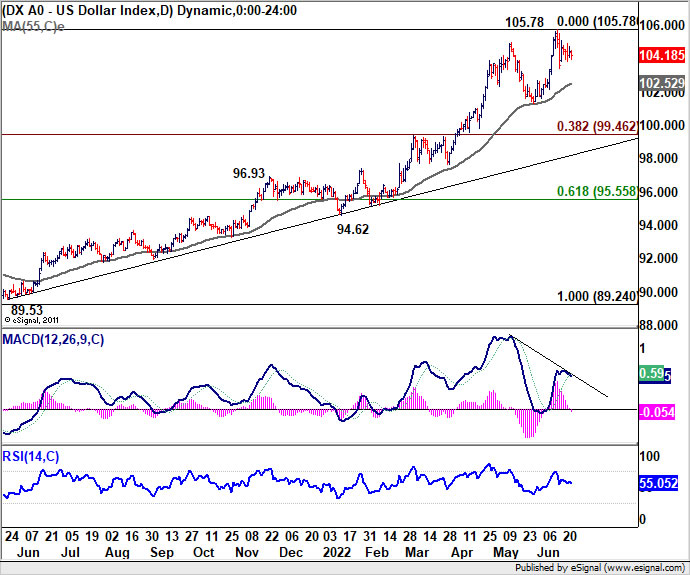
Risk growing for medium term correction in Dollar index
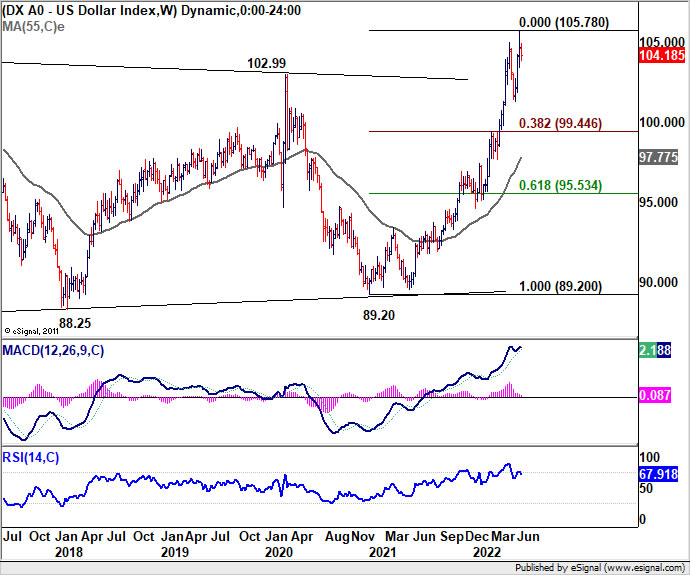
Dollar index staged in range trading below 105.78 last week. It's still too early to call for medium term topping 105.78. But risk is growing considering bearish divergence condition in daily MACD. Near term outlook will stay bullish as long as 55 day EMA (now at 102.52) holds. However, sustained break of 55 day EMA will argue that DXY is already correcting the whole rise from 89.52. Deeper fall could then be seen to 38.2% retracement of 89.52 to 105.78 at 99.46, or even further to 55 week EMA (now at 97.77).
If this bearish scenario really happens, it should be accompanied by stronger rebound in stocks and deeper pull back in yields.
AUD/USD Weekly Outlook
AUD/USD stayed in sideway trading last week. Initial bias remains neutral this week first. downside, firm break of 0.6828 support will resume larger fall from 0.8006. Next target is 0.6756/60 cluster support. On the upside, above 0.7068 minor resistance will bring stronger rebound to 0.7282 resistance first. Firm break there will be a sign of bullish reversal and bring stronger rebound to 0.7666 resistance.
In the bigger picture, price actions from 0.8006 are seen as a corrective pattern to rise from 0.5506 (2020 low). Deeper fall could still be seen to 50% retracement of 0.5506 to 0.8006 at 0.6756. This coincides with 100% projection of 0.8006 to 0.7105 from 0.7660 at 0.6760. Strong support is expected from 0.6756/60 cluster to contain downside to complete the correction. Meanwhile, firm break of 0.7660 resistance will confirm that such corrective pattern has completed, and larger up trend is ready to resume.
In the longer term picture, focus remains on 0.8135 structural resistance. Decisive break there will argue that rise from 0.5506 is developing into a long term up trend that reverses whole down trend from 1.1079 (2011 high). However, rejection by 0.8135 will keep long term outlook neutral at best.