Sample Category Title
Aussie Higher after Elections, Dollar Weakens Broadly
Overall market sentiment is mixed in Asian session today, with recover seen in Nikkei but selloff in Hong Kong and China. Aussie is extending near term rebound, following Labor's win in the federal elections over the weekend. Kiwi is also firmer ahead of RBNZ rate hike. On the other hand, Dollar and Canadian are the softer ones. European majors and Yen are mixed for now.
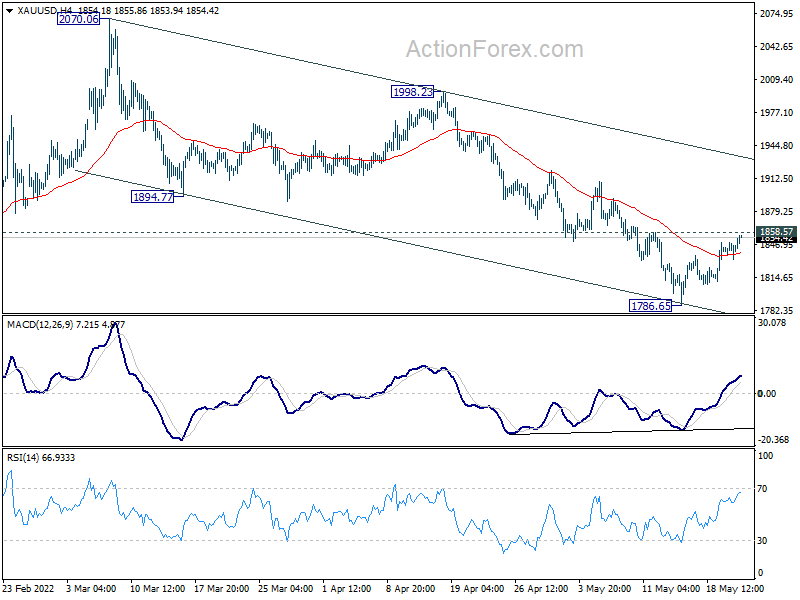
Technically, as Gold's recovery extends too, attention is on 1858.57 minor resistance. Firm break there will confirm short term bottoming at 1786.65. Stronger rebound would be seen back to channel resistance at around 19333. Such development could be accompanied by deeper pull back in Dollar, in particular against commodity currencies.
In Asia, at the time of writing, Nikkei is up 0.56%. Hong Kong HSI is down -1.95%. China Shanghai SSE is down -0.51%. Singapore Strait Times is down -0.47%. Japan 10-year JGB yield is down -0.0049 at 0.235.
ECB Lagarde: Rate hike could be a few weeks after stopping net asset purchases
ECB President Christine Lagarde told Dutch television over the weekend, "we are going to follow the path of stopping net asset purchase. Then, sometime after that -- which could be a few weeks -- hike interest rates." That's seen as an indication that a rate hike could happen in July, after stopping asset purchases in June.
Governing Council member Klass Knot floated the idea of a 50bps hike earlier. But Lagarde said, "it's not something that I can tell you at this point in time." She emphasized, "we need to make sure that this is going gradually enough so that we don't put the break on this car that is moving. We have to lift the accelerator for sure to slow inflation but we cannot be breaking any speed."
RBA Kent: Gradual QT also plays a role in stimulus removal
RBA Assistant Governor Christopher Kent said in a speech that while most observers focuses were on the central bank's 25bps rate hike this month, it also decided to proceed with "quantitative tightening".
"As the Bank now takes steps to remove the considerable monetary stimulus, increases in the cash rate are the tried and tested measure that will do most of the work...," he said. "the gradual process of QT will also play a role in this task, but a predictable and modest one."
"Because the Bank's bond portfolio will mature gradually, the Bank's balance sheet and commercial banks' ES balances will remain large for some years. This means that the cash rate will continue to trade slightly below the cash rate target, but above the rate paid on ES balances. Most importantly though, the Bank will continue to be able to maintain effective control over the cash rate as it withdraws monetary policy stimulus in the period ahead."
RBNZ rate hike and FOMC minutes
RBNZ is widely expected to continue with its tightening cycle this week, and raise OCR by another 50bps to 2.00%. There is no change in the view that OCR could peak at around 3.4%, as RBNZ projected. But it would now take shorter than earlier expected time to reach the peak of the cycle. RBNZ should reinforce this message to the markets.
From recent comments, Fed official displayed a consensus on the plan of 50bps hike per meeting, at least for the next few ones. FOMC minutes should reflect the discussions and affirm this message too. Meanwhile What next beyond, say July or August, as well as the end point for the year would remain data dependent.
On the data front, PMIs will be the major focuses this week. In addition, Germany Ifo and Gfk sentiment; US durable goods orders, personal income and spending; New Zealand and Australia retail sales, Canada retail sales will also be watched.
Here are some highlights for the week:
- Monday: Germany Ifo business climate.
- Tuesday: New Zealand retail sales; Australia PMIs; Japan PMI manufacturing; UK public sector net borrowing, PMIs; Eurozone PMIs; US PMIs, new home sales.
- Wednesday: RBNZ rate decision; Germany GDP final, Gfk consumer climate; Swiss Credit Suisse economic expectations; US durable goods orders, FOMC minutes.
- Thursday: Japan corporate services prices; Australia private capital expenditure; Canada retail sales; US GDP revision, jobless claims, pending home sales.
- Friday: Japan Tokyo CPI; Australia retail sales; Eurozone M3 money supply; US goods trade balance, personal income and spending and PCE inflation.
AUD/USD Daily Report
Daily Pivots: (S1) 0.7004; (P) 0.7039; (R1) 0.7075; More...
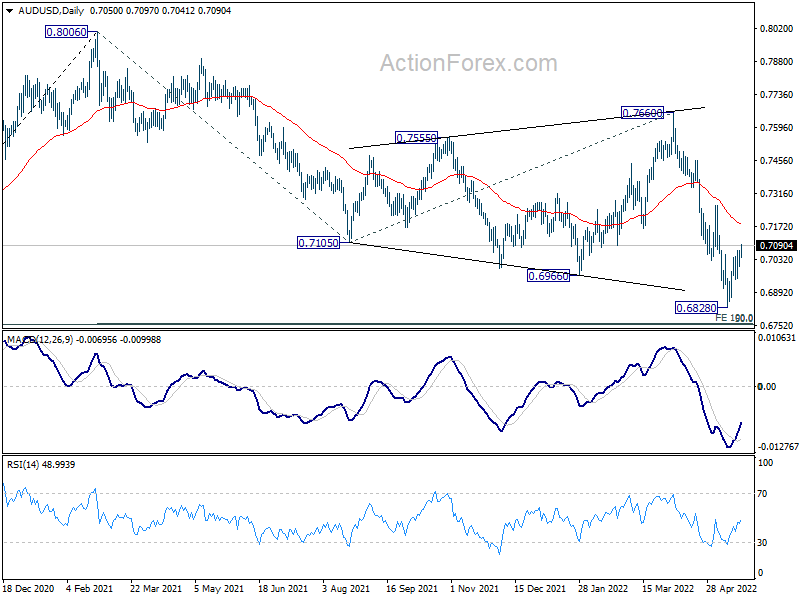
Intraday bias in AUD/USD remains on the upside at this point. Rebound from 0.6828 short term bottom is on track to 55 day EMA (now at 0.7183). Break there will target 0.7265 resistance next. On the downside, though, break of 0.6948 will resume larger fall from 0.8006 through 0.6828 low, and target 0.6756/60 medium term fibonacci level next.
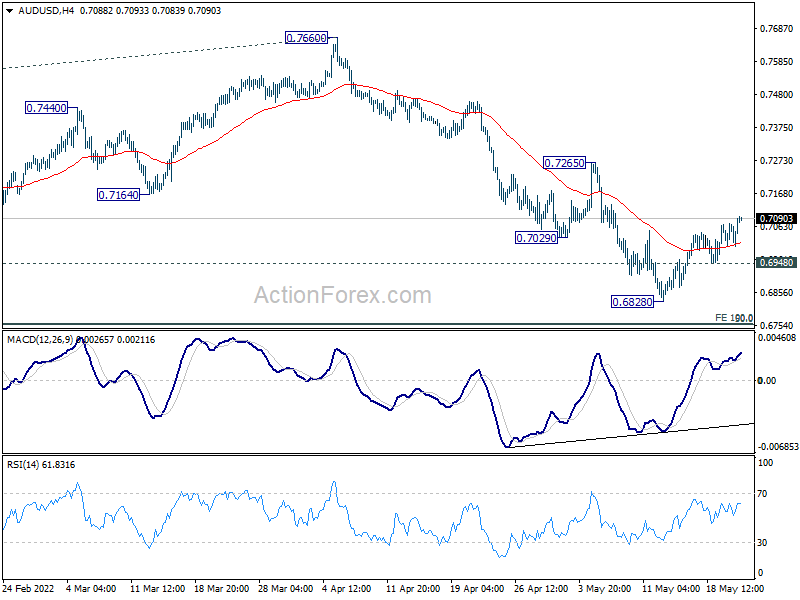
In the bigger picture, price actions from 0.8006 are seen as a corrective pattern to rise from 0.5506 (2020 low). Deeper fall could be seen to 50% retracement of 0.5506 to 0.8006 at 0.6756. This coincides with 100% projection of 0.8006 to 0.7105 from 0.7660 at 0.6760. Strong support is expected from 0.6756/60 cluster to contain downside to complete the correction. However, sustained break of 0.6756/60 would argue that AUD/USD is indeed already in a medium term down trend.
Economic Indicators Update
| GMT | Ccy | Events | Actual | Forecast | Previous | Revised |
|---|---|---|---|---|---|---|
| 23:01 | GBP | Rightmove House Price Index M/M May | 2.10% | 1.60% | ||
| 08:00 | EUR | Germany IFO Business Climate May | 91.4 | 91.8 | ||
| 08:00 | EUR | Germany IFO Current Assessment May | 97.2 | 97.2 | ||
| 08:00 | EUR | Germany IFO Expectations May | 85.8 | 86.7 |
RBA Kent: Gradual QT also plays a role in stimulus removal
RBA Assistant Governor Christopher Kent said in a speech that while most observers focuses were on the central bank's 25bps rate hike this month, it also decided to proceed with "quantitative tightening".
"As the Bank now takes steps to remove the considerable monetary stimulus, increases in the cash rate are the tried and tested measure that will do most of the work...," he said. "the gradual process of QT will also play a role in this task, but a predictable and modest one."
"Because the Bank's bond portfolio will mature gradually, the Bank's balance sheet and commercial banks' ES balances will remain large for some years. This means that the cash rate will continue to trade slightly below the cash rate target, but above the rate paid on ES balances. Most importantly though, the Bank will continue to be able to maintain effective control over the cash rate as it withdraws monetary policy stimulus in the period ahead.".
ECB Lagarde: Rate hike could be a few weeks after stopping net asset purchases
ECB President Christine Lagarde told Dutch television over the weekend, "we are going to follow the path of stopping net asset purchase. Then, sometime after that -- which could be a few weeks -- hike interest rates." That's seen as an indication that a rate hike could happen in July, after stopping asset purchases in June.
Governing Council member Klass Knot floated the idea of a 50bps hike earlier. But Lagarde said, "it's not something that I can tell you at this point in time." She emphasized, "we need to make sure that this is going gradually enough so that we don't put the break on this car that is moving. We have to lift the accelerator for sure to slow inflation but we cannot be breaking any speed."
Technical Outlook and Review
DXY:
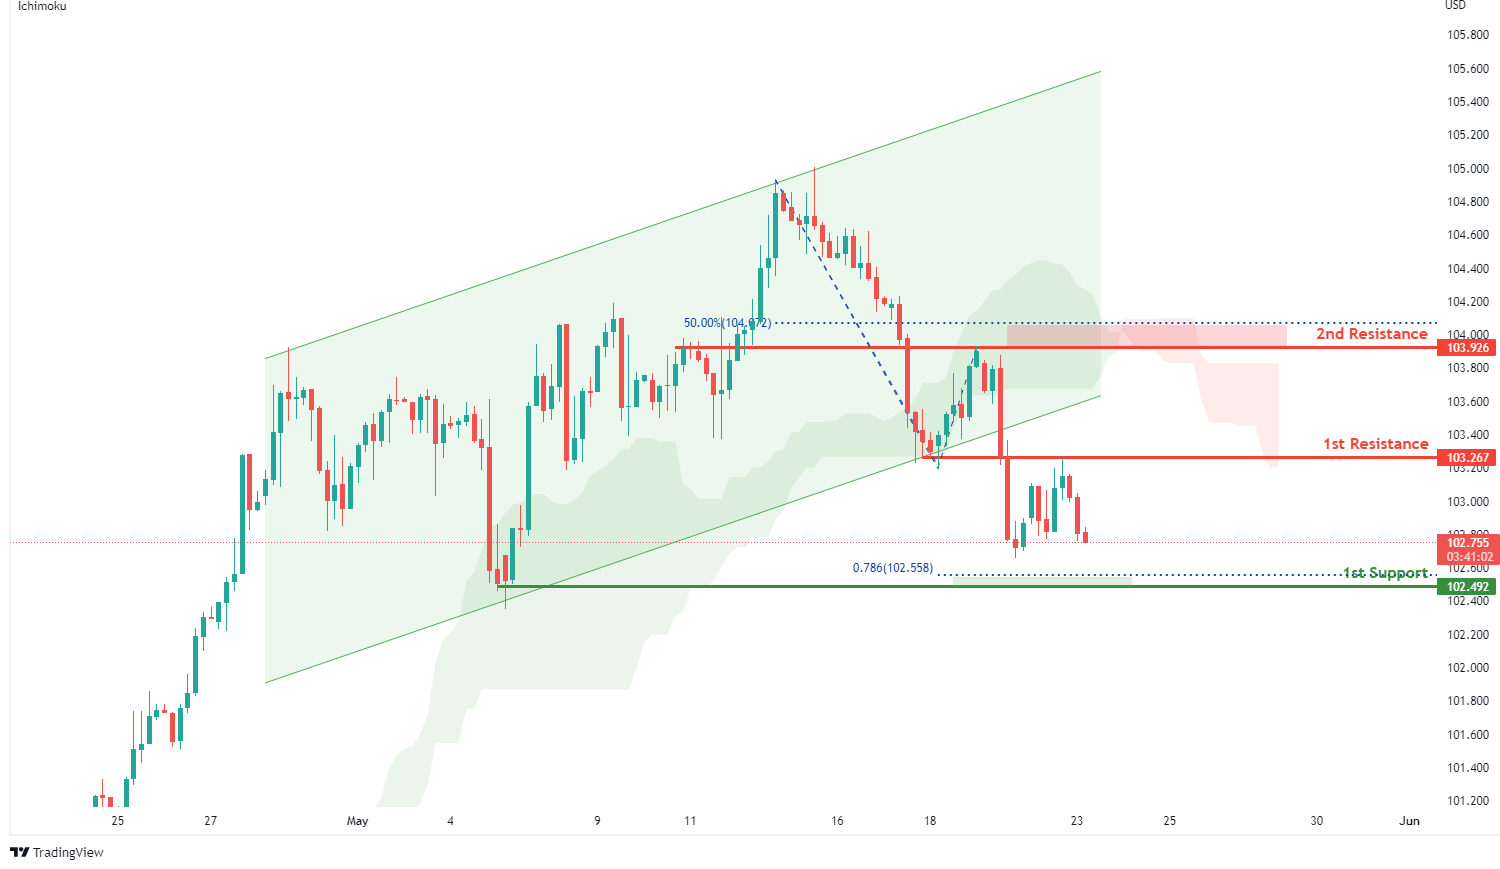
On the H4, with prices below the ichimoku indicator and prices breakout of the ascending channel, we have a bearish bias that price will drop to our 1st support at 102.492 where the horizontal swing low support and 78.6% Fibonacci projection are from our 1st resistance at 103.267 in line with the horizontal pullback resistance. Alternatively, price may break 1st resistance structure and head for 2nd resistance at 103.926 where the horizontal swing high resistance and 50% Fibonacci retracement are.
Areas of consideration:
- H4 time frame, 1st resistance at 103.267
- H4 time frame, 1st support at 102.492
XAU/USD (GOLD):
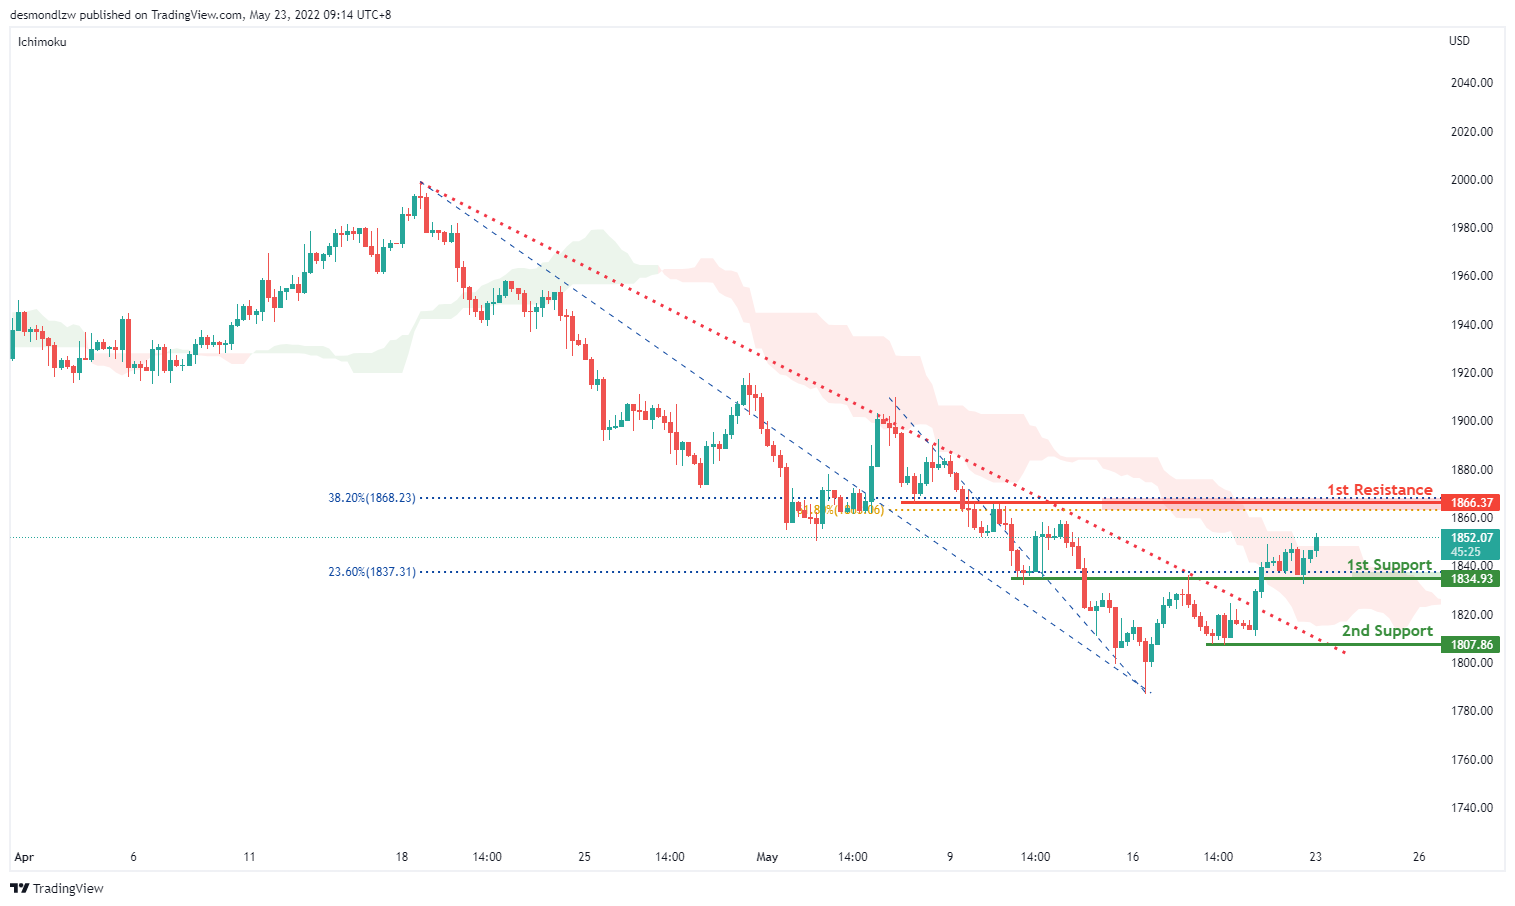
On the H4, with prices moving above the ichimoku cloud and prices breaking out of the descending trendline,we have a bullish bias that price will rise from our 1st support at 1834.93 where the horizontal overlap support and 23.6% fibonacci retracement is to our 1st resistance at 1866.37 in line with the horizontal overlap resistance, 38.2% Fibonacci retracement and 61.8% Fibonacci retracement. Alternatively, price may break 1st support structure and head for 2nd support at 1807.86 where the horizontal swing low support is.
Areas of consideration:
- H4 time frame, 1st Resistance at 1866.37
- H4 time frame, 1st Support at 1834.93
GBP/USD:
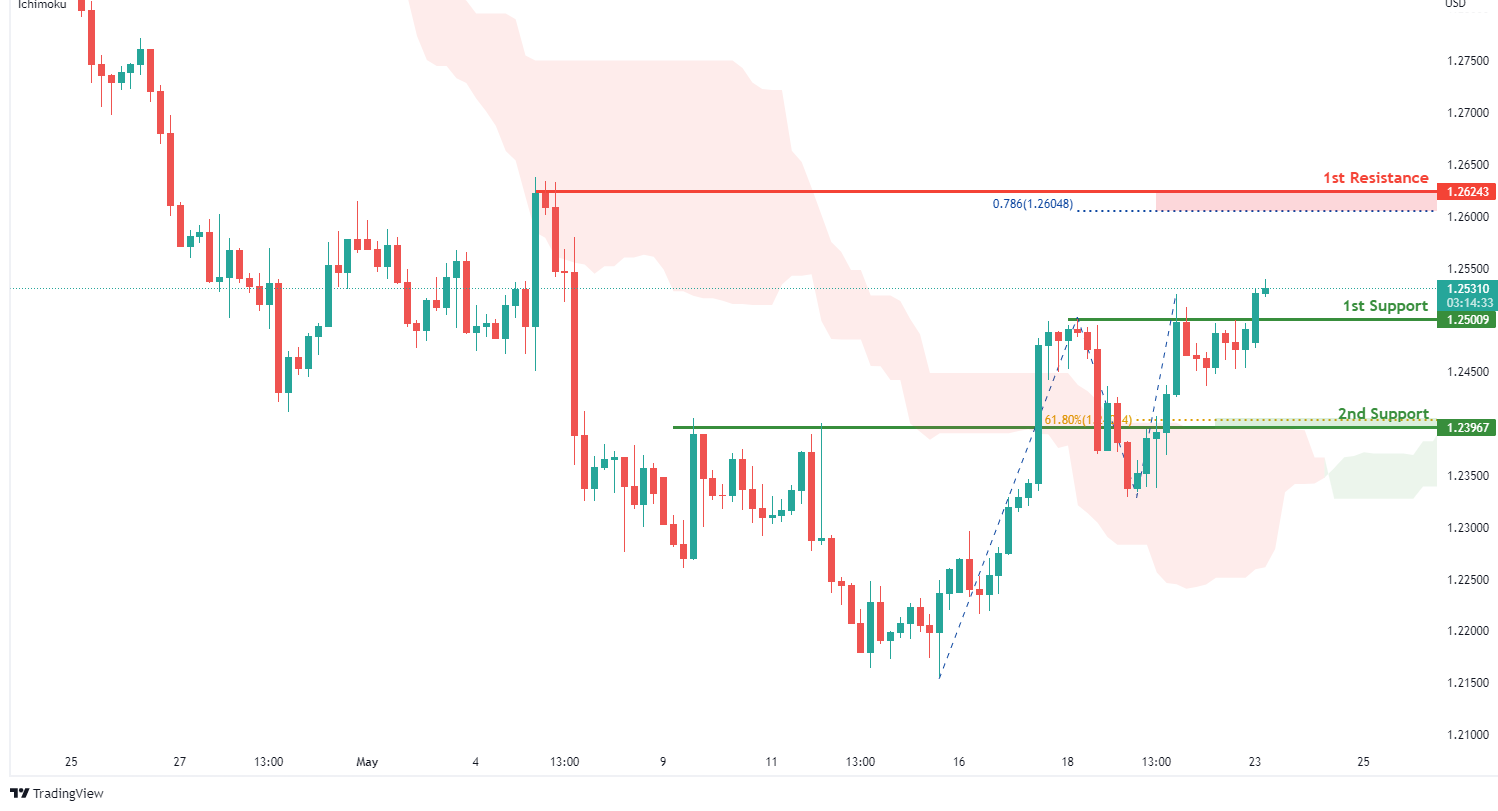
On the H4, with price moving above the ichimoku indicator, we have a bullish bias that price will rise from our 1st support at 1.25009 where the horizontal overlap support is to our 1st resistance at 1.26243 in line with the 78.6% Fibonacci projection and horizontal swing high resistance. Alternatively, price may break 1st support structure and head for 2nd support at 1.23967 where the horizontal overlap support and 61.8% Fibonacci retracement are.
Areas of consideration:
- H4 1st resistance at 1.26243
- H4 1st support at 1.25009
USD/CHF:
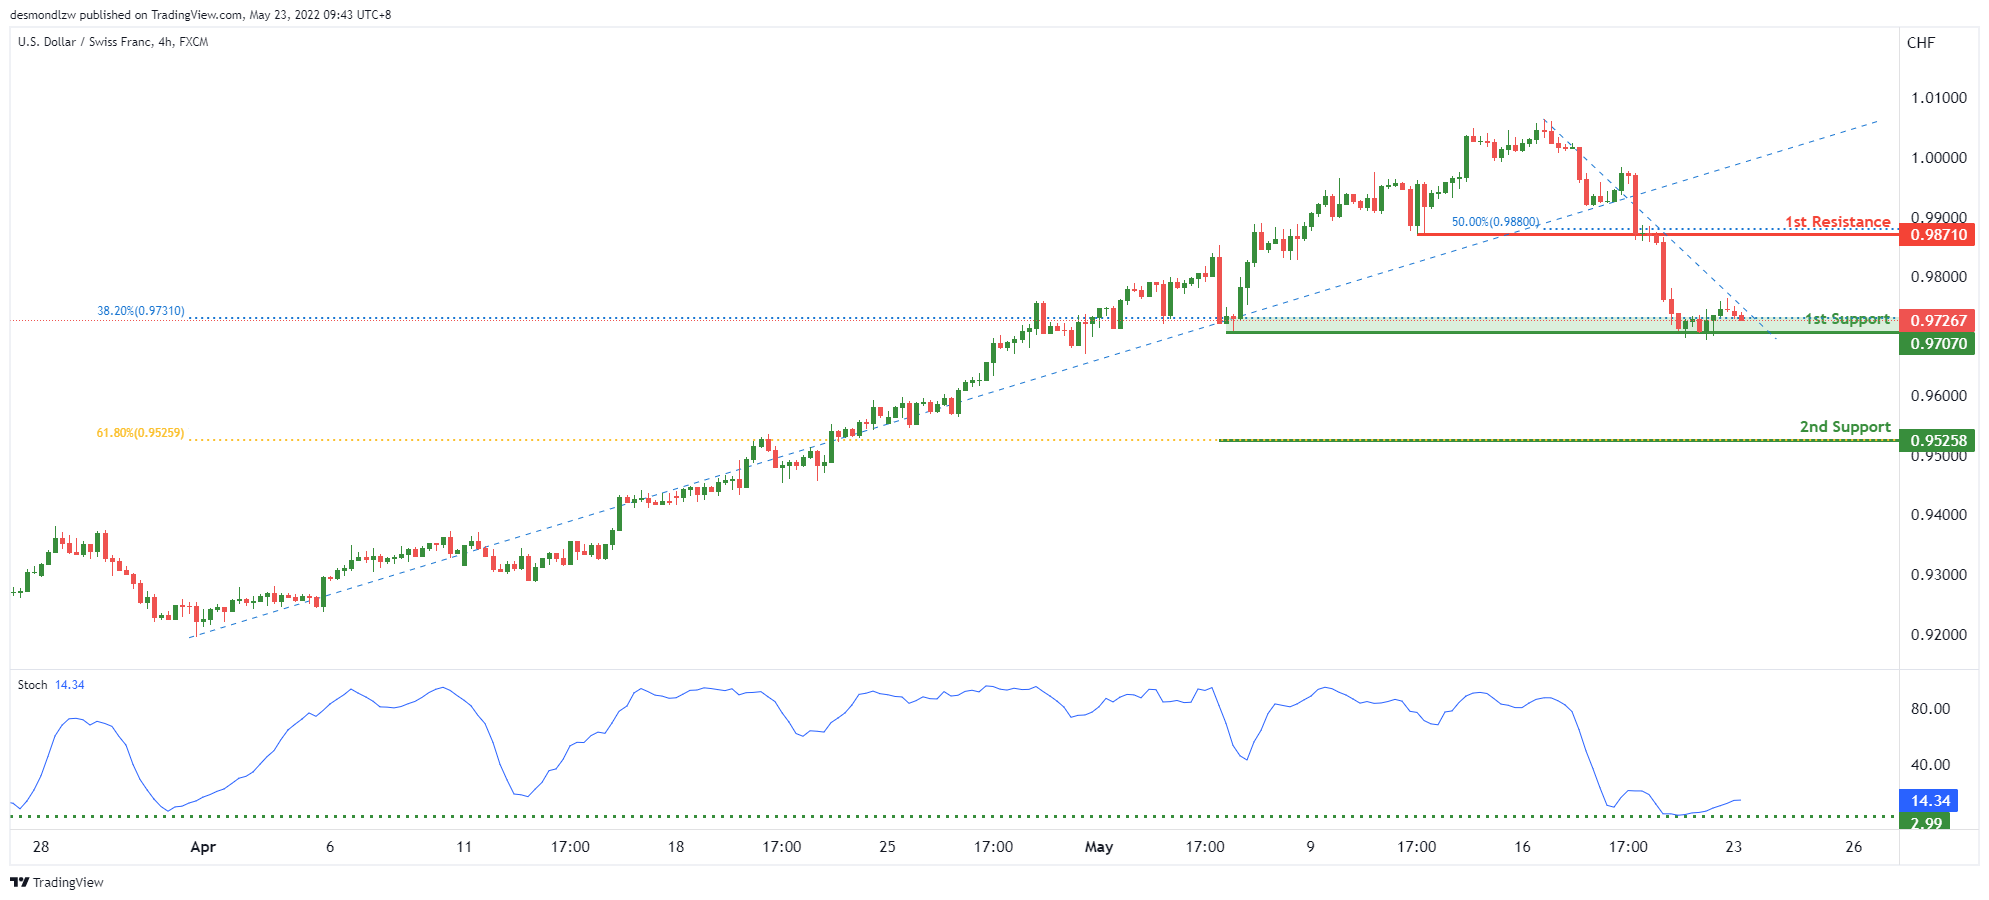
On the H4, with price moving above the ichimoku cloud, we have a bullish bias that price will rise to our 1st resistance at 0.98710 where the 50% Fibonacci retracement is from our 1st support at 0.97070 in line with the swing low support. Alternatively, price may break 1st resistance structure and head for 2nd resistance where the 61.8% Fibonacci retracement.
Areas of consideration
- 1st support level at 0.97070
- 1st resistance level at 0.98710
EUR/USD :
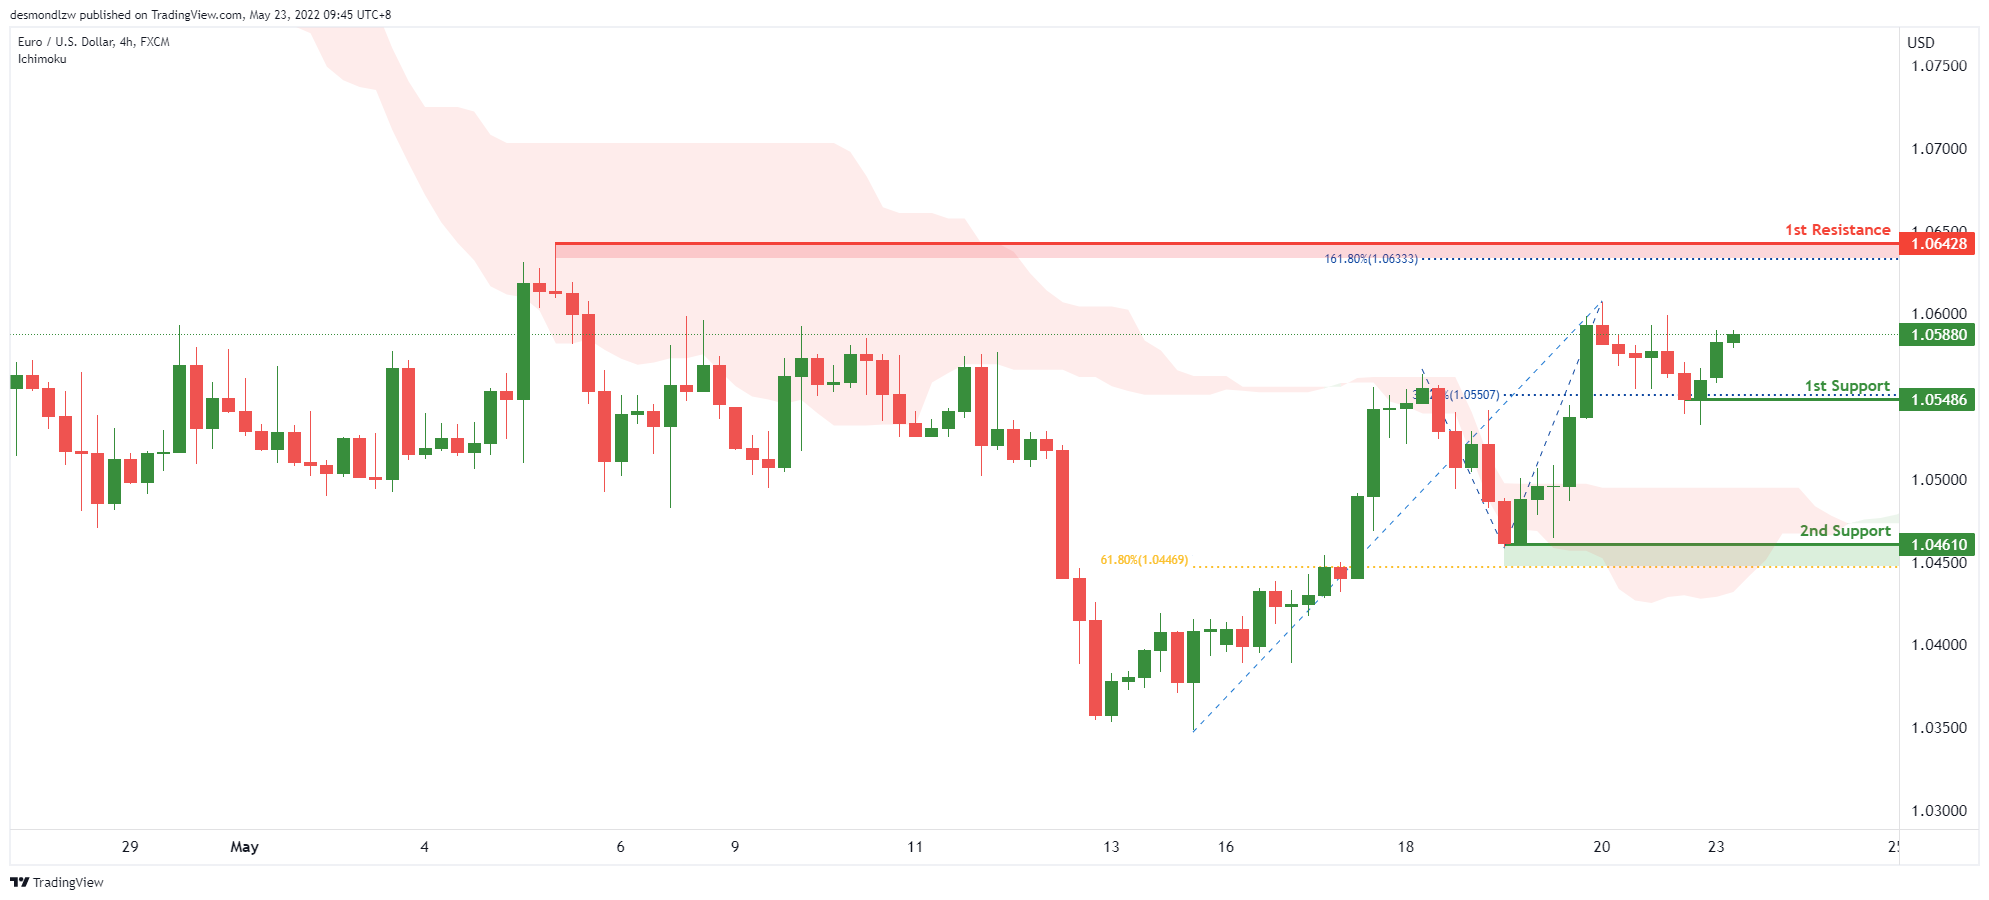
On the H4, with price moving above the ichimoku cloud, we have a bullish bias that price will rise to our 1st resistance at 1.06428 where the 161.8% Fibonacci extension is from our 1st support at 1.05486 in line with the pullback support. Alternatively, price may break 1st resistance structure and head for 2nd support where the 61.8% Fibonacci retracement.
Areas of consideration :
- H4 1st resistance at 1.06428
- H4 1st support at 1.05486
USD/JPY:
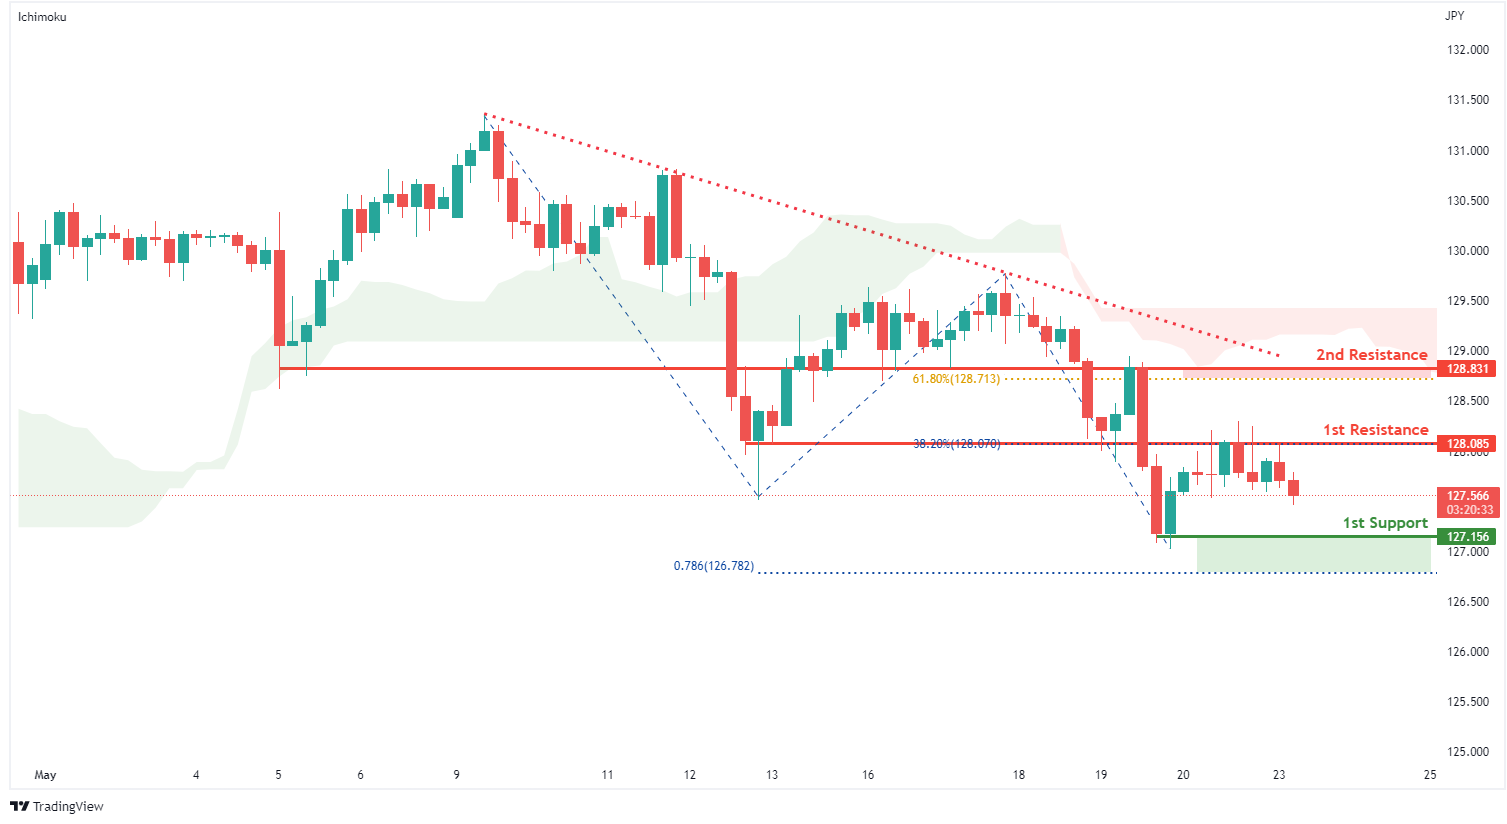
On the H4, with prices moving below the ichimoku indicator, we have a bearish bias that price will drop from our 1st resistance at 128.085 where the 38.2% Fibonacci retracement and horizontal overlap resistance is to our 1st support at 127.156 in line with the 78.6% Fibonacci projection and horizontal swing low support. Alternatively, price may break 1st resistance structure and head for 2nd resistance at 128.831 where the horizontal overlap resistance and 61.8% Fibonacci retracement is.
Areas of consideration:
- H4 time frame, 1st resistance at 128.085
- H4 time frame, 1st support at 127.156
AUD/USD:
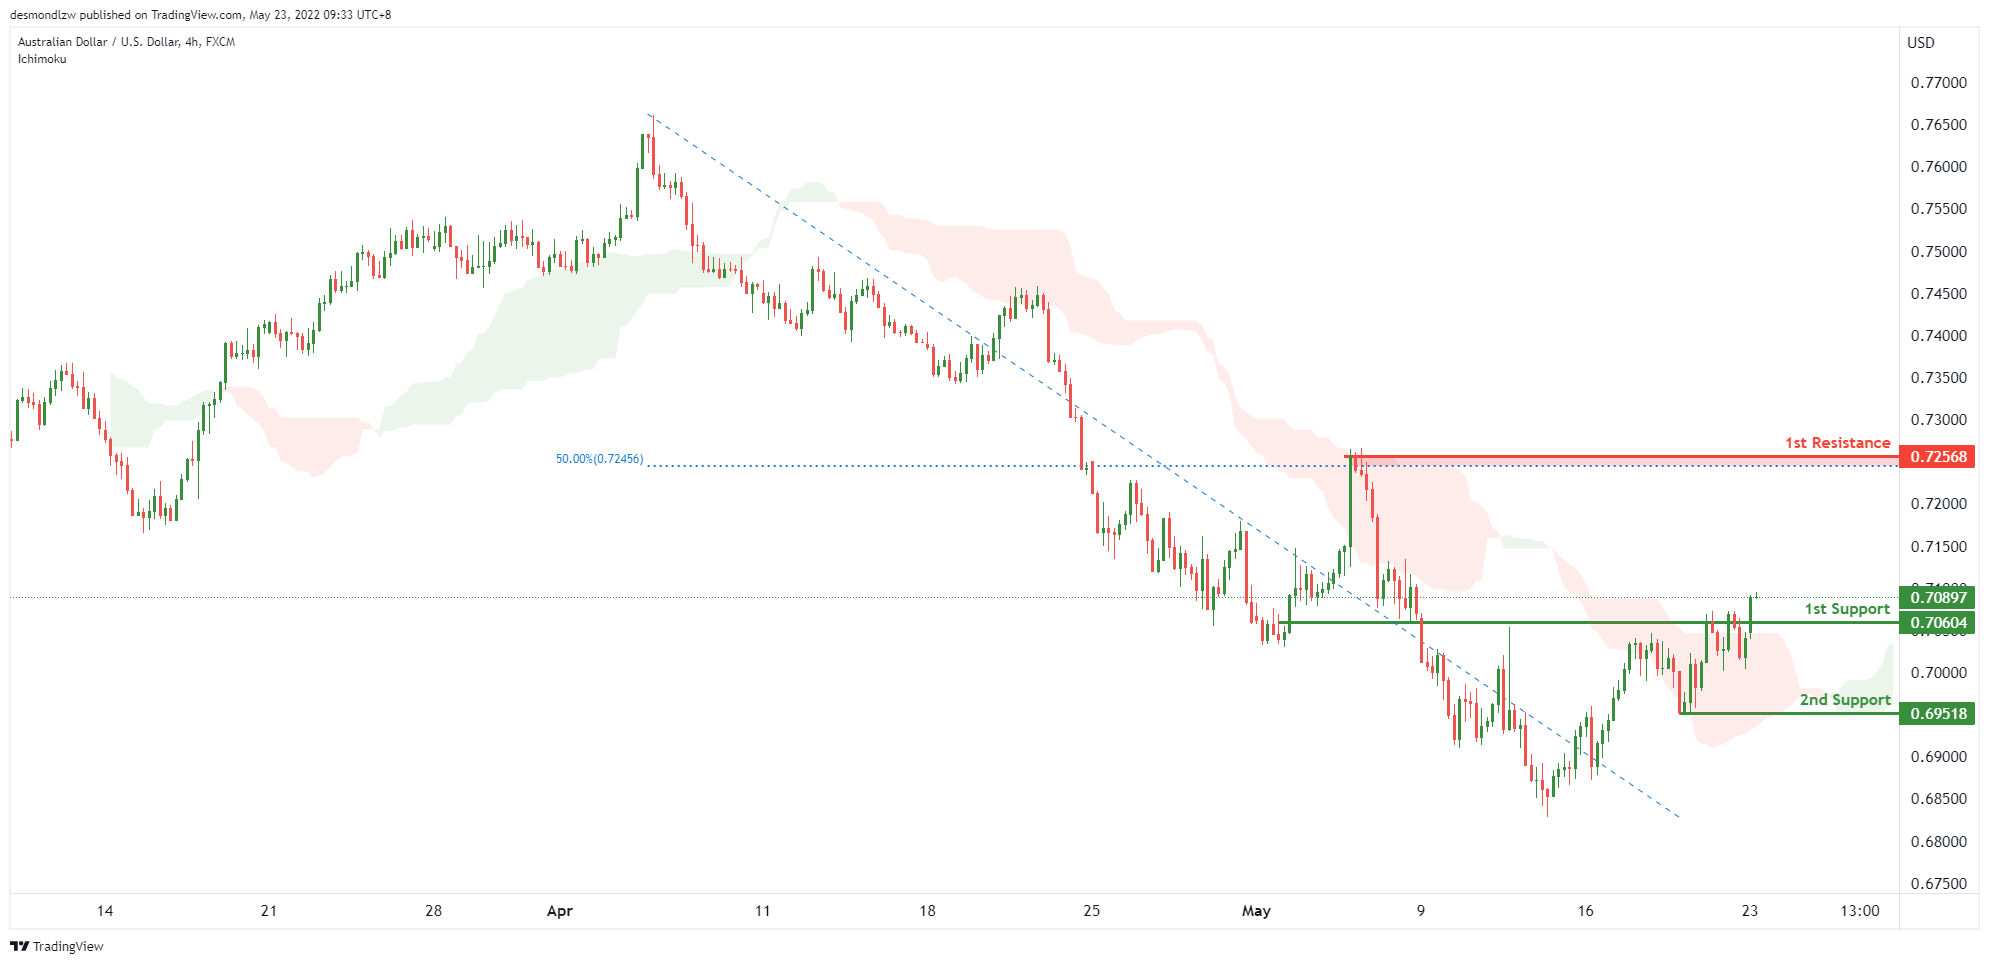
On the H4, with price moving above the ichimoku cloud, we have a bullish bias that price will rise to our 1st resistance at 0.72568 where the 50% Fibonacci retracement is from our 1st support at 0.70604 in line with the pullback support. Alternatively, price may break structure and head for 2nd support where the swing low support is.
Areas of consideration
- H4 1st resistance at 0.72568
- H4 1st support at 0.70604
NZD/USD:
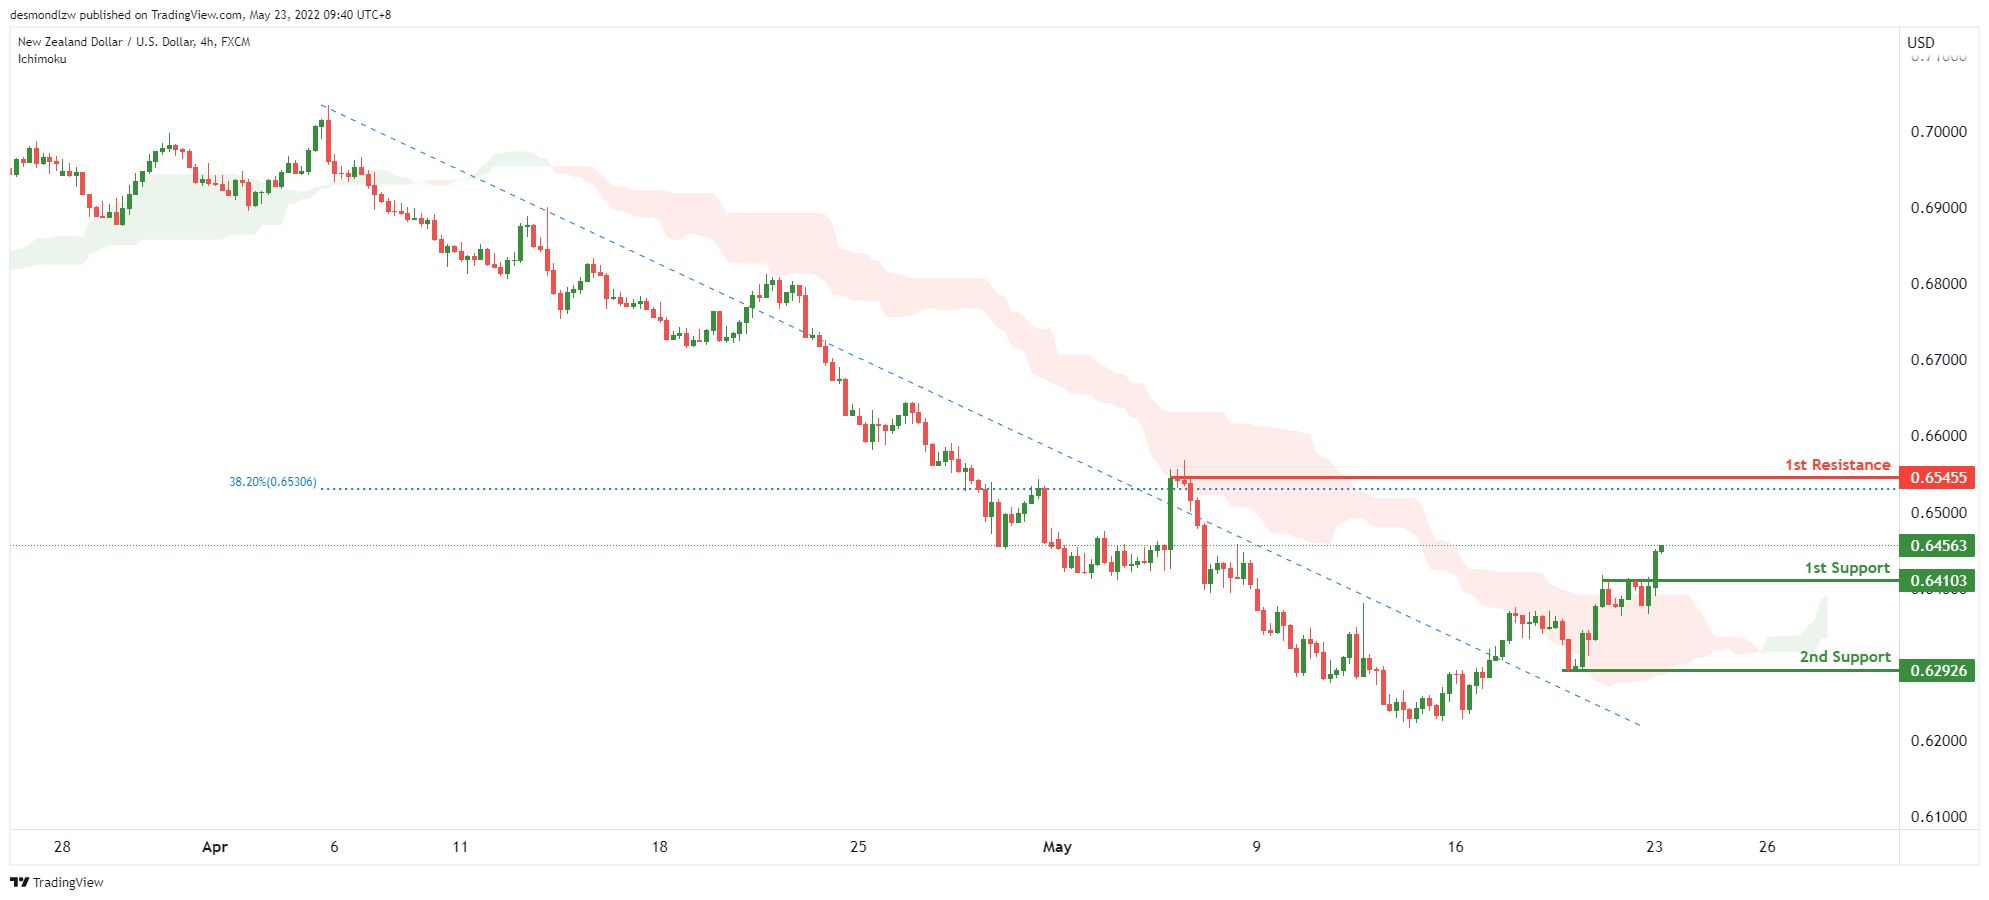
On the H4, with price moving above the ichimoku cloud, we have a bullish bias that price will rise to our 1st resistance at 0.65455 where the 38.2% Fibonacci retracement is from our 1st support at 0.64103 in line with the pullback support. Alternatively, price may break structure and head for 2nd support where the swing low support is.
Areas of consideration:
- H4 time frame, 1st support at 0.62288
- H4 time frame, 1st resistance at 0.63669
USD/CAD:
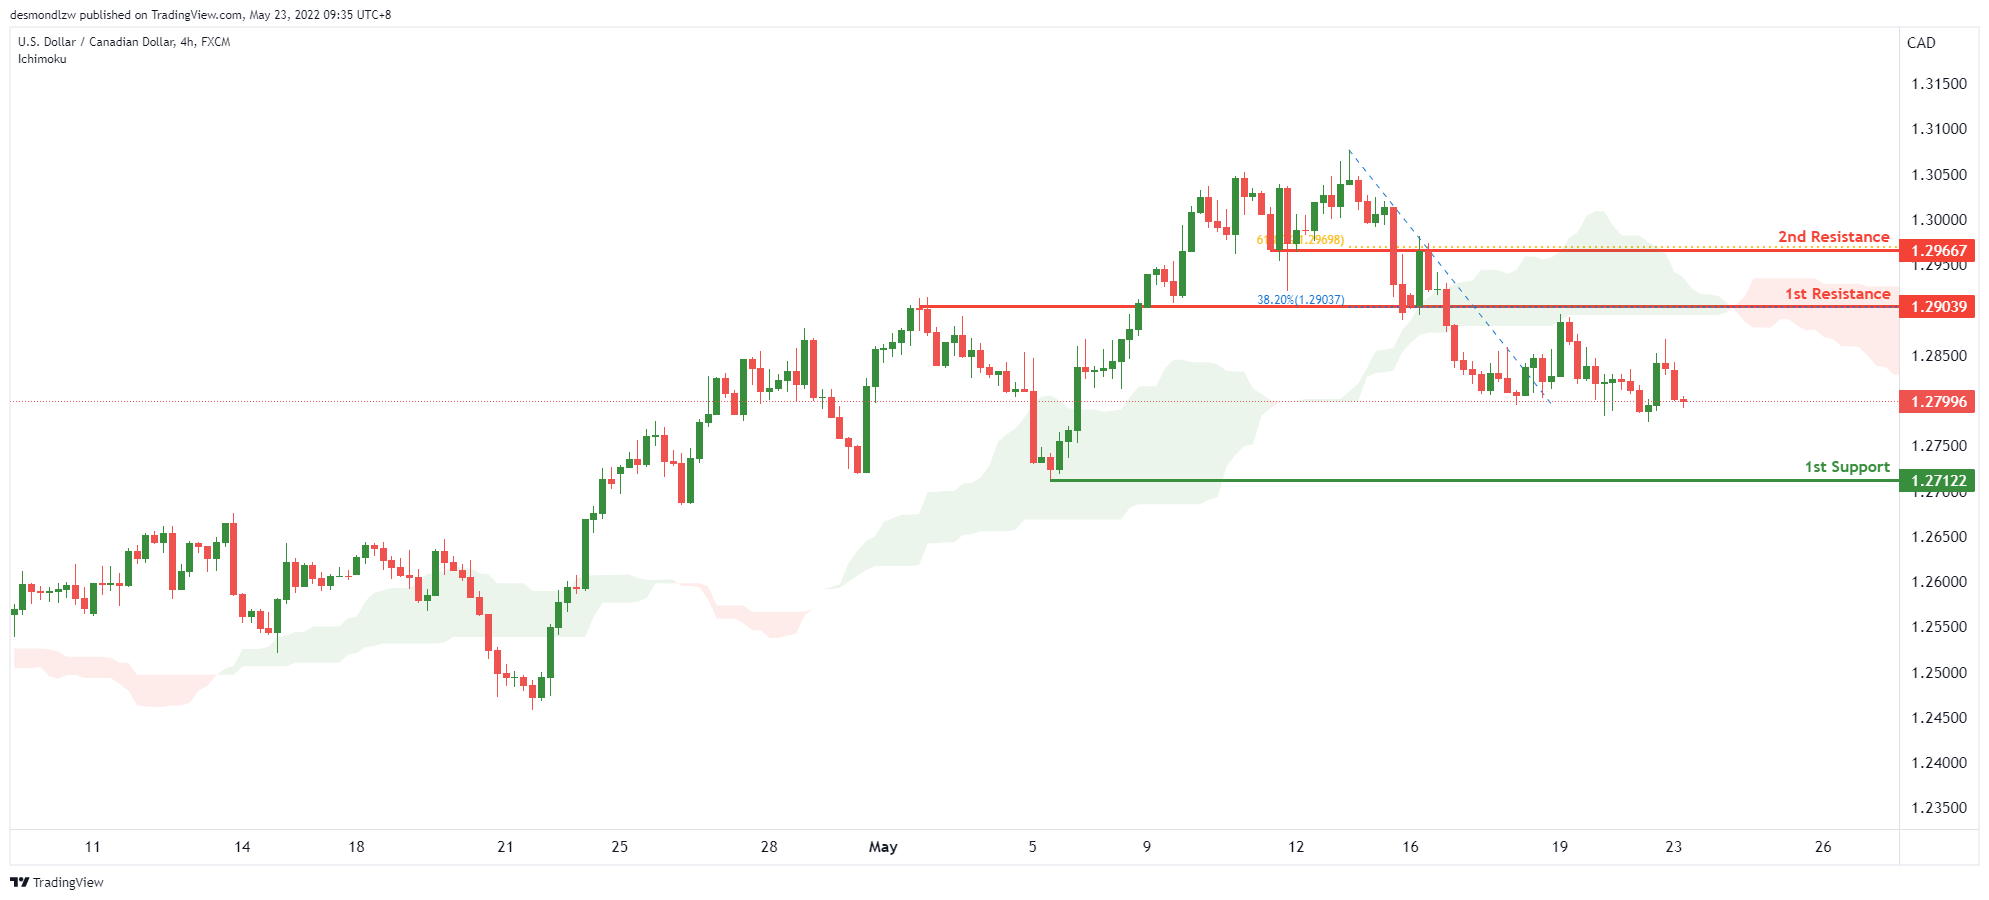
On the H4, with price moving below the ichimoku, we have a bearish bias that price will drop from our 1st resistance at 1.29039 where the horizontal pullback resistance is to our 1st support at 1.27122 in line with the swing low support. Alternatively, price may break 1st resistance structure and head for 2nd resistance where the horizontal swing high resistance is.
Areas of consideration:
- H4 time frame, 1st resistance at 1.29039
- H4 time frame, 1st support at 1.27122
OIL:
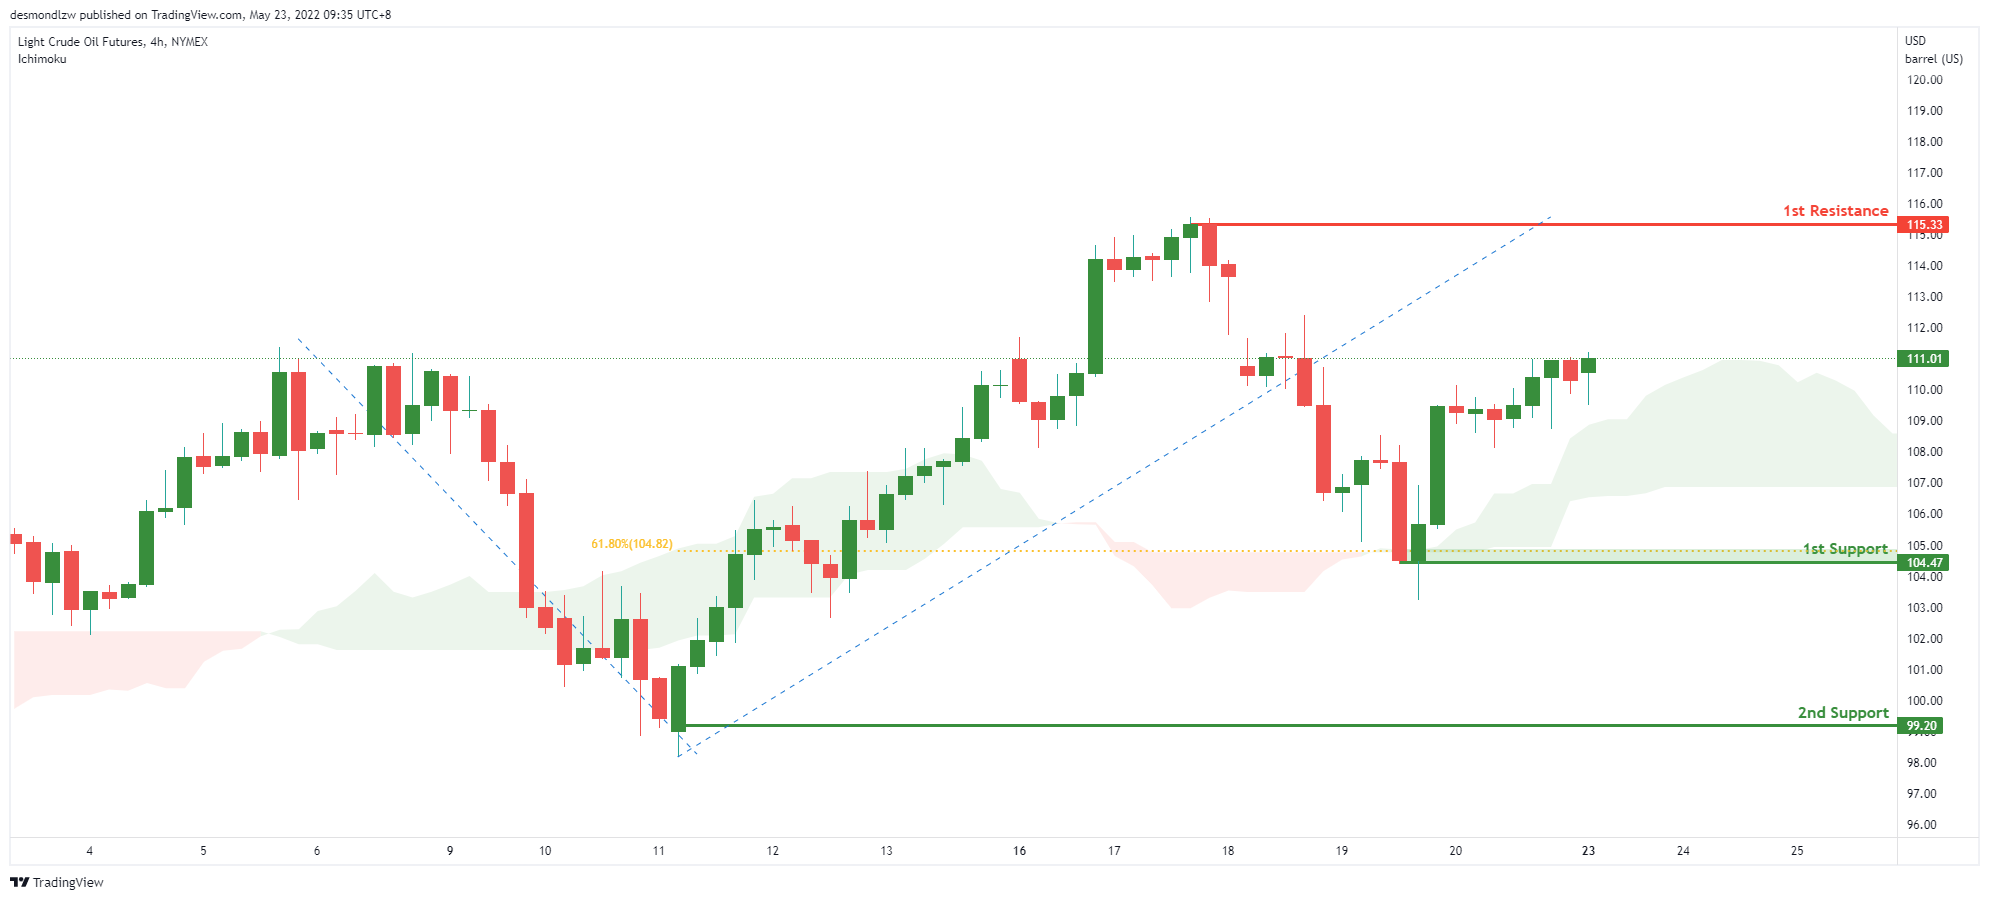
On the H4, with price expected to bounce off the ichimoku cloud, we have a bullish bias that price will rise to our 1st resistance at 111.36 where the 23.6% Fibonacci retracement from our 1st support at 106.74 in line with the horizontal overlap support and 50% fibonacci retracement. Alternatively, price may break 1st support structure and head for 2nd support where the horizontal pullback resistance is.
Areas of consideration:
- H4 time frame, 1st resistance of 111.36
- H4 time frame, 1st support of 106.74
Dow Jones Industrial Average:
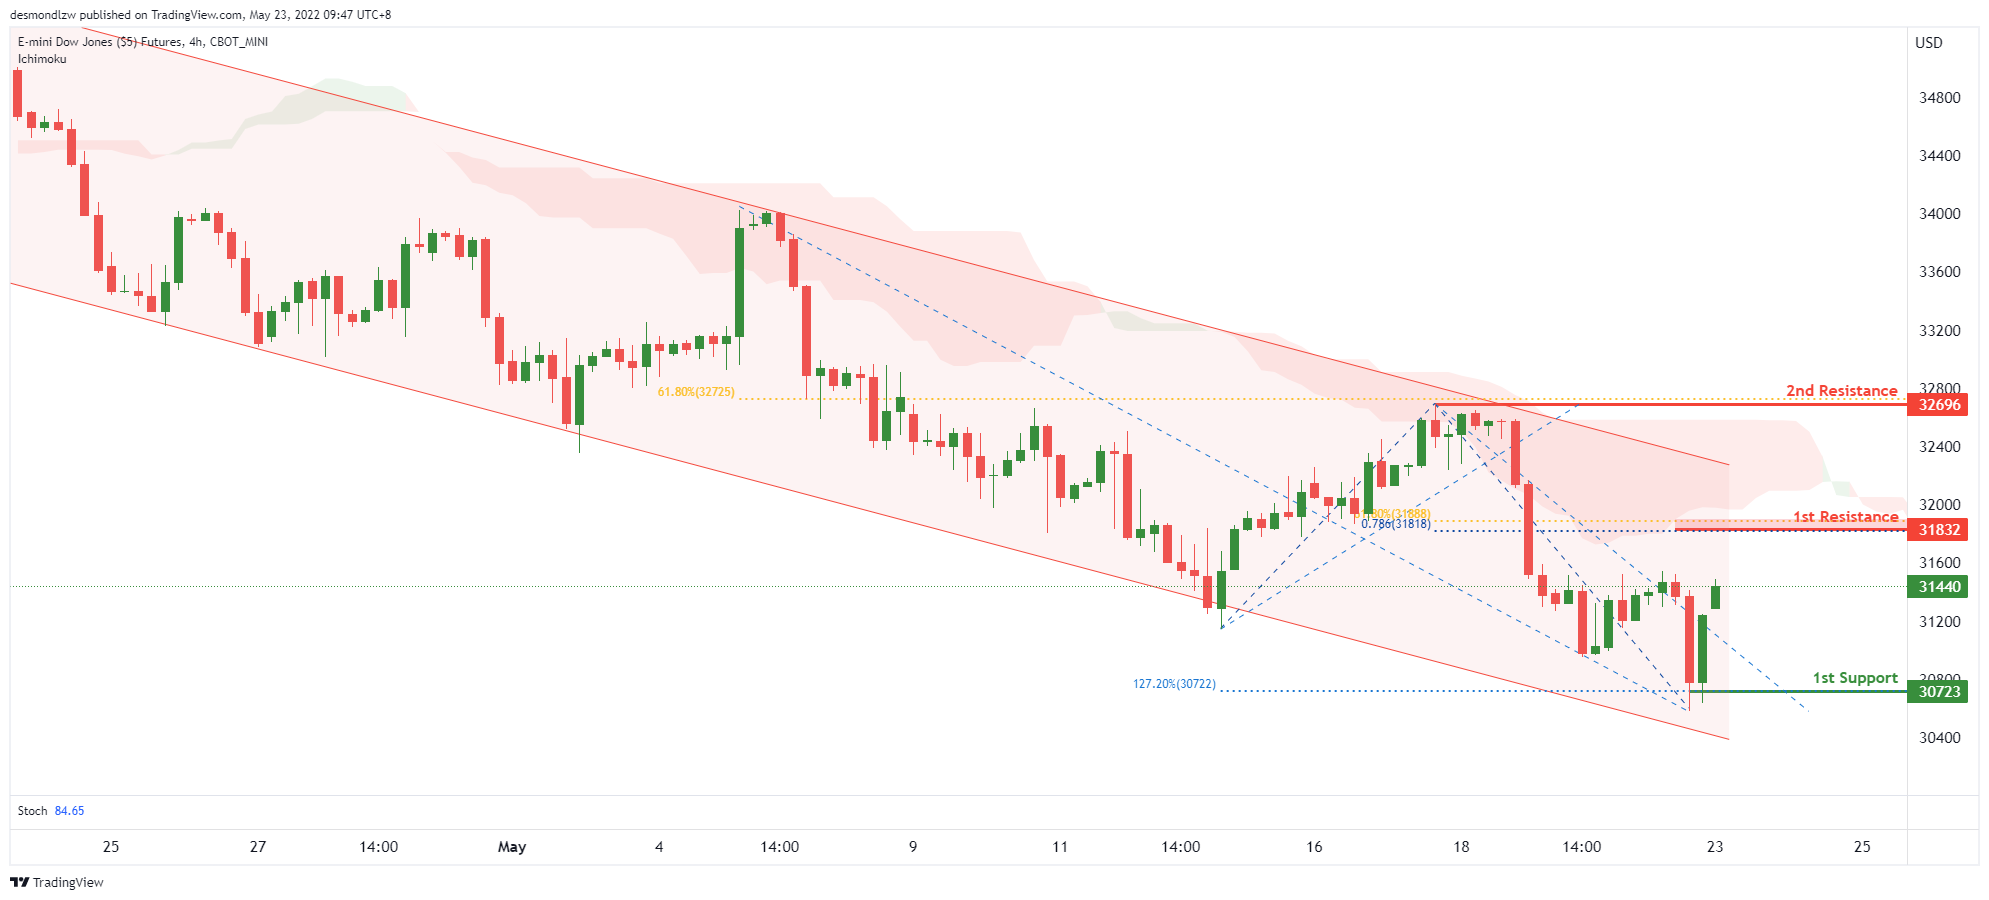
On the H4, with price expected to bounce off the stochastics indicator, we have a bullish bias that price will rise to our 1st resistance at 31835 where the 23.6% Fibonacci retracement from our 1st support at 31167 in line with the horizontal overlap support and 50% fibonacci retracement. Alternatively, price may break 1st support structure and head for 2nd support where the horizontal pullback resistance is.
Areas of consideration :
- H4 time frame, 1st resistance at 31835
- H4 time frame, 1st support at 31167
RBNZ Ready Reckoner, May 2022
The Ready Reckoner assesses how recent data will affect the RBNZ's OCR projections.
RBNZ Ready Reckoner, May 2022
The February Monetary Policy Statement projected the OCR to reach a peak of 3.35% by the end of 2024. At the April policy review, the RBNZ indicated that it was comfortable with that peak rate but would look to get there faster. The implication is that its forecasts would have had a higher OCR peak than in February if there was no change in the pace of rate hikes.
The Ready Reckoner is intended to be a pure read on the balance of recent data, before any judgements are applied. As such, it’s even more important than usual to emphasise that this is not a prediction of the RBNZ’s actions. The RBNZ has already signalled that any change in outlook is likely to be expressed via the slope of the OCR track rather than the end point.
There’s been plenty of local economic data since the April review, but it’s mostly been along the lines of confirming what was already suspected about inflationary pressures, rather than providing any new shocks. Meanwhile, global economic conditions look tougher and commodity prices have given back some of their gains. Overall, we think this will leave the RBNZ in a similar position to where it was in April, with a need for somewhat tighter monetary policy over the next few years.
___________________________________________________
February MPS implied OCR forecast (Q1 2024): 3.3%
Net impact of shocks since February: +20bp
___________________________________________________
Near-term inflation: +25bp
The CPI rose 1.8% in the March quarter, above the RBNZ’s forecast of 1.4%. The surprise was entirely on the tradables side, including the jump in oil prices that followed the Russian invasion of Ukraine. The RBNZ’s forecast for the June quarter is likely to be close to its February MPS forecast of 1.1%, but would have been much higher if not for the cuts to fuel excise and road user charges. Arguably these are a look-through for monetary policy given their temporary nature, but to the extent that they affect the reported inflation rate, they will also have an impact on people’s expectations of future inflation.
Inflation expectations: +20bp
The survey of expectations for inflation two years ahead was little changed at 3.3%. With the survey coming hot on the heels of the strong Q1 inflation result, there was a risk that expectations might have pushed higher. Even so, they remain outside the RBNZ’s target range over the crucial medium-term horizon. In addition, surveys of longer-term expectations have also risen further above the 2% midpoint of the target, although breakeven rates on inflation-linked bonds are similar to where they were in February.
Border reopening: +10bp
The timing of the border reopening to tourists has been brought forward since February. The RBNZ previously assumed a slow recovery in tourism towards the end of this year.
Near-term GDP: -5bp
December quarter GDP was ahead of the RBNZ’s forecast (3.0% vs 2.3%). Some of the surprise will have been around higher potential output (Covid measures were less restrictive than expected) rather than stronger demand. March quarter GDP is shaping up to be weaker than the RBNZ’s February forecast of 1.6%, not just because there’s less remaining scope for a post-Delta rebound, but because the Omicron wave led to a weak patch in activity.
House prices: -20bp
House prices fell for the fifth month in a row in May, and are down about 5% from their peaks. While the RBNZ was already expecting house prices to fall as interest rates rose, the decline has been a bit faster than assumed.
World economy: -10bp
Forecasts of world growth have been revised down, reflecting the ongoing effects of the Russia-Ukraine conflict, China’s Covid lockdowns, and concerns about the effects that a worldwide monetary tightening could have on economic activity.
Terms of trade: 0bp
Export prices have unwound the gains made between the February and April reviews.
Exchange rate: 0bp
Similarly, the trade-weighted index has fallen back to around where it was in February.
Labour market: 0bp
The March quarter unemployment rate of 3.2% was in line with the RBNZ’s forecast. Wage growth was only marginally higher than expected.
___________________________________________________
Total change: +20bp
___________________________________________________
Eco Data 5/23/22
[php_everywhere instance="1"]
Forex and Cryptocurrencies Forecast
EUR/USD: Growth of the Pair as a Result of DXY Correction
The DXY dollar index hit a multi-year high of 105.05 on Friday, May 13 after a six-week rise. The last time it climbed this high was 20 years ago. However, a reversal followed, and the DXY was below the 103.00 horizon on May 19-20. According to a number of analysts, such a drop is more likely the result of a technical correction, and not a consequence of changes in fundamental factors. The latter still remain on the side of the American currency. However, there are already some alarming signals here, as the sharp tightening of the Fed's monetary policy increases concerns about the growth of the US economy and increases the likelihood of a recession.
But, once again, the fundamental factors are still on the side of the dollar. Thus, data on retail sales in the US released on May 17 showed an increase in consumer activity in April by 0.9%, which is higher than the forecast of 0.7%. Industrial production exceeded the forecast as well: it grew by 1.1% instead of the expected 0.5%.
Last week, the head of the Federal Reserve Jerome Powell once again confirmed his intention to raise the key rate by 0.5% at the FOMC (Federal Open Market Committee) meetings in June and July. Recall that the US regulator has already raised the rate twice this year. This, of course, led to an increase in costs for various types of loans not only for industry, but also for the population, including mortgage lending, consumer loans, interest on credit cards etc.
However, on Tuesday May 17, Jerome Powell stated unequivocally that the Fed would continue to tighten and back off from aggressive rate hikes only when it received "clear and compelling evidence" of a slowdown in inflation. And if the rate of inflation decline does not suit the Central Bank, it may not limit itself to a rate of 3.0%, but increase it to 4.0% within 12-15 months. That will give the dollar additional advantages over other currencies in the DXY basket, including the euro.
Unlike the US economy, investors are much more concerned about the prospects for the European economy. This concern is primarily due to the strong dependence of the European Union on Russian energy resources. On Monday, May 16, EU countries started negotiations on the sixth package of sanctions against Russia due to its invasion of Ukraine. It is known that we are talking, among other things, about the introduction of an embargo on the purchase of Russian oil and gas. It is not yet clear whether such an embargo will be total or partial, when it will be introduced and what exceptions there will be, but it is already clear that it will create serious problems not only for the Russian, but also for the European economy. And this cannot but cause concern for investors.
US Treasury Secretary Janet Yellen added additional uncertainty to this complex situation. She stated that the G7 countries are discussing the idea of establishing the maximum possible duties on energy from Russia. On the one hand, it makes no sense to impose an embargo on their supplies in this case. But on the other hand, this will hit hard on the pockets of European consumers who want to avoid energy hunger.
The situation with inflation in the Eurozone remains unclear. According to data published on Wednesday May 18, it remains at a record level of 7.4%, that is, 3.7 times the ECB's target level of 2.0%. The head of the Central Bank of Finland, Olli Rehn, said that in such a situation, members of the ECB Governing Council agree on the need for a "fairly quick" move away from negative interest rates. Recall that the deposit rate in the euro area is now minus 0.5%, and has been negative for 8 years, since 2014. However, "fairly quick" exit is a very vague wording, in contrast to the specific decision of the US Federal Reserve to raise the dollar rate by another 1.0% in the next two months.
This divergence between the specifically hawkish monetary policy of the Fed and the vaguely dovish ECB suggests that the US currency will continue to strengthen its position. Although the opposite happened last week: the dollar lost about 150 points to the euro from May 16 to May 20 and the EUR/USD pair ended the trading session at 1.0557. However, according to some experts, what happened is a consequence of the general correction of the DXY index and fits into the medium-term downtrend of the pair.
At the time of writing, on the evening of May 20, the opinions of experts are divided as follows: 45% of analysts are sure that the EUR/USD pair will return to the movement to the south, the same number is waiting for the continuation of the correction to the north, and the remaining 10% have taken a neutral position. There is a certain discrepancy in the readings of indicators on D1 caused by a correction. Among the trend indicators, 40% side with the reds, 60% side with the greens. The oscillators have a clearer picture: 70% are colored green, 20% red and 10% neutral gray. The nearest resistance is located in the zone 1.0600, if successful, they will try to break through the resistance 1.0640 and rise to the zone 1.0750-1.0800. For the bears, task number 1 is to break through the support in the 1.0500 area, then 1.0460-1.0480, and then update the May 13 low at 1.0350. If successful, they will move on to storm the 2017 low of 1.0340, there is only support from 20 years ago below.
As for the calendar for the coming week, it will be useful to pay attention to the publication of data on business activity (Markit) in Germany and the Eurozone as a whole on Tuesday, May 24. US orders for capital and durable goods will be released on Wednesday. The minutes of the last FOMC meeting of the Fed will be published on the same day, and preliminary US GDP indicators for the Q1 2022 will be known on Thursday, May 26.
GBP/USD: Inflation Continues to Rise
Of course, the dynamics of the GBP/USD pair was dominated by what happened to the DXY dollar index last week. However, certain adjustments were also made by specific factors related to the economy of the United Kingdom.
The Bank of England published a forecast about two months ago that inflation should have peaked in April. The data published on Wednesday, May 18, confirmed this forecast, with the exception of one very big "but". The regulator predicted that the peak would be reached at 7.2%, but it turned out to be 9.0%, which is the highest over the past 40 years. And in this case, to paraphrase the great English playwright William Shakespeare, it is time to exclaim: "Is this a peak or not a peak? That's the question!". Apparently, there is no talk of any slowdown in inflation yet, and it is precisely this that is the main "toothache" of the UK economy.
GBP/USD hit 1.2524 at a weekly high. Two pieces of news kept the pound from weakening. First, according to the UK Office for National Statistics, retail sales in the country unexpectedly rose by 1.4% in April, while the market expected a fall of 0.2%. And in addition, the British currency was supported by the chief economist of the Bank of England Hugh Pill, who said that the regulator has yet to continue tightening monetary policy, as bullish risks for inflation still prevail, and it is projected to rise to double digits in 2022.
As a result, the pair ended the five-day period at 1.2490 where it traded in late April - early May, and where it has already been in 2016, 2019, and 2020. Will it continue to fall? 20% of experts answered this question positively, 25% answered negatively. The majority (55%), not knowing how to react to the words of the chief economist of the Central Bank, shrugged their shoulders. As for the indicators on D1, then, as in the case of EUR/USD , their opinions are divided. Among the trend indicators, 50% point to the growth of the pair, exactly the same number points to the fall, among the oscillators the balance of forces is somewhat different: only 20% are looking south, 80% are looking north, although a quarter of them are already in the overbought zone. Supports are located at 1.2435, 1.2400, 1.2370, 1.2300, 1.2200, then 1.2154-1.2164 and 1.2075. A strong point of support for the pair is at the psychologically important level of 1.2000. In case of further correction to the north, the pair will have to overcome the resistance in the zone 1.2500-1.2525, then there are zones 1.2600-1.2635, 1.2700-1.2750, 1.2800-1.2835 and 1.2975-1.3000.
UK economic developments in the coming week include a speech by Bank of England Governor Andrew Bailey on Monday May 23 and the release of the PMI Composite and Markit Manufacturing and Services PMIs on Tuesday May 24.
USD/JPY: Why the Yen Is Strengthening
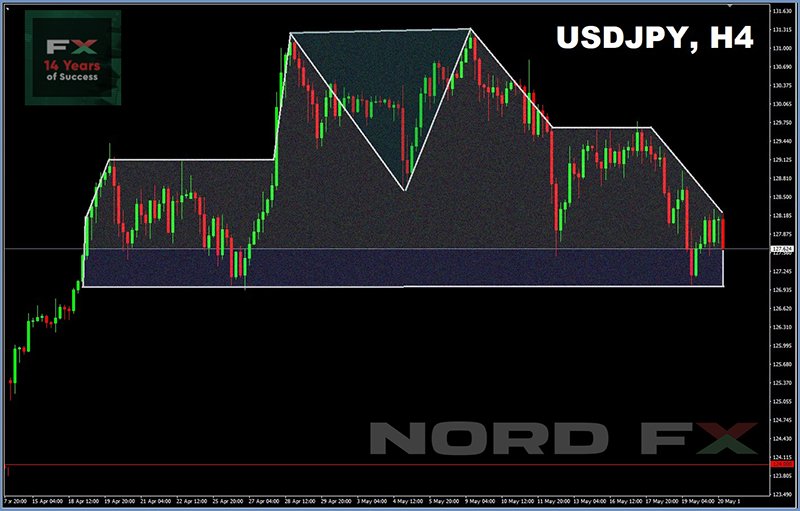
According to officials from the International Monetary Fund (IMF), "in general, the depreciation of the yen is helping Japan." The same could be repeatedly heard from the leaders of the Bank of Japan. The IMF also believes that the control over the yield curve applied by the Japanese regulator is quite effective, and the dynamics of the yen "are in line with medium-term fundamentals."
However, contrary to the statements of high officials, we have seen not weakening, but strengthening of the Japanese currency over the past two weeks. And on May 20, it is exactly where it was on April 20: at the level of 127.85, without having updated the maximum of May 09 at 131.34. According to a number of experts, the strengthening of the Japanese currency was due to the increased craving of investors for the most risk-free assets. However, this is not the only reason.
Inflation in the country continues to grow, which causes discontent among the population. The rise in consumer prices is recorded for the eighth month in a row. In April, they increased by 2.5% compared to the same month a year earlier, showing the highest growth rate since October 2014. As noted by Dow Jones, inflation has exceeded the 2.0% mark for the first time since September 2008, and this is without taking into account the effect of the consumption tax increase. It was 1.2% in March. Naturally, all this causes discontent among the citizens of the country, to which politicians are already actively reacting. But at some point, there should be a reaction from the Central Bank of Japan. Many investors, especially foreign ones, expect that, despite the regulator's assurances of its commitment to an ultra-soft monetary policy, it will still be forced to increase the interest rate. And, apparently, it is this expectation that provides the yen with additional support.
At the moment, 55% of analysts vote for the yen to continue to strengthen and USD/JPY to continue moving south, 40% vote for the resumption of the uptrend to the north, and 5% expect movement in the sideways. At the same time, supporters of technical analysis pay attention to the fact that a classic figure has formed on the chart: a "double top" (or "head - shoulders"). Among the indicators on D1, the alignment of forces is as follows. Oscillators have 80% red, 10% green, and 10% neutral gray. Among trend indicators, the parity is 50% to 50%. The nearest support is located at 127.50, followed by zones and levels at 127.00, 126.30-126.75, 126.00 and 125.00. The goal of the bulls is to rise above the horizon of 128.00, then overcome the resistances of 129.00, 129.60, 130.00, 130.50 and renew the high of May 09 at 131.34. The high of January 01, 2002, 135.19, is seen as the ultimate goal.
Of the upcoming week's events, one can pay attention to the speech of the Bank of Japan Governor Haruhiko Kuroda on Wednesday, May 25, although it is unlikely to bring any surprises and at least somehow affect market sentiment. But what if something does happen? Markets remember 2016, when Haruhiko Kuroda first categorically denied the possibility of changing rates, and then suddenly decided to take such a step…
CRYPTOCURRENCIES: End of the Digital Gold Rush?
The BTC/USD bulls have been desperately trying to hold the line in the $30,000 zone since May 11. The struggle took place in the $28,650-31,000 zone all last week. And even though the S&P500, Dow Jones, and Nasdaq stock indices rebounded on May 18, putting additional pressure on bitcoin, it continued to resist.
In general, decoupling bitcoin from stock indices, primarily from the S&P500, is the dream of many supporters of the first cryptocurrency. On the other hand, these same people dream that as many institutions as possible will come to the crypto market, and that bitcoin, along with stocks, will take its rightful place in their investment portfolios. But in order to become a full-fledged participant in financial markets, a cryptocurrency must obey the rules and laws established on it. And if large investors get rid of risky assets, one should not expect that, by dumping shares of Microsoft, Apple or Amazon, they will invest the dollars received not in treasuries, but in bitcoin or ethereum.
Another dream is for bitcoin to establish itself as a store of value on par with physical gold. However, the concept of "digital gold" at the moment is nothing more than a compliment towards the first cryptocurrency. Or a marketing ploy to increase its value in the eyes of small investors. But the importance of the precious metal for humanity has been confirmed for thousands of years, while the history of bitcoin is not even 15 years old. And its value lies only in its limited emission and thirst for profit.
Back in 2010, BTC was worth 5 cents, and its price reached $69,000 at its peak in November 2021. It is clear that the prospect of quickly and easily turning $100 dollars into $138,000,000 attracted a huge mass of people willing to get rich quickly. So what happened in the last 10-12 years can be called the "Digital Gold Rush", by analogy with the Gold Rush in the USA in the second half of the 19th century. But then many, instead of getting rich, on the contrary, lost their money. The same can be observed now: bitcoin, having fallen to $26.579 on May 12, updated the low of the current year and returned to the values of December 2020, having lost about 60% of its value in just 6 months.
According to the Bloomberg Billionaires Index, Coinbase CEO Brian Armstrong's net worth has decreased from $13.7 billion to $2.2 billion. This was not only due to the fall in digital asset prices, but also due to the fall in Coinbase shares, the price of which fell by more than 80%. The capital of the CEO of the FTX crypto exchange Sam Bankman-Fried has halved and now stands at $11.3 billion. The well-known founders of the Gemini cryptocurrency trading platform, the brothers Cameron and Tyler Winklevoss, have individually lost more than $2 billion, which is equivalent to almost 40% of their total fortune. Well, what means of "savings and hedging" can we talk about in such a situation?
Another advantage of bitcoin that its proponents like to talk about is its decentralized nature and the anonymity of its holders. However, it seems that this is just a fake. The head of the US Securities and Exchange Commission (SEC), Gary Gensler, explained that although cryptocurrency markets are considered decentralized, in reality, most of the activity takes place on a few large trading floors. Regulators and law enforcement officers are closely watching them. And the fact that the wallets belonging to the Russians were blocked after the imposition of sanctions against Russia, says a lot.
Finally, the fourth opportunity to raise the value of BTC is its widespread use as a means of payment. Although not everything is so smooth here. For example, Sam Bankman-Fried, CEO of the FTX crypto exchange, has recently expressed doubts about the ability of bitcoin to become a popular payment system. The top manager pointed to the lack of the ability to scale the network "to millions of transactions" per second due to the inefficiency and high environmental costs of his blockchain.
Returning from wishful thinking to reality, we must state that the total capitalization of the crypto market continues to fall. At the time of writing this review, Friday evening, May 20, it is at $1.248 trillion ($1.290 trillion a week ago). The Crypto Fear & Greed Index is firmly entrenched in the Extreme Fear zone and is at around 13 points. Moreover, it fell to 8 points on Tuesday, May 17, the lowest level since March 28, 2020. The BTC/USD pair is hardly kept in the "war zone", at the level of $29.325.
Gold advocate, president of Euro Pacific Capital Inc. Peter Schiff believes that bitcoin has already lost an important support level near $33,000. And the cryptocurrency will have to fall to $8,000 to touch the next level. "The support line has been broken. There is a high probability of movement to the lower support line. The chart shows two patterns at once: a double top and a head-shoulders pattern. This is an ominous combination. We have a long way down," this "gold bug" wrote in his blog.
Rich Dad Poor Dad bestselling author and entrepreneur Robert Kiyosaki called the bitcoin crash "great news" and predicted a test of the $17,000 level. "As I said earlier, I expect bitcoin to fall to $20,000. Then we will wait for the bottom test, which may be $17,000. Once that happens, I'll go big. Crises are the best time to get rich," he said.
But according to the crypto strategist nicknamed DonAlt, the question of where bitcoin will move after breaking the key support area of $30,000, has not yet been resolved. "Over the next 3 months, we will either see the capitulation that everyone is waiting for, or bitcoin will close the range and start moving up to $58,000," the expert writes. In his opinion, the probability of going down is higher, and the next support is at $14,000. DonAlt notes that the current structure of the bitcoin market may hint that the bottom has already been reached. However, he fears the strong correlation of BTC with the stock market and the possibility of a further collapse of the S&P500 index.
The trader known as Rekt Capital agreed with the opinion that bitcoin is expected to fall further. The specialist believes that the coin needs to lose another 25% of its value before the expected local minimum.
Analyst nicknamed Pentoshi, on the other hand, expects a bitcoin rally soon, as the situation, in his opinion, is in favour of the bulls. According to Pentoshi, the bears are making serious efforts to lower the price of bitcoin, but they are not succeeding in achieving the desired result. "A lot of coins change hands with a lot of effort. But do the sellers receive appropriate remuneration? It doesn't look like it.
As an example, he looked at an inverted chart of bitcoin, which shows extremely high trading volume, coupled with a small exchange rate movement. As Pentoshi believes, the failure of the bears to depreciate BTC despite strong selling pressure suggests that the momentum is about to turn in favor of the bulls.
American billionaire investor Bill Miller also looks optimistic. According to him, he survived at least three bitcoin drops by more than 80%. And despite the fact that some of his coins have been currently sold on a margin call, he remains bullish in the long term.
As follows from the above, there is no consensus among influencers and experts at the moment. What to do in such a situation? Of course, you can sit and wait with your hands down. Or you can, for example, engage in active trading. Moreover, trading on the CFD principle, you can earn both on the growth and fall of the crypto market. Moreover, you do not need to have a real cryptocurrency for this: in the NordFX brokerage company, in order to open a transaction of 1 bitcoin, you will only need $150, and $15 for a transaction of 1 ethereum. Why is this not a crypto life hack?
EUR/USD Weekly Outlook
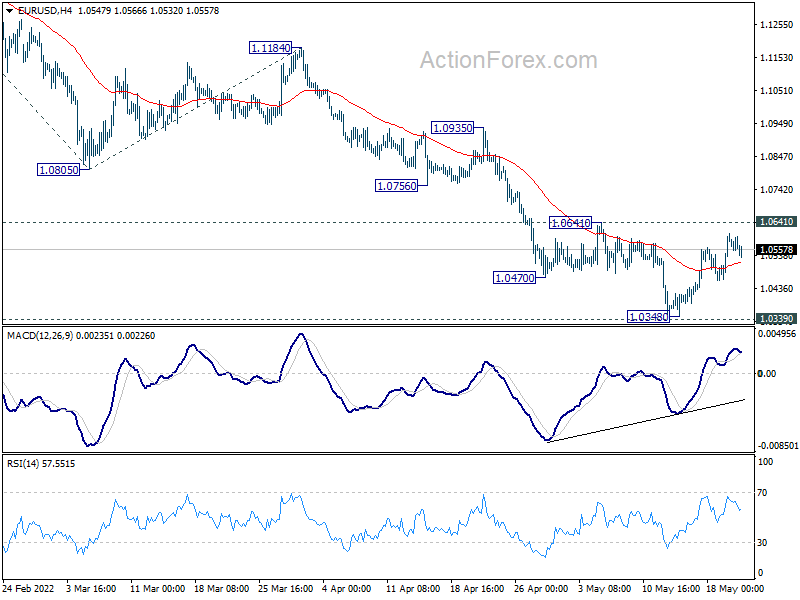
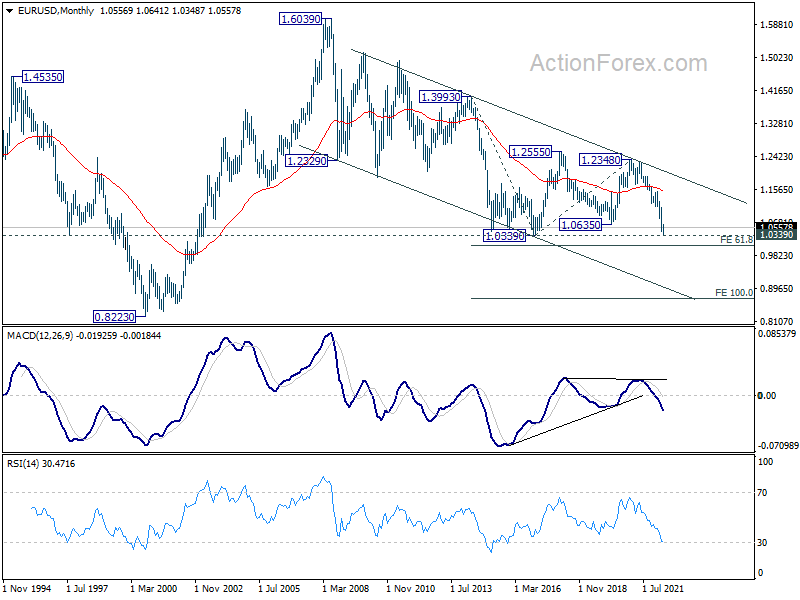
EUR/USD's recovery from 1.0345 continued last week but stayed below 1.0641 resistance. Initial bias remains neutral this week first. Considering bullish convergence condition in 4 hour MACD, break of 1.0641 resistance will confirm short term bottoming at 1.0348, ahead of 1.0339 long term support. Intraday bias will be turned back to the upside for 55 day EMA (now at 1.0766). On the downside, however, decisive break of 1.0339 will carry larger bearish implication and target 161.8% projection of 1.1494 to 1.0805 from 1.1184 at 1.0069.
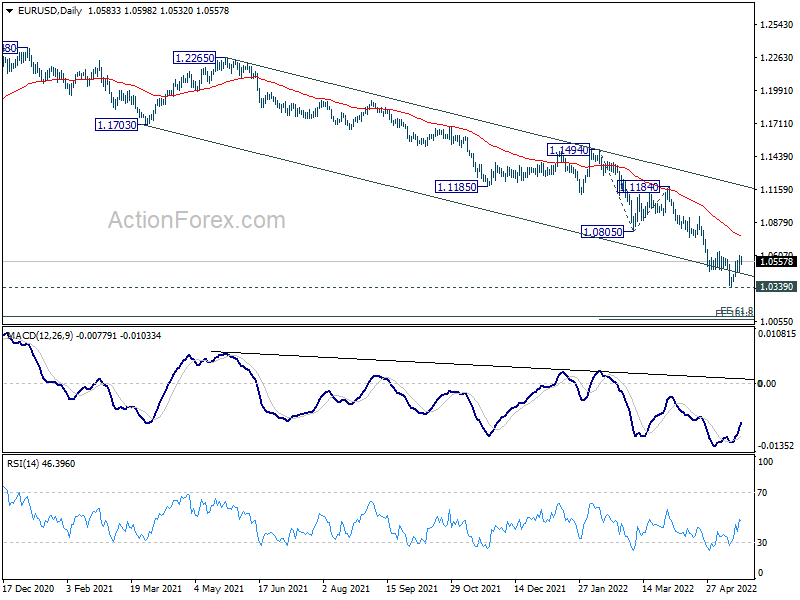
In the bigger picture, focus stays on 1.0339 long term support (2017 low). Decisive break there will resume whole down trend from 1.6039 (2008 high). Next target is 61.8% projection of 1.3993 to 1.0339 from 1.2348 at 1.0090. However, firm break of 1.0805 support turned resistance will delay this bearish case and bring medium term corrective rebound first.
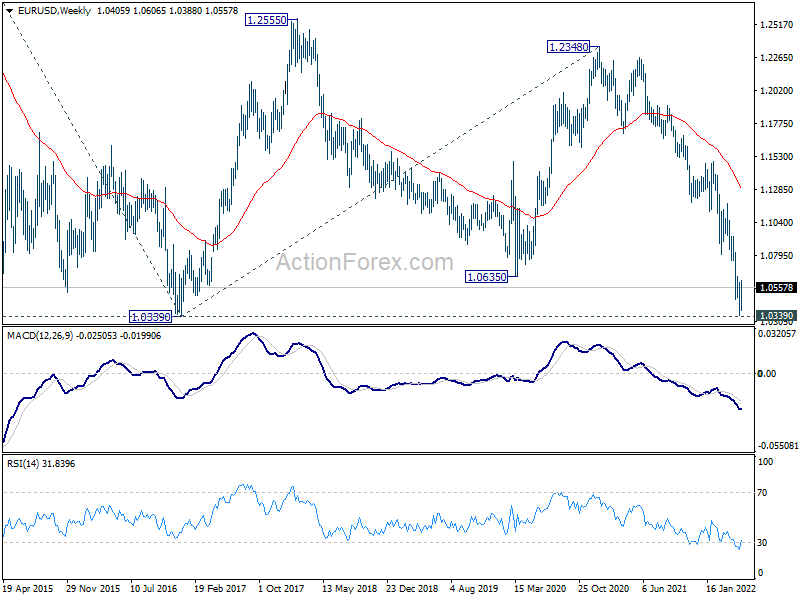
In the long term picture, current development suggests that long term down trend from 1.6039 (2008 high) is ready to resume. Break of 1.0339 will target 61.8% projection of 1.3993 to 1.0339 from 1.2348 at 1.0090. Decisive break there could bring downside acceleration towards 100% projection at 0.8694.
USD/JPY Weekly Outlook
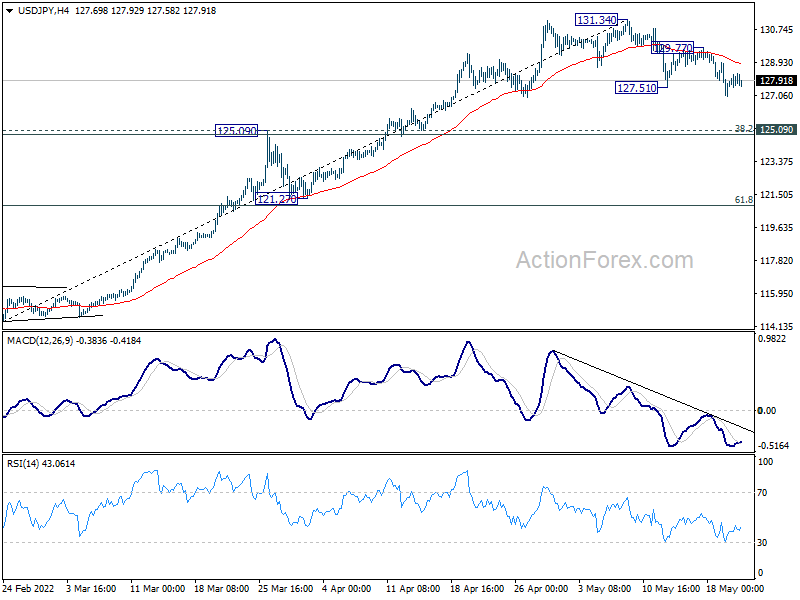
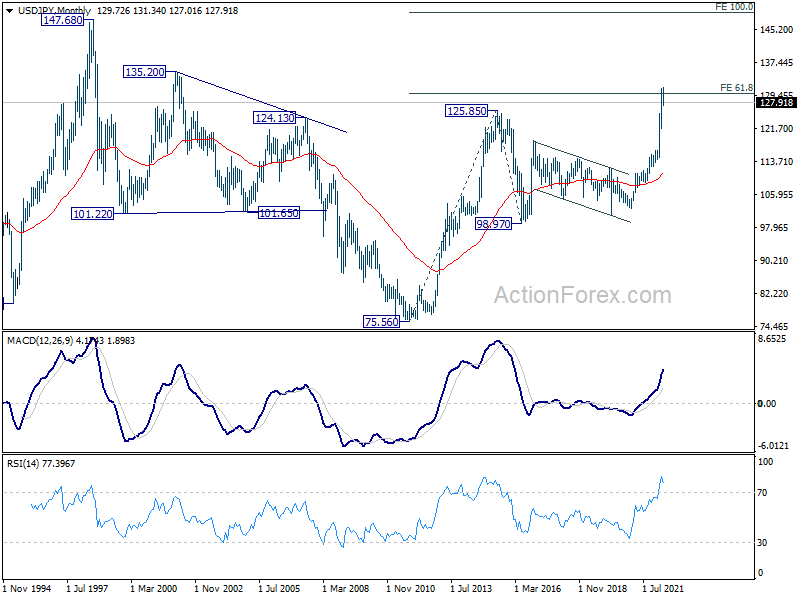
USD/JPY's correction from 131.34 continued last week and outlook is unchanged. Further fall could be seen as long as 129.77 resistance holds. Such correction could extend to 125.09 cluster support (38.2% retracement of 114.40 to 131.34 at 124.86). But strong support is expected from there to contain downside to bring rebound. On the upside, break of 129.77 minor resistance will suggest that the correction is finished and bring retest of 131.34.
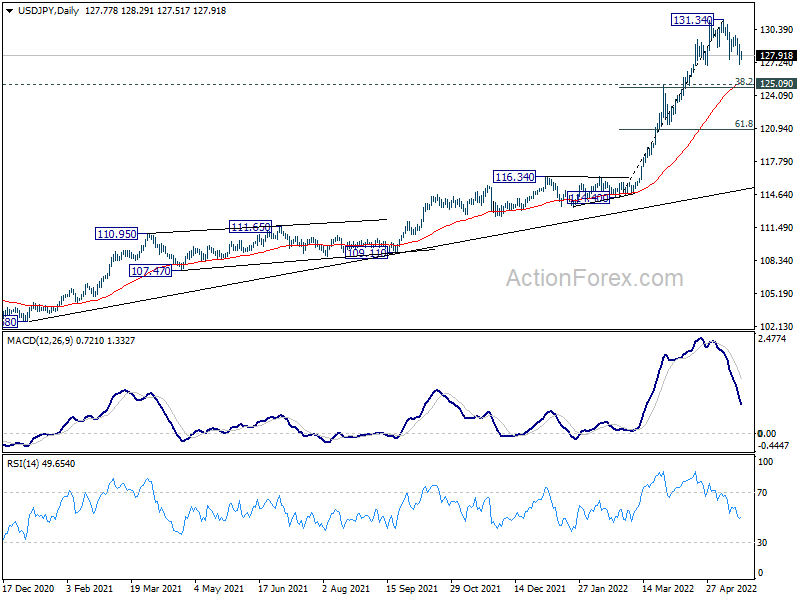
In the bigger picture, current rally is seen as part of the long term up trend form 75.56 (2011 low). Sustained trading above 61.8% projection of 75.56 (2011 low) to 125.85 (2015 high) from 98.97 at 130.04 will pave the way to 100% projection at 149.26, which is close to 147.68 (1998 high). For now, this will remain the favored case as long as 121.27 support holds.
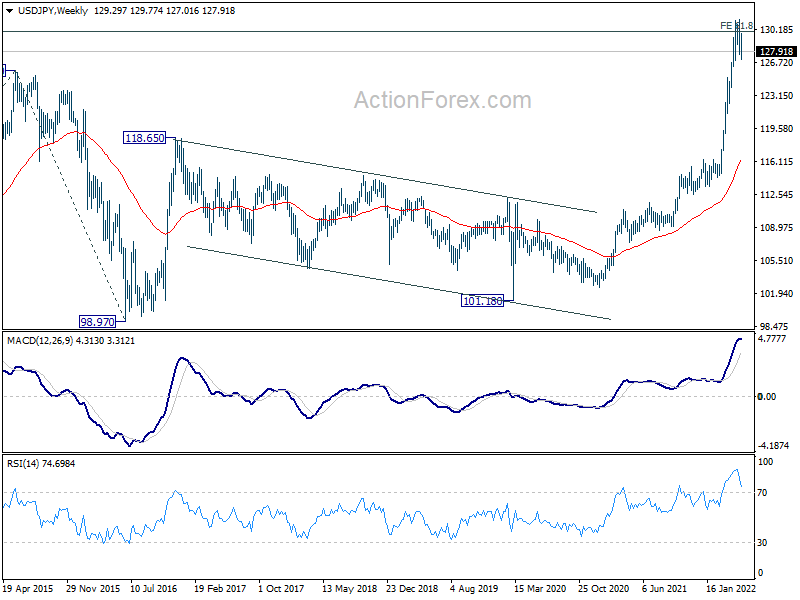
In the long term picture, the up trend from 75.56 (2011 low) long term bottom to 125.85 (2015 high) has just resumed. First target at 61.8% projection of 75.56 to 125.85 from 98.97 at 130.04 was already met. Next is 100% projection at 149.26, which is close to 147.68 (1998 high).
GBP/USD Weekly Outlook
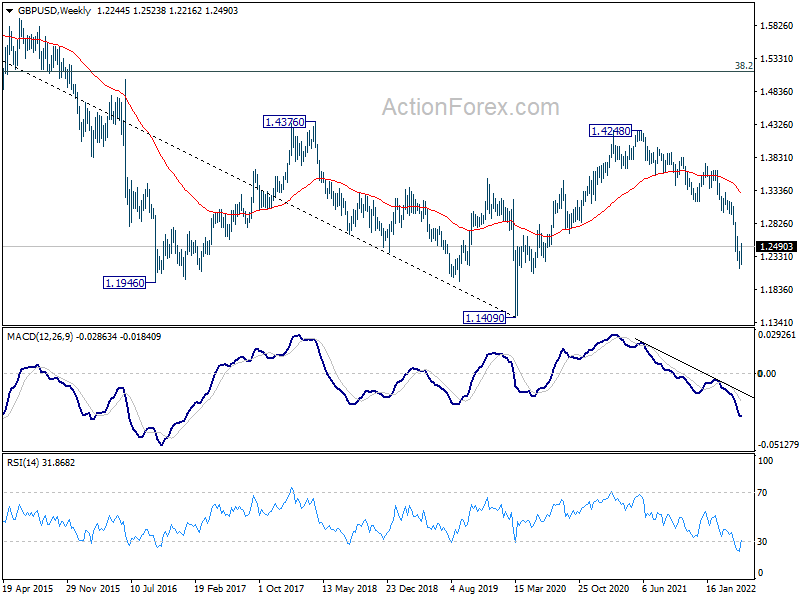
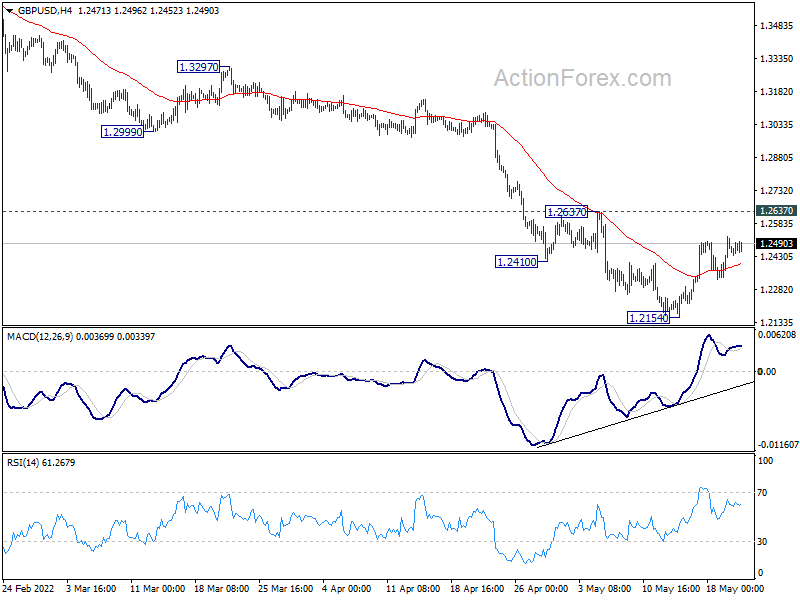
GBP/USD's recovery from 1.2154 extended higher last week but stayed below 1.2637 resistance. Initial bias remains neutral this week first. On the downside, break of 1.2154 will resume the down trend from 1.4248. However, considering bullish convergence condition in 4 hour MACD, break of 1.2637 will confirm short term bottoming at 1.2154. Intraday bias will be turned back to the upside for 55 day EMA (now at 1.2789).
In the bigger picture, based on current momentum, fall from 1.4248 (2018 high) at least at the same degree as the rise from 1.1409 (2020 low). That is, fall from 1.4248 could be a leg inside the pattern from 1.1409, or resuming the longer term down trend. In either case, deeper decline is expected as long as 1.2999 support turned resistance holds. Next target is 1.1409 low.
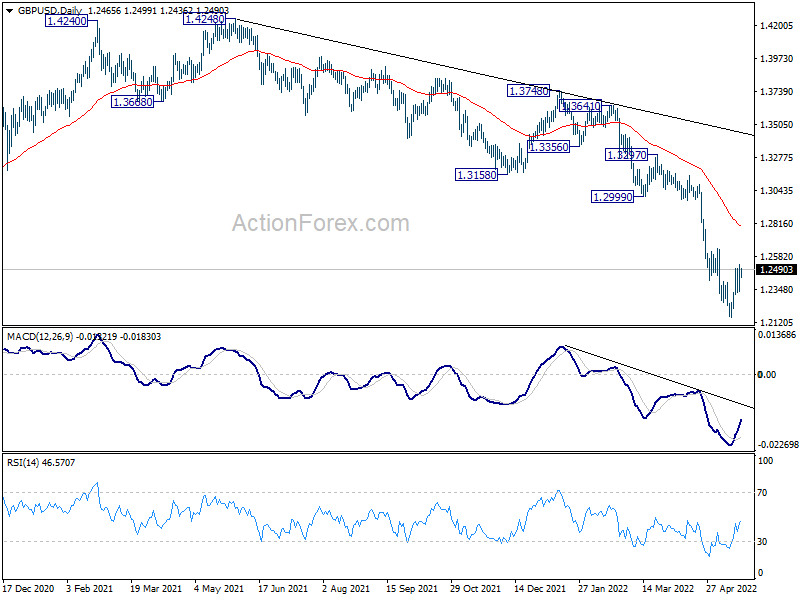
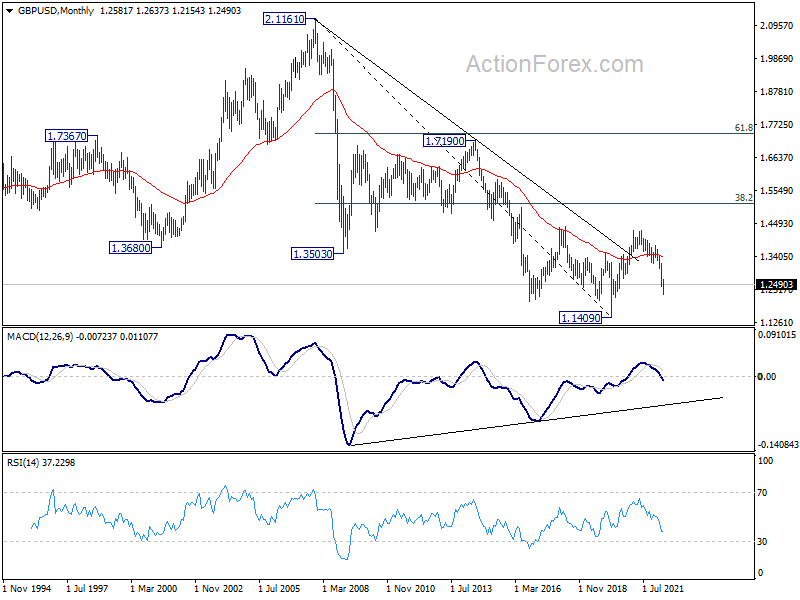
In the longer term picture, rebound from 1.1409 long term bottom should have completed at 1.4248 already, well ahead of 38.2% retracement of 2.1161 to 1.1409 at 1.5134. The development argues that price actions from 1.1409 are developing into a corrective pattern only. That is, long term bearishness is retained for resuming the downside from 2.1161 (2007 high) at a later stage.