

Sample Category Title
EU Forecast: Growth Down, Inflation Up
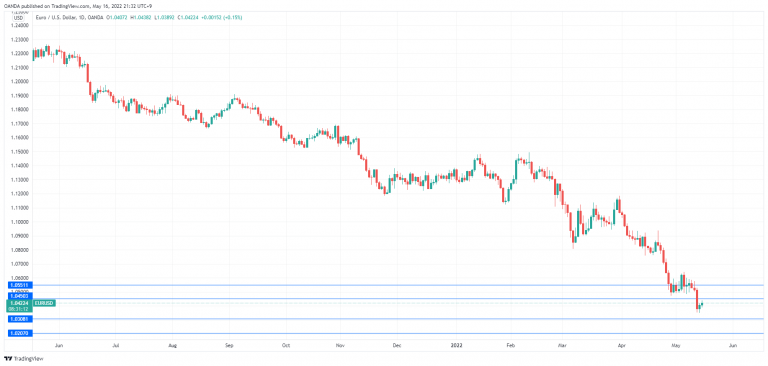
The euro is drifting at the start of the week, as EUR/USD trades slightly above the 1.04 level.
The euro remains under pressure, as it continues to weaken against the US dollar. EUR/USD hasn’t mustered a winning week since March and hit a dubious milestone on Thursday, closing below the 1.04 line for the first time since January 2003. If the euro breaks below support at 1.03 it would be on track to fall to parity, a psychologically significant level.
EU forecast sees lower growth, higher inflation
The EU gave the eurozone a report card on Monday, and the data wasn’t pretty. The report was the EU’s first forecast since the Russian invasion of Ukraine. The forecast stated that eurozone growth would expand by 2.7% in 2022 and 2.3% in 2023. In February, the forecast stood at 4% and 2.7%, respectively. On the inflation front, the forecast was revised upwards to 6.1% in 2022 and 2.7% in 2023, up from the previous forecast of 3.5% and 1.7%, respectively.
The takeaway from the EU forecast is that as a result of the Ukraine war, the eurozone is experiencing lower growth and higher inflation, raising concerns that the eurozone could soon be gripped by stagflation. The eurozone has been particularly hard-hit by the conflict, due to its heavy reliance on Russian energy and geographical proximity to Ukraine.
Unsurprisingly, investors don’t like what they are seeing, and the euro has taken it on the chin. Reports that the EU is trying to garner support for a ban on Russian oil, which would mark the ratcheting up of sanctions against Moscow, is putting further pressure on the wobbly euro.
The upheaval caused by the Ukraine war seems to have woken up the ECB from its dovish slumber. After years of monetary easing, ECB members are becoming more vocal about the need for tighter policy, and ECB President Christine Lagarde said earlier this week that QE would end in the third quarter, and a rate hike would follow “some time” after that. We could see the launch of a rate-tightening cycle as early as July.
EUR/USD Technical
- 1.0398 has switched to resistance. It is a weak line and could see further action during the day. Above, there is resistance at 1.0473
- There is support at 1.0321 and 1.0246
Friday’s Stock Rise is Probably a Dead Cat Bounce
US stock markets closed last Friday with a substantial and widespread gain. Do we see a dead cat bounce or the beginning of a recovery? So far, there are more reasons to suspect the former.
The CNN Fear & Greed Index was down to 7 last week, rebounding to 12 by Monday. Current levels are still in extreme fear territory, but a rebound from multi-month lows often heralds a return of buyers who think the emotional sell-off has gone too far.
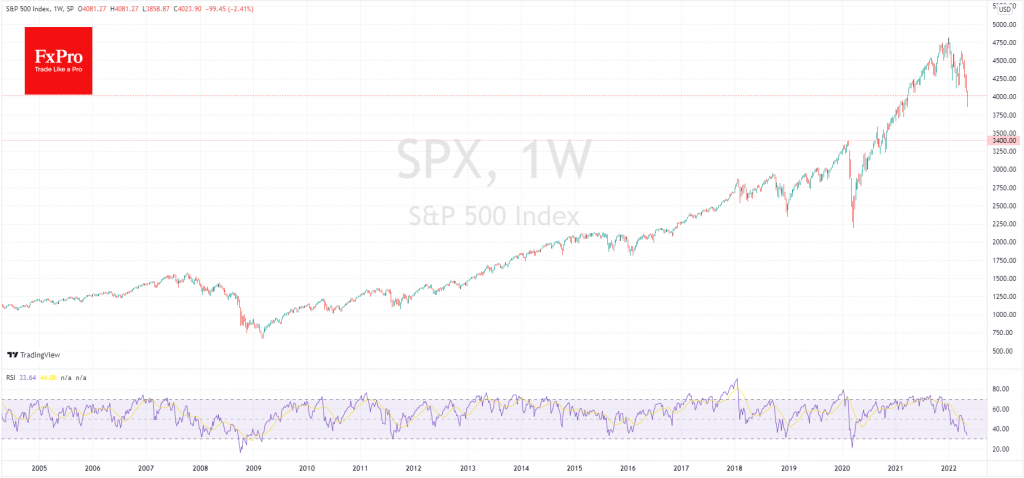
Technically, the S&P500 has managed to bounce back from a bear market territory and has temporarily returned to levels above 4000, while Dow is above 32000.
However, in our view, we saw positional profit-taking on Friday, but not the end of a downward trend. The weekly chart’s S&P500 and Dow Jones indices have not yet reached the oversold area where they appeared attractive for buying in March 2020.
Particularly worrying is the comparatively quiet nature of the sell-off. The market volatility index VIX remains the only one of the seven “Fear and Greed” components in neutral territory.
The latter signals a systematic sell-off of assets rather than a panic flight. This is not a straightforward approach for the market to change.
Treasury and Fed officials are often willing to flood the markets with liquidity in cases of extreme volatility. Still, without it, they see what is happening as a natural process in which it is harmful to interfere.
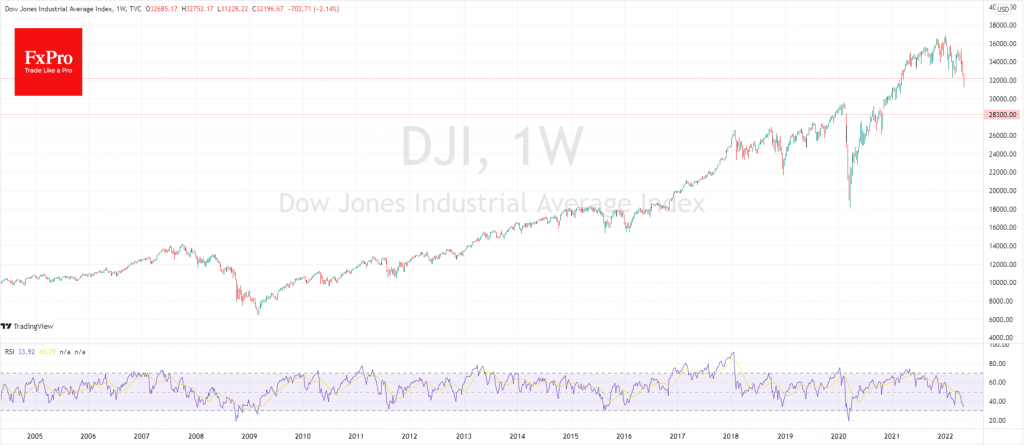
The technical picture in the US indices now more closely resembles the first half of 2008. That means that the climax of the panic (October 2008) and the bottom (March 2009) are yet to come.
This is also supported by the Fed’s rhetoric that hopes to avert an economic recession through policy tightening is prevented. So far, we can see the intention of a 50-point hike in the next two meetings in June and July after a similar move in May at the same time as the asset sales from the balance sheet.
Monetary tightening locally looks like a breeding ground for bears, who might target the area below 30000 in the Dow Jones, trying to close the gap near 28300 from November 2020.
For the S&P500, the bears’ ultimate target might be the 3300-3400 area, where the pre-pandemic peak and the starting point of the rally in November after the Biden victory are concentrated.
Perhaps only by zeroing in on all the coronavirus and retail-associated gains in equities and taking inflation into negative territory could we see an inflow of long-term capital into equities.
Has Bitcoin Reached the Bottom?
Bitcoin is down 9.4% over the past week, ending at around $31,000. Ethereum lost 16.1%, while other leading altcoins in the top 10 fell from 13.9% (Binance Coin) to 25.4% (Solana).
The total capitalisation of the crypto market, according to CoinMarketCap, sank 15% over the week to $1.30 trillion. The bitcoin dominance index jumped 2.9 points to 44.4% over the same period due to a sharp weakening of altcoins.
The cryptocurrency fear and greed index fell 8 points in the week to 10 and continues to be in “extreme fear”. By Monday, the index had climbed to 14 points, thanks to the cryptocurrency market’s retreat from local lows at the end of last week.
Bitcoin has declined for six weeks in a row, along with stock indices. A prolonged one-way move in Bitcoin was last seen in late 2018 when the first cryptocurrency hit a cyclical bottom. That was followed by many more months of sluggish momentum, so investors have an essential question: choose a low point to buy or join the move when it is certain. Prudence suggests that it is less risky to follow the second strategy.
Last week’s decline intensified after breaking through last year’s lows near $30,000, becoming the most significant weekly drop since January.
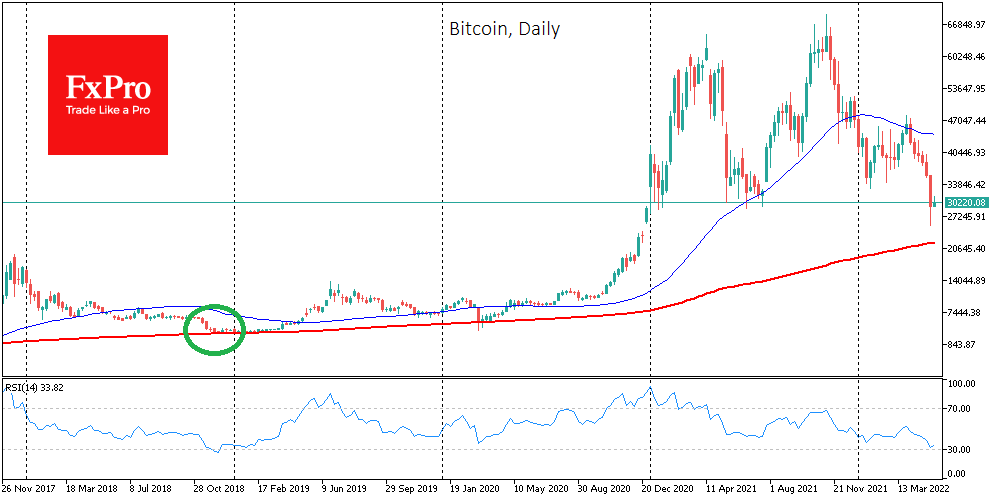
The story of the Terra (LUNA) crash and the TerraUSD stablecoin project added to the negativity on the crypto market, hitting all altcoins hard.
According to Global Macro Investor CEO Raul Pal, May and June will be the most worrying months, so a new wave of selloffs in the crypto market is inevitable.
Legendary investor Bill Miller said he sold some of his BTC holdings. Although bitcoin may continue to decline in the short term and even drop by half from current levels, Miller looks at bitcoin positively and expects it to grow over a long time.
Robert Kiyosaki, the world-famous author of the bestselling book Rich Daddy, Poor Daddy, is looking to buy bitcoin once it tests the ‘bottom’ at $17,000. The businessman has once again expressed distrust of the US government.
Crude Oil Remains Imbalanced
Another week of May brings a new decline in Oil. Brent is retreating and hanging around $109.50.
A season of active car travel is starting in the US. In this light, demand for gasoline, which is getting more and more expensive, is rising. As a result, the problems with satisfying the demand are also getting more complicated and may continue pushing gasoline prices upwards.
The latest report from Baker Hughes showed that the Oil Rig Count in the US is rising too slowly to provide enough support to the commodity market – the indicator gained only 6 units, up to 563 – while in Canada it decreased by 5 units. At the same time, shale oil production remains rather passive.
There are too many market emotions around geopolitical tensions. For example, earlier today, Bloomberg reported that Germany was planning to stop importing Russian oil by the end of the year even if the European Union fails to agree on a similar decision. In a time of insufficient oil supply, such news may eliminate negative vibes a little bit.
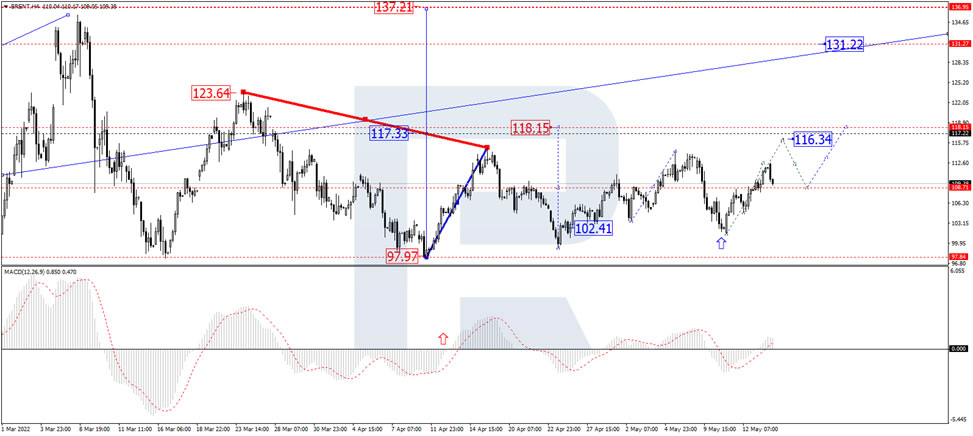
In the H4 chart, having completed the correction at 101.55 and then broken two important levels, at 108.75 and 112.60, Brent continues forming the ascending wave with the target at 118.15. Today, the pair may correct to test 108.75 from above and then form one more ascending structure towards 116.15. Later, the market may break the latter level and continue moving within the uptrend to reach the above-mentioned target. From the technical point of view, this scenario is confirmed by MACD Oscillator: after breaking 0 to the upside, its signal line is growing within the histogram area, which means that the uptrend in the price chart may continue.
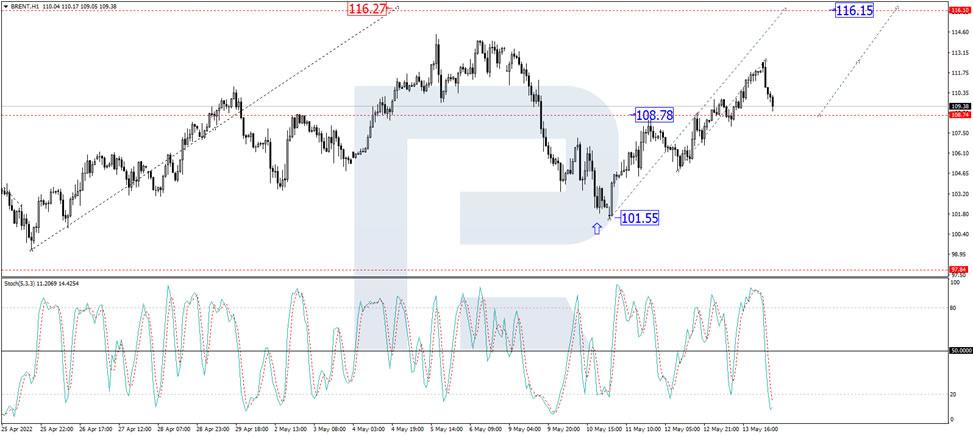
As we can see in the H1 chart, Brent is forming another ascending structure from 101.55 to 116.15; it has already reached the short-term target at 112.60 and is currently correcting to test 108.75 from above. After the correction is over, the market may resume growing to break 116.15 and then continue trading upwards with the target at 118.15. From the technical point of view, this idea is confirmed by the Stochastic Oscillator: its signal line is moving below 20 and may resume growing to break 50. After that, the line is expected to continue moving upwards and reach 80.
Gold Around 1,800 Border, Bearish Risks Linger
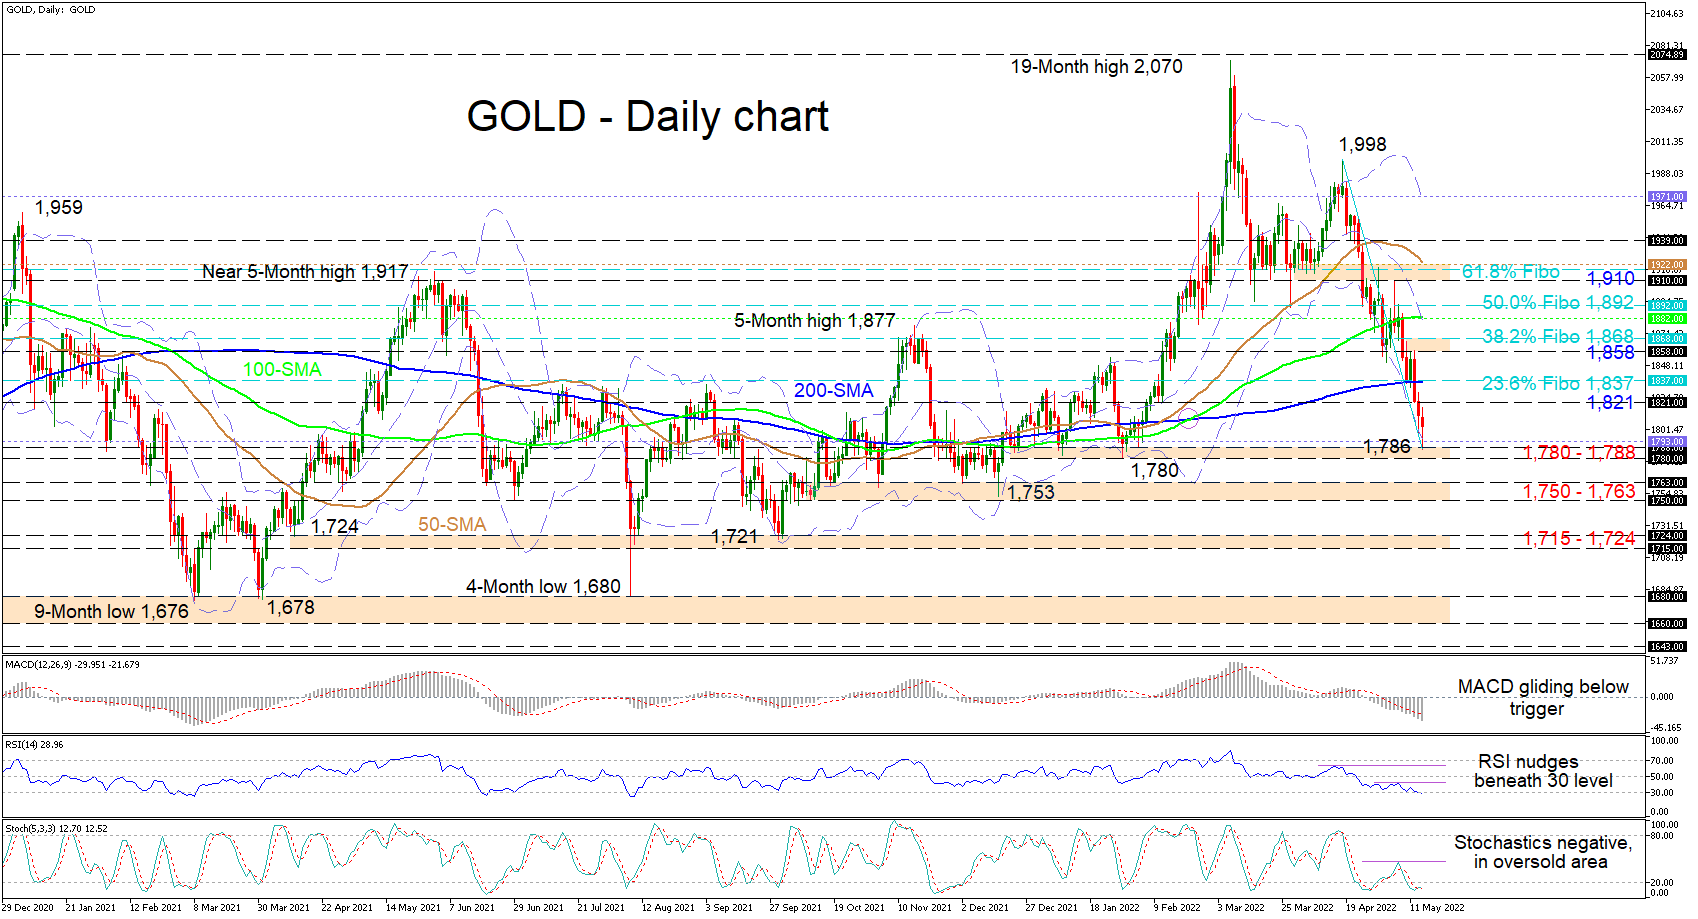
Gold is trading near its lower Bollinger band around 1,793 after the four-week decline from the 1,998 peak was curbed by the 1,780-1,788 support base, which was formed by the lows from the second half of December 2021 until the end of January 2022. The longer-term 100- and 200-day simple moving averages (SMAs) are reflecting the stifled bullish trend in the price, while the rolling over of the 50-day SMA, is suggesting that the descent in the commodity has deepened.
The short-term oscillators are skewed to the downside painting a dull picture for positive developments in the yellow metal. The MACD, south of the zero threshold, is sliding beneath its red trigger line, while the downward pointing RSI looks set to dip further into oversold territory. Moreover, the stochastic lines, which are underneath the 20 oversold level, are also hinting of further selling in the precious metal.
If the current trajectory persists, sellers could get another crack at the lower Bollinger band at 1,793 and the adjacent 1,780-1,788 immediate support base. Should this key support obstruction fail to keep sellers at bay, the price could then target the 1,750-1,763 support region that extends back to October 2021. Further deterioration in the commodity may then confront downside constraints in the vicinity of 1,715-1,724.
On the flipside, if gold’s footing within the 1,780-1,788 zone develops into positive traction, downside defences could step in at 1,821 ahead of the 200-day SMA around 1,837, which is also the 23.6% Fibonacci retracement of the descent from the 1,998 peak until 1,786. Pushing higher, the bulls may then tackle a resistance band between the 1,858 barrier and the 38.2% Fibo of 1,868. From here, further buoyancy in the price of the commodity could encourage buyers to challenge a region of resistance linking the 100-day SMA at 1,882 with the 50.0% Fibo of 1,892.
Summarizing, gold is sustaining a sturdy bearish bias beneath the SMAs and the 1,858-1,868 resistance zone. A dive below the 1,780-1,788 boundary may add credence to further negative tendencies in the commodity. That said, for gold’s shine to return, the price would need to climb north of the 1,910-1,922 area.
EU downgrades EZ 2022 GDP forecast to 2.7%, inflation upgraded to 6.1%
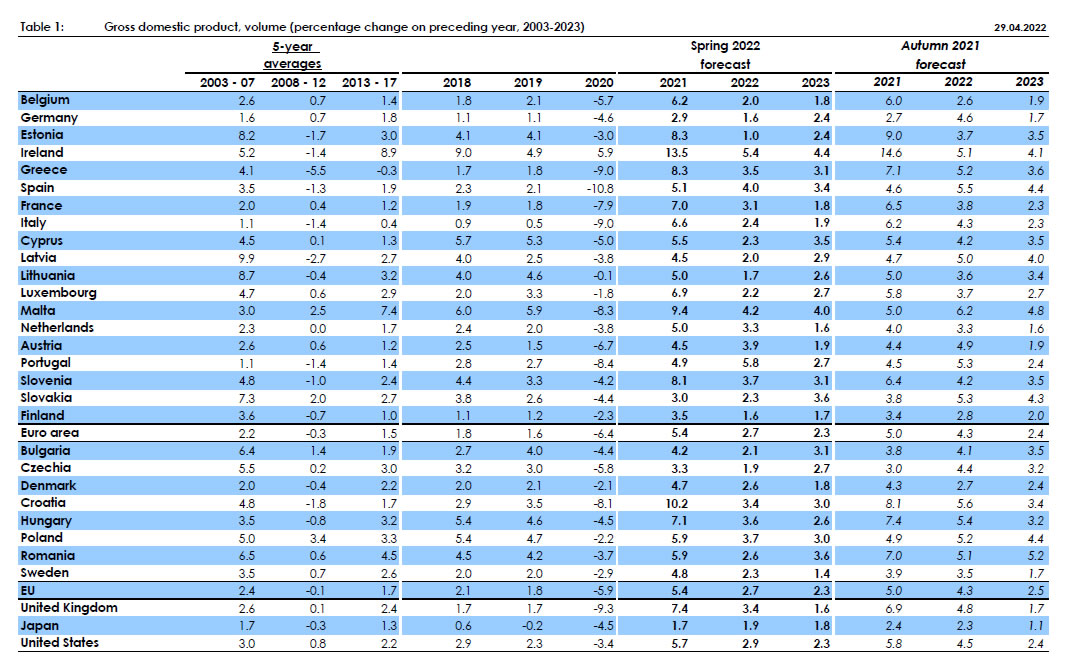
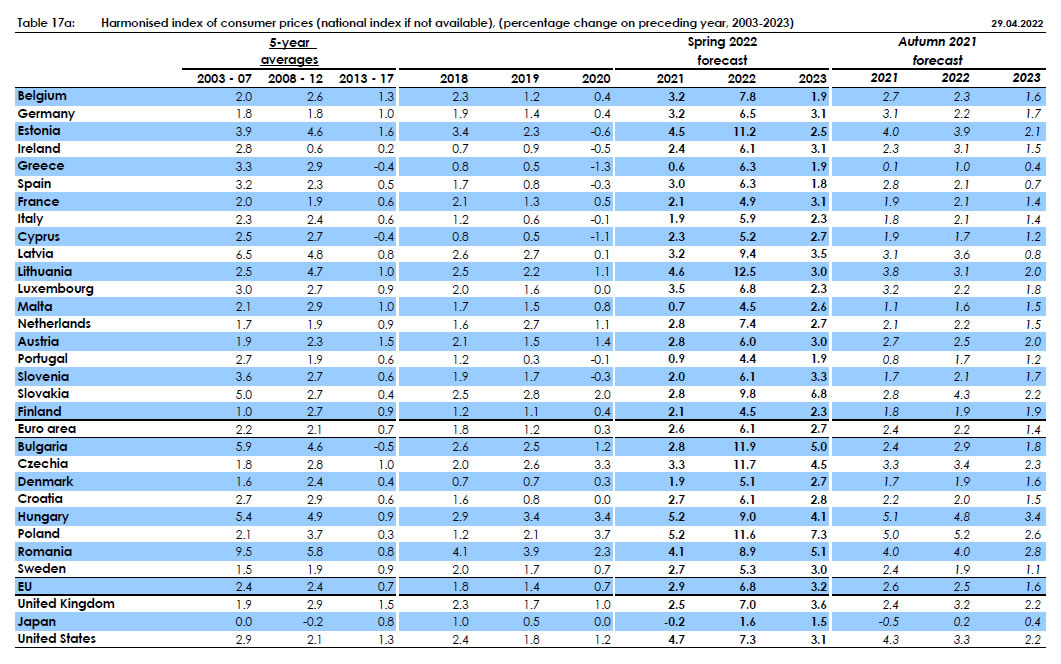
In the Spring 2022 Economic Forecast, EU revised 2022 GDP growth forecast for Eurozone sharply lower, and inflation forecast sharply higher. Here are the new forecasts for Eurozone:
- 2022 GDP growth at 2.7% (down from Autumn forecast of 4.3%.)
- 2023 GDP growth at 2.3% (down from 2.4).
- 2022 HICP inflation at 6.1% (up from 2.2%).
- 2023 HICP inflation at 2.7% (up from 1.4%).
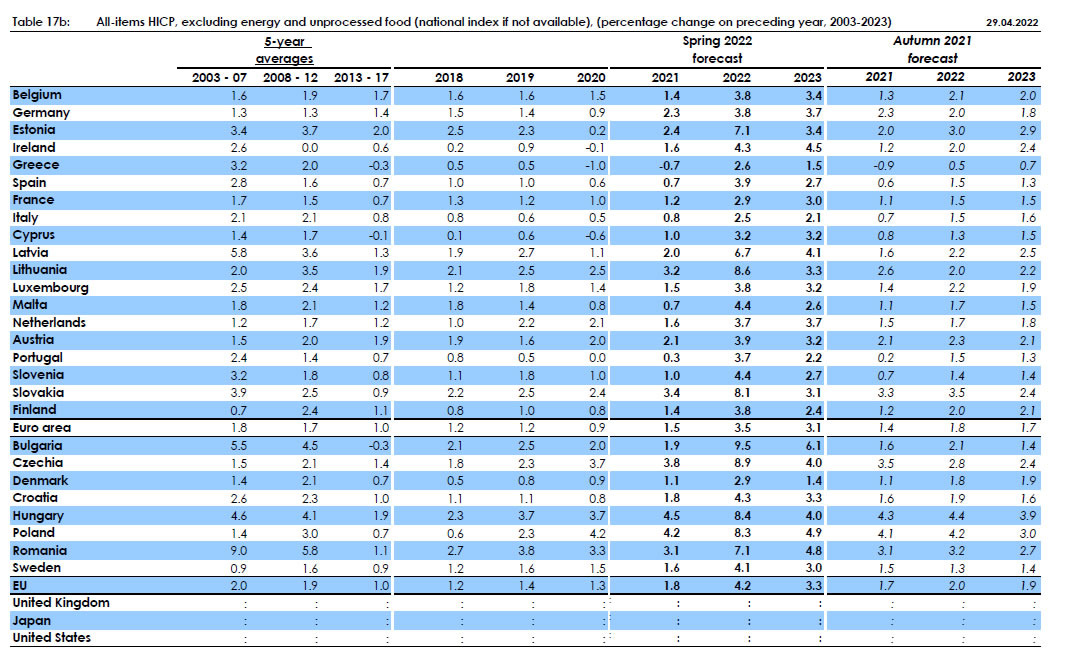
- 2022 HICP core inflation at 3.5% (up from 2.0%).
- 2023 HICP core inflation at 2.4% (up from 1.7%).
Valdis Dombrovskis, Executive Vice-President said: "There is no doubt that the EU economy is going through a challenging period due to Russia's war against Ukraine... The overwhelming negative factor is the surge in energy prices, driving inflation to record highs... While growth will continue this year and next, it will be much more subdued than previously expected. Uncertainty and risks to the outlook will remain high as long as Russia's aggression continues."
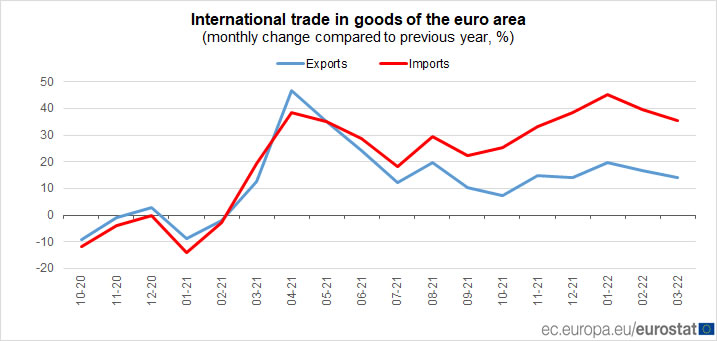
Eurozone exports rose 14.0% yoy in Mar, imports rose 35.4% yoy
Eurozone exports of goods rose 14.0% yoy to EUR 250.1B in March. Imports rose 35.4% yoy to EUR 266.5B. Trade deficit came in at EUR 16.4B. Intra-Eurozone trade rose 21.2% yoy to EUR 236.8B.
In seasonally adjusted terms, Eurozone exports rose 0.9% mom to EUR 225.3B. Imports rose 3.5% mom to EUR 242.8B. Trade deficit widened from EUR -11.3B to EUR -17.6B, versus expectation of EUR 2.3B surplus. Intra-Eurozone trade rose from February's EUR 207.2B to EUR 210.3B.
USDCHF Bullish Momentum Accelerates
The US dollar moved sideways on Monday ahead of a busy week in the market. The index has been in a spectacular rally as risks in the market rise and as hopes of additional rate hikes by the Federal Reserve rise. Key data to watch this week will be the American retail sales data scheduled for Tuesday. Analysts expect these numbers to reveal that sales remained under pressure as consumer prices rise. The US will also publish the latest new home sales and housing starts numbers. The index will also react to geopolitical tensions as Finland and Sweden make their Nato application.
US futures were in the green during the Asian session, continuing the trend that started on Thursday last week. The Dow Jones, Nasdaq 100, and S&P 500 indices will react to revenue numbers from the biggest retailers in the US. These companies include Walmart, Target, Home Depot, Lowe’s, and Macy’s. Other key companies that will publish this week are Take Two Interactive, JD.com, Cisco, Analog Devices, and Deere among others. According to FactSet, most American companies have been publishing strong revenue growth and weak profits. The average earnings growth is 9.1%, which is the lowest level since Q4 of 2020.
The Chinese statistics agency published weak economic numbers earlier today. These numbers point to the fact that the economy is struggling because of ongoing lockdowns in Shanghai. During the weekend, Shanghai announced reopening plans that will include mass testing and shopping malls reopening. The economic calendar will have minimal events today, with the main one being the EU economic forecast by the European Commission. Investors will also focus more on cryptocurrencies following last week’s volatility.
EURUSD
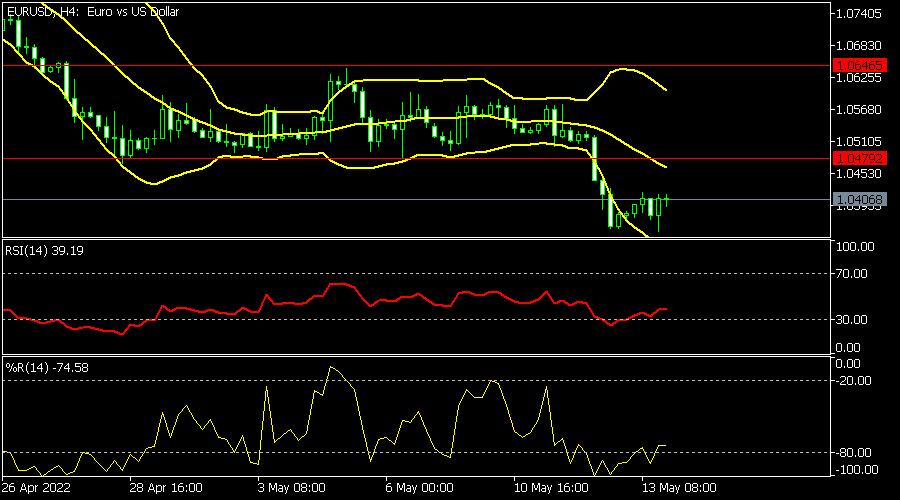
The EURUSD pair was little changed on Monday morning. It is trading at 1.0406 and is hovering near the lowest level since 2002. The pair is below the important resistance level at 1.0480, where it struggled moving below in April and early this month. The pair is between the middle and the lower side of the Bollinger Bands while the William % Range and RSI have moved above their oversold levels. Therefore, with the pair forming a bearish flag pattern, there is a likelihood that it will move lower.
USDCHF
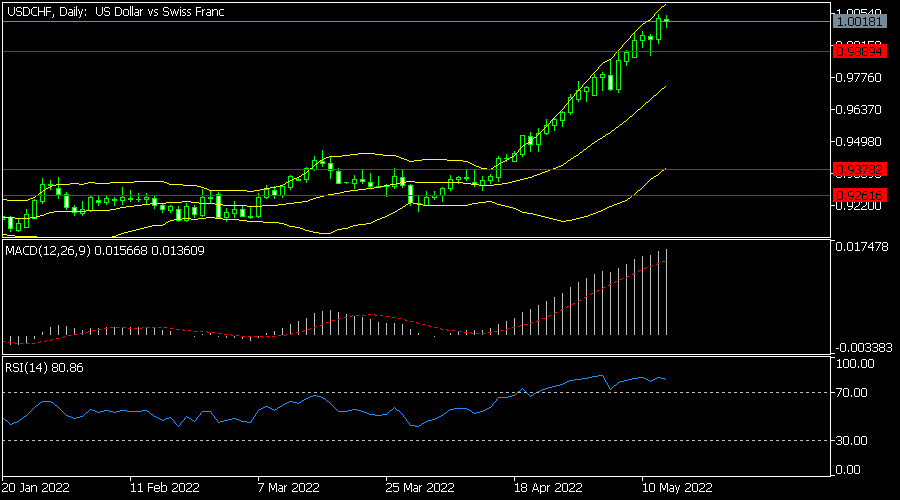
The USDCHF continued its bullish trend. The pair is trading at 1.0018, which is slightly above its parity level. It is along the upper side of the Bollinger Bands. Also, the Relative Strength Index kept moving above the overbought level while the MACD has risen above the neutral level. The pair will likely keep rising as the bullish momentum continues.
XAUUSD
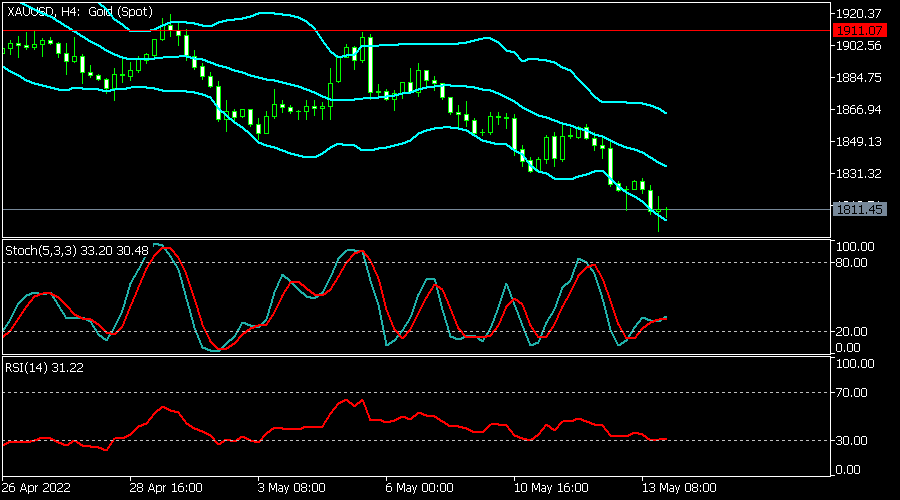
The XAUUSD pair continued falling as the gold sell-off continued. The pair is trading at 1,811, which is significantly lower than this month’s high of 1,911. It is between the middle and lower side of the Bollinger Bands while the RSI is hovering slightly above the oversold level. The path of the least resistance for gold is lower, with the next reference level being at 1,800.
Gold Price Moved into a Bearish Zone Below $1,820
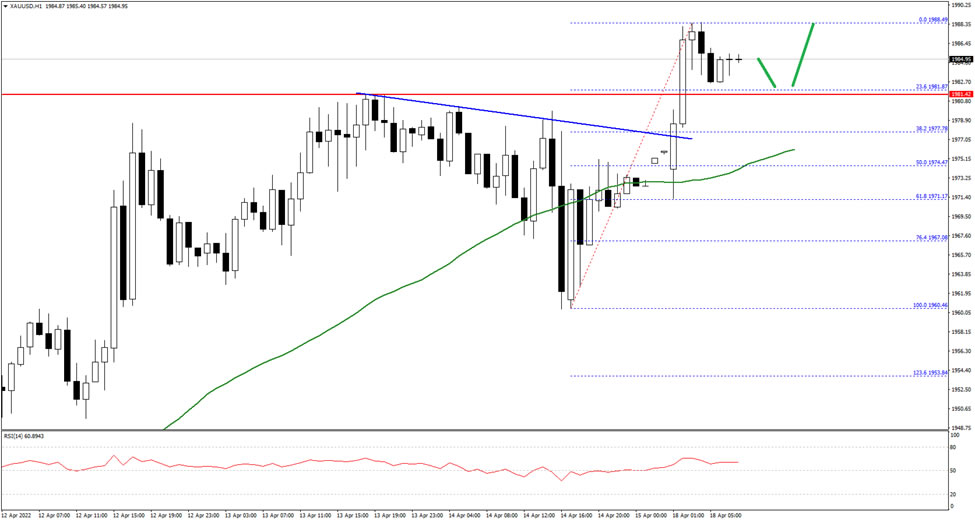
Gold price started a fresh decline from the $1,850 pivot level against the US Dollar. The price broke the $1,820 support zone to move into a bearish zone.
There was also a break below the $1,810 level and a close below the 50 hourly simple moving average. The bulls are now struggling to keep the price above the $1,800 level. There is also a key bearish trend line with resistance near $1,812 on the hourly chart.
The next main resistance could be near the $1,820 level, above which the price could start another steady increase. In the stated case, it could rise towards $1,840 on FXOpen.
If not, the price could decline below $1,800. The next major support is near the $1,780 level, below which the price might decline towards the $1,750 support level in the near term.
ECB Villeroy: A too weak Euro goes against price stability objective
ECB Governing Council member Francois Villeroy de Galhau said in a Bank of France conference, "let me stress this: we will carefully monitor developments in the effective exchange rate, as a significant driver of imported inflation". He added, "a euro that is too weak would go against our price stability objective."
Villeroy said a "decisive" governing council meeting would be expected in June, followed by an "active summer" on policy. "The pace of the further steps will take into account actual activity and inflation data with some optionality and gradualism," he said. Policymakers should "at least move towards the neutral rate", he added.