Sample Category Title
China retail sales down -11.1% yoy in Apr, industrial production down -2.9% yoy
China retail sales dropped -11.1% yoy in April, worse than expectation of -6.0% yoy. Industrial production dropped -2.9% yoy, versus expectation of 0.7% yoy. Fixed asset investment rose 6.8% ytd yoy, also below expectation of 7.0%.
The "increasingly grim and complex international environment and greater shock of [the] Covid-19 pandemic at home obviously exceeded expectation, new downward pressure on the economy continued to grow." The NBS said in a statement. But it added, "with progress in Covid controls and policies to stabilize the economy taking effect, the economy is likely to recover gradually."
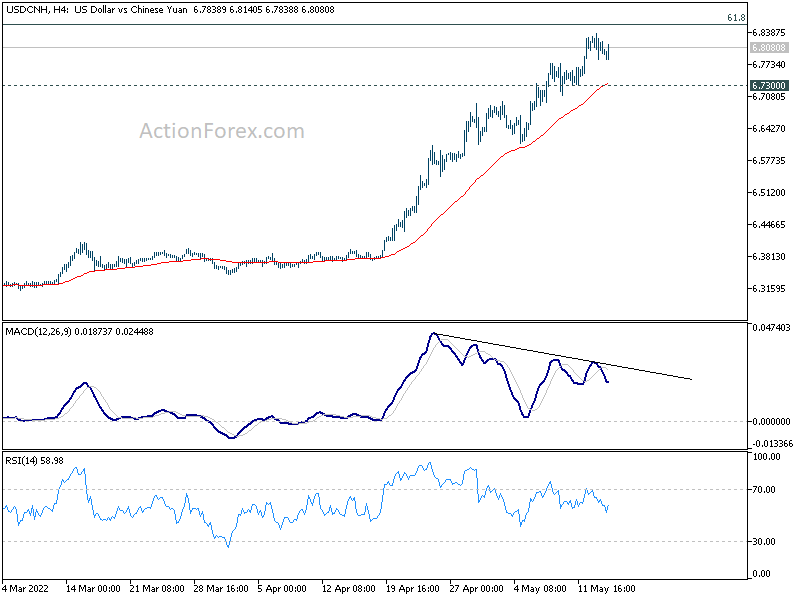
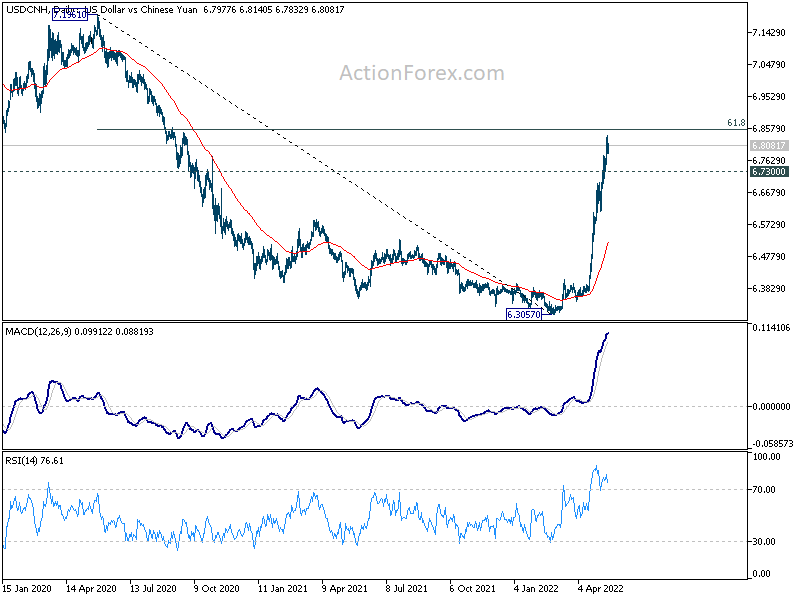
Yuan's decline has somewhat slowed a little last week. USD/CNH is now close to 61.8% retracement of 7.1961 to 6.3057 at 6.8560. Considering bearish divergence condition in 4 hour MACD, USD/CNH could be about to top for the near term. Break of 6.730 support will confirm the turn into a corrective phase in the uptrend.
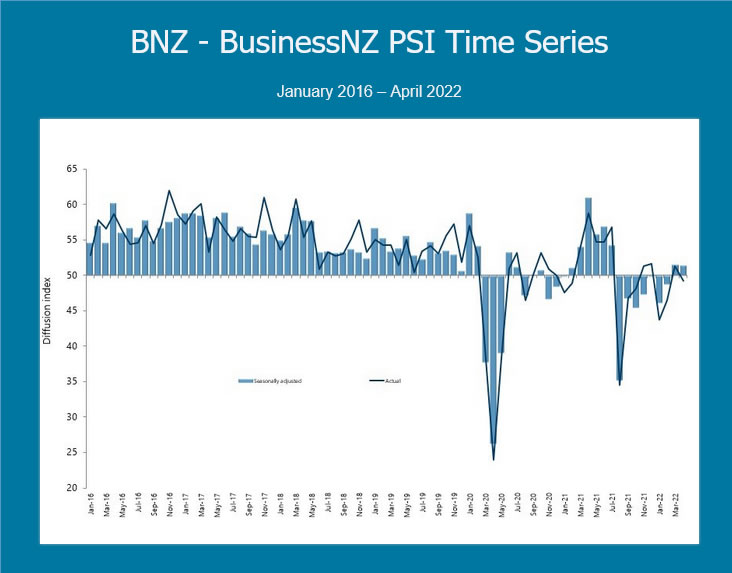
New Zealand BNZ services dropped to 51.4, disappointing in context of easing restrictions
New Zealand BNZ Performance of Services Index ticked down from 51.5 to 51.4 in April. Looking at some details, activity/sales dropped from 53.5 to 52.7. Employment rose from 49.2 to 51.2. New orders/business dropped from 59.0 to 53.6. Stocks/inventories rose from 52.8 to 54.8. Supplier deliveries dropped from 40.5 to 40.1.
BNZ Senior Economist Doug Steel said that "for large parts of the service sector that have been through the ringer over recent times, we suspect any result above breakeven would be welcomed. But, on the other hand, April's result also looks somewhat disappointing in the context of easing COVID restrictions (from Red to Orange) halfway through the month."
Eco Data 5/16/22
[php_everywhere instance="1"]
Forex and Cryptocurrencies Forecast
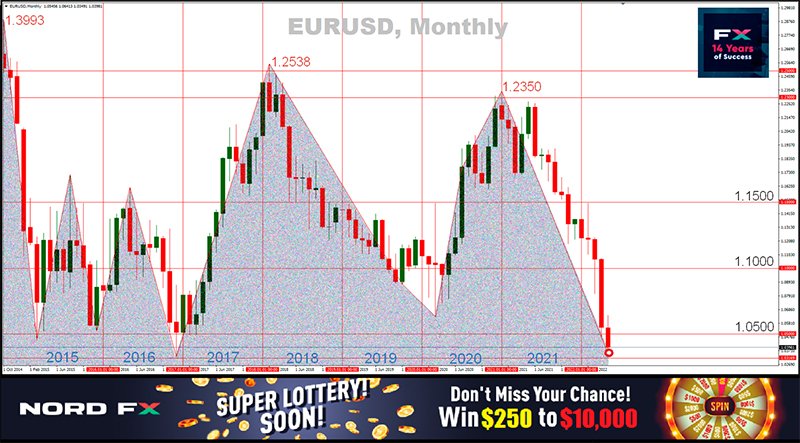
EUR/USD: On the Way to 1.0000
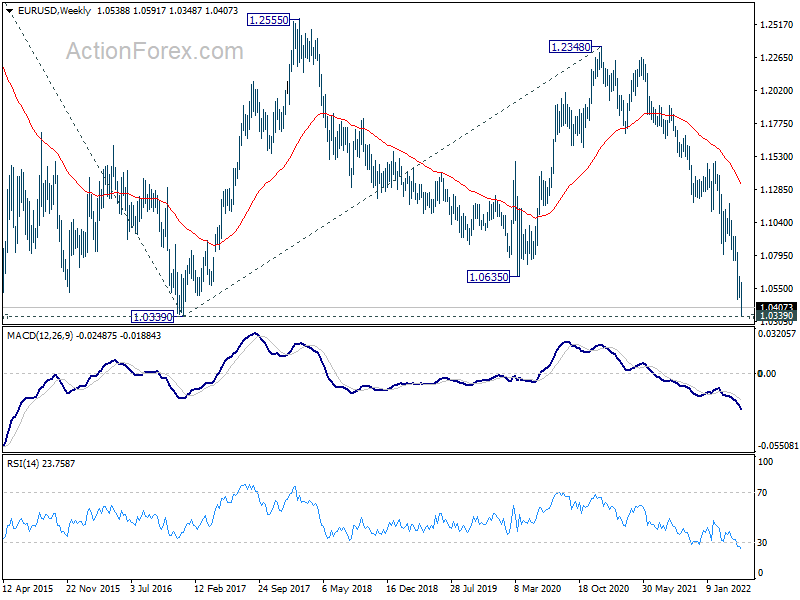
The dollar continues to rise, while the EUR/USD pair continues to fall. The DXY dollar index crept close to 104.9 on Thursday, May 12. The last time it climbed this high was 20 years ago. The pair found the bottom at the level of 1.0349, in the area of the lows of December 2016 - January 2017. A little more, and following DXY, it will get to where it traded 20 years ago. And there, parity 1:1 is just a stone's throw away.
The reason for the next strengthening of the US currency was, as usual, two factors: the recovery of the labor market and the growth of inflation. It is these factors that determine the pace of tightening monetary policy by the Fed.
According to the forecast, US jobless claims should have shown a slight increase. But the actual data, released on Thursday May 12, showed that the situation in the labor market is much better than expected. The number of initial requests has grown, but not by 3K, as predicted, but only by 1K. The number of repeated requests, instead of increasing by 3K, decreased by as much as 44K.
A day earlier, on May 11, inflation data appeared. The core consumer price index in the US increased by 0.3% in April and amounted to 0.6%. This growth is much less than the 1.2% increase in March. But this does not mean at all that inflation in the country has reached a peak and will only decrease further. Not at all. Oil prices remain above $100 a barrel, pushing up the cost of goods, transportation costs and household spending. New cars increased in price by 1.1% in April (only by 0.2% in March), while airfare prices rose by 18.6% over the month, showing the largest increase in 60 years. In addition, with a high degree of probability, a series of lockdowns in China due to a new wave of coronavirus will lead to problems with logistics and commodity exchange, which will not help reduce inflation either.
The combination of these factors suggests that the US Federal Reserve is unlikely to change its plans to tighten monetary policy: to reduce the balance sheet and raise rates. Following the head of the regulator Jerome Powell, his colleagues in the FOMC - the head of the Federal Reserve Bank of Cleveland Loretta Mester and the head of the New York Fed John Williams supported the intention to raise the federal funds rate by 0.5% at each of the two upcoming meetings, bringing it to 2.0%.
As for their counterparts on the other side of the Atlantic, the ECB's key figures advocating a start to raise interest rates are still in the minority. Most members of the Board of Governors of the Bank are still convinced that the increase in inflation in the Eurozone is a temporary phenomenon, caused primarily by rising energy prices due to sanctions against Russia, which invaded Ukraine.
As a result, a powerful divergence between the clearly hawkish position of the US Fed and the indistinctly dovish position of the ECB continues to push the EUR/USD pair down, forcing new multi-year lows.
At the moment, analysts' voices are divided as follows: 70% of analysts are confident that the dollar will continue to strengthen, the remaining 30% are waiting for the pair's correction to the north. At the same time, when switching from a weekly to a monthly forecast, the number of those voting for the growth of the pair increases to 80%. All 100% of the indicators on D1 side with the dollar, after another fall of the pair. However, 20% of oscillators are in the oversold zone. The nearest resistance is located in the zone of 1.0420, the next target of the bulls on EUR/USD is a return to the zone of 1.0480-1.0580. If successful, they will then try to break through the resistance at 1.0640 and rise to the zone of 1.0750-1.0800. For the bears, the number 1 task is to update the May 13 low of 1.0350, after which they will storm the 2017 low of 1.0340, below are only the support of 20 years ago.
As for the calendar for the coming week, we recommend paying attention to the publication of data on prices and volumes of retail sales in the US on Tuesday, May 17. The speeches of the heads of the ECB Christine Lagarde and of the Fed Jerome Powell are expected on the same day. The Eurozone Consumer Price Index will be known on Wednesday, May 18, and data on manufacturing activity and the state of the labor market in the United States will be received on Thursday, May 19.
GBP/USD: GBP Rate Hike Is Possible, But Not Obvious
As mentioned above, the DXY dollar index has reached 20-year highs. According to experts, it has risen by 5.1% over the past 4 weeks. At the same time, the GBP/USD pair fell 7.4%, outperforming the average by 2.3%. However, not everything is so bad for the British currency.
The Bank of England predicted a rise in inflation from the current 7.0% (30-year high) to 10.25% at its meeting on May 05. And although the regulator left the forecast for GDP growth for the current year unchanged (+3.75%), it expects a recession starting from the Q4. The British Central Bank expects a 0.25% reduction in GDP in 2023 instead of the previously planned growth of 1.25%. According to the new forecast, GDP will grow not by 1.0%, but by only 0.25% in 2024.
This scenario, of course, cannot be called optimistic. However, a week later, on May 12, statistics showed that the country's GDP in the Q1 rose by 8.7% year-on-year, seriously exceeding the previous figure of 6.6%. This dynamics gives investors hope that the regulator will not stop at the current interest rate of 1.0%, and like the Fed, it will go on further raising it in order to fight inflation. And this, in turn, will support the British currency. Or at least keep it from sliding further down.
GBP/USD hit a weekly low at 1.2154, with the last chord at 1.2240. In case of further correction to the north, the pair will have to overcome the resistance in the zone 1.2300-1.2330, then there are zones 1.2400, 1.2470-1.2570, 1.2600-1.2635, 1.2700-1.2750, 1.2800-1.2835 and 1.2975-1.3000. When moving south, the first support will be the level of 1.2200, then 1.2154-1.2164 and 1.2075. A strong point of support for the pair is at the psychologically important level of 1.2000. 85% of experts vote for further weakening of the British currency, 15% expect a rebound upwards. And here it should be noted that when switching to forecasting until the end of the June, the number of the pair's growth supporters increases to 75%. There is still a total advantage of the red ones among the indicators on D1: 100% among trend indicators and 90% among oscillators look down. The remaining 10% among the latter have turned north.
As for the events of the upcoming week concerning the economy of the United Kingdom, we can highlight the publication of data on unemployment and wages in the country on Tuesday May 17. The new value of the Consumer Price Index will become known on Wednesday, May 18, and retail sales in the UK for April at the end of the working week, on Friday, May 20.
USD/JPY: From Return on Capital to Its Safety
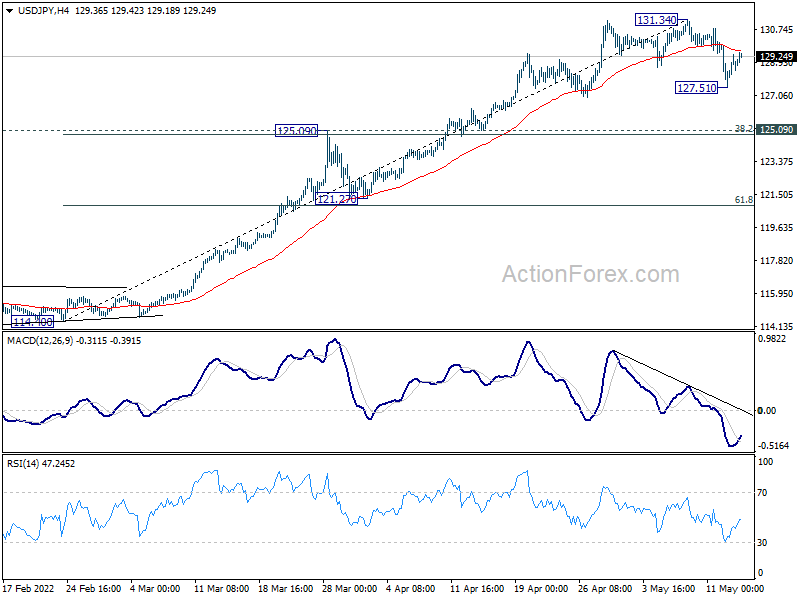
The Japanese yen performed better last week than its "colleagues", the euro and the British pound. As most experts expected, the bulls tried to renew the April 28 high at 131.24. However, having risen only 10 pips higher to 131.34, they gave up, and the USD/JPY pair flew down, finding support only at 127.51. Undoubtedly, the current volatility of the pair is impressive: the weekly trading range was 383 points. This is despite the fact that it hovered around 150 points on average in the Q4 2021 - the Q1 2022. The finish of the last week took place in the central zone of the indicated range, at the level of 129.30.
Barring volatility during the coronavirus pandemic, the USD/JPY drop on Thursday May 12 was the biggest one-day swing since 2010. The strengthening of the Japanese currency, according to a number of experts, was due to the increased craving of investors for the most risk-free assets. Up to this point, the dollar has risen on the back of rising interest rates and higher yields on 10-year US Treasury bills. However, if investors continue to prefer capital preservation over returns, USD/JPY will continue to fall.
The yen was also strengthened by the expectation of changes in the policy of the Bank of Japan. Many investors, especially foreign ones, are expecting that, despite the regulator's assurances of commitment to an ultra-soft monetary policy, it may still go for an increase in interest rates. Moreover, there have already been such precedents, albeit in the opposite direction. Markets remember 2016, when the head of the Central Bank, Haruhiko Kuroda, first denied the possibility of introducing negative rates categorically, and then suddenly decided to take such a step.
At the moment, experts' forecasts look as uncertain as the pair's quotes. 40% vote for its growth, 50% are in favor of the fall of the pair and the remaining 10% have taken a neutral position. There is a similar discord among the indicators on D1. As for trend indicators, 65% are green, 35% are red. The oscillators have 40% on the green side, 25% on the red side, and 35% hve turned neutral gray. The nearest support is located at 128.60, followed by zones and levels at 128.00, 127.50, 127.00, 126.30-126.75, 126.00 and 125.00. The goal of the bulls is to rise above the 130.00 horizon and renew the May 05 high at 131.34. The January 1, 2002 high of 135.19 is seen as the final goal.
Data on Japan's GDP for the Q1 of this year will be published next week, on Wednesday, May 18. It is expected that this indicator will decrease by 0.4% from the previous value of 1.1%.
CRYPTOCURRENCIES: "$1 Million per BTC, or Zero"
If you read the headlines of the last week, you get the strong impression that the cryptocurrencies have only a few months left to live, if not days. "Crypto Market Massacre", "Bitcoin Requiem", "Crypto Bubble Burst" are just some of them. But is it all that scary?
Indeed, the market suffers very serious losses. Bitcoin has lost about 45% of its value since the end of March, hitting $26,580 on May 12. Most other coins feel even worse. As has been said many times, the cause of panic is the global drop in investor risk appetite. The crypto market only follows in the wake of the stock market: the correlation between digital asset quotes and stock indices S&P500, Dow Jones and Nasdaq is at its maximum.
The tightening of the monetary policy of the US Federal Reserve, new outbreaks of coronavirus in China, fears about the future of the EU economy: all this has led investors to prefer the dollar over risky assets. An additional driver is rising yields on 10-year US Treasury bonds. This figure has almost doubled since March and rose over 3%: to the highest level since 2018, exceeding the returns of most sectors of the US stock market.
In addition to global factors, the collapse of the third largest stablecoin in terms of capitalization, UST, put additional pressure on the crypto market. It is believed that stablecoins serve to facilitate investment transactions and should be pegged to the real dollar in a ratio of 1:1. The price of UST immediately collapsed to $0.64, casting doubt on the ability of the Terra team to maintain its rate. Against the backdrop of problems with UST, the native Terra LUNA token also went down, losing more than 90% of its price. It cost about $120 back in April, but you can buy it for $5 now. And here it must be borne in mind that the Terra blockchain protocol is a fairly large project that was in the TOP-10 in terms of market capitalization.
The fate of the centralized stablecoin Tether with a capitalization of $82 billion causes some concern as well. An audit of this project conducted in 2021 showed that instead of dollars, which should provide a reserve for the project, there are a lot of securities in the accounts. Against this background, the sale of USDT has intensified: its capitalization has decreased by $1.4 billion in recent days.
The total capitalization of the crypto market continues to fall. At the time of writing this review, Friday evening, May 13, it is at $1.290 trillion ($1.657 trillion a week ago). The Crypto Fear & Greed Index has fallen from 22 to 10 points out of 100, firmly entrenched in the Extreme Fear zone. The BTC/USD pair, after a slight upward rebound, is trading around $30.150. The low of the week, as already mentioned, was fixed at $26.580. The last time the pair was so low was in December 2020.
The number of "whales" among bitcoin holders, whose capital exceeds the bar of 1000 BTC, is rapidly declining. This figure has already reached its lows since the beginning of the year. At the same time, the volume of cryptocurrency on the exchanges, on the contrary, is at its maximum over the past three months. According to Glassnode analysts, the average volume of coin inflows to centralized exchanges is now hovering around 1755 BTC.
Galaxy Digital founder Mike Novogratz expressed doubt that the bulls will be able to defend the $30,000 support levels for bitcoin and $2,000 for ethereum. "Until we reach a new equilibrium," he wrote, "digital assets will continue to trade in close correlation with the Nasdaq. Intuition tells us that there will still be a drawdown ahead, and this will occur in a very unstable, volatile and complex market." Mike Novogratz warned that the negative scenario could materialize if the Nasdaq index falls below 11,000 (it hit 11,688 on May 12).
Gold apologist, billionaire Peter Schiff, predicted the main cryptocurrency to collapse below $10,000. And another billionaire veteran of the bitcoin industry, 2020 US presidential candidate Brock Pierce said in an interview with Fox Business that it can be very successful, but it can also fail. "Bitcoin could drop to zero. Here is the binary result. Either there will be $1 million per BTC, or zero," he said.
Pierce believes that the current "cryptocurrency landscape" is very similar to the history of the tech companies' bubble. "The situation is very similar to 1999. The market is now in the same phase. So what happened then? After the dot-com bubble, eBay, Amazon and other interesting companies appeared, but a lot of businesses went bankrupt. But this does not mean that digital assets are unrealistic and will not play an important role in our collective future," the billionaire said. Pierce admitted that he diversified his portfolio, primarily through Ethereum. He also placed a "nine zeros" bet on EOS, converting all of his Block.one shares into cryptocurrency.
Unlike other influencers, ARK Invest CEO Katherine Wood continues to express sustained optimism and believes that the growing correlation between cryptocurrencies and traditional assets indicates that the bearish trend will end soon. The businesswoman opined that the depreciation of bitcoin along with the traditional market is a temporary phenomenon: "Cryptocurrency is a new asset class that should not follow the Nasdaq, but that is what is happening. We are currently in a bearish trend where all assets are moving in the same way and we are seeing one market after another capitulate, but cryptocurrencies may be close to completing it."
The head of ARK Invest believes that the cryptocurrency market will grow exponentially as traditional assets collapse. "The current recession in the stock and bond markets, commodities and cryptocurrency markets is causing negative sentiment among investors. But look at our research… I can't even tell you how confident we are that our products will change the world and are already on an exponential growth trajectory." According to Wood, blockchain is in a technology sector that will grow more than 20 times in the next seven to eight years.
Another hope for investors is that bitcoin is already halfway to its next halving. It happened at block number 735,000 on May 05. This event occurs every 210 thousand blocks, or approximately once every four years, with a little less than 105 thousand blocks left until the next one. The halving date can be predicted to within a couple of days, because the block production time fluctuates around 10 minutes. The previous halving took place on May 11, 2020, and the next one will take place approximately in April 2024.
Halving cycles are one of the main mechanisms of the bitcoin network, which involves halving the BTC reward for miners. Accordingly, the issue of bitcoins is also halved, since miners' rewards are the only source of issuing new coins. From the inception of bitcoin to the first halving, miners were rewarded with 50 BTC per block. Then the amount in bitcoins was reduced to 25 BTC, and in the next cycle to 12.5 BTC. Currently, miners receive 6.25 BTC for mining a block.
And if miners suffer losses due to halving, investors, on the contrary, earn. As observations show, before the first halving, BTC cost about $127, before the second, its price rose to $758, and before the third, to $10,943. It remains to wait for not so long, less than two years, to find out whether there will be a similar explosive rise in the price of BTC in 2024.
EUR/USD Weekly Outlook
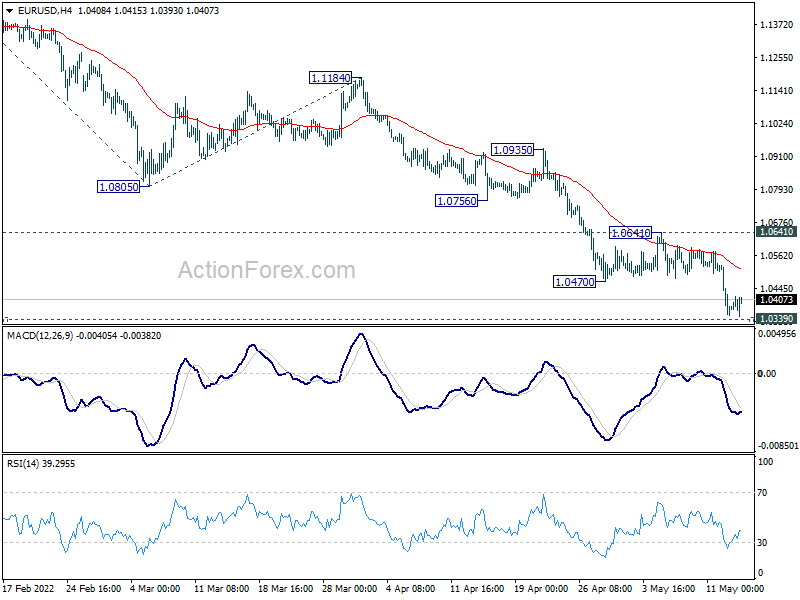
EUR/USD's down trend resumed last week and hit as low as 1.0348. A temporary low is probably formed, just ahead of 1.0399 key support. Initial bias is turned neutral this week for some consolidations. But outlook will stay bearish as long as 1.0641 resistance holds. Decisive break of 1.0339 will carry larger bearish implication and target 161.8% projection of 1.1494 to 1.0805 from 1.1184 at 1.0069. Nevertheless, break of 1.0641 will indicate short term bottoming and turn bias back to the upside for rebound.
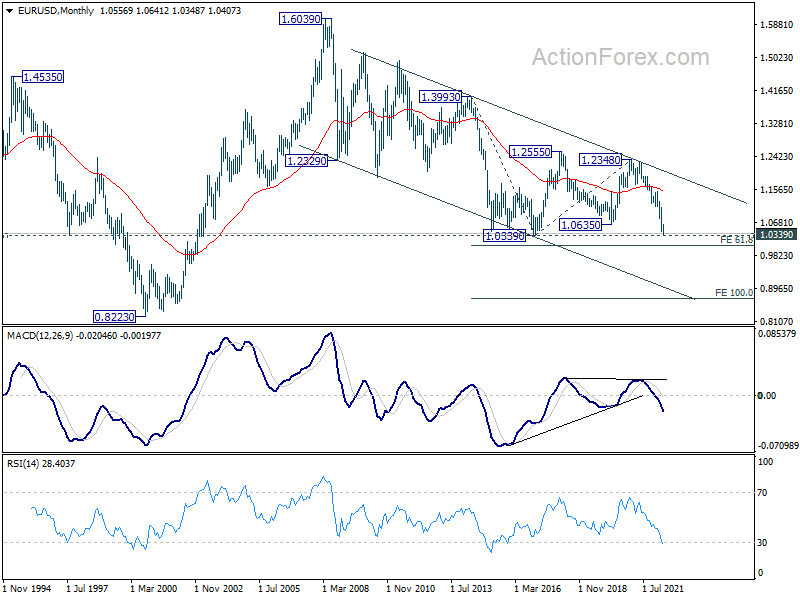
In the bigger picture, break of medium term channel support suggests downside acceleration. Current decline from 1.2348 (2021 high) is probably resuming long term down trend from 1.6039 (2008 high). Decisive break of 1.0339 will confirm this bearish case. Next target is 61.8% projection of 1.3993 to 1.0339 from 1.2348 at 1.0090. This will now remain the favored case as long as 1.0805 support turned resistance holds.
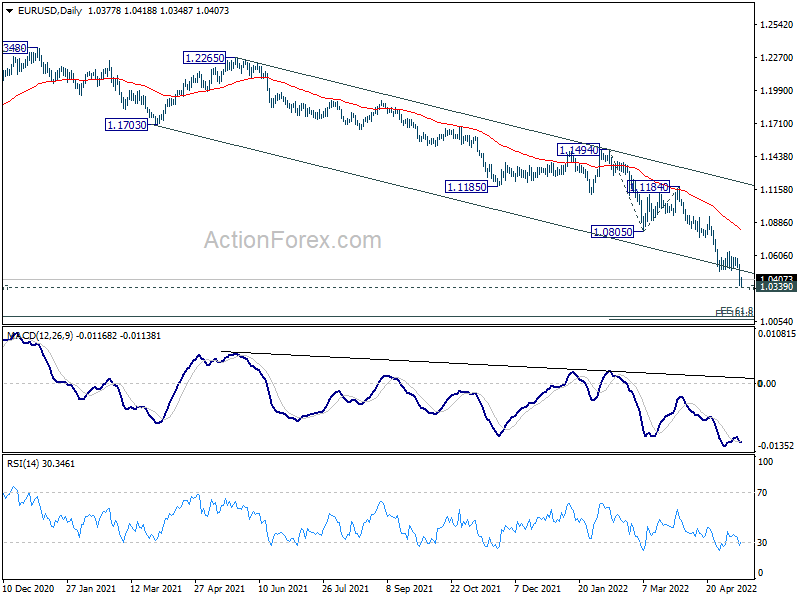
In the long term picture, current development suggests that long term down trend from 1.6039 (2008 high) is ready to resume. Break of 1.0339 will target 61.8% projection of 1.3993 to 1.0339 from 1.2348 at 1.0090. Decisive break there could bring downside acceleration towards 100% projection at 0.8694.
USD/JPY Weekly Outlook
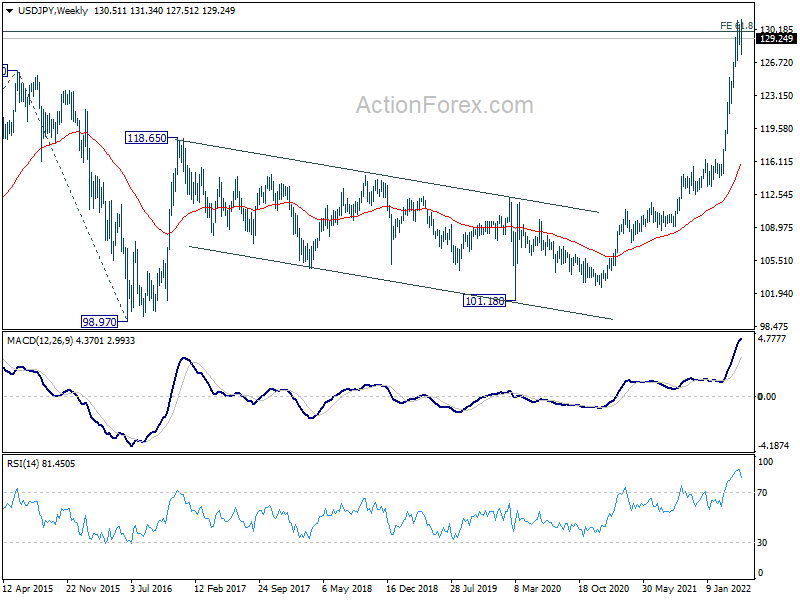
USD/JPY edged higher to 131.34 last week but reversed from there and dropped to 127.51. But as a temporary low is formed, initial bias is neutral this week first. Price actions from 131.34 are seen as correcting the whole rally from 114.40. Hence, rise will stay on the downside as long as 131.34 holds. Below 127.51 will target 125.09 cluster support (38.2% retracement of 114.40 to 131.34 at 124.86).
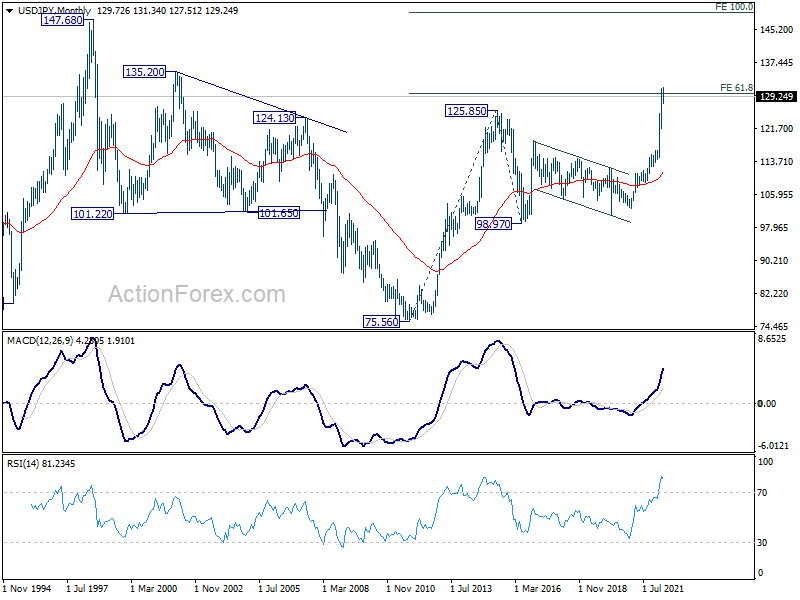
In the bigger picture, current rally is seen as part of the long term up trend form 75.56 (2011 low). Sustained trading above 61.8% projection of 75.56 (2011 low) to 125.85 (2015 high) from 98.97 at 130.04 will pave the way to 100% projection at 149.26, which is close to 147.68 (1998 high). For now, this will remain the favored case as long as 121.27 support holds.
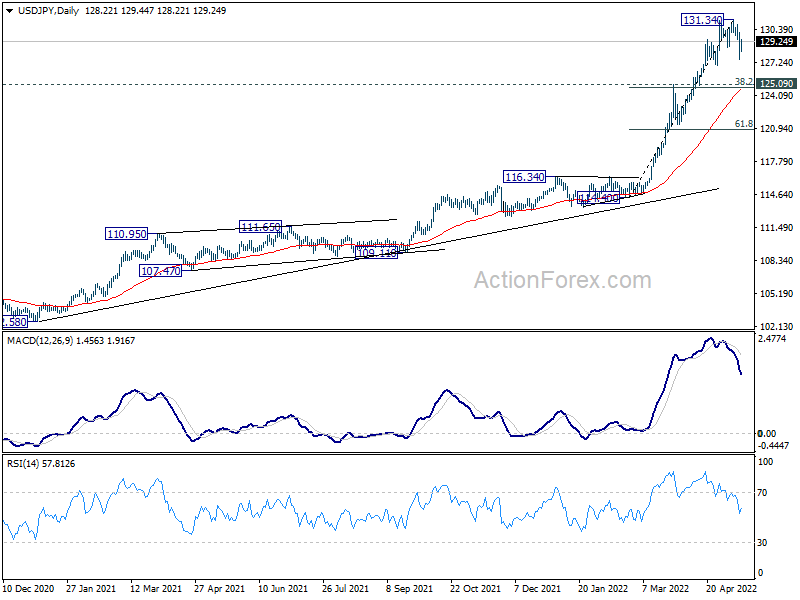
In the long term picture, the up trend from 75.56 (2011 low) long term bottom to 125.85 (2015 high) has just resumed. First target at 61.8% projection of 75.56 to 125.85 from 98.97 at 130.04 was already met. Next is 100% projection at 149.26, which is close to 147.68 (1998 high).
GBP/USD Weekly Outlook
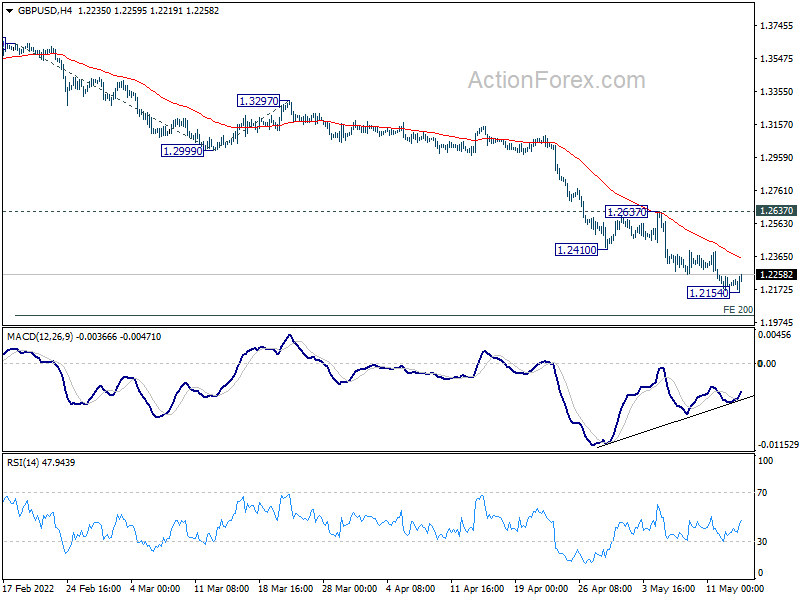
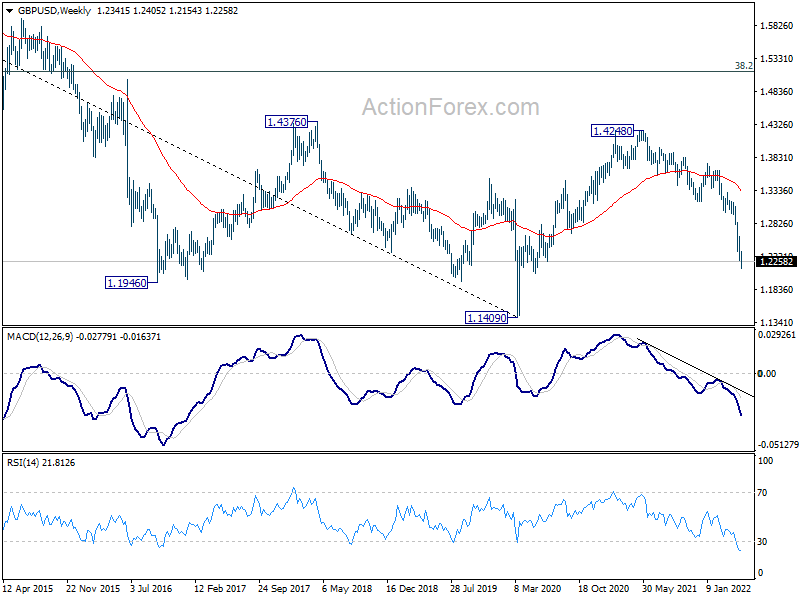
GBP/USD fell further to 1.2154 last week but formed a temporary low and recovered. Initial bias is neutral this week first. Outlook will stay bearish as long as 1.2637 resistance holds. Break of 1.2154 will resume the down trend from 1.4248 to 200% projection of 1.3641 to 1.2999 from 1.3297 at 1.2013 next.
In the bigger picture, based on current momentum, fall from 1.4248 (2018 high) at least at the same degree as the rise from 1.1409 (2020 low). That is, fall from 1.4248 could be a leg inside the pattern from 1.1409, or resuming the longer term down trend. In either case, deeper decline is expected as long as 1.2999 support turned resistance holds. Next target is 1.1409 low.
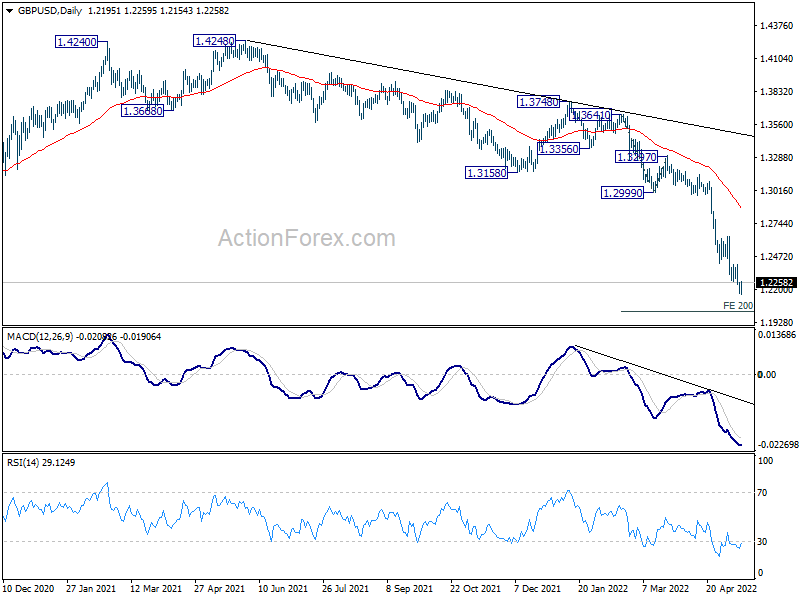
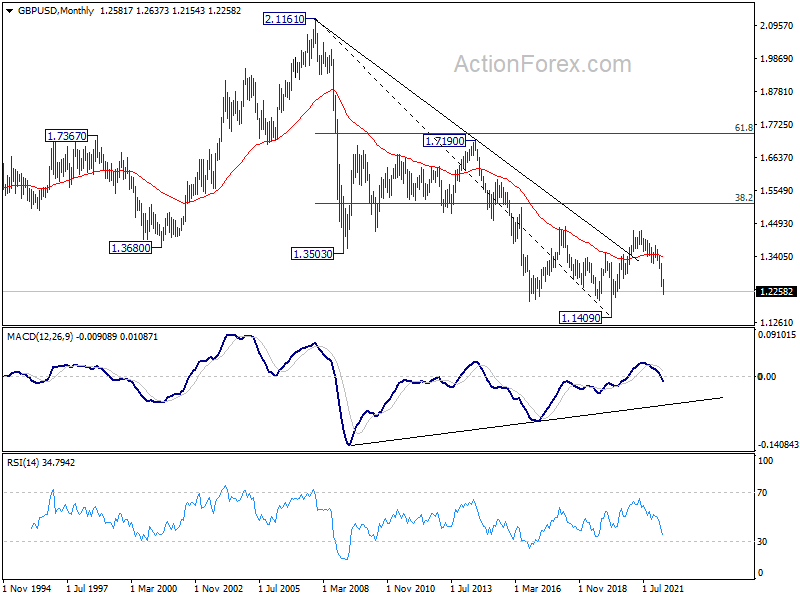
In the longer term picture, rebound from 1.1409 long term bottom should have completed at 1.4248 already, well ahead of 38.2% retracement of 2.1161 to 1.1409 at 1.5134. The development argues that price actions from 1.1409 are developing into a corrective pattern only. That is, long term bearishness is retained for resuming the downside from 2.1161 (2007 high) at a later stage.
USD/CHF Weekly Outlook
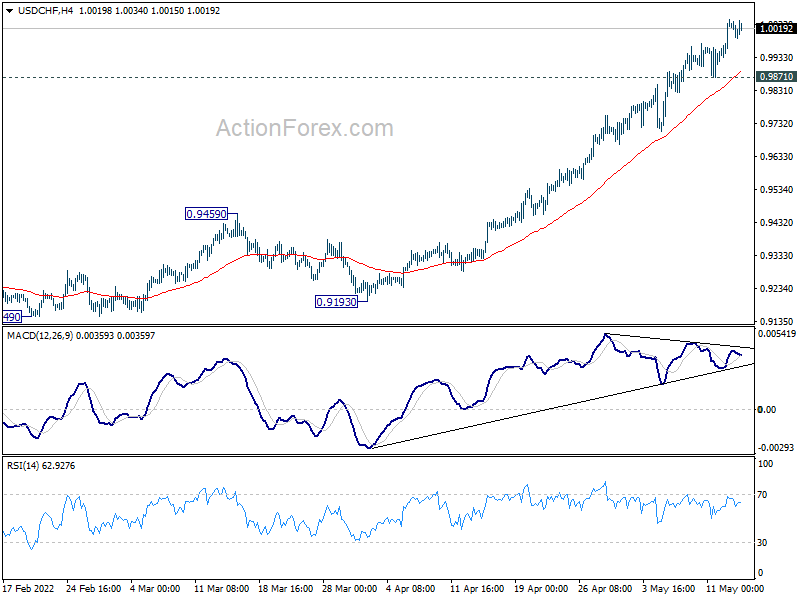
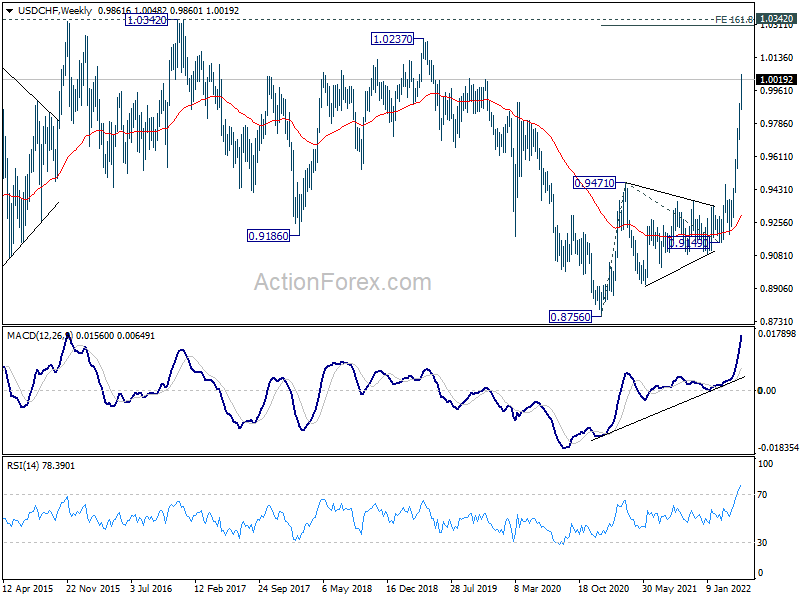
USD/CHF's up trend continued last week and there is no clear sign of topping. Initial bias stays on the upside this week. Next target is 1.0306 medium term fibonacci projection level. On the downside, considering bearish divergence condition in 4 hour MACD, break of 0.9871 support will indicate short term topping, and turn bias to the downside for pull back.
In the bigger picture, down trend from 1.0342 (2016 high) should have completed with three waves down to 0.8756 (2021 low) already. Rise from 0.8756 is likely a medium term up trend of its own. Next target is 161.8% projection of 0.8756 to 0.9471 from 0.9149 at 1.0306, which is close to 1.0342 (2016 high). This will remain the favored case as long as 0.9459 resistance turned support holds.
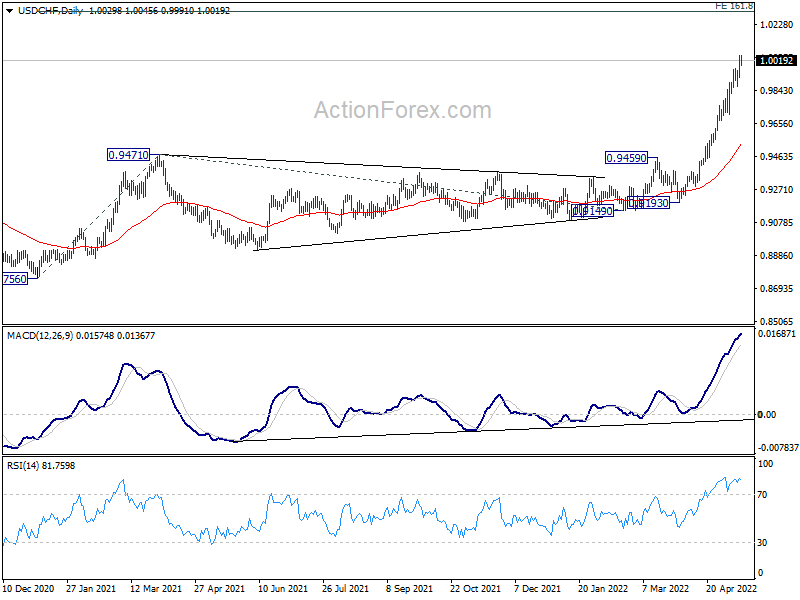
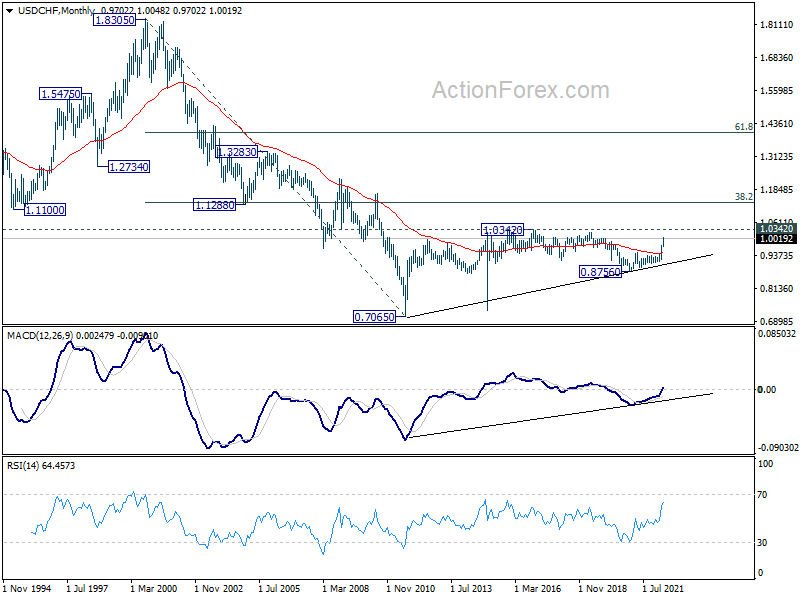
In the long term picture, current development argues that the correction from 1.0342 (2016 high) has completed at 0.8756 (2020 low) already. Rise form 0.7065 (2011 low) might be ready to resume. Firm break of 1.0342 will confirm and target 38.2% retracement of 1.8305 (2000 high) to 0.7065 at 1.1359.
AUD/USD Weekly Outlook
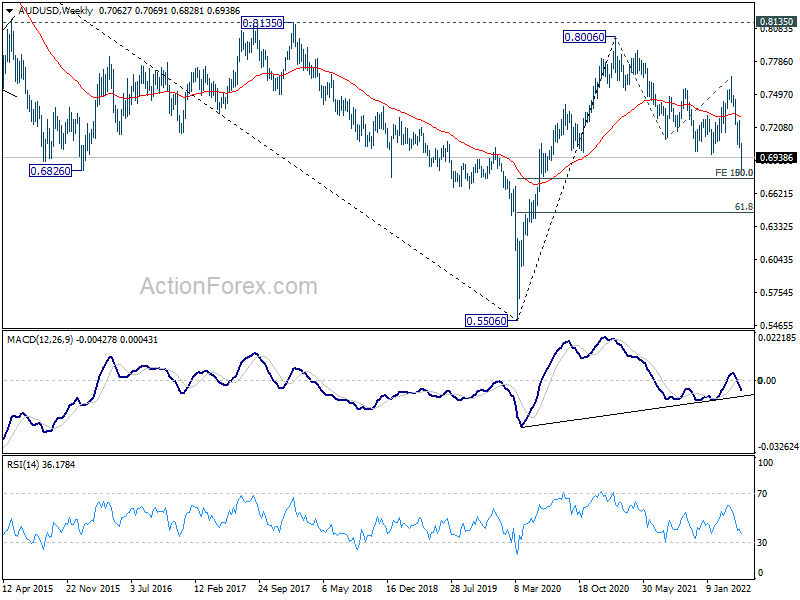
AUD/USD's decline from 0.8006 resumed last week and dropped to as low as 0.6828. But as a temporary low was formed, initial bias is neutral this week first. Outlook will remain bearish as long as 0.7265 resistance holds. Break of 0.6828 will target 0.6756 medium term fibonacci level next.
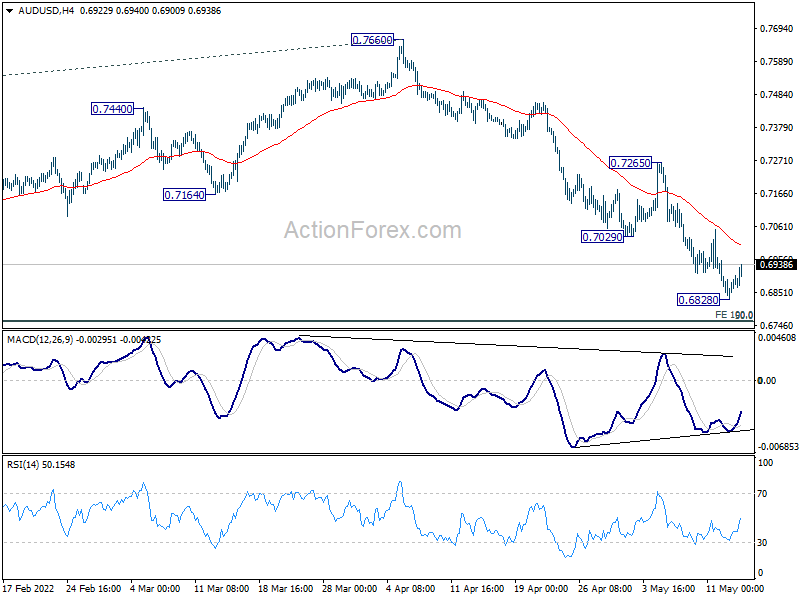
In the bigger picture, price actions from 0.8006 are seen as a corrective pattern to rise from 0.5506 (2020 low). Deeper fall should be seen to 50% retracement of 0.5506 to 0.8006 at 0.6756. This coincides with 100% projection of 0.8006 to 0.7105 from 0.7660 at 0.6760. Strong support is expected from 0.6756/60 cluster to contain downside to complete the correction. However, sustained break of 0.6756/60 would argue that AUD/USD is indeed already in a medium term down trend.
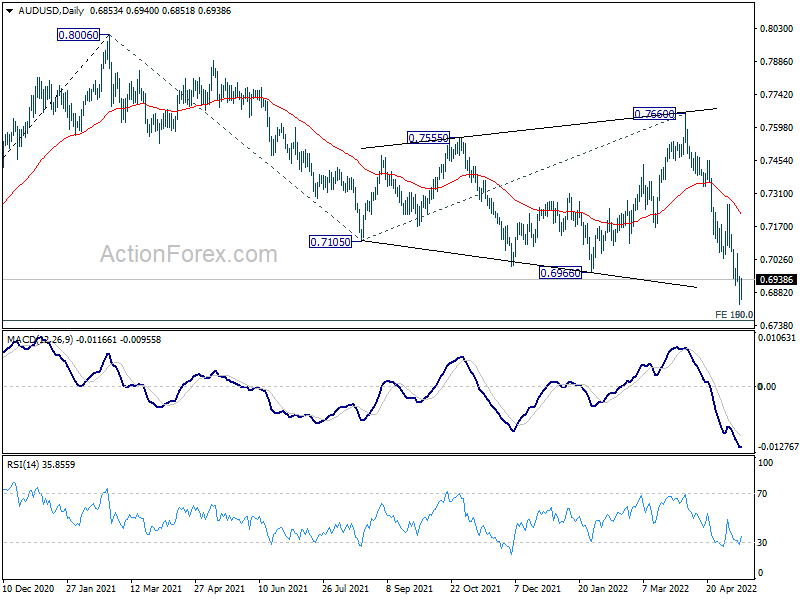
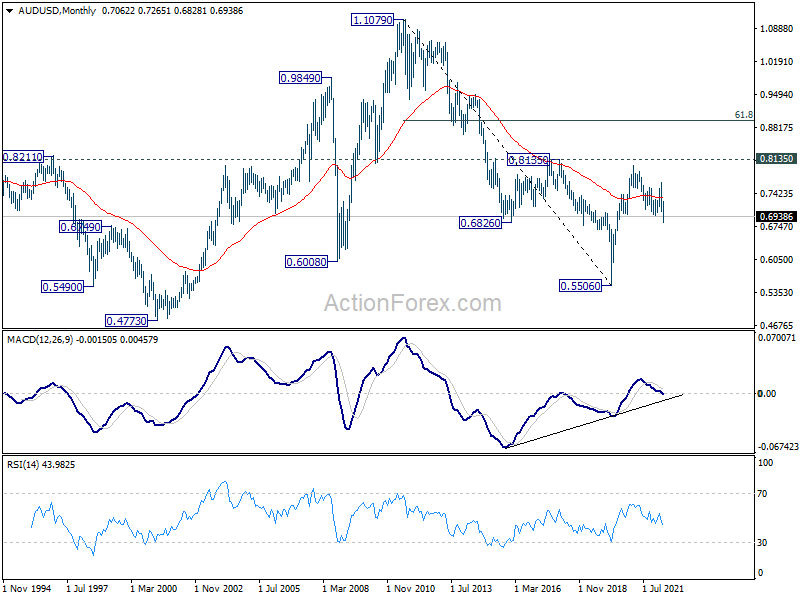
In the longer term picture, focus remains on 0.8135 structural resistance. Decisive break there will argue that rise from 0.5506 is developing into a long term up trend that reverses whole down trend from 1.1079 (2011 high). However, rejection by 0.8135 will keep long term outlook neutral at best.
USD/CAD Weekly Outlook
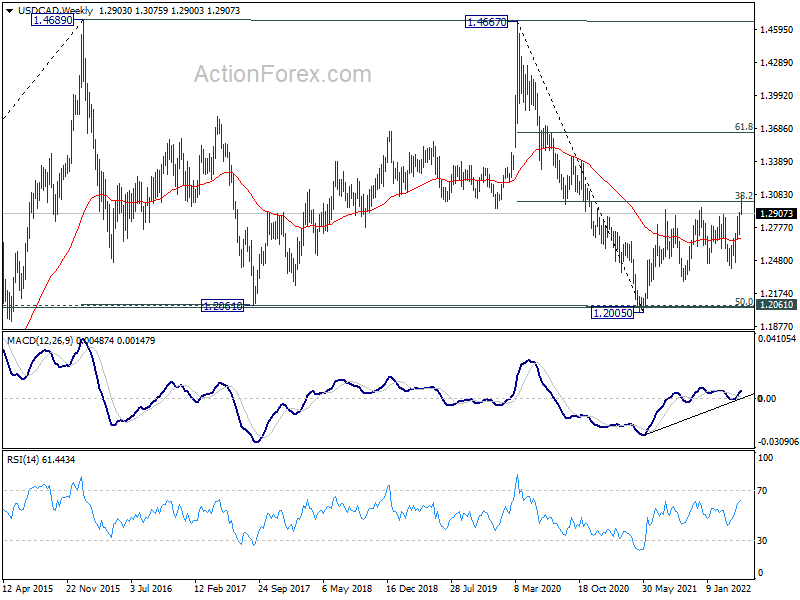
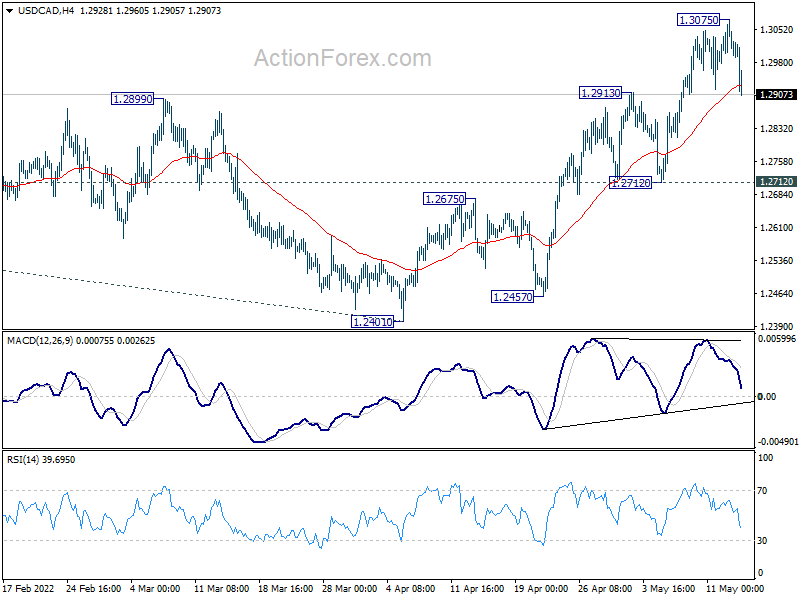
USD/CAD rose further to 1.3075 last week but retreated notably since then. Initial bias is mildly on the downside this week for 1.2712 support. Firm break there will indicate rejection by 1.3022 key fibonacci resistance, and bring deeper decline. On the other hand, break of 1.3075, and sustained trading above 1.3022, will carry larger bullish implications. Next target will be 100% projection of 1.2005 to 1.2947 from 1.2401 at 1.3343.
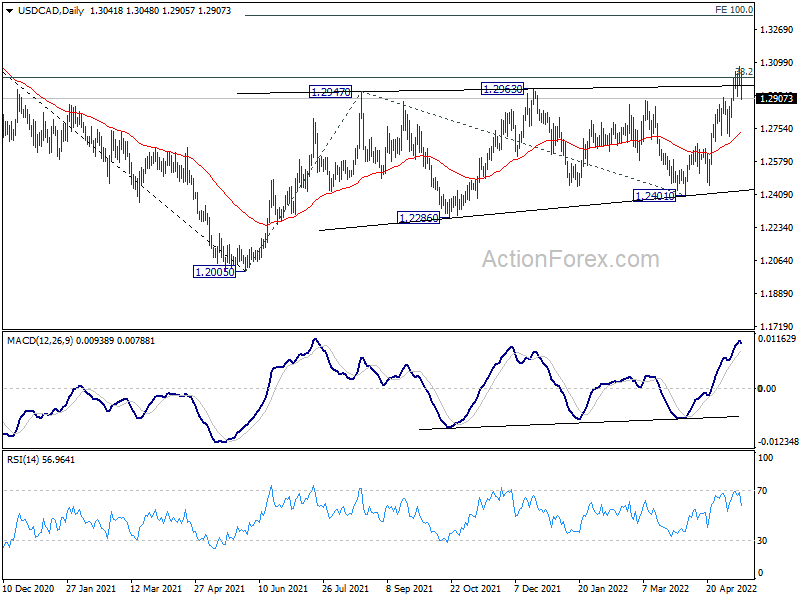
In the bigger picture, focus stays on 38.2% retracement of 1.4667 (2020 high) to 1.2005 (2021 low) at 1.3022. Sustained break there should confirm that the down trend from 1.4667 has completed after defending 1.2061 long term cluster support. Further rise would then be seen towards 61.8% retracement at 1.3650. However, rejection by 1.3022 will maintain medium term bearishness. Break of 1.2005 will resume the down trend from 1.4667 and that carries larger bearish implications too.
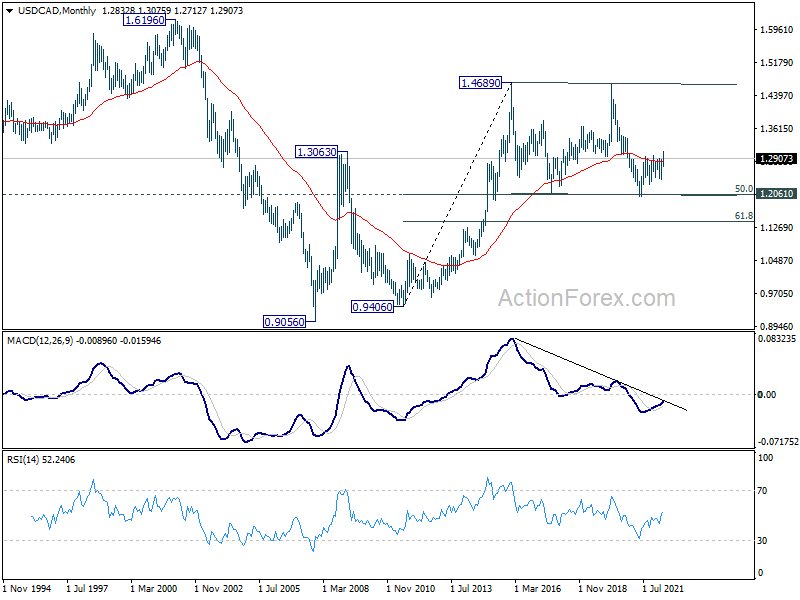
In the longer term picture, price actions from 1.4689 (2016 high) are seen as a consolidation pattern only. That is, up trend from 0.9506 (2007 low) is still expected to resume at a later stage. This will remain the favored case as long as 1.2061 support holds, which is close to 50% retracement of 0.9406 to 1.4689 at 1.2048. However, firm break of 1.2061 support will argue that USD/CAD has already started a long term down trend. Next target is 61.8% retracement of 0.9406 to 1.4689 at 1.1424.