Sample Category Title
USD/CHF Daily Outlook
Daily Pivots: (S1) 0.7550; (P) 0.7667; (R1) 0.7730; More….
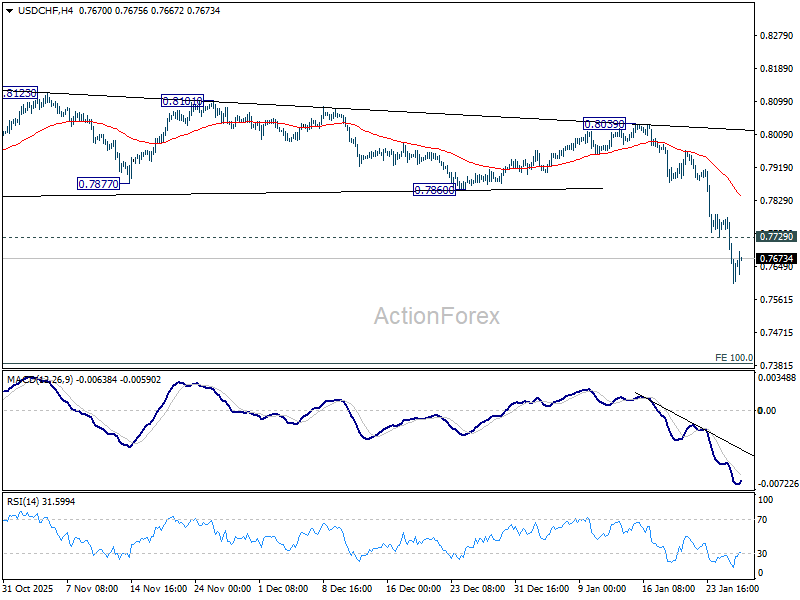
Intraday bias in USD/CHF remains on the downside at this point. Current fall is part of the long term down trend and should target 0.7382 projection level next. On the upside, above 0.7729 minor resistance will turn intraday bias neutral again. But recovery should be limited by 0.7860 support turned resistance and bring another fall.
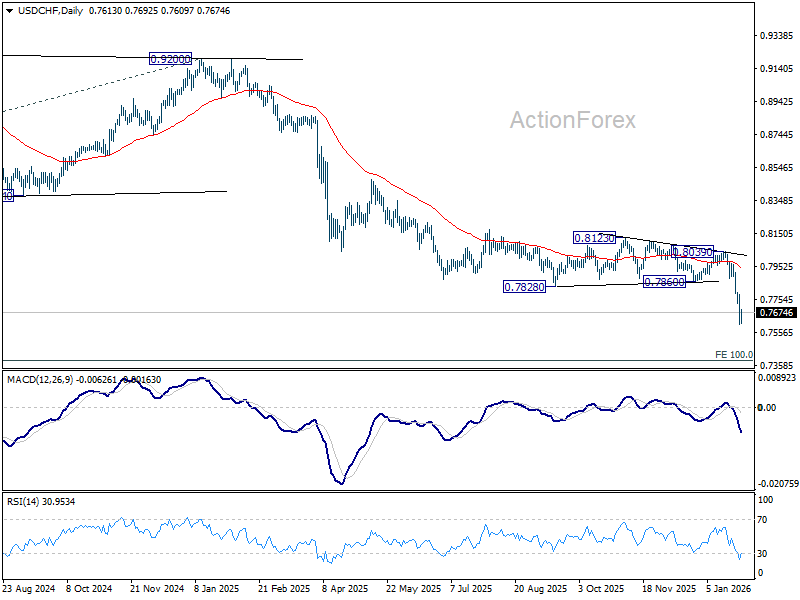
In the bigger picture, larger down trend from 1.0342 (2017 high) is still in progress and resuming. Next target is 100% projection of 1.0146 (2022 high) to 0.8332 from 0.9200 at 0.7382. In any case, outlook will stay bearish as long as 55 W EMA (now at 0.8184) holds.
GBP/USD Daily Outlook
Daily Pivots: (S1) 1.3719; (P) 1.3794; (R1) 1.3923; More...
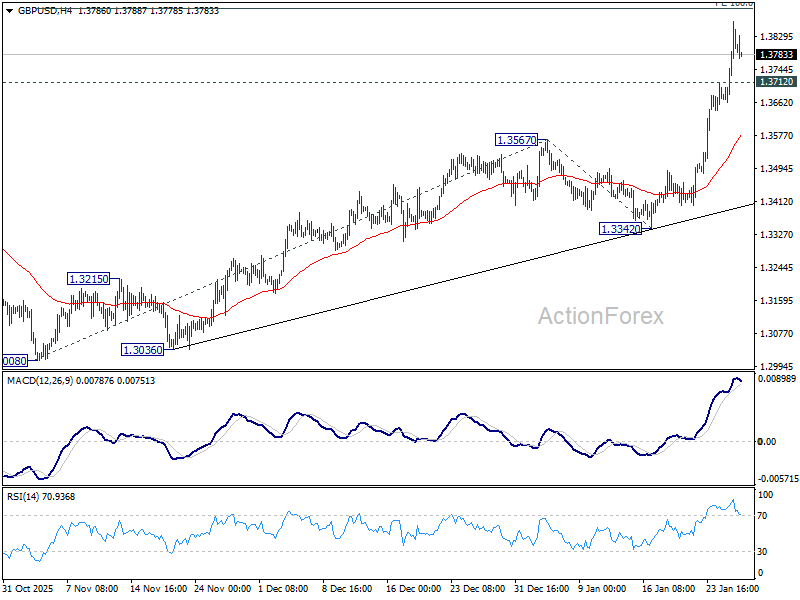
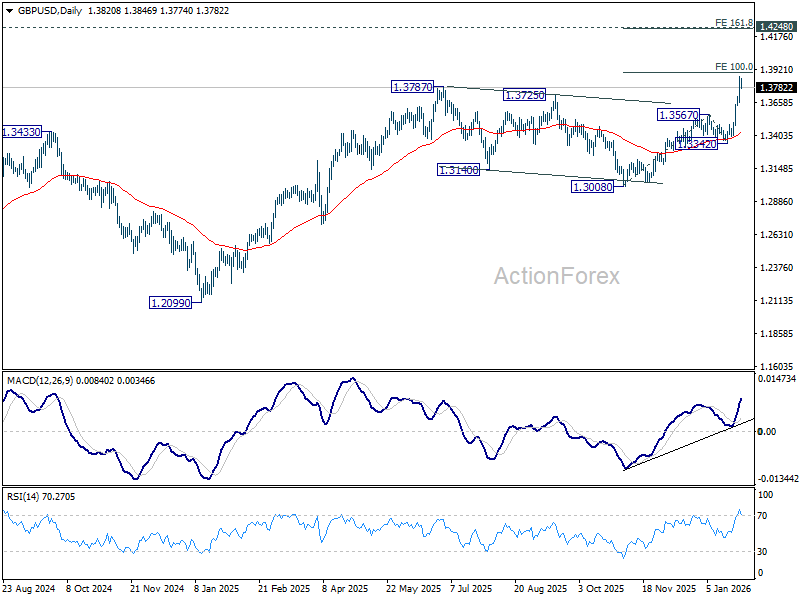
Intraday bias in GBP/USD remains on the upside for 100% projection of 1.3008 to 1.3567 from 1.3342 at 1.3901. Firm break there will pave the way to 161.8% projection at 1.4246, which is close to 1.4248 key structural resistance. On the downside, below 1.3712 minor support will turn intraday bias neutral again first. But retreat should be contained by 1.3567 resistance turned support to bring another rally.
In the bigger picture, rise from 1.0351 (2022 low) is resuming by breaking through 1.3787 high. Further rally should be seen to 1.4284 key resistance (2021 high). Decisive break there will add to the case of long term bullish trend reversal. For now, outlook will stay bullish as long as 1.3008 support holds, even in case of deep pullback.
EUR/USD Updates Four-Year High: Everything Works Against the US Dollar
EUR/USD reached 1.2000 on Wednesday after rising to 1.2082 the previous evening, marking a strong four-day rally. The pressure on the US dollar has intensified following comments from US President Donald Trump. He stated that he was not concerned about the weakening of the dollar, viewing its fall as moderate. The market interpreted this as a signal that the administration might be willing to tolerate a weaker dollar to enhance export competitiveness.
An additional blow to the dollar came from rising political uncertainty in Washington, with Trump making fresh statements about Greenland and continuing to criticise the US Federal Reserve’s independence.
Further compounding the dollar’s decline is growing speculation about a potential joint US-Japan currency intervention to support the yen, which has boosted demand for JPY.
Investors’ focus is on the Federal Reserve’s decision, due later tonight. The Fed is widely expected to maintain its current interest rate, but much attention is on potential signals regarding the timing of future rate cuts. Current expectations suggest two 25-basis-point cuts by the end of the year.
Technical Analysis
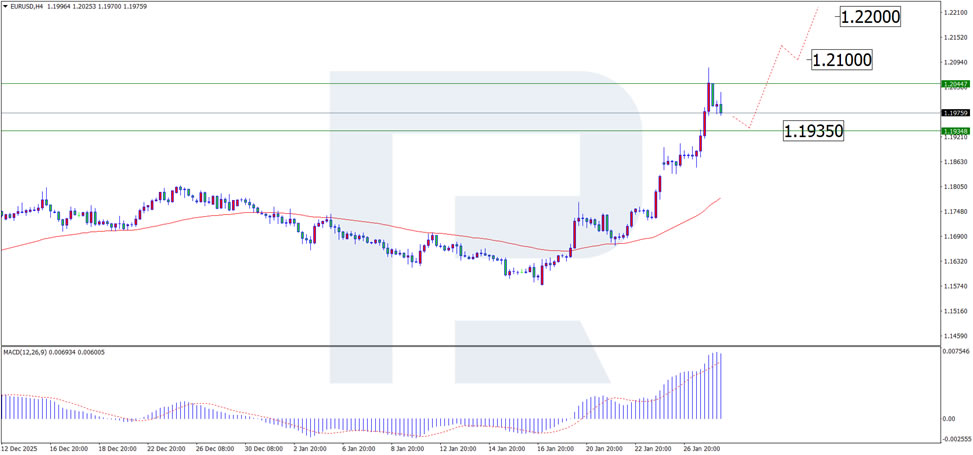
On the H4 chart, EUR/USD has formed an upward wave towards 1.2080. A breakout above this resistance level would signal a continuation of the bullish trend. For now, the pair is in a corrective phase, with support around 1.1935. The correction is confirmed by the MACD indicator, which shows the histogram and signal line above zero and forming a downward wave. After the correction, the upward trend may resume towards 1.2100 and potentially 1.2200, though corrections could occur during the rise.
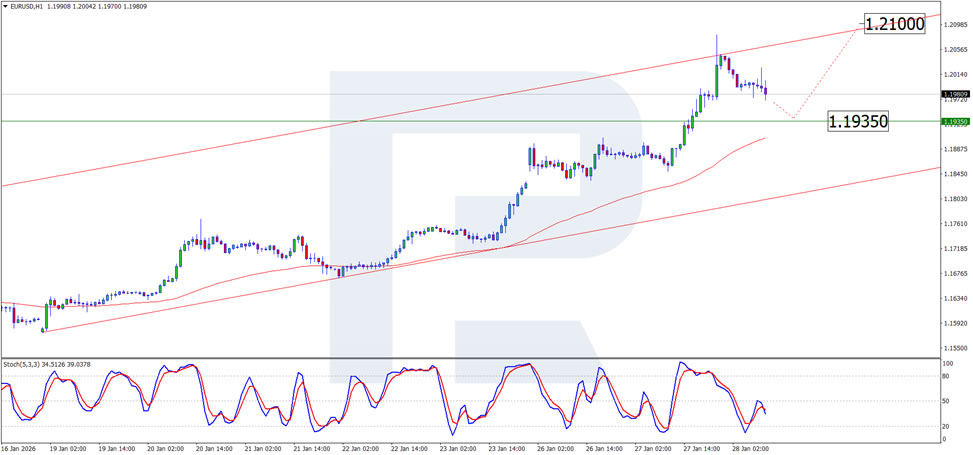
On the H1 chart, after testing resistance, EUR/USD is forming a correction. A rebound from support at 1.1935 would signal a continuation of the bullish wave. The Stochastic indicator’s signal lines are approaching the 20 level, suggesting that the correction may continue before resuming the upward trend. The next target for growth could be 1.2100.
Conclusion
The EUR/USD pair continues to show bullish momentum, supported by a weaker US dollar and rising geopolitical tensions. The ongoing correction might offer buying opportunities, with further growth likely towards 1.2100 and 1.2200, depending on the Fed's upcoming decision and global market dynamics.
EUR/USD Climbs Above 1.2000 After Trump’s Remarks
Expectations of lower Federal Reserve interest rates, recession risks, and the negative fallout from the US stance on Greenland have been among the factors acting as bearish drivers for the dollar in recent weeks.
Additional pressure came from signals that the US may be willing to sell dollars to help Japan strengthen the yen. Yesterday’s comments from Donald Trump then gave the market fresh momentum.
“The dollar is doing great,” Trump replied when asked by a reporter whether he thought it had fallen too sharply recently. Does this mean the president is comfortable with the national currency having lost around 9% during the first year of his term?
Trump’s words triggered a sharp weakening of the US dollar against other currencies. In particular, EUR/USD rose above the psychological 1.2000 level for the first time since 2021.
Technical Analysis of the EUR/USD chart
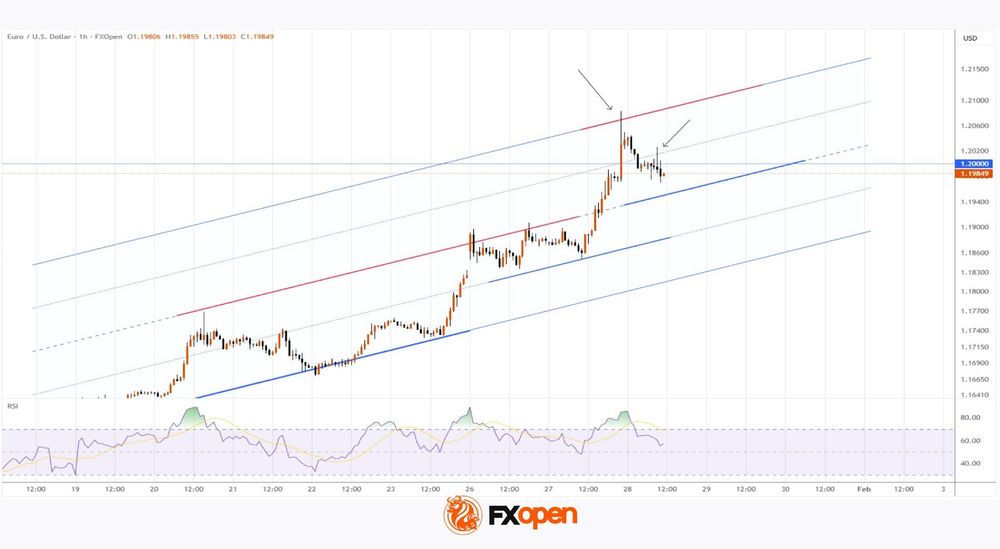
EUR/USD price action towards the end of January formed an ascending channel, within which the upper boundary is acting as resistance.
→ As shown by the first arrow, a long upper wick appeared on the hourly candle, signalling increased selling pressure.
→ The second arrow highlights a similar candle, providing further evidence of seller activity.
The RSI indicator has remained above the 50 level in recent days, confirming the bullish bias, while at the same time creating conditions for a potential pullback.
Should a correction occur, it would allow the channel’s median line to act as support — a level that previously functioned as resistance before being broken.
Given the rapidly shifting news backdrop and frequent comments from officials, further spikes in volatility across currency markets cannot be ruled out.
Trade over 50 forex markets 24 hours a day with FXOpen. Take advantage of low commissions, deep liquidity, and spreads from 0.0 pips (additional fees may apply). Open your FXOpen account now or learn more about trading forex with FXOpen.
This article represents the opinion of the Companies operating under the FXOpen brand only. It is not to be construed as an offer, solicitation, or recommendation with respect to products and services provided by the Companies operating under the FXOpen brand, nor is it to be considered financial advice.
EUR/USD Rally Accelerates Past 1.20, USD/CHF Buckles
EUR/USD started a fresh surge above 1.1900 and 1.2000. USD/CHF declined further and is now struggling below 0.7750.
Important Takeaways for EUR/USD and USD/CHF Analysis Today
- The Euro started a major increase from 1.1700 against the US Dollar.
- There is a key bullish trend line forming with support near 1.1915 on the hourly chart of EUR/USD at FXOpen.
- USD/CHF declined below the 0.7800 and 0.7750 support levels.
- There is a key bearish trend line forming with resistance near 0.7675 on the hourly chart at FXOpen.
EUR/USD Technical Analysis
On the hourly chart of EUR/USD at FXOpen, the pair started a fresh increase from the 1.1700 zone. The Euro cleared the 1.1850 barrier to move into a bullish zone against the US Dollar.
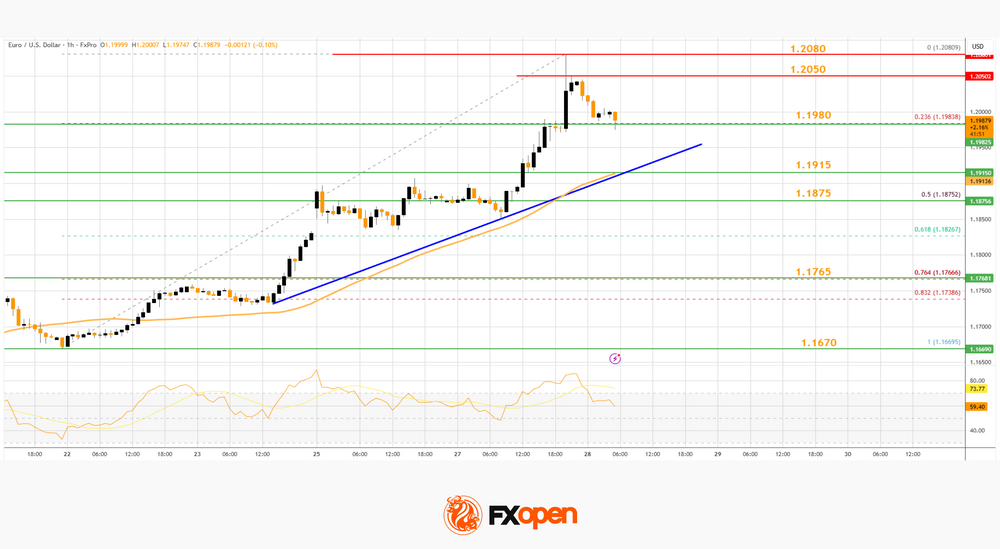
The bulls pushed the pair above the 50-hour simple moving average and 1.1950. Finally, the pair cleared 1.2000 and 1.2050. A high was formed near 1.2080 and the pair is now consolidating gains. There was a minor pullback to the 23.6% Fib retracement level of the upward wave from the 1.1669 swing low to the 1.2080 high.
An Immediate bid zone on the downside is near a connecting bullish trend line at 1.1915 and the 50-hour simple moving average. The next area of interest could be near the 50% Fib retracement at 1.1875.
A downside break below 1.1875 might send the pair toward 1.1765. Any more losses might send the pair into a bearish zone toward 1.1670.
If there is a fresh increase, an immediate hurdle on the EUR/USD chart is 1.2050. The first major pivot level for the bulls could be 1.2080. An upside break above 1.2080 might send the pair to 1.2120. The next selling zone could be 1.2150. Any more gains might open the doors for a move toward 1.2200.
USD/CHF Technical Analysis
On the hourly chart of USD/CHF at FXOpen, the pair started a fresh decline from well above 0.7880. The US Dollar dropped below 0.7800 to move into a negative zone against the Swiss Franc.
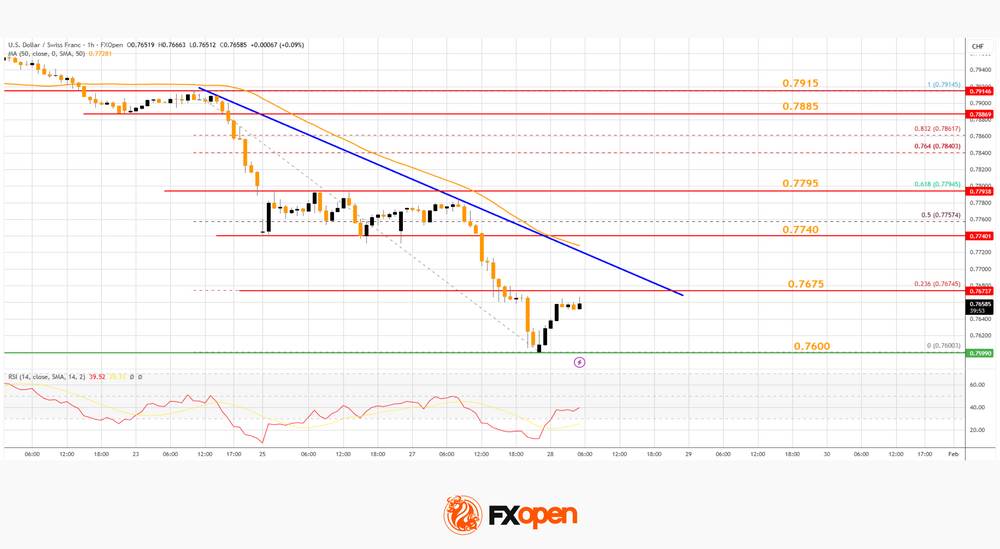
The bears pushed the pair below the 50-hour simple moving average and 0.7750. Finally, the bulls appeared near 0.7600. A low was formed near 0.7600, and the pair is now consolidating losses. There was a minor recovery toward the 23.6% Fib retracement level of the downward move from the 0.7914 swing high to the 0.7600 low.
On the upside, the pair could face bears near 0.7675 and a key bearish trend line. The first major resistance sits near the 50-hour simple moving average at 0.7740. The main barrier for an upside break could be near the 61.8% Fib retracement at 0.7795.
A daily close above 0.7795 could start a fresh increase. In the stated case, the pair could rise toward 0.7885. The next stop for the bulls might be 0.7915.
On the downside, immediate support on the USD/CHF chart is 0.7600. The first major breakdown zone could be 0.7565. A close below 0.7565 might send the pair to 0.7730. Any more losses may possibly open the doors for a move toward 0.7700 in the coming days.
Trade over 50 forex markets 24 hours a day with FXOpen. Take advantage of low commissions, deep liquidity, and spreads from 0.0 pips (additional fees may apply). Open your FXOpen account now or learn more about trading forex with FXOpen.
This article represents the opinion of the Companies operating under the FXOpen brand only. It is not to be construed as an offer, solicitation, or recommendation with respect to products and services provided by the Companies operating under the FXOpen brand, nor is it to be considered financial advice.
EUR/USD Daily Outlook
Daily Pivots: (S1) 1.1902; (P) 1.1992; (R1) 1.2134; More….
EUR/USD's rally is still in progress and breached 1.2 psychological level before retreating slightly. Intraday bias stays on the upside. Decisive break above 1.2 will carry larger bullish implications. Next near term target will be 38.2% projection of 1.0176 to 1.1917 from 1.1576 at 1.3434. On the downside, below 1.1906 minor support will turn intraday bias neutral first. But outlook will stay bullish as long as 1.1576 support holds, even in case of deep pullback.
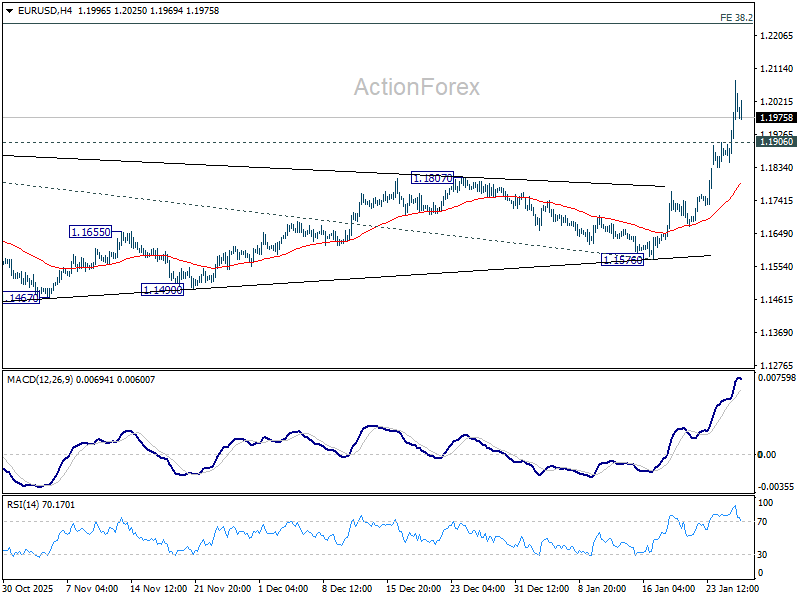
In the bigger picture, as long as 55 W EMA (now at 1.1443) holds, up trend from 0.9534 (2022 low) is still in favor to continue. Decisive break of 1.2 key psychological level will add to the case of long term bullish trend reversal. Next medium term target will be 138.2% projection of 0.9534 to 1.1274 from 1.0176 at 1.2581. However, sustained trading below 55 W EMA will argue that rise from 0.9534 has completed as a three wave corrective bounce, and keep long term outlook bearish.
Dollar Breaches 1.2 Against Euro, Selloff Deepens as Trump Welcomes Weakness
Dollar’s selloff extended through the week, only managing a brief pause after slipping through the key psychological level of 1.2 against Euro briefly. While the pace of decline has slowed, there is little sign of a meaningful recovery taking shape. The bounce has so far been shallow. And, Dollar remains under pressure on multiple fronts, with headwinds increasingly coming from within the US rather than from external shocks or data surprises.
Markets took particular note of remarks from US President Donald Trump, who expressed clear comfort with Dollar’s decline. In a market accustomed to verbal pushback against sharp currency moves, the lack of resistance from the White House has been interpreted as a green light for further weakness.
Asked directly whether the Dollar had fallen too far after sliding about 10% over the past year, Trump dismissed the concern, saying the currency was “doing great” and pointing to strong business activity as justification. Trump also revisited his long-standing complaints about Asian currencies, recalling past disputes with Japan and China over devaluation. The contrast between those confrontations and his current stance reinforces the impression that a weaker Dollar is no longer seen as a problem.
Such remarks matter for markets. When the President signals indifference—or endorsement—toward currency depreciation, it emboldens traders to maintain pressure rather than anticipate a policy-backed rebound.
Adding to the unease, IMF Managing Director Kristalina Georgieva said earlier this week that the Fund is preparing for scenarios involving sharp selloffs in US dollar-denominated assets. While framed as contingency planning, the comments highlights growing institutional awareness of tail risks around the Dollar. Georgieva noted that the IMF is stress-testing “unthinkable” scenarios, including potential runs on Dollar assets, as part of its broader surveillance work. Even without assigning probabilities, the acknowledgement adds to a fragile confidence backdrop.
In currency markets, the impact is clear. For the week so far, Dollar sits at the bottom of the performance table, followed by Loonie and Sterling. At the other end, Yen remains the strongest, supported by lingering intervention threats, though follow-through buying has been limited. Swiss Franc is the second strongest, with gains against both Euro and Sterling pointing to underlying risk aversion. Aussie ranks third, buoyed by strong inflation data that has all but confirmed an RBA rate hike next week. Euro and Kiwi trade in the middle of the pack.
Australia CPI surges to 3.6% in Q4, 3.8% in December
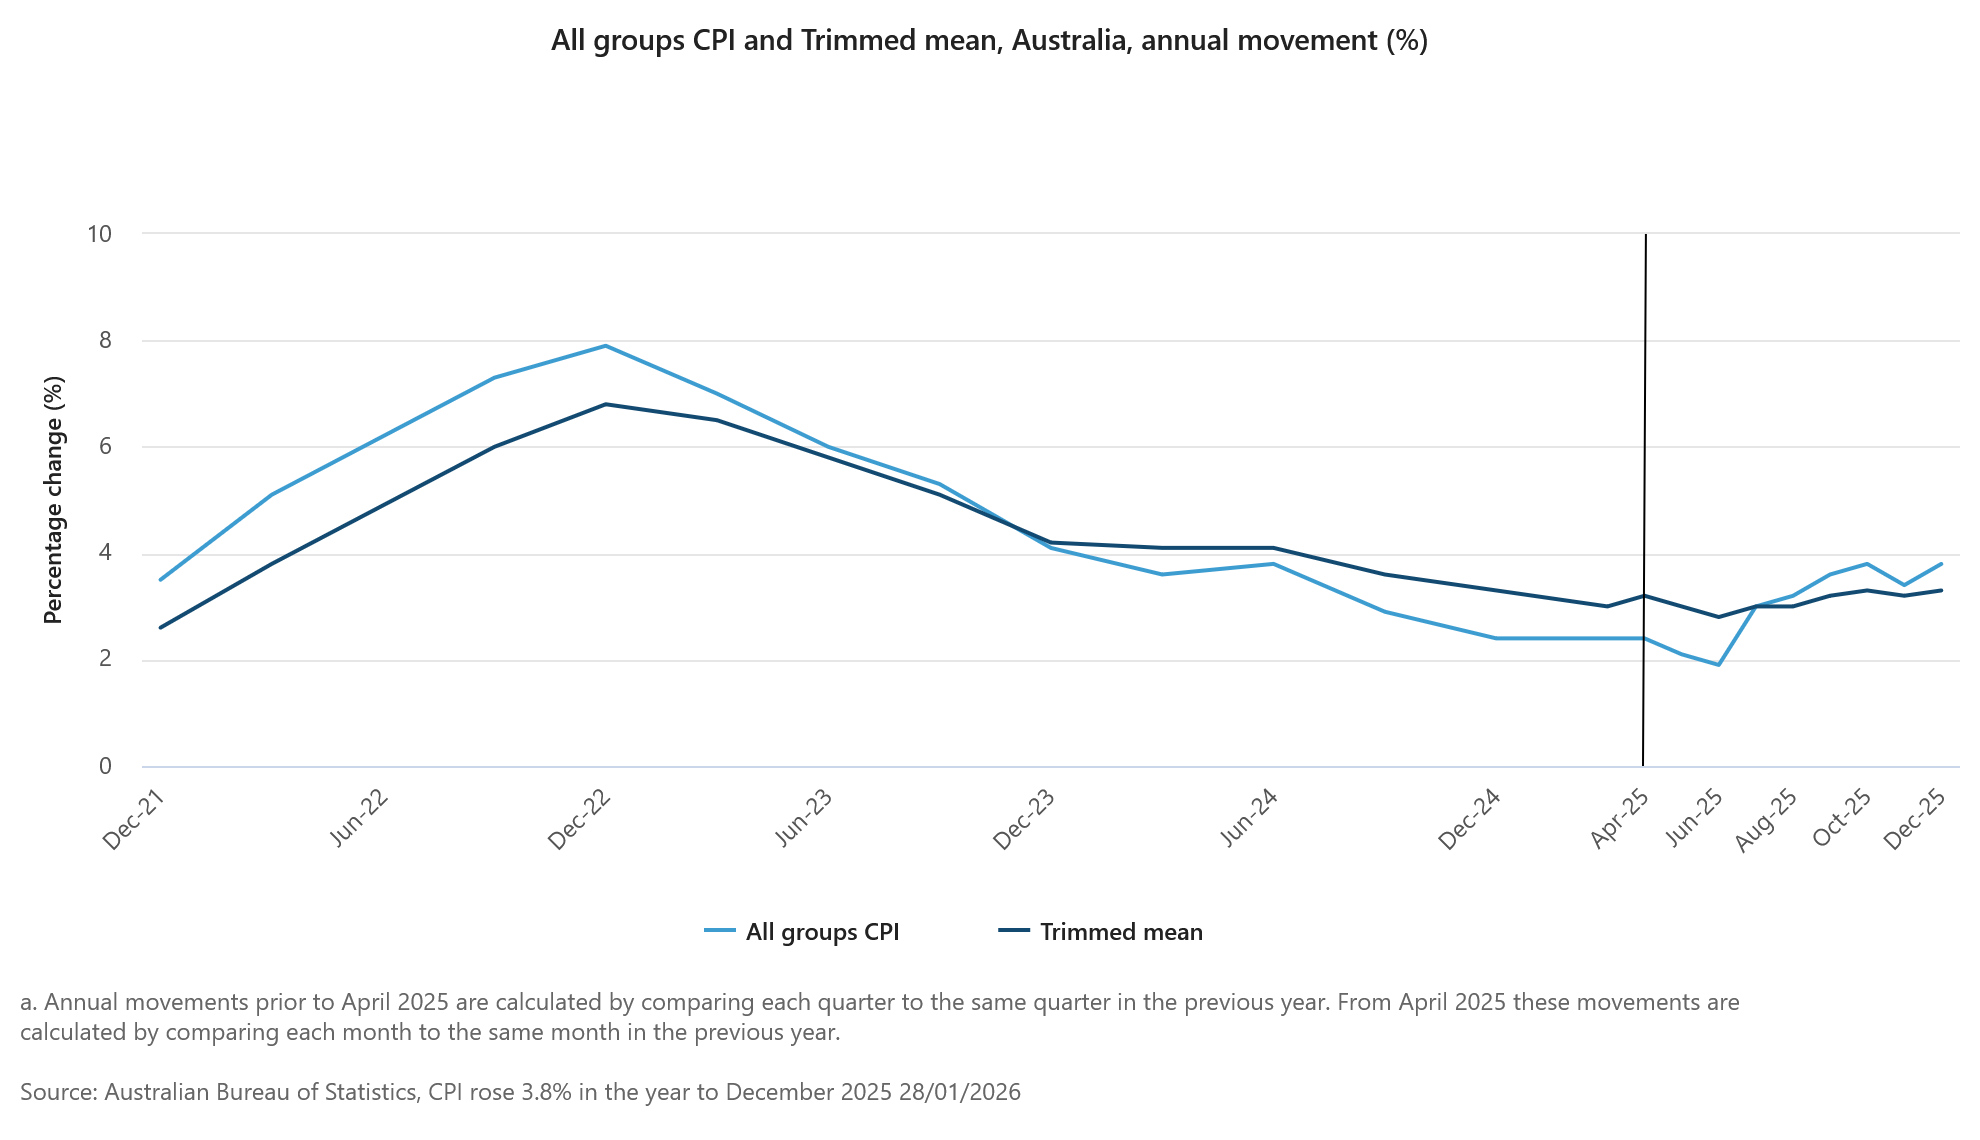
Australia’s Q4 CPI showed little relief for RBA where it matters most for policy. Headline inflation rose 0.6% qoq, slightly below expectations of 0.7% and slowing sharply from the prior quarter’s 1.3% gain. However, on an annual basis, CPI accelerated from 3.2% yoy to 3.6% yoy, matching forecasts and keeping inflation well above the RBA’s target band.
The more important signal came from underlying inflation. Trimmed mean CPI rose 0.9% qoq, easing marginally from 1.0% previously but beating expectations of 0.8%. Annual trimmed mean inflation climbed from 3.0% yoy to 3.4% yoy, above the expected 3.2%, reinforcing concerns that price pressures remain persistent.
December’s monthly details added to that unease. Headline CPI jumped 1.0% mom, lifting the annual rate from 3.5% yoy to 3.8%, both above expectations. Trimmed mean CPI rose a more modest 0.2% mom, but annual core inflation still edged up from 3.2% yoy to 3.3% yoy.
Price pressures remain broad in December. Goods inflation accelerated from 3.2% yoy to 3.4%, driven largely by a 21.5% surge in electricity prices. Services inflation climbed from 3.6% yoy to 4.1%, led by domestic travel and accommodation and rising rents.
Markets are now firming up their expectation that RBA will return to rate hike in February.
AUD/USD surges past 0.70 as RBA hike solidify, 0.72 the test for long term strength
Australian Dollar extended its rally this week, with AUD/USD breaking above 0.70 psychological level. The move has been supported by broad-based Dollar weakness, but domestic factors have played a central role following Australia’s stronger-than-expected inflation data.
December CPI showed another month of acceleration, while Q4 headline inflation printed at 3.6%. More importantly for policymakers, trimmed mean CPI at 3.4% underscored persistent underlying inflation that sits uncomfortably above the RBA’s target band. That inflation shock has quickly filtered into economist forecasts. Westpac and ANZ revised their outlooks, now expecting the RBA to raise the cash rate at its upcoming meeting next week. All four major Australian banks now forecast a 25bp hike back to 3.85%.
The key uncertainty now lies beyond the initial move. The question is whether the RBA would signal scope for a more extended tightening cycle, or frame the hike as a one-off adjustment designed to reassert inflation control.
Technically, AUD/USD remains in clear upward acceleration, with D MACD still pointing higher. The advance from 0.5913 is on track toward its 100% projection of 0.5913 to 0.6706 from 0.6420 at 0.7213 next. On the downside, below 0.6901 support will bring consolidations first. But downside should be contained above 0.6706 resistance turned support to bring another rally.
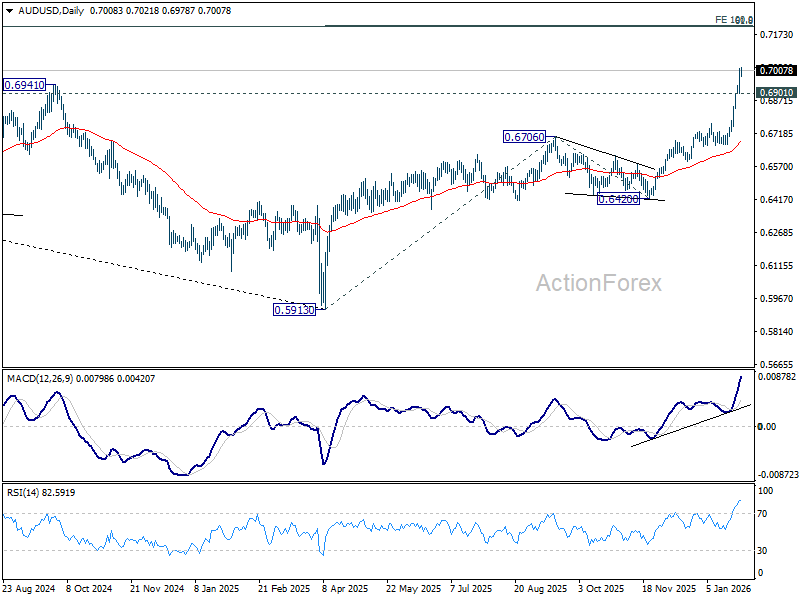
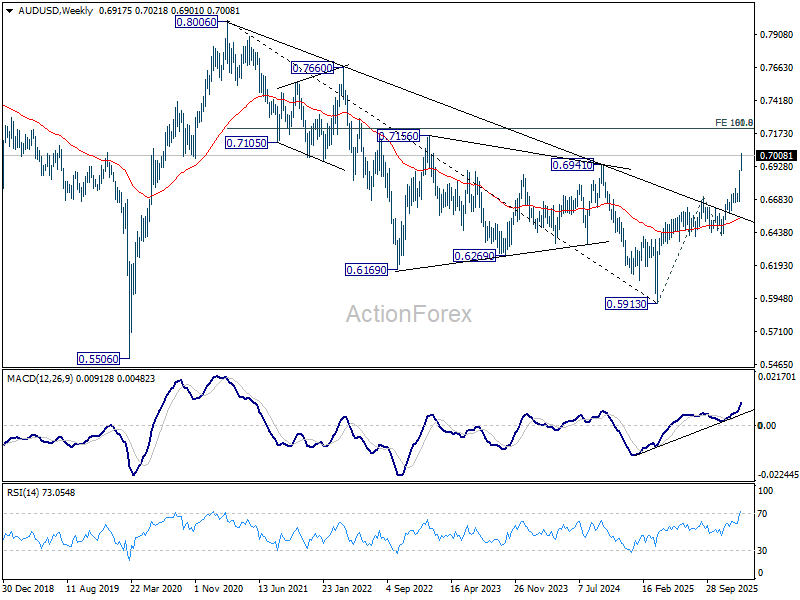
More importantly, the decisive break above 0.6941 structural resistance this week strengthens the case that the rise from 0.5913 is reversing the entire decline from the 0.8006 (2020 high). Next target is 61.8% retracement of 0.8006 to 0.5913 at 0.7206, which is close to the above 0.7213 projection level.
Reactions to this 0.72 resistance zone will decide whether current rise from 0.5913 is the third leg of the pattern from 0.5506 (2020 low), and open the door to further medium up trend through 0.8006.
Fed and BoC holds unlikely to alter USD/CAD downtrend
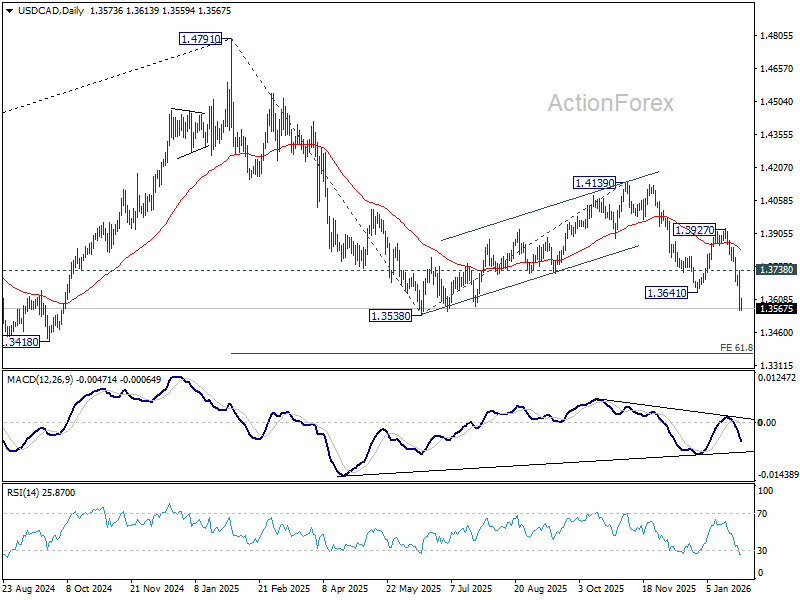
Two major central bank decisions from North America headline the day, with both the BoC and the Fed widely expected to keep interest rates unchanged. USD/CAD, meanwhile, is unlikely to see its broader trend altered by either decision. The current selloff would likely continue through 1.3538 low as driven by the overall selloff in Dollar.
For the BoC, markets expect rates to remain at 2.25%, the lower bound of the bank’s estimated 2.25–3.25% neutral range. A recent Reuters poll showed nearly 75% of economists expect the BoC to keep policy unchanged through 2026.
At this stage, the BoC appears comfortable with a prolonged wait-and-see stance. However, slack remains in the labour market, growth momentum is uncertain, and policy is not yet clearly stimulative despite the 275bp of rate cuts delivered between June 2024 and October 2025.
Hence, if policy does move again this year, risks are tilted toward further cuts rather than hikes. That bias hinges heavily on trade outcomes. As long as key sectors retain preferential access to the US—either through deals or prolonged negotiations—the growth outlook remains intact.
However, should tariffs expand to a broader range of industries, the drag on activity would intensify. In that scenario, the BoC would likely be forced to resume easing to cushion the economic impact.
Turning to the Fed, rates are expected to remain unchanged at 3.50–3.75%, making this very much a holding meeting. Markets will be listening closely for any shift in tone that hints at future action rather than focusing on the decision itself.
Voting dynamics will be watched carefully. Stephen Miran, a known dove, is expected to dissent in favor of a cut. Any additional votes for easing beyond Miran would be interpreted as a clear dovish signal.
For now, the Fed is expected to remain on hold through the remainder of Jerome Powell’s term in May. Markets price roughly a 63% chance of a June cut, but conviction remains limited given multiple wild cards, including economic data, trade relations, financial market stability, and President Donald Trump’s choice of the next Fed chair.
Technically, for USD/CAD, current decline should continue as long as 1.3738 resistance holds. It's seen as part of the downtrend from 14791. Break of 1.3538 will pave the way to 61.8% projection of 1.4791 to 1.3538 from 1.4139 at 1.3365 in the near term.
EUR/USD Daily Outlook
Daily Pivots: (S1) 1.1902; (P) 1.1992; (R1) 1.2134; More….
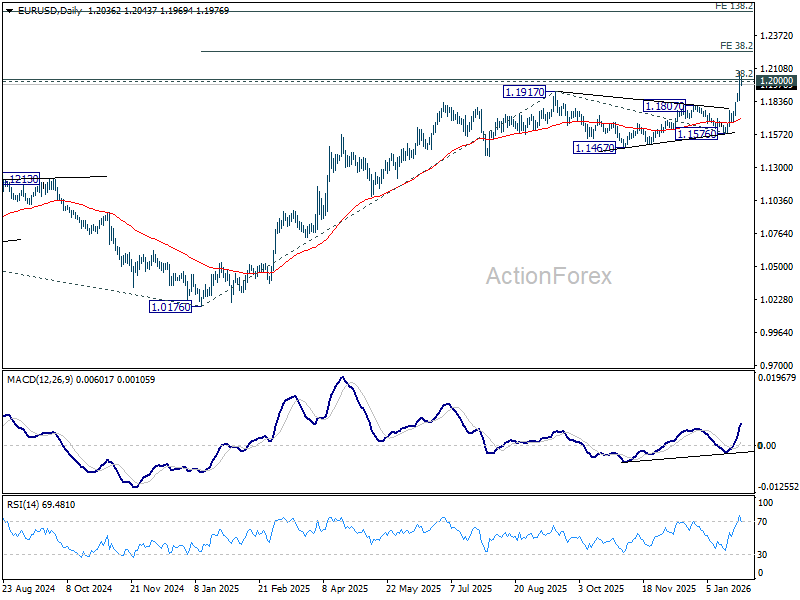
EUR/USD's rally is still in progress and breached 1.2 psychological level before retreating slightly. Intraday bias stays on the upside. Decisive break above 1.2 will carry larger bullish implications. Next near term target will be 38.2% projection of 1.0176 to 1.1917 from 1.1576 at 1.3434. On the downside, below 1.1906 minor support will turn intraday bias neutral first. But outlook will stay bullish as long as 1.1576 support holds, even in case of deep pullback.
In the bigger picture, as long as 55 W EMA (now at 1.1443) holds, up trend from 0.9534 (2022 low) is still in favor to continue. Decisive break of 1.2 key psychological level will add to the case of long term bullish trend reversal. Next medium term target will be 138.2% projection of 0.9534 to 1.1274 from 1.0176 at 1.2581. However, sustained trading below 55 W EMA will argue that rise from 0.9534 has completed as a three wave corrective bounce, and keep long term outlook bearish.
Fed and BoC holds unlikely to alter USD/CAD downtrend
Two major central bank decisions from North America headline the day, with both the BoC and the Fed widely expected to keep interest rates unchanged. USD/CAD, meanwhile, is unlikely to see its broader trend altered by either decision. The current selloff would likely continue through 1.3538 low as driven by the overall selloff in Dollar.
For the BoC, markets expect rates to remain at 2.25%, the lower bound of the bank’s estimated 2.25–3.25% neutral range. A recent Reuters poll showed nearly 75% of economists expect the BoC to keep policy unchanged through 2026.
At this stage, the BoC appears comfortable with a prolonged wait-and-see stance. However, slack remains in the labour market, growth momentum is uncertain, and policy is not yet clearly stimulative despite the 275bp of rate cuts delivered between June 2024 and October 2025.
Hence, if policy does move again this year, risks are tilted toward further cuts rather than hikes. That bias hinges heavily on trade outcomes. As long as key sectors retain preferential access to the US—either through deals or prolonged negotiations—the growth outlook remains intact.
However, should tariffs expand to a broader range of industries, the drag on activity would intensify. In that scenario, the BoC would likely be forced to resume easing to cushion the economic impact.
Turning to the Fed, rates are expected to remain unchanged at 3.50–3.75%, making this very much a holding meeting. Markets will be listening closely for any shift in tone that hints at future action rather than focusing on the decision itself.
Voting dynamics will be watched carefully. Stephen Miran, a known dove, is expected to dissent in favor of a cut. Any additional votes for easing beyond Miran would be interpreted as a clear dovish signal.
For now, the Fed is expected to remain on hold through the remainder of Jerome Powell’s term in May. Markets price roughly a 63% chance of a June cut, but conviction remains limited given multiple wild cards, including economic data, trade relations, financial market stability, and President Donald Trump’s choice of the next Fed chair.
Technically, for USD/CAD, current decline should continue as long as 1.3738 resistance holds. It's seen as part of the downtrend from 14791. Break of 1.3538 will pave the way to 61.8% projection of 1.4791 to 1.3538 from 1.4139 at 1.3365 in the near term.
AUD/USD surges past 0.70 as RBA hike solidify, 0.72 the test for long term strength
Australian Dollar extended its rally this week, with AUD/USD breaking above 0.70 psychological level. The move has been supported by broad-based Dollar weakness, but domestic factors have played a central role following Australia’s stronger-than-expected inflation data.
December CPI showed another month of acceleration, while Q4 headline inflation printed at 3.6%. More importantly for policymakers, trimmed mean CPI at 3.4% underscored persistent underlying inflation that sits uncomfortably above the RBA’s target band. That inflation shock has quickly filtered into economist forecasts. Westpac and ANZ revised their outlooks, now expecting the RBA to raise the cash rate at its upcoming meeting next week. All four major Australian banks now forecast a 25bp hike back to 3.85%.
The key uncertainty now lies beyond the initial move. The question is whether the RBA would signal scope for a more extended tightening cycle, or frame the hike as a one-off adjustment designed to reassert inflation control.
Technically, AUD/USD remains in clear upward acceleration, with D MACD still pointing higher. The advance from 0.5913 is on track toward its 100% projection of 0.5913 to 0.6706 from 0.6420 at 0.7213 next. On the downside, below 0.6901 support will bring consolidations first. But downside should be contained above 0.6706 resistance turned support to bring another rally.
More importantly, the decisive break above 0.6941 structural resistance this week strengthens the case that the rise from 0.5913 is reversing the entire decline from the 0.8006 (2020 high). Next target is 61.8% retracement of 0.8006 to 0.5913 at 0.7206, which is close to the above 0.7213 projection level.
Reactions to this 0.72 resistance zone will decide whether current rise from 0.5913 is the third leg of the pattern from 0.5506 (2020 low), and open the door to further medium up trend through 0.8006.
Australia CPI surges to 3.6% in Q4, 3.8% in December
Australia’s Q4 CPI showed little relief for RBA where it matters most for policy. Headline inflation rose 0.6% qoq, slightly below expectations of 0.7% and slowing sharply from the prior quarter’s 1.3% gain. However, on an annual basis, CPI accelerated from 3.2% yoy to 3.6% yoy, matching forecasts and keeping inflation well above the RBA’s target band.
The more important signal came from underlying inflation. Trimmed mean CPI rose 0.9% qoq, easing marginally from 1.0% previously but beating expectations of 0.8%. Annual trimmed mean inflation climbed from 3.0% yoy to 3.4% yoy, above the expected 3.2%, reinforcing concerns that price pressures remain persistent.
December’s monthly details added to that unease. Headline CPI jumped 1.0% mom, lifting the annual rate from 3.5% yoy to 3.8%, both above expectations. Trimmed mean CPI rose a more modest 0.2% mom, but annual core inflation still edged up from 3.2% yoy to 3.3% yoy.
Price pressures remain broad in December. Goods inflation accelerated from 3.2% yoy to 3.4%, driven largely by a 21.5% surge in electricity prices. Services inflation climbed from 3.6% yoy to 4.1%, led by domestic travel and accommodation and rising rents.
Markets are now firming up their expectation that RBA will return to rate hike in February.