Sample Category Title
Gold Report: Is this Gold’s Ticket to Higher Grounds?
Gold prices finished positive in the previous week and have ascended to reach a new monthly high in the current, creating further excitement for market participants. Despite Gold’s price remaining nearby familiar levels for the past several weeks, we could say that the recent move higher could be encouraging for further price action to prevail. In this report we aim to bring forth the key fundamentals surrounding the Gold market and a technical perspective of the price action.
Yesterday Monday the 11th, Gold performed its fourth consecutive daily session moving upwards. Along with Gold other precious metals like Palladium where also on the rise with a number of reports pointing to the ongoing war in Ukraine. According to Reuters, during the past Friday Russian platinum and palladium was suspended from trading in London increasing supply bottleneck concerns to the broader market. A disruption of any precious metal supply could elevate economic risks substantially and force traders to trade the risk averse Bullion. Supply bottlenecks have concerned the global economy during the pandemic and have pushed Gold prices to new all-time high levels confirming traders prefer the fast-moving metal during times of unprecedented uncertainty. The Russian war in Ukraine seems to keep traders in an active state allowing us to consider the subject as one of the most important currently for the Gold market.
On a side note, concerns over the trajectory of the US economy seem to be ongoing. Yesterday Federal Reserve Bank of Chicago President Charles Evans stated the Federal Reserve may choose a more aggressive interest rate increase noting specifically a 50-basis points rate hike is a possibility in the upcoming FOMC meeting in May. In the past days, the USD index a measure of the greenback’s strength against other major currencies surged and reached a new 2022 high level. Despite the greenback and Gold prices keeping mostly a negative correlation in play, they have both managed to remain higher in recent sessions. The correlation between Gold and the USD may be questionable currently and, in our opinion, may not be reliable for understanding future price action.
With a rather packed economic calendar for the rest of the week Gold traders could have interesting sessions to work with in the days ahead. On Thursday the 14th of April we get the US Retails Sales rate for March along with the weekly initial jobless claims figure and the very important Preliminary University of Michigan Economic Sentiment for April. On Friday the 15th we get the Industrial production rate for March and in the next week on Tuesday the 19th we get the Housing Starts Number for March.
We end this report by noting that today’s release of the U.S. inflation data could create substantial volatility for the precious metal. Traditionally, higher inflation rates tend to support Gold prices, as bullion has been used as a measure to counter higher good prices. However, caution is advised, and we would suggest that traders keep an open mind as to the actual market reaction. In addition, on Monday inflationary pressures in China were confirmed to be elevated in March possibly adding further to Gold’s upsurge.
Technical Analysis
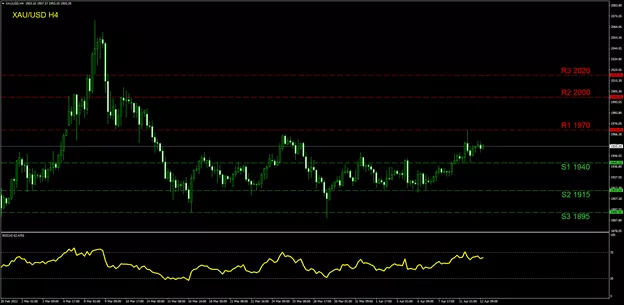
XAUUSD H4 chart
Gold is currently trading between our (R1) 1970 resistance and our (S1) 1940 support level. On Monday a brief upward movement sent the price action reaching the (R1) yet a correction lower was soon carried out. However, the (R1) 1970 line has not been tested since March the 14th making it a strong buying indicator for traders, if the level is to be actually surpassed. In an extended buying trend scenario, traders could also target the (R2) 2000 resistance level or even higher the (R3) 2020 barrier. In the opposite side, a selling scenario could force the price action towards the (S1) 1940 support level which was targeted various times in the past week and was used as both a resistance and a support. Lower the (S2) 1915 support is the lowest level Gold has dropped to in April making it an accurate metric for a selling trend. If the (S2) is breached, the price action could be signaling a change of trend to a selling one making the (S3) 1895 a target. Overall, our personal view is that Gold remains in a sideways motion but due to the recent high it jumped to on Monday, it could also be driven by some bullish tendencies. Besides, the RSI indicator below our chart is currently running across the 63 level, implying some bullish appetite may still be in play.
Eco Data 4/13/22
[php_everywhere instance="1"]
WTI Wave Analysis
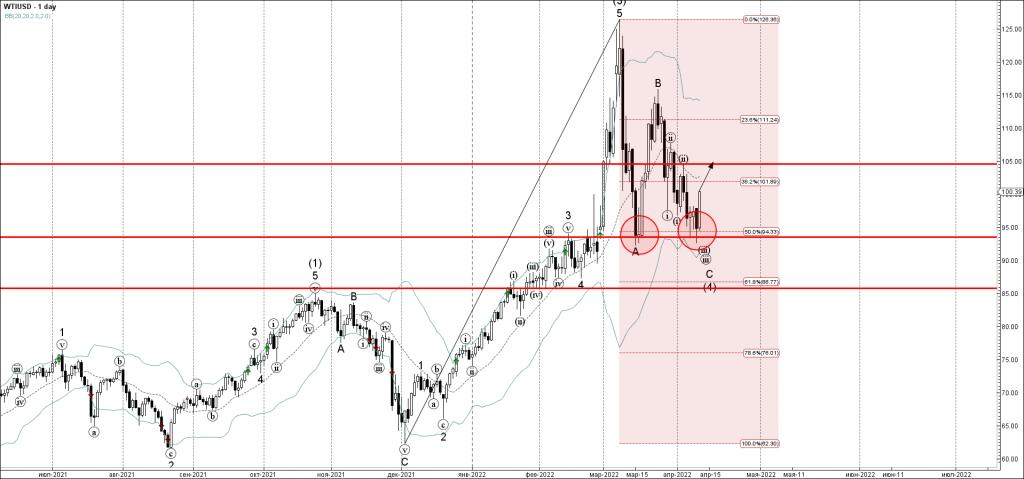
- WTI reversed from key support level 93.50
- Likely to rise to resistance level 105.00
WTI crude oil today reversed up sharply from the key support level 93.50 (which formed the daily Mornign Star in March) – standing near the 38.2% Fibonacci correction of the upward price impulse from December.
The upward reversal from the support level 93.50 stopped the previous ABC correction (2).
Given the multi-month uptrend – WTI crude oil can be expected to rise further toward the next resistance level 105.00 (top of the previous wave (ii)).
AUDCHF Wave Analysis
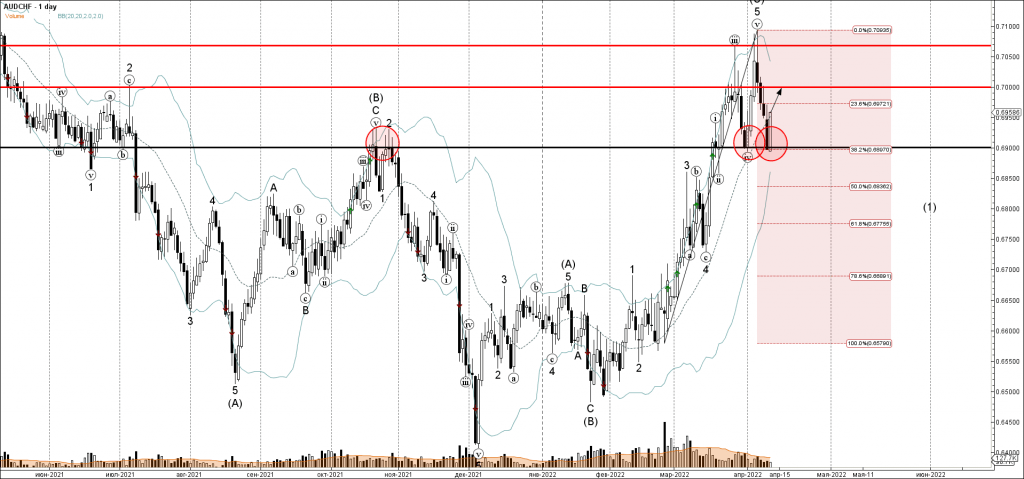
- AUDCHF reversed from pivotal support level 0.6900
- Likely to rise to resistance level 0.7000
AUDCHF currency pair today reversed up sharply from the pivotal support level 0.6900 (which stopped the previous corrective wave (iv) at the end of March).
The support zone near the support level 0.6900 is strengthened by the 38.2% Fibonacci correction of the upward price impulse from the end of February.
Given the strong daily uptrend – AUDCHF currency pair can be expected to rise further toward the next round resistance level 0.7000.
Dollar Index Eases on Expectations that US Inflation May Have Peaked
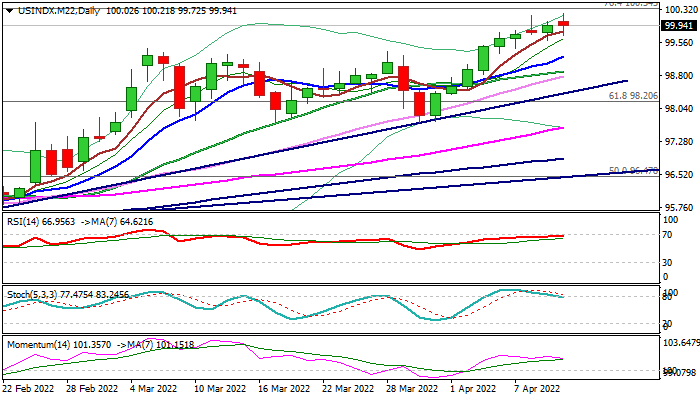
The dollar index edged lower on Tuesday, following a multiple failure to sustain probes above psychological 100 barrier.
Traders sold dollar after US inflation rose further in March and made a biggest multi-year rise, but some signs add to expectations that inflation may have peaked and may start to ease that would reduce needs of the US Federal Reserve to be aggressive in tightening monetary policy in the second half of the year.
Daily studies show fading bullish momentum and stochastic emerging from overbought territory, opening way for correction, as bulls faced headwinds from psychological 100 level Fibo barrier at 100.34 (76.4% of 103.80/89.15 downtrend).
More evidence of pullback is still needed, with today’s close in red seen as initial signal, which would look for confirmation on close below pivots at 99.59/41 (Monday’s low / former top of Mar 7).
Rising 10DMA (99.22) marks next support, followed by converging 20/30DMA’s at 98.87/77, broken Fibo 61.8% at 98.20 and key support at 97.72 (Mar 30 trough).
Cracked 100 level marks initial resistance, followed by 100.34 Fibo level, violation of which would signal bullish continuation.
Res: 100.00; 100.20; 100.34; 101.01
Sup: 99.59; 99.41; 99.22; 98.87
Sunset Market Commentary
Markets
Early this morning, it looked that the congruent sell-off in bond and equity markets would simply continue going into the US March inflation release. At 2.83%, the US 10-y yield touched the highest level since December 2018. Asian equities mostly closed in the red, China being the exception to rule. European equities at the open also tumbled almost 2.0% (EuroStoxx50). European yields set new cycle peak levels. However, momentum wasn’t as strong as it was over the previous days. The yield rally already ran into resistance during the European morning session. US bond investors also shifted to a wait-and-see attitude going into the CPI release. Equities left the intraday lows. German ZEW investor confidence dropped further with the expectations measure (-41.0 from -39.3) nearing the lows set early in the pandemic. Even so, both the decline in the current conditions and expectations measure was less than feared. US headline CPI printed as expected at 1.2% m/m and 8.5% Y/Y (was 0.8% and 7.9% in February). Core inflation (excluding food and energy) printed slightly softer than expected at 0.3% M/M and 6.5% (from 6.4%). Price rises were still broad-based with gains for energy (7.5% M/M), services (0.5% M/M and 5.1% Y/Y), including housing (0.7% M/M) still continuing, amongst others. Prices of used cars which rose sharply over the previous year, this time eased 3.8% M/M, contributing to the ‘softer’ core inflation. The market reaction was interesting. Over the previous months, inflation data mostly surprised on the upside. This not being the case today, apparently triggered some relief among investors US bonds were captured in a corrective short squeeze. US yields are easing between 7.5 bps (5-y) and 2.0 bps (30-y), the belly of the curve outperforming. A bit strange, real yields decline more than inflation expectations. For now, we don’t draw any firm conclusions. A correction after a stretched directional move. European bond markets joined the US reaction, but clearly underperformed. German yields are losing between 4.2 bps (5-y) and 1.0 bp (30-y). Changed in euro swap yields even are close to non-existent with investors looking forward to Thursday’s ECB meeting. Today’s pause also provided some further relieve for peripheral European bond markets with 10-y spreads narrowing up to 3 bps (Italy, Spain, Portugal). European equities further reversed this morning’s losses, but currently fail to return in to positive territory (EuroStoxx50 -0.2%). US equities are gaining up to 2% (Nasdaq).
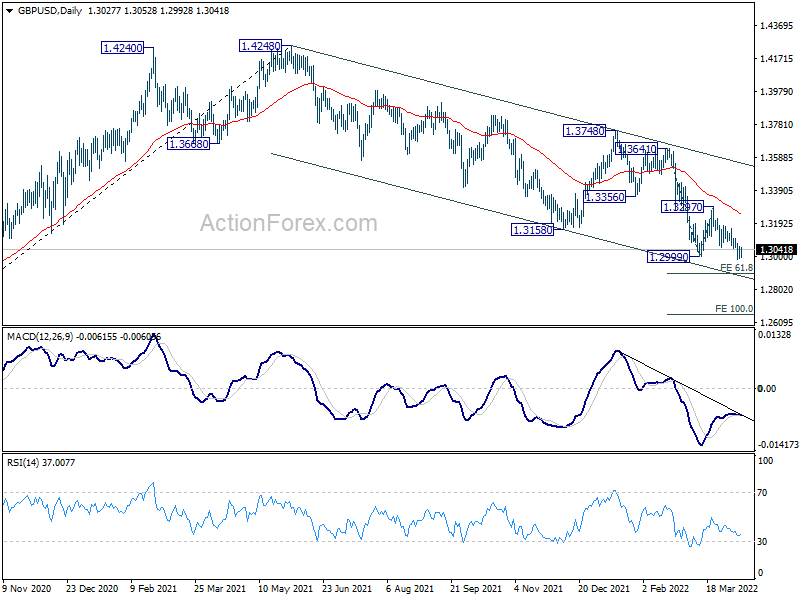
On FX, the correction in US yields hardly hurt the dollar. USD/JPY is testing the 125 handle. DXY is holding close to the 100 pivot. Euro bulls also should be disappointed with EUR/USD reaction. The pair briefly touched the 1.09 area, but currently even trades marginally lower near 1.0875. Sterling trades with a minor positive intra-day bias (EUR/GBP 0.8340, cable 1.3040) despite mixed labour market data this morning. UK CPI data will be published tomorrow morning.News Headlines
The World Trade Organization (WTO) said Russia’s war with Ukraine will slow the economy’s rebound from the pandemic. Already stretched supply chains are being pressured further with trade disruptions visible everywhere from commodities over metals to energy. In addition, China answers any Covid outbreaks with new lockdowns. This again disrupts seaborne trade, according to the organization. Global trade in goods was revised lower from 4.7% to 3% for 2022. In 2023, trade could grow with 3.4% though there were downside risks to that estimation, including food insecurity. The WTO also shaved 1.3 ppts of previously expected GDP growth, to 2.8% before picking up to 3.2% next year.Ireland is mulling to lower the VAT on energy bills as it seeks way to cushion an escalating cost-of-living crisis, resorting to measures that were already taken by a number of other European countries. The plan under discussion would lower the rate on electricity and gas from 13.5% to 9% on a temporary basis, Ireland’s national broadcaster reported today.
US CPI Gives Market a Breather
The US consumer price index has updated its record since 1981, accelerating to 8.5% y/y from 7.9% a month earlier and slightly stronger than the 8.4% average analysts forecast. However, yesterday’s White House warning of “extraordinarily elevated” inflation data set the numbers even higher.
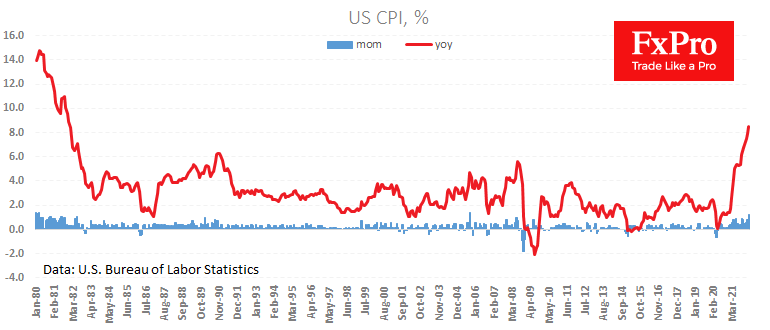
Yesterday’s sell-off in equity markets and the pull into the dollar is essentially an attempt by traders to build upon the higher numbers after the “insider” from the White House, which gets the numbers a day early.
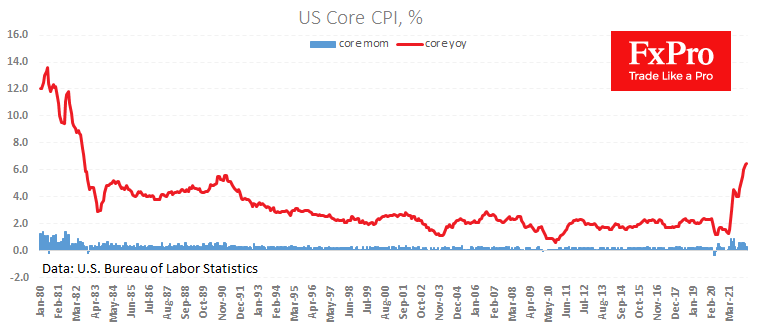
The core price index (excluding food and energy) rose weaker than expected, rising to 6.5% y/y.
The markets got a breath of fresh air as they saw signs that inflation was not on as destructive a trajectory as feared. In this environment, markets can bounce back from some overly extreme positioning.
We noted that yesterday markets laid down a 37% chance that the Fed would raise rates by 125 points over the next two meetings. The reassessment to a more realistic outlook provides local support to the equity market and forms a pullback of the dollar from the extremes reached yesterday.
In the longer term, one must consider that even with more down-to-earth expectations of 6 hikes of 25 points by the end of the year, combined with active asset sales from the balance sheet, a mix hardly compatible with a relentless bull market.
US: Inflation Reaches (Another) Multi-Decade High
Consumer price inflation continued to accelerate in March, rising 1.2% month-on-month (m/m) – the fastest month-over-month pace since September 2005. On a year-over-year (y/y) basis, inflation was 8.5%, marking yet another multi-decade high.
Gasoline prices remained a key contributor to price growth, rising by 18.3% m/m and accounting for over half of the total increase in headline inflation. Food prices were also up 1.0% m/m in March, and 8.8% relative to year-ago levels.
Core (excludes food and energy) inflation rose 0.3% m/m, a step down from the previous month's 0.5% m/m gain. On a year-over-year basis, inflation ticked up a tenth of a percentage point, rising to 6.5% y/y.
Shelter costs were again a key contributor to core price growth – accounting for nearly two-thirds of the increase – and rising 0.5% m/m, with both rent of primary residence and owners equivalent rent notching gains of 0.4% m/m. Having said that, price increases were relatively broad-based across most categories, with airline fares (10.7% m/m), transportation (2.0% m/m) & medical (0.6% m/m) services, and motor vehicle insurance (0.7% m/m) all up in March.
Core goods prices fell by 0.4% m/m, with all categories showing a deceleration (or decline) on the month. Of note was the decline in used vehicle prices (-3.8% m/m), which has now fallen in each of the last two months. New vehicle (0.2% m/m) prices, however, were up modestly in March, though price growth has shown signs of cresting here as well in recent months. Relative to year-ago levels, new and used vehicle prices are still up 12.5% and 35.3%, respectively.
Key Implications
As expected, price pressures continued to mount in March, as higher food and energy prices remained key contributors to last month's price gains. Over the near-term, we should see some reprieve in gasoline prices, as WTI has moved sharply lower in recent weeks following separate announcements from both the US and International Energy Agency to release some reserves of oil.
The decline in core goods prices is an encouraging development, though we caution reading too much into this over the near-term. Most of the decline was concentrated in used vehicle prices, which are highly volatile and still suspectable to ongoing supply shocks. Both new and used vehicle inventories remain historically low and ongoing supply chain disruptions – largely stemming from China lockdowns and semiconductor shortages – will continue to weigh on auto production this year, keeping the market undersupplied and prices elevated.
Having said that, the notable increases in some price categories which were heavily impacted by COVID restrictions (airline, public transportation, etc.) is showing that consumer spending is starting to "normalize". This should result in increased spending in consumer services, helping to ease some of the demand-side cost pressures on goods.
With price pressures continuing to mount and the labor market remaining as tight as ever, there is no doubt the Federal Reserve will be raising rates at its next policy announcement on May 3rd-4th. Markets are largely priced for a 50-basis point rate hike, and we fully expect the Fed to use this opportunity to accelerate the removal of monetary accommodation.
EUR/USD Mid-Day Outlook
Daily Pivots: (S1) 1.0860; (P) 1.0897 (R1) 1.0920; More...
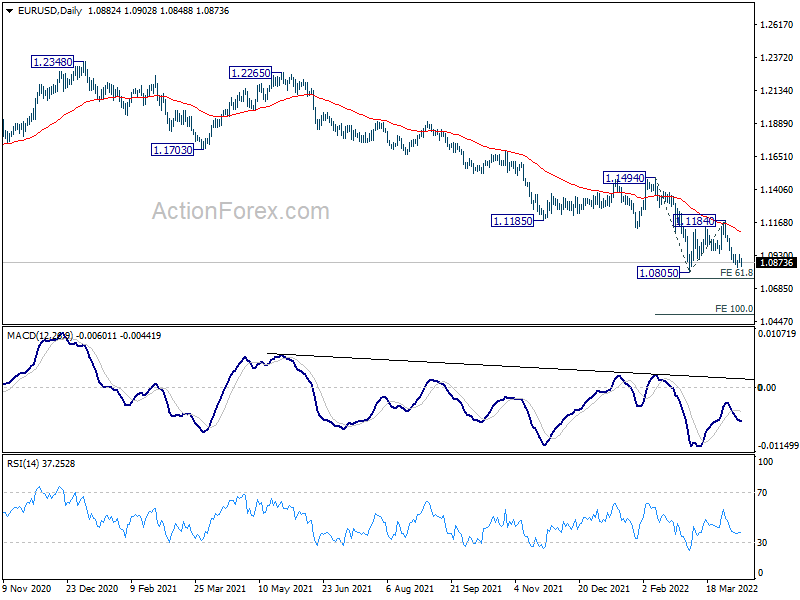
Intraday bias in EUR/USD remains neutral at this point. Further decline is in favor with 1.0987 minor resistance intact. On the downside, decisive break of 1.0805 low will resume larger down trend. Next target is 61.8% projection of 1.1494 to 1.0805 from 1.1184 at 1.0758, and then 100% projection at 1.0495. On the upside, above 1.0987 minor resistance will turn bias back to the upside for 1.1184 resistance instead.
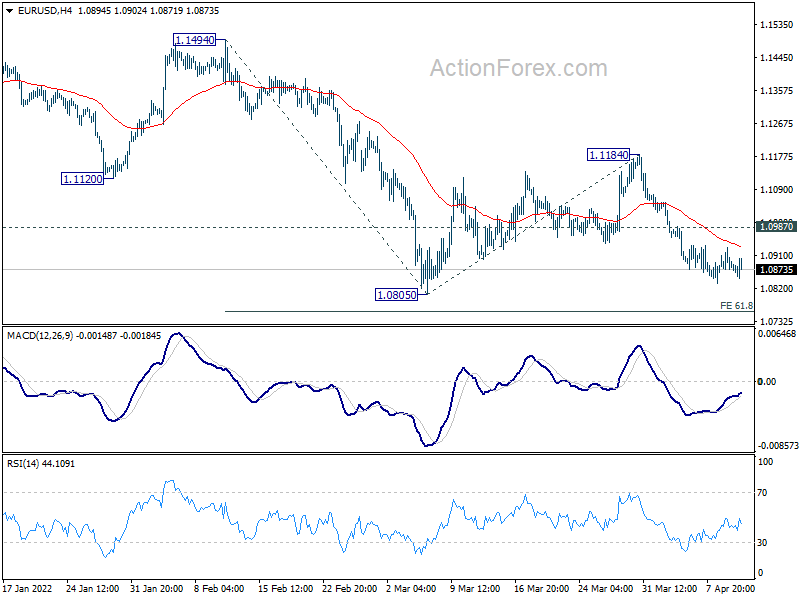
In the bigger picture, the decline from 1.2348 (2021 high) is expected to continue as long as 1.1494 resistance holds. Firm break of 1.0635 (2020 low) will raise the chance of long term down trend resumption and target a retest on 1.0339 (2017 low) next. Nevertheless, break of 1.1494 will maintain medium term neutral outlook, and extending term range trading first.
GBP/USD Mid-Day Outlook
Daily Pivots: (S1) 1.2993; (P) 1.3025; (R1) 1.3061; More...
Intraday bias in GBP/USD is turned neutral as it turns into consolidation after hitting 1.2981. Outlook will stay bearish as long as 1.3165 resistance holds. Break of 1.2981 will resume larger down trend to 61.8% projection of 1.3641 to 1.2999 from 1.3297 at 1.2900.
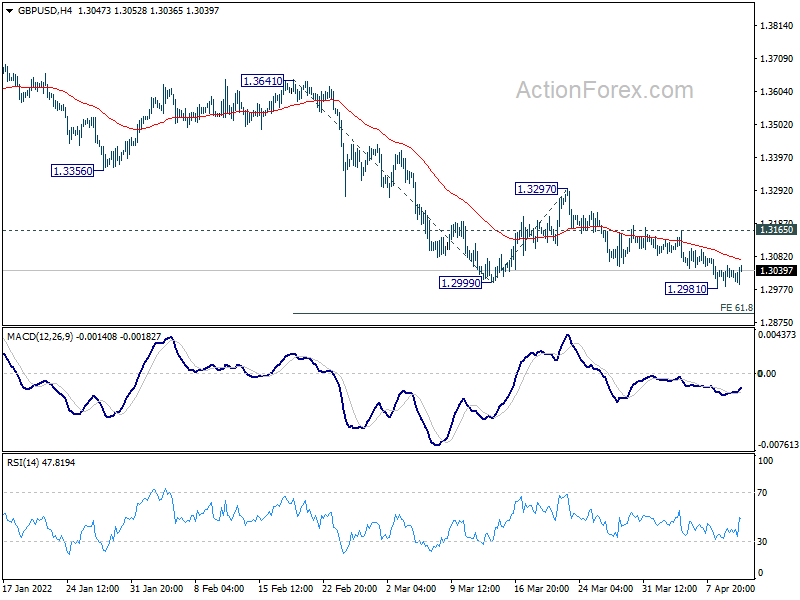
In the bigger picture, rise from 1.1409 (2020 low) has completed at 1.4248. Decline from 1.4248 could still be a corrective move, or it could be the start of a long term down trend. In either case, deeper decline would be seen back to 61.8% retracement of 2.1161 to 1.1409 at 1.2493. In any case, break of 1.3748 resistance is needed confirm completion of the fall from 1.4248, or outlook will stay bearish.