Sample Category Title
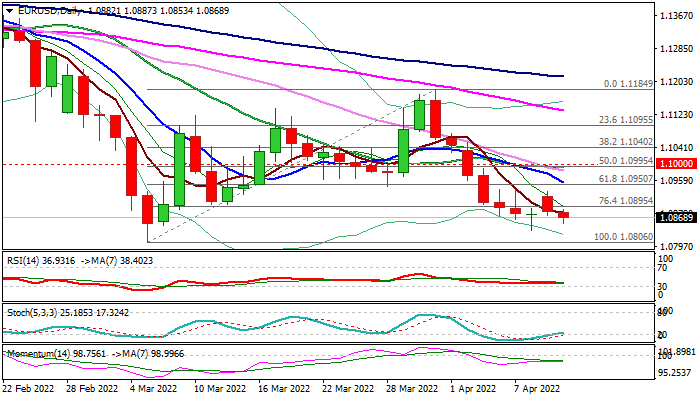
EUR/USD Outlook: Bears Regain Control after Short-Lived Bounce
The Euro weakened further in early European trading on Tuesday, as Monday’s recovery following initial reversal signal on Friday’s long-tailed Doji, was short-lived.
Bears regained traction after recovery peaked at 1.0933, as subsequent weakness closed again below broken Fibo level at 1.0895, keeping near-term action in red and eyeing key support at 1.0806 (Mar 7 low).
Daily MA’s remain in full bearish setup although 14-d momentum edged higher but remaining in the negative territory and keeping the downside at risk.
Violation of Friday’s spike low at 1.0836 would open way for test of 1.0806 pivot, which guards Mar 2020 low at 1.0635.
Slightly better than expected German economic sentiment data may slow bears, bias is expected to remain firmly bearish while the action holds below falling 10 DMA (1.0954).
Only sustained breakthrough psychological 1.10 barrier would provide relief and allow for stronger rebound.
Res: 1.0895; 1.0954; 1.0984; 1.1000.
Sup: 1.0853; 1.0836; 1.0806; 1.0766.
Near-Extreme Expectations from Fed Pull the Dollar Up, Stocks Down
Expectations for further moves by the Fed have an increasing impact on markets, pushing the dollar up to extreme highs and pressuring stocks.
Futures are laying on an 84% chance of a 50-point rate hike in early May and a 92% chance of a 50 or more-point hike in mid-June, including a 37% chance of a 75-point tightening. These expectations are high but hardly sustainable.
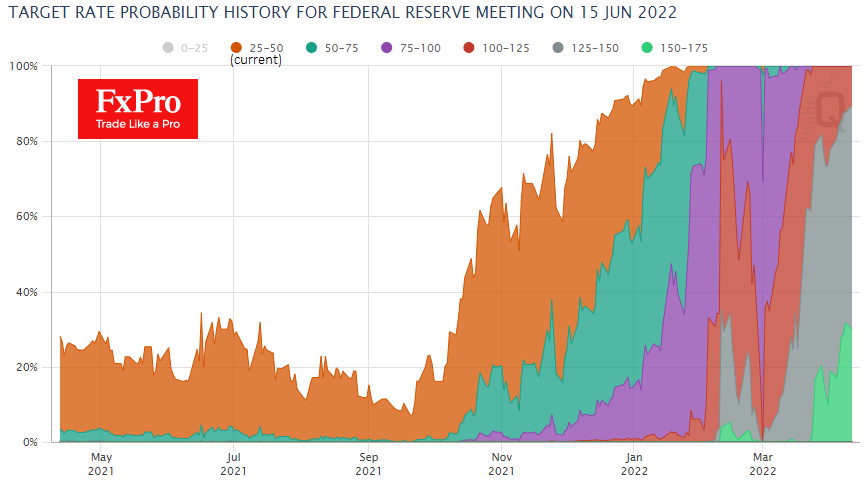
Markets like to rush from one extreme to the other, and we think we are now close to going ridiculously far in their expectations. There is no chance that today’s US inflation data will surprise with a slowdown in inflation, but it could still mark a peak followed by a decline, albeit from very high levels.
However, it is unlikely that the Fed will follow such a scenario. The greater chance is that the American central bank would prefer to intervene at the short end of the curve by raising the Fed funds rate and all along the curve by regulating the sale of bonds from the balance sheet.
Such an approach would help contain the yield curve inversion that is so frightening to market watchers, in their eyes, foreshadowing a new recession.
However, markets need fundamental or verbal evidence to stop them from drifting in expectations. And with that in mind, the US inflation data coming out later today is worth investigating for signs of a slowdown in prices. For example, sectors such as the secondary car market or household goods, which have been pulling prices upwards, could now be contributing to the lowering of inflationary pressures.
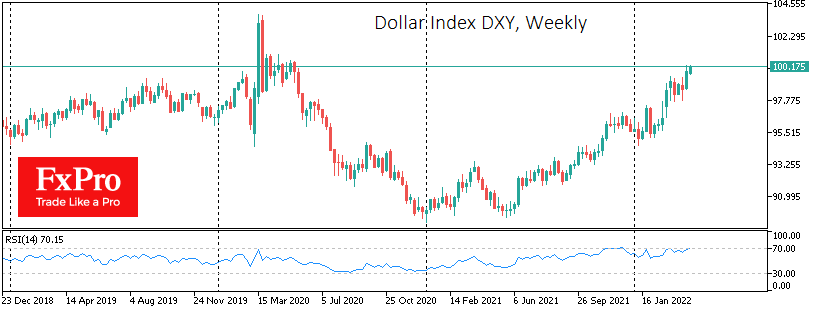
The current shift in expectations towards an extreme tightening from the Fed may peak somewhat later on before triggering a significant sell-off in the markets and a strengthening impulse for the USD. The Dollar Index broke through the psychologically important 100 level, while EURUSD and GBPUSD are testing their psychologically essential levels of 1.08 and 1.30. Meanwhile, the Japanese yen continues to frighteningly lose value, and the Swiss franc is not attracting capital flows looking for safety.
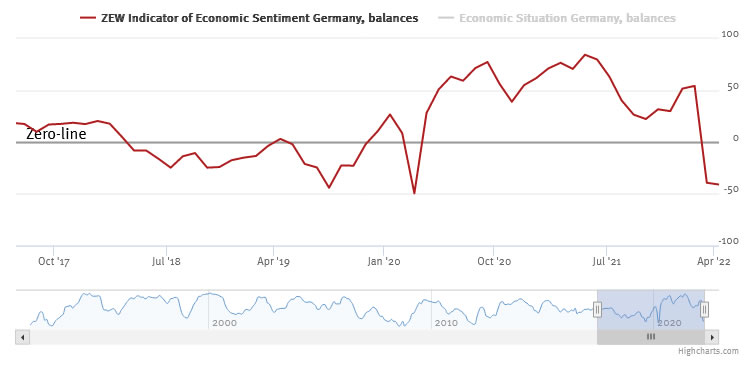
Germany ZEW economic sentiment dropped to -41, prospect of stagflation over next six months remains
Germany ZEW Economic Sentiment dropped from -39.3 to -41 in April, but was better than expectation of -48. Current Situation Index dropped from -21.4 to -30.8, above expectation of -35.0. Inflation expectations dropped -43.4 pts to 26.8.
Eurozone ZEW Economic Sentiment dropped from -38.7 to -43.0, above expectation of -46.5. Current Situation index dropped -6.6 pts to -28.5. Inflation expectations dropped -43.6 pts to 25.9.
"The ZEW Indicator of Economic Sentiment remains at a low level. The experts are pessimistic about the current economic situation and assume that it will continue to deteriorate. The decline in inflation expectations, which cuts the previous month's considerable increase by about half, gives some cause for hope. However, the prospect of stagflation over the next six months remains," comments ZEW President Achim Wambach.
Wall Street Slides, VIX, and USD Rise as Inflation Expectations Jump
US equities and digital currencies dipped on Monday as investors refocused on the upcoming quarterly results by leading American companies. Banks like JP Morgan, Citigroup, and Wells Fargo are expected to publish weak results even after the Federal Reserve delivered its first interest rate hike since 2018. The performance happened as the bond sell-off accelerated, with the 10-year rising to a multi-year high of 2.76% and the 30-year rising to 2.80%. Technology stocks like Nvidia, AMD, Coinbase, Microsoft, and Snap were the biggest losers. Energy stocks like Occidental and Conocophillips also lagged. On the other hand, the CBOE VIX index and airlines like American and United rose.
The US dollar rose as the inflation outlook rose to a new record high. Data published by the New York Federal Reserve showed that the median one-year inflation expectation rose to 6.6% from the previous 6%. Respondents expect that inflation will be at about 3.7% in the next three years. This situation was caused by the elevated oil and gas prices and the ongoing crisis in Ukraine. These numbers came two days ahead of the upcoming official consumer inflation data scheduled for Wednesday this week. Economists expect the data to show that consumer prices jumped to over 8% in March.
The British pound went sideways after the latest UK GDP numbers that were published on Monday. The numbers revealed that the UK economy made a modest recovery in February as the impact of the crisis in Ukraine emerged. The currency will be in the spotlight on Tuesday as the UK publishes the latest jobs numbers. Economists expect the data to show that the country’s unemployment rate declined from 3.9% to 3.8%. They also saw the average earnings plus bonus rise from 4.8% to 5.4%. Without bonuses, they see wages rise from 3.8% to 4.0%. Other key data to watch on Tuesday will be the German and US consumer inflation data.
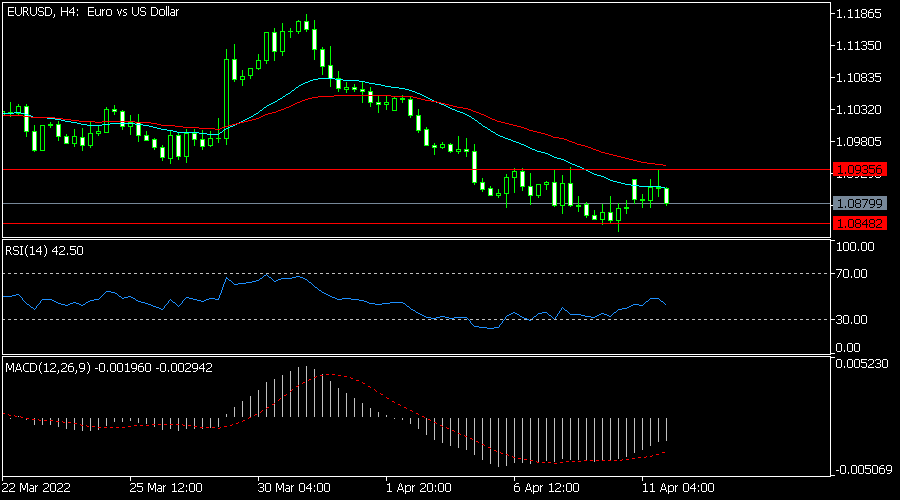
EURUSD
The EURUSD pair moved sideways ahead of the upcoming US and Germany inflation data. It is trading at 1.0833, where it has been in the past few days. It remained between the key support and resistance levels at 1.0848 and 1.0935, respectively. The pair moved slightly below the 25-day and 50-day moving averages while the MACD made a bullish crossover pattern. The Relative Strength Index (RSI) has also been rising. Therefore, the pair will likely have a bullish or bearish breakout ahead of the US and Germany inflation data.
EURCHF
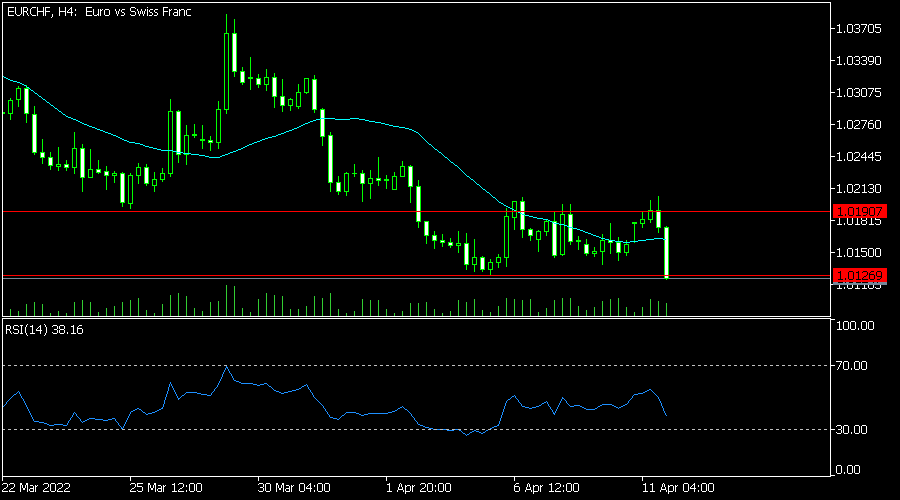
The EURCHF pair declined sharply during the Asian session. It moved to a low of 1.0125, which was the lowest level since March 8. On the four-hour chart, the pair moved below the short and medium-term moving averages. It also dropped below the key support level at 1.0128, which was the lowest level on April 6th. The pair will likely keep falling as bears target the next key support level at 1.000.
XNGUSD
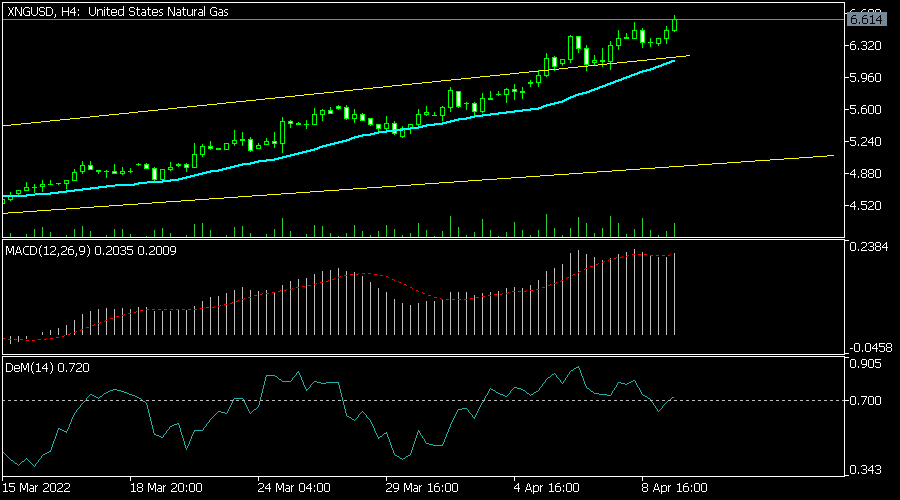
The XNGUSD pair maintained a bullish trend as demand for natural gas rose and supply fell. It rose to a year-to-date high of 6.60, which is above the upper side of the ascending channel. It has moved above the 25-day and 50-day moving averages. The RSI and MACD have pointed upwards. The pair will likely keep rising this week.
Daily Technical Analysis
EUR/USD
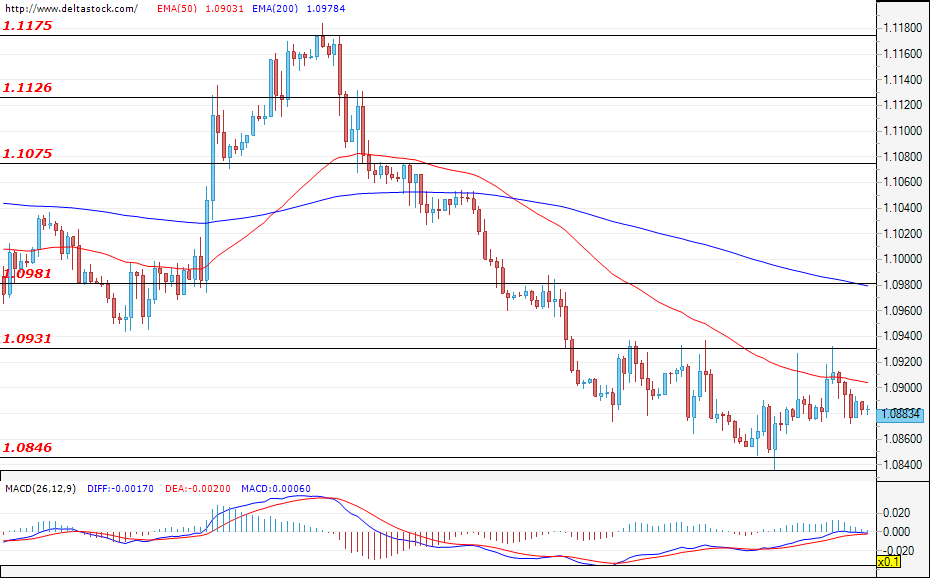
The instability of the single European currency goes on and it continues to remain in the range between 1.0850-1.0930 . In the early hours of today's session began a strong movement supported by the bulls, but after reaching the resistance of 1.0930, the pair headed back down again and found its local bottom around the support of 1.0875. For now, the movement is locked between support and resistance that have been respected since last week. If the euro manages to gain strength against the dollar, we can see an increase above the resistances mentioned above and a return to 1.0985. However, if the downward pressure continues, values below 1.0840 against the greenback are not excluded. During today's session the most important news which will most likely cause a sharp increase in volatility, is the CPI in the U.S. at 12:30 GMT, according to which traders will adjust their projections regarding the rate at which the FED will normalise its monetary policy.
USD/JPY
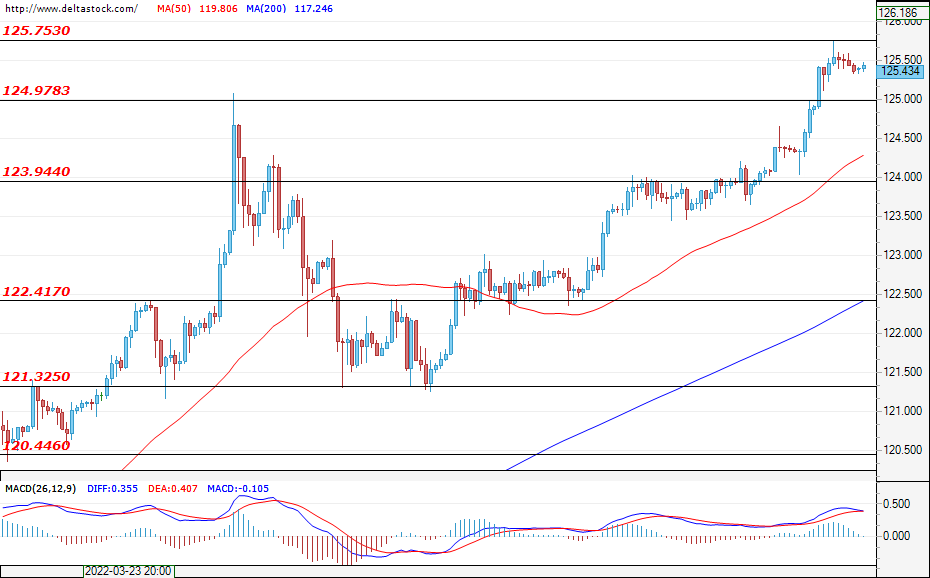
There seems to be nothing to stop the tireless attack of the bulls and almost every day we see new highs in the Ninja. The strength of the dollar against the yen rose very aggressively in the early morning hours and during the regular session stopped only at a resistance of 125.75. By the end of the day, there was a slight correction of no more than 40 pips, which stimulates redemption at the previous level. The reversal of the trend can be discussed only with a solid evidence of downward pressure, and such is currently lacking. Of course, if the resistance of 125.75 is respected again, then downward movements this week are not excluded.
GBP/USD
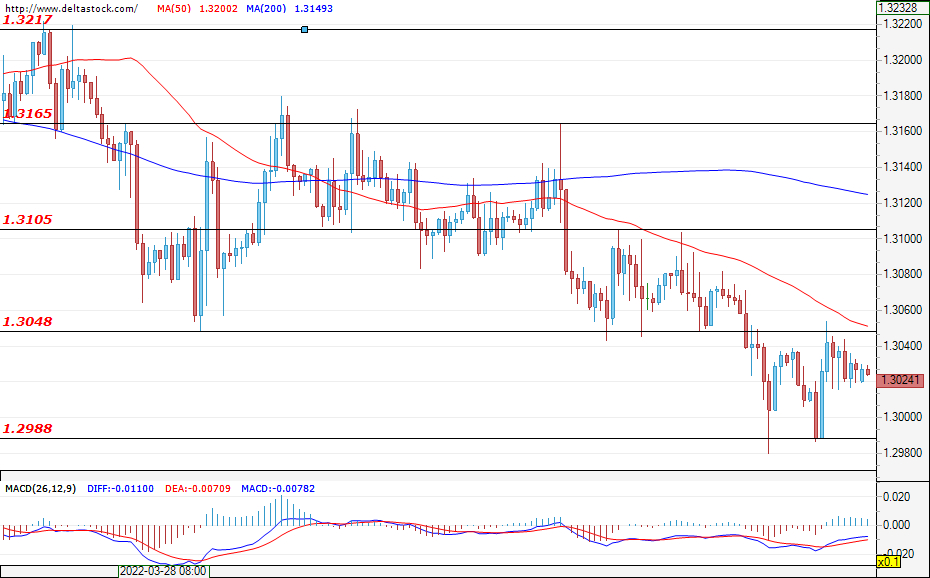
The Sterling is no exception in terms of range movements, but they are locked even narrower with a downward pressure. Each attack of the bulls was rejected at the levels around 1.3045, but as of this moment, they do not allow the pair to fall below the support around 1.3020. The pound is expected to continue its downward trend and deepen below 1.2985, but if the dollar shows a weakness this week, a return around 1.3095 should not be excluded.
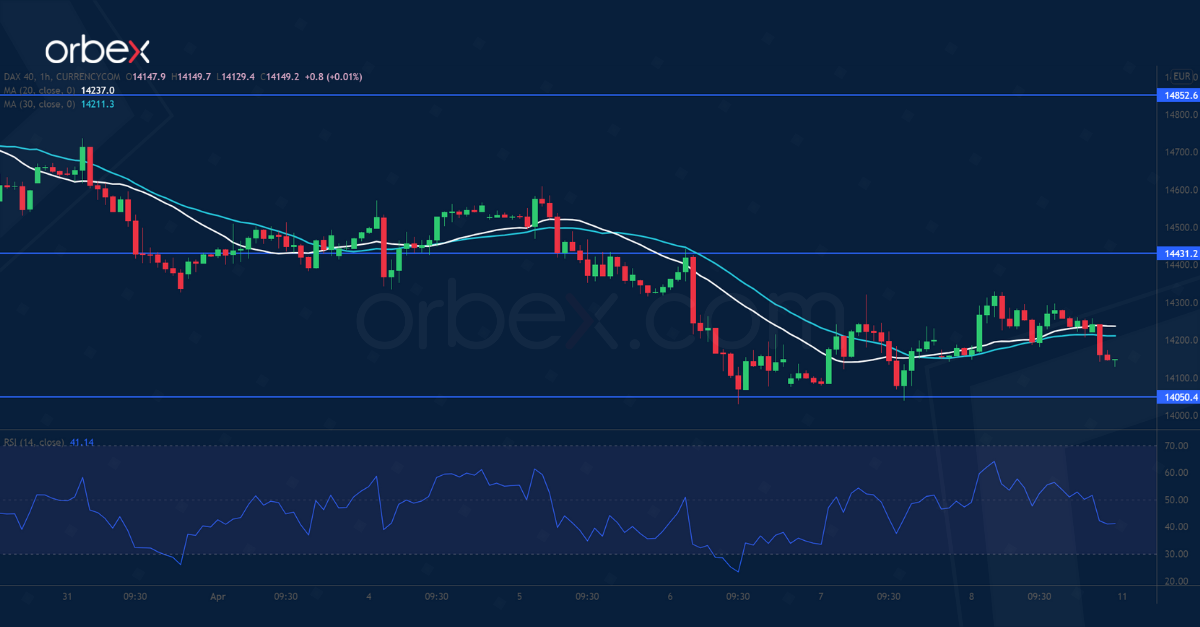
EUGERMANY40
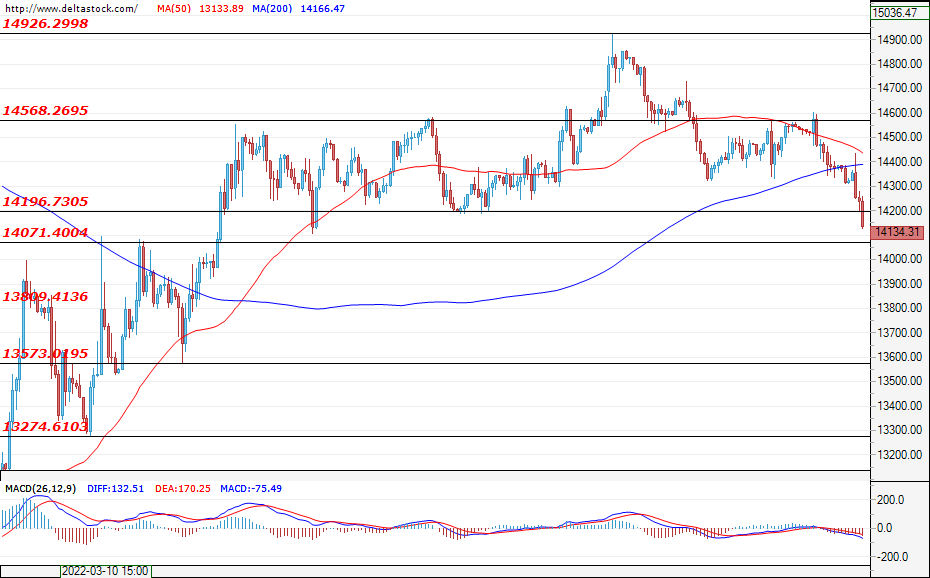
Graphically, the movements in the EUGERMANY40 are almost identical to some movements in the forex market today - a narrow range and, 30 minutes after the opening, the index was moving without frequent large swings in either direction. The downward trend continued, due to fears of stagflation in Europe and the consequences of the war in Ukraine for the energy sector in Germany. During today's session, a downward move is more likely, given the risk-off sentiment, with the main support being around 14070. But if, of course, we see a stabilisation of the military situation, then swings above the resistance 14320 can be expected.
US30
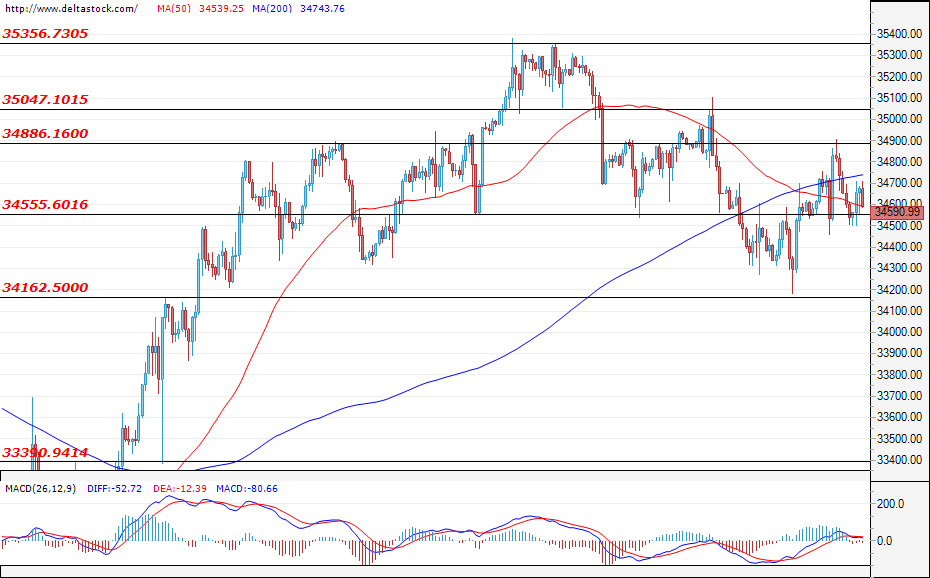
Yesterday, the Blue Chips Index maintained a range in the European session, but that changed quickly when the U.S. stock market opened. The downward movements were convincing as in the last hour of trading the US30 fell even further to 34,270, but managed to recover part of the losses and ended at around 34,320. To consider more sustained moves to the upside, there must be a convincing breach of 34,700, and continuation above 35,000. But until this happens,, the downward pressure can continue, driving it back to 34,160 later this week. Sharp moves in either direction can be expected after the CPI numbers for the U.S. are announced later today at 12:30 GMT.
EURJPY Shines Again, Moving Towards 6½-Year High
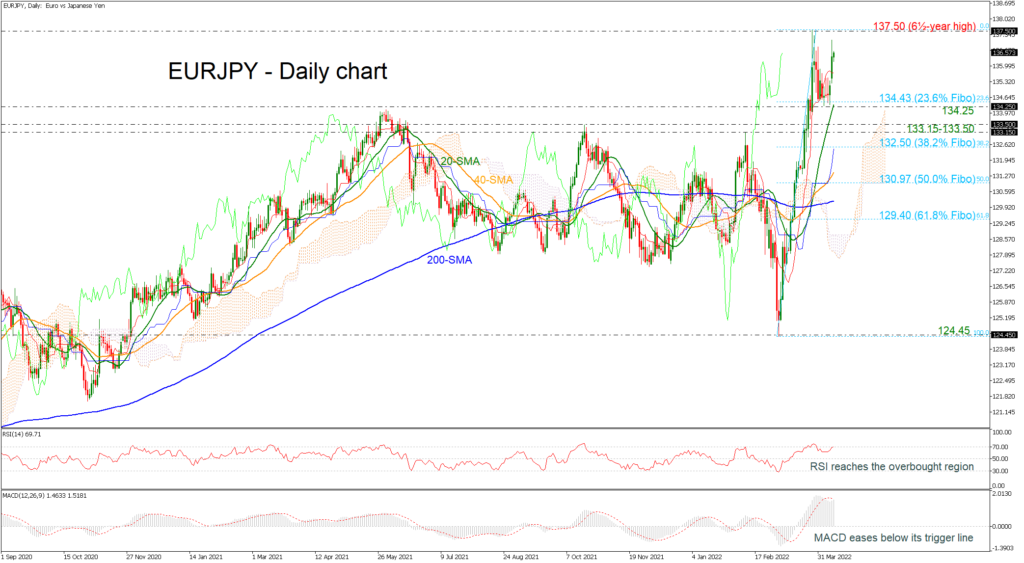
EURJPY posted an impressive bullish rally in the previous couple of days, moving towards the six-and-a-half year high of 137.50. The pair found strong support at the 134.25 barrier and the 23.6% Fibonacci retracement level of the up leg from 124.45 to 137.50 at 134.43.
The technical indicators are currently feeding prospects for a possible negative short-term the RSI holds well above 50 but found an obstacle near the 70 level, while the MACD continues to strengthen in bullish territory and below its red trigger line. Also, in Ichimoku indicators, the red Tenkan-sen is pointing down, holding above the blue Kijun-sen.
If the price fails to overcome the six-and-a-half year high of 137.50, a challenging point over the previous month, it would run towards the 139.00 round number, taken from the peak in August 2015. On top of that, the bulls would need to clear the 140.70 barrier, registered in June 2015.
Alternatively, a dive could hit the immediate 134.25-134.43 support, which encapsulates the 20-day SMA. Lower support could be next found around the 133.15-133.50 barrier, while a close below the 38.2% Fibonacci of 132.50 could stage a steeper sell-off until the 50.0% Fibonacci of 130.97.
In the short-term picture, EURJPY turned positive after the rebound off 124.45 by forming a higher high. Should the market continue the upward pattern, the outlook may turn brighter. A run above 137.50 would turn the outlook strongly bullish.
GBPUSD Builds Floor Around 1.3000; Bias Bearish
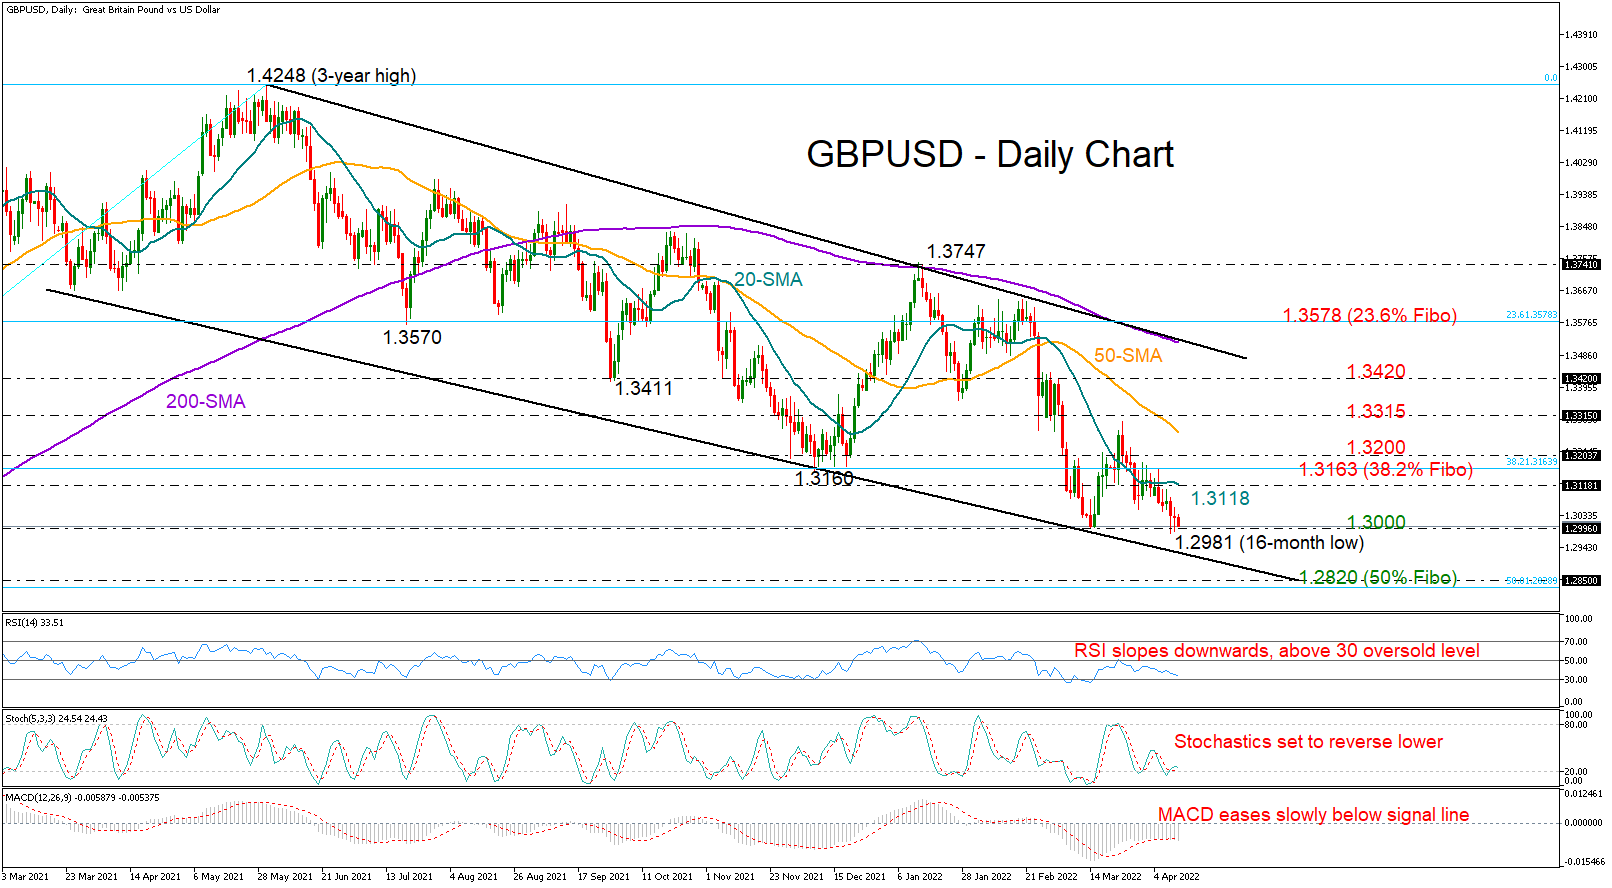
GBPUSD keeps hovering with weak momentum marginally above the 1.3000 level despite its flash slide to a new 16-month low of 1.2981 last Friday.
The bearish bias remains intact as the RSI is maintaining a clear negative trajectory and is still some distance above its 30 oversold level. The Stochastics are preparing for another negative intersection, while the MACD is gradually stepping below its red signal line, all painting a blurry short-term picture for the market.
The 1.3000 floor, however, could act as a safety net. If the price manages to set a foothold around that area, the pair could stage an upside reversal towards the 20-day simple moving average (SMA) at 1.3118. Slightly higher, the 1.3163 – 1.3200 region, which includes the 38.2% Fibonacci retracement of the 1.1409 – 1.4248 upleg (2020 – 2021) could immediately cap any additional bullish actions towards the 50-day SMA at 1.3267. Beyond the latter, the rally could stretch up to the 1.3420 resistance unless the 1.3315 constraining zone blocks the way.
In the event sellers breach the 1.3000 bottom, a crucial battle could take place around the lower boundary of the one-year-old bearish channel at 1.2925. Failure to bounce here could press the price towards the 50% Fibonacci of 1.2820, while a more aggressive decline could even test the September 2020 low of 1.2670.
Overall, GBPUSD is still in a bearish mode. Unless the 1.3000 support region stands firm, the sell-off could mark new lower lows at the bottom of the long-term downward-sloping channel.
Bitcoin Loses Strength Due to the Stock Sell-off
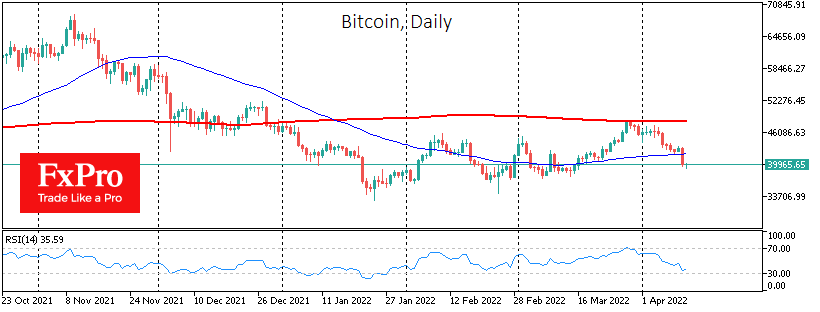
Bitcoin was down 7.4% on Monday, ending at around $39.9K and remains here on Tuesday morning. Ethereum lost 8.9%, while other leading altcoins in the top 10 fell in price from 6.7% (Binance Coin) to 13% (Terra).
Over the past 24 hours, cryptocurrency market capitalisation, according to CoinMarketCap, has fallen 5.2% overnight to $1.85 trillion, with the Bitcoin Dominance Index dropping 0.2 points to 41.1%.
The cryptocurrency fear and greed index lost 12 points to 20 by Tuesday, in a state of “extreme fear”.
Bitcoin collapsed on Monday, the most in almost two months, following global stock indices. In a sharp move, BTC plummeted under the 50-day moving average, dashing hopes that we saw a trend breakdown in March.
Yesterday’s drop in bitcoin and the continued pessimistic mood in financial markets open a direct and quick path to the March support area – near $38K, or even lower – to $32.5-35K.
Conventional financial market participants have just started laying down the accelerated pace of rate hikes, expecting +50 points in May and the same amount in June. This is in stark contrast to the 25 point rises per quarter that we have seen since the global financial crisis. In this environment, liquidity leaves the financial markets, hitting the highest risk sectors the hardest. Because of this, we see a steep drop in cryptocurrency capitalisation and the Nasdaq index.
According to CryptoQuant, miners dumped some bitcoins last week as the cryptocurrency declined. Bearish sentiment may dominate this week as the BTC exchange balance has risen again.
The cryptocurrency market is threatened by a decline in US stock indices soon, according to BitMEX cryptocurrency exchange co-founder Arthur Hayes. Bitcoin could fall to $30,000 by the second quarter, Ethereum to $2,500.
David Rubenstein, the co-founder of The Carlyle Group, believes that cryptocurrencies will increase amid growth in the crypto industry and political instability.
According to a Nasdaq survey, 72% of financial advisers would invest client funds in cryptocurrencies if they had access to spot crypto-ETFs.
US 30 Struggles for Support
The Dow Jones 30 turns south as US Treasury yields continue to climb. The index briefly found support over the 30-day moving average (34200).
A bullish RSI divergence indicates a deceleration in the current sell-off. Nonetheless, the bulls’ struggle to push past 35000 suggests that short-term sentiment remains cautious.
On the downside, a fall below 34200 could trigger a broader liquidation, causing an extended consolidation in the days to come. 33500 at the origin of the previous breakout would be the next support.
EUR/GBP Attempts Rebound
The sterling softened after Britain’s GDP fell short of expectations in February. The euro found support in the demand zone between 0.8300 and 0.8310, an important level from the daily chart.
The ensuing break above 0.8360 flushed out some selling interests and could pave the way for a sustained bounce. 0.8400 is the next hurdle and its breach may propel the single currency to the previous high (0.8510).
An overbought RSI may cause a temporary pullback and the bulls may see it as an opportunity to join in.