Sample Category Title
EUR/CHF Daily Outlook
Daily Pivots: (S1) 1.0102; (P) 1.0154; (R1) 1.0186; More....
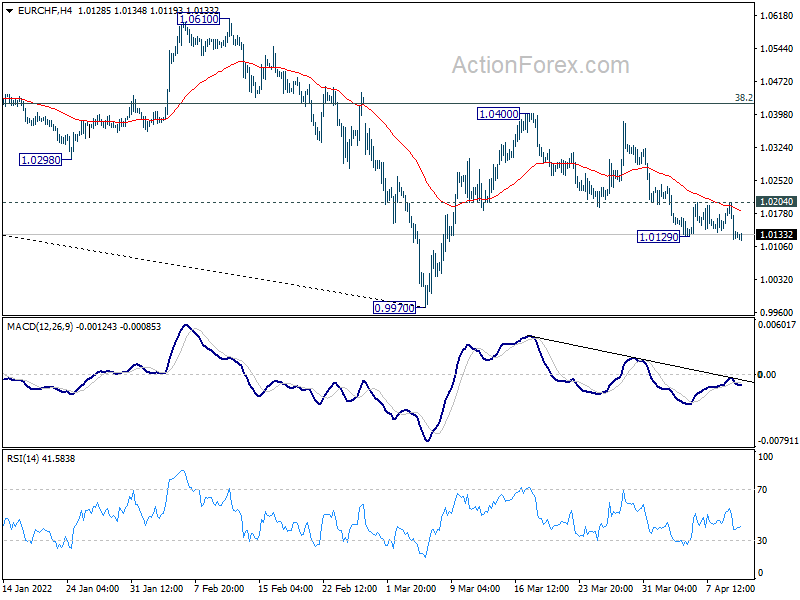
Intraday bias in EUR/CHF is back on the downside as fall from 1.0400 resumes. As noted before, rebound from 0.9970 could have completed already. Deeper fall is now expected to retest 0.9970 low. On the upside, however, break of 1.0204 minor resistance will turn bias back to the upside for 1.0400 resistance instead.
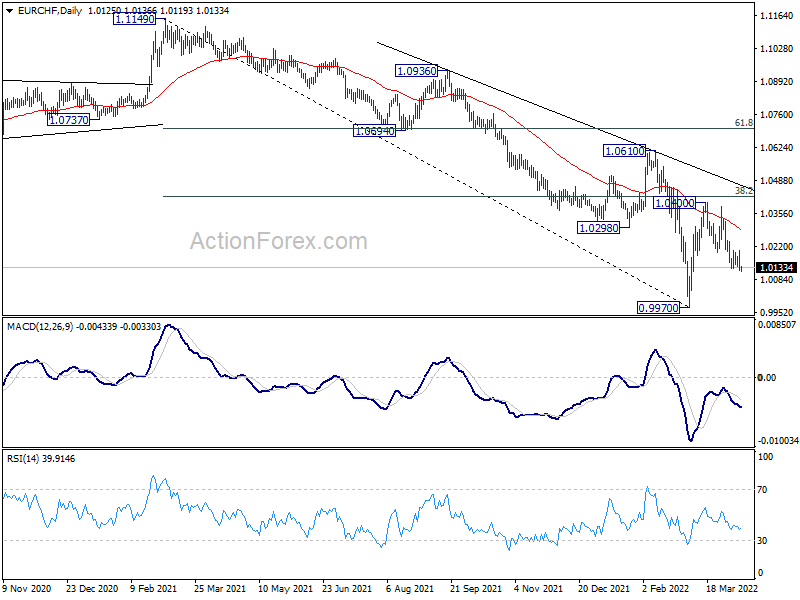
In the bigger picture, long term down trend from 1.2004 (2018 high) is still in progress. Next target is 100% projection of 1.2004 to 1.0505 to 1.1149 at 0.9650. In any case, sustained break of 1.0505 support turned resistance (2020 low) is needed to be the first sign of medium term bottoming. Otherwise, outlook will remain bearish.
EUR/USD Daily Outlook
Daily Pivots: (S1) 1.0860; (P) 1.0897 (R1) 1.0920; More...
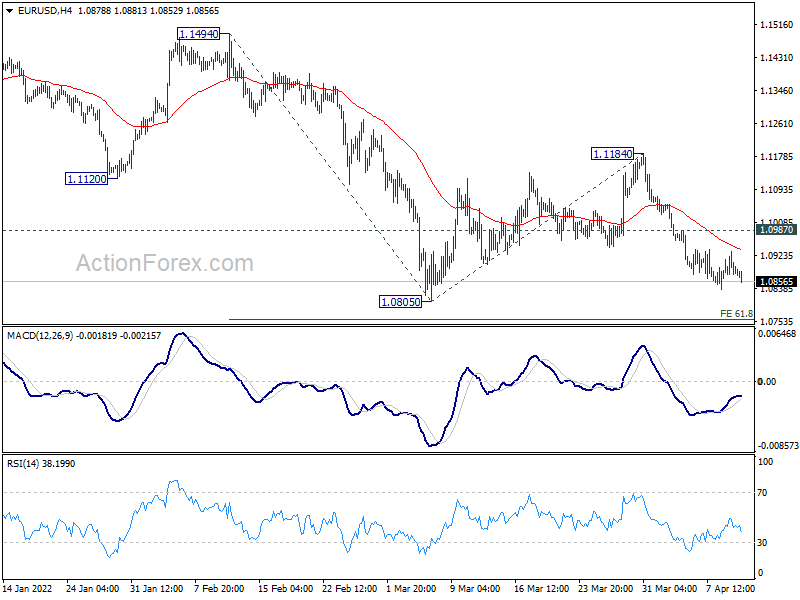
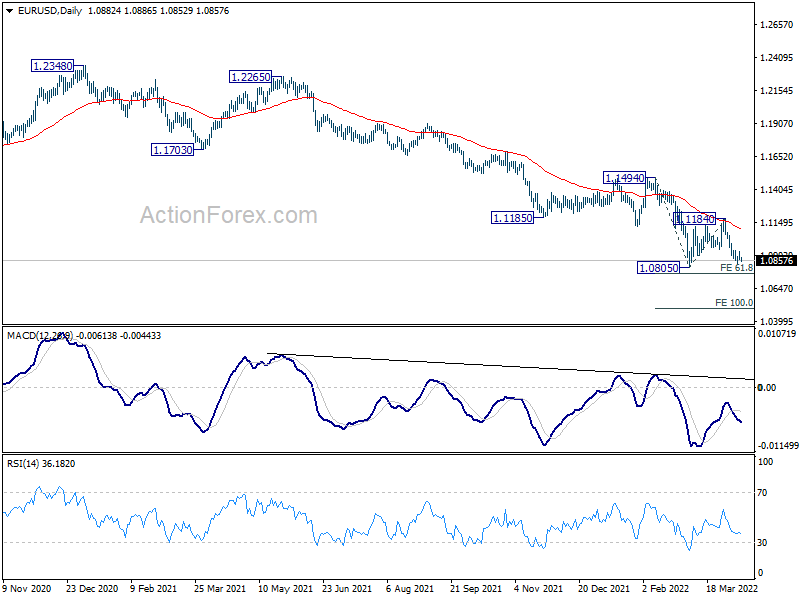
Intraday bias in EUR/USD remains neutral and outlook is unchanged. Further decline is in favor with 1.0987 minor resistance intact. On the downside, decisive break of 1.0805 low will resume larger down trend. Next target is 61.8% projection of 1.1494 to 1.0805 from 1.1184 at 1.0758, and then 100% projection at 1.0495. On the upside, above 1.0987 minor resistance will turn bias back to the upside for 1.1184 resistance instead.
In the bigger picture, the decline from 1.2348 (2021 high) is expected to continue as long as 1.1494 resistance holds. Firm break of 1.0635 (2020 low) will raise the chance of long term down trend resumption and target a retest on 1.0339 (2017 low) next. Nevertheless, break of 1.1494 will maintain medium term neutral outlook, and extending term range trading first.
GBP/USD Daily Outlook
Daily Pivots: (S1) 1.2993; (P) 1.3025; (R1) 1.3061; More...
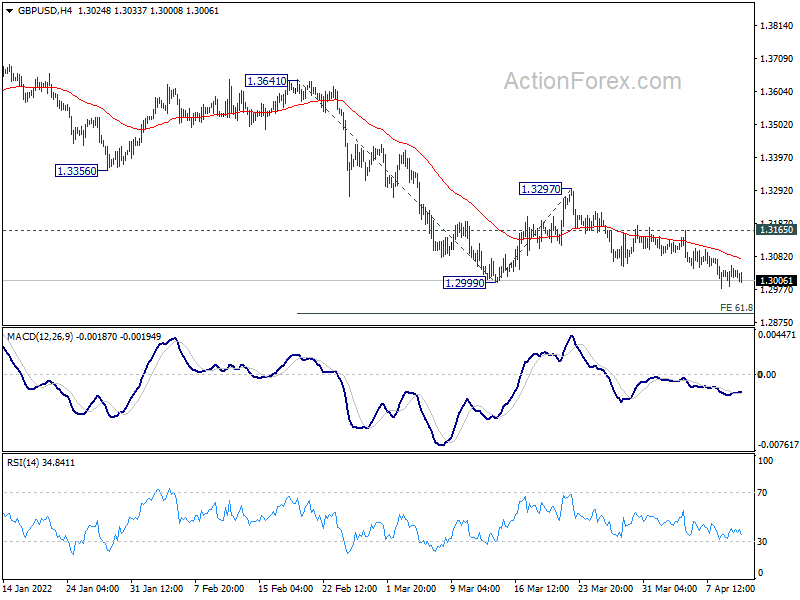
No change in GBP/USD's outlook and intraday bias remains mildly on the downside. Current down trend from 1.4248 is in progress for 61.8% projection of 1.3641 to 1.2999 from 1.3297 at 1.2900. On the upside, break of 1.3165 resistance is needed to indicate short term bottoming. Otherwise, outlook will remain bearish in case of recovery.
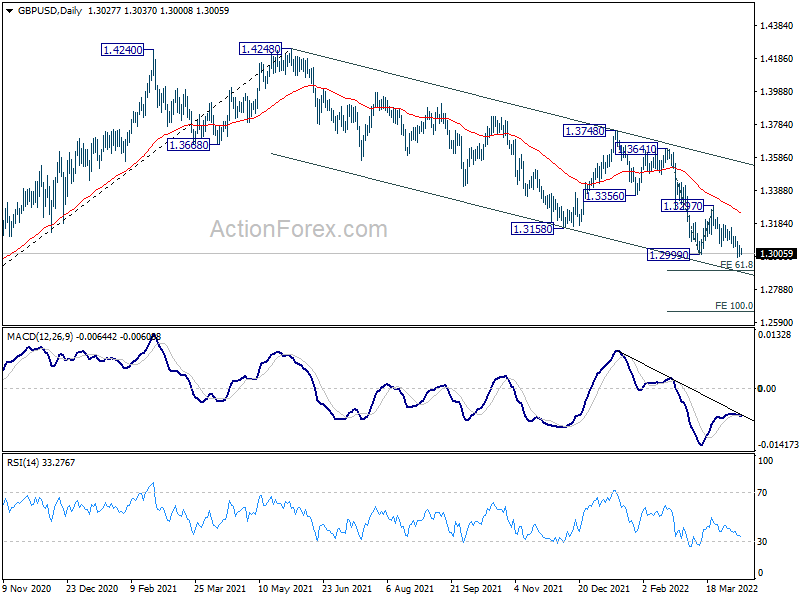
In the bigger picture, rise from 1.1409 (2020 low) has completed at 1.4248. Decline from 1.4248 could still be a corrective move, or it could be the start of a long term down trend. In either case, deeper decline would be seen back to 61.8% retracement of 2.1161 to 1.1409 at 1.2493. In any case, break of 1.3748 resistance is needed confirm completion of the fall from 1.4248, or outlook will stay bearish.
USD/CHF Daily Outlook
Daily Pivots: (S1) 0.9287; (P) 0.9329; (R1) 0.9355; More....
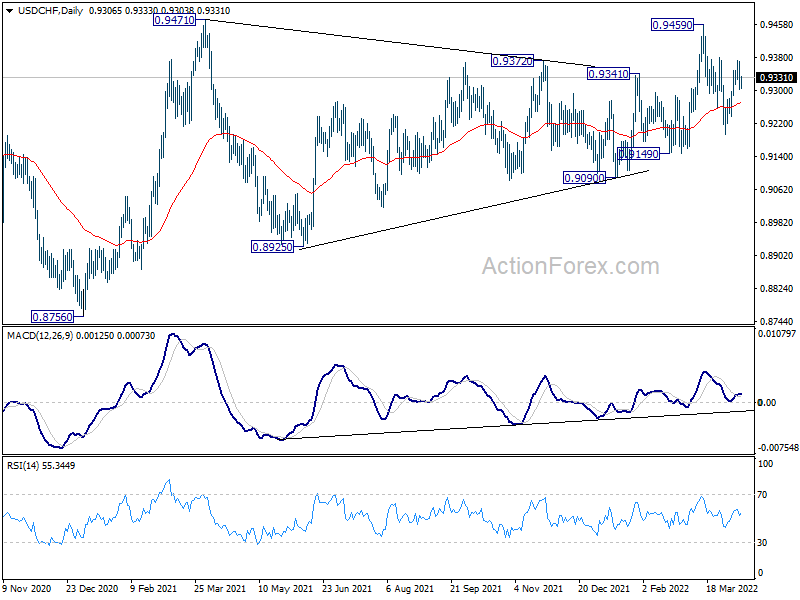
Intraday bias in USD/CHF remains neutral and outlook is unchanged. On the upside, firm break of 0.9380 should confirm that fall from 0.9459 has completed with three wave down to 0.9193. Such development will revive near term bullishness and turn bias back to the upside for 0.9459 and then 0.9471 resistance. On the downside, below 0.9280 minor support will turn bias to the downside for 0.9193 support next.
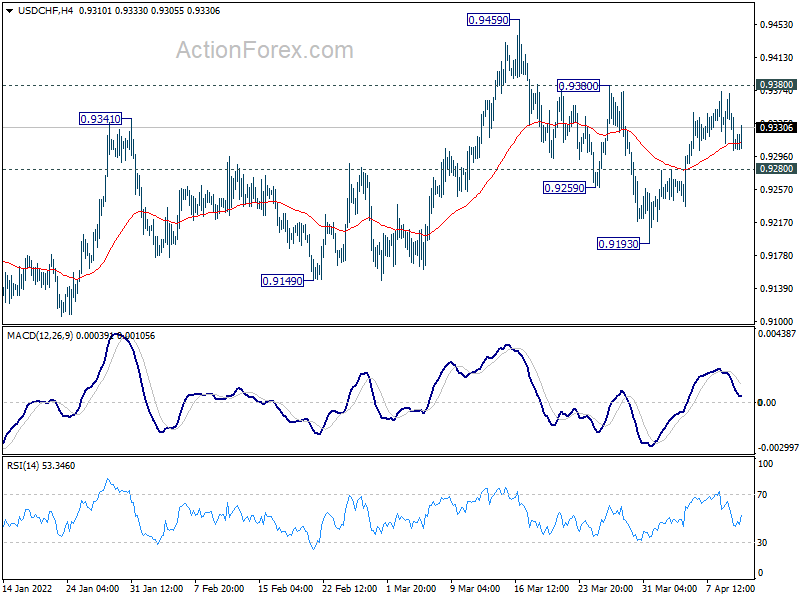
In the bigger picture, medium term outlook will be neutral at best as long as 0.9471 resistance holds. Larger down trend could still extend through 0.8756 (2021 low). However, firm break of 0.9471 will argue that whole down trend form 1.0342 (2016 high), has completed with waves down to 0.8756. A medium term up trend should be set up to target 1.0237/0342 resistance zone.
USD/JPY Daily Outlook
Daily Pivots: (S1) 124.36; (P) 125.07; (R1) 126.10; More...
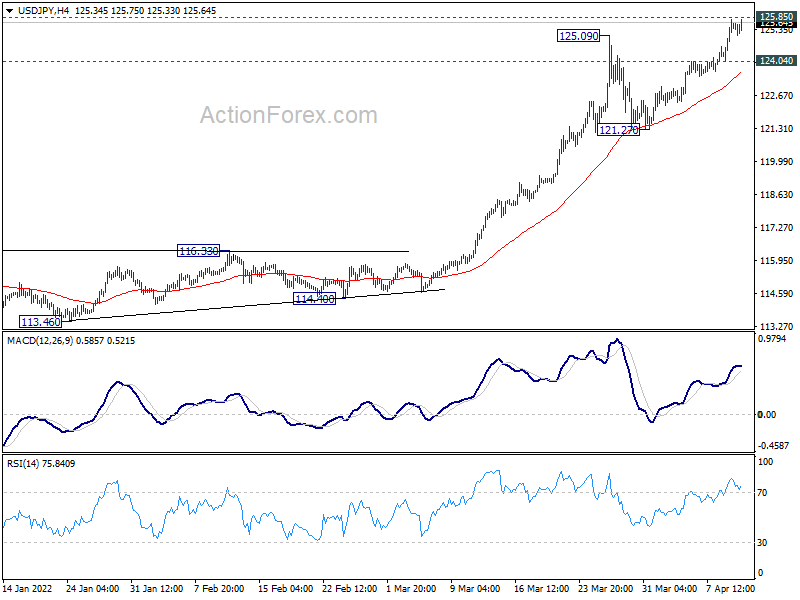
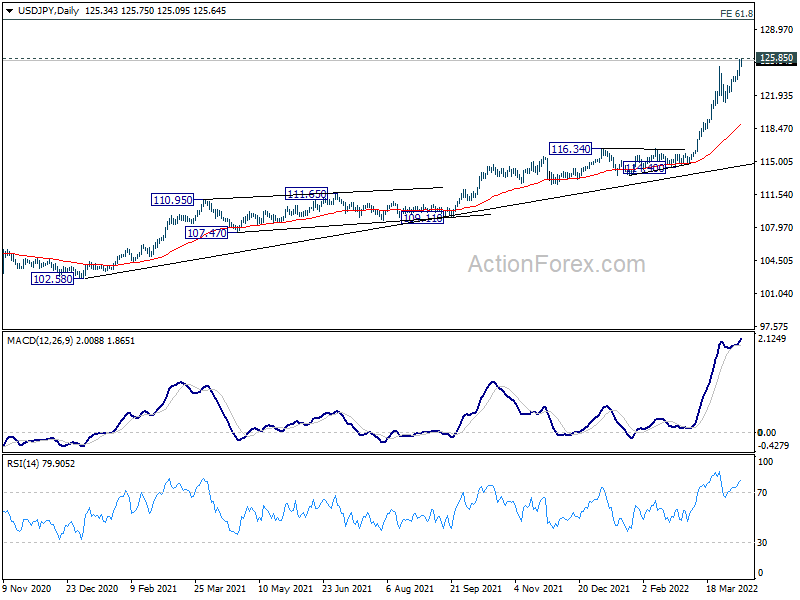
Intraday bias in USD/JPY remains on the upside, with focus on 125.86 long term resistance. Sustained break there will pave the way to 130.04 long term projection level next. On the downside, below 123.44 minor support will turn intraday bias neutral first. But outlook will stay bullish as long as 121.27 support holds.
In the bigger picture, up trend from 98.97 (2016 low) is in progress for retesting 125.85 (2015 high). Sustained break there will confirm long term up trend resumption. Next target will be 61.8% projection of 75.56 (2011 low) to 125.85 (2015 high) from 98.97 at 130.04. This will now remain the favored case as long as 116.34 resistance turned support holds.
AUD/USD Daily Report
Daily Pivots: (S1) 0.7401; (P) 0.7433; (R1) 0.7453; More...
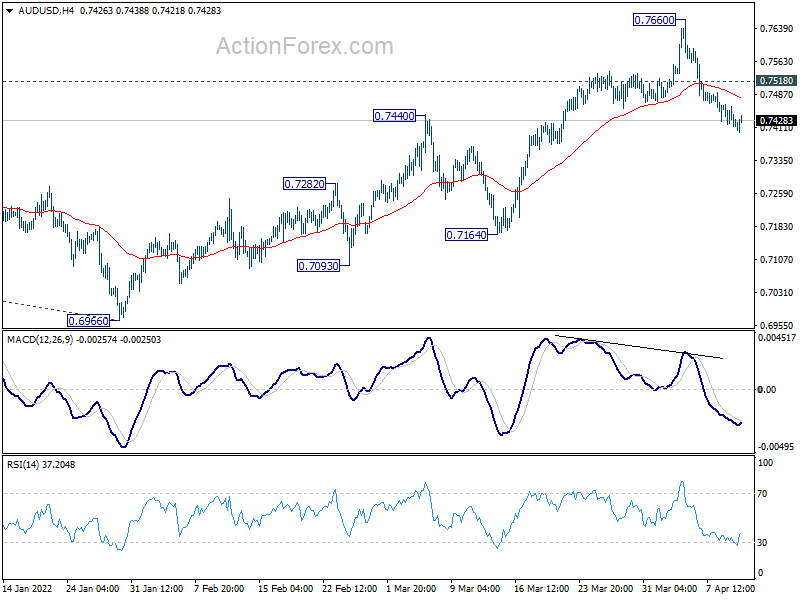
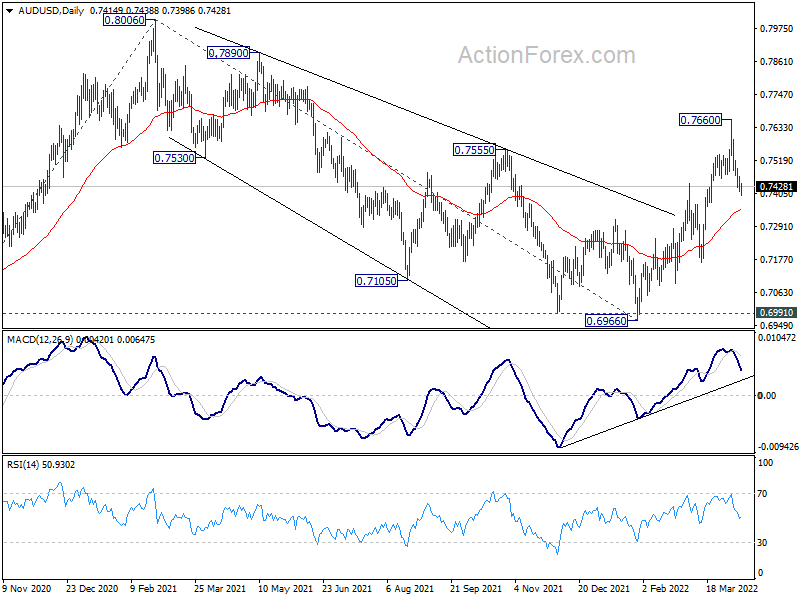
Intraday bias in AUD/USD remains mildly on the downside for the moment. Pull back from 0.7660 short term top is in progress for 55 day EMA (now at 0.7349). On the upside, above 0.7518 minor resistance will turn bias back to the upside for 0.7660. Firm break there will resume larger rise from 0.6991 to retest 0.8006 high.
In the bigger picture, correction from 0.8006 could have completed at 0.6966, after drawing support from 0.6991. That is, up trend from 0.5506 (2020 low) might be ready to resume. Firm break of 0.8006 will target 61.8% projection of 0.5506 to 0.8006 from 0.6966 at 0.8511 next. This will remain the favored case as long as 0.7164 support holds.
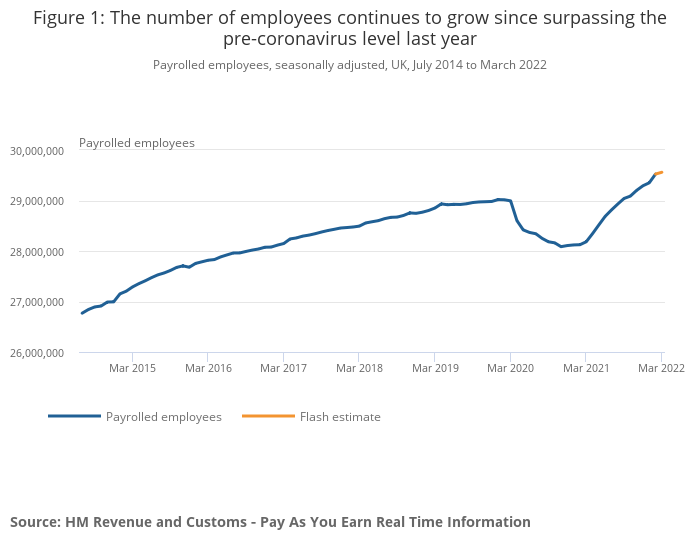
UK payrolled employees rose 35k in Mar, unemployment rate dropped to 3.8% in Feb
UK payrolled employees rose 35k in March, comparing to February. Number of payrolled employees were 544k or 1.9% above prepandemic level in February 2020. Claimant count dropped -46.9k, larger than expectation of -41.1k.
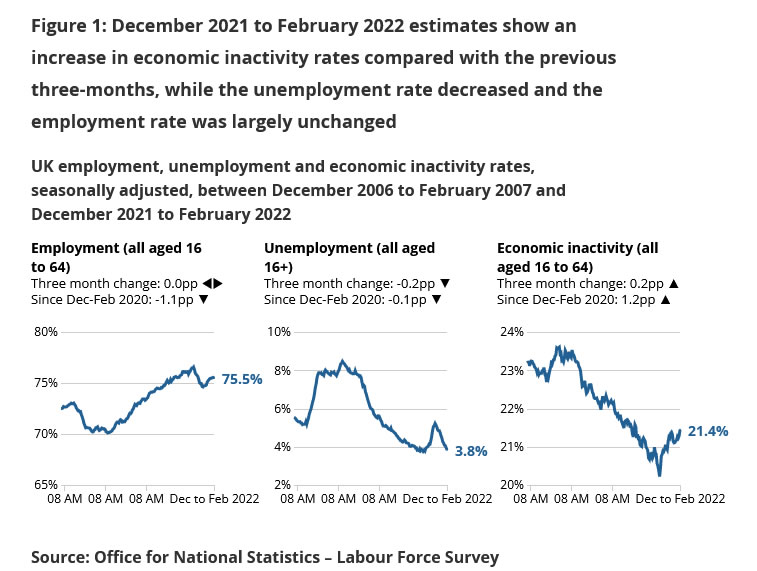
In the three months to February, unemployment rate dropped to 3.8% matched expectations. That's -0.2% lower than the previous three-month period, and -0.1% below pre-pandemic levels. Average earnings including bonus rose 5.4% over the year, below expectation of 5.7%. Average earnings excluding bonus jumped 4.0% over the year, above expectation of 3.7%.
Inflation is All that Matters
All eyes are on US inflation data today. Investors feel the heat before today’s inflation print. All three major indices extended losses yesterday, as the S&P500 dropped 1.70% and slipped again below its 50-DMA, while Nasdaq, which is the most sensitive to the rates lost close another 2.20%, bringing the past five-day losses to above a trillion US dollars. A CPI figure at or ideally below expectations could cool down the recent selloff, but a figure above expectations will likely further boost the Fed hawks and weigh on the equity appetite.
The consumer prices in the US are expected to print an advance to the eye-watering level of 8.5% in March, from 7.9% printed a month earlier. And of course, there is a chance that we see a higher print on the back of higher energy and commodity prices, rising wages and rising rents.
Fed’s Loretta said that price growth will probably remain above the 2% mark into next year, though the overall trajectory will be downward. A more relevant question is, will they continue progress higher from the actual levels - and despite the Fed tightening, or will they top before they hit the 9 or even the 10% mark, before they start easing. How fast the Fed could bring down inflation that is mostly caused by supply side problems, by restricting demand, and how will the rising inflation and the rising rates to tame inflation will impact the market?
Bitcoin, a proxy for Nasdaq?
Bitcoin slipped below the $40K mark as the broad risk selloff tainted on the mood in cryptocurrencies, as well. It is now clear that Bitcoin trades parallel to the risk assets, rather than a safe haven. In fact, the latest data even shows that the 90-day correlation between Bitcoin and Nasdaq advanced to the highest levels on record, near 60%.
Bitcoin is still not the digital gold, it’s more of a crypto-proxy for Nasdaq apparently.
Gold up
Gold advanced to $1970 per ounce as a broad-based risk selloff benefited to the yellow metal on Monday. The rising US yields is not fundamentally positive for gold appetite, as it increases the opportunity cost of holding the non-interest bearing gold, but the bond markets is simply not a safe option right now, as the selloff will certainly extend on Fed’s tightening plans and the rising geopolitical tensions, as the West is willing to arm Ukraine – given that sanctions do little to get Putin out of the country, appears to be giving some support to the yellow metal.
Crude oil rebounded after extending losses below $93pb yesterday. We will probably see an increased appetite from dip buyers approaching the $90pb psychological support.
In the FX
The US dollar index consolidates a touch below the 100 mark, as investors love the US dollar either for being a good reserve asset, a safe safe-haven, or simply a good investment. A recent poll by Bloomberg Markets Live survey shows that 56% see the dollar gaining more this quarter versus less than 30% that expect a drop. So, the stronger dollar is the baseline expectation.
The wider divergence between the more hawkish Fed and the relatively little responsive ECB continues weighing heavily on the EURUSD. European consumer prices are rising at a pace which is as scary as the US’, while the wages grow much less than the US meaning that the Europeans experience a bigger loss for their purchasing power. Bloomberg Economics writes that their base case scenario is that the energy costs would remain elevated in quarters to come, which would push inflation to a peak above 8% in July and squeeze households’ spending power.
The ZEW index due today will confirm how fast the sentiment deteriorates in Germany. An ugly figure could further weigh on the single currency, but we will probably see a floor into the 1.08 level in the EURUSD before Thursday’s ECB decision, just in case the ECB would sound more hawkish.
EUR/USD Unaffected by Rising European Rates and Election
Market movers today
This morning, the UK jobs report is due out. We are in particular interested in the number of payrolled employees for March, which covers the period after the Russian invasion. Based on the US jobs report, which was decent, we do not expect a major impact on the UK labour market despite elevated geopolitical uncertainty and rising commodity prices. It is, however, important to keep in mind that labour market indicators are lagging activity indicators.
We also receive the German ZEW survey for April. ZEW declined significantly in March due to the Russian invasion and consensus expects another decline. Uncertainty is still high but a decline in VIX and a small rebound in stock markets pull in the other direction.
Today's most important data release is the US CPI inflation print due out 14:30 CEST. Inflation likely rose to above 8% due to mainly a jump in commodity prices but we also expect core inflation rose further. This puts a lot of pressure on the Fed to tighten monetary policy more rapidly (front-loading rate hikes).
Also keep an eye on the US NFIB Small Business survey due out 12:00 CET, which includes a lot of interesting data on labour demand, wage compensation plans and whether businesses still expect to hike prices in coming months.
The 60 second overview
European yields going up: European rates gradually grinded higher through the day, with 10Y German yields touching 0.82%, which is the highest since 2015. French bonds was the main performer after Sunday's first round presidential election as OATs-Bund spreads tightened some 5.5bp. Rising interest rates continue to see momentum with no particular circuit breaker. We doubt Thursday's ECB meeting could provide such a circuit breaker as inflation will continue to run high for the coming months and hence spill-over from the US or faltering growth expectations is where we believe we should look for any such trigger.
Rally in EUR/USD fades: The initial rally we saw on opening of EUR/USD trading on Sunday (during Asian hours) was faded during Monday's trading. The French election was likely the key source of the rally but we view the election as having a generally very small effect on EUR/USD spot. Hence, the fade was likely in part due to 1) the rally happened during illiquid hours of trading and 2) there continue to be downwards pressure on EUR/USD spot from which (1) likely provided speculators with an entry to short further. We continue to forecast 1.05 in 12M.
Equities: Global equities lower yesterday as the stagflation trade continued, yesterday with the stagnation part as the dominating force. Both the US and European session ending close to day low and futures are lower on both side of the Atlantic this morning. Defensive value outperforming with banks doing better than one could expect in a stagnating environment. However, this is in line with our argumentation that value should outperform quality currently despite pundits arguing for quality to be the best factor in a staflationary environment. With yields and not least real yields moving sharply higher it will hurt growth stocks and it's very hard to make a quality basket without getting growth stock on board as well. Value has outperformed quality by more than 10% year to data but valuation suggest there is more to come. Uncertainty moved higher yesterday with VIX north of 24.
In US Dow -1.2%, S&P 500 -1.7%, Nasdaq -2.2% and Russell 2000 -0.7%. Asian markets are in red this morning but not driven by China news but instead the global risk off sentiment spilling into Asia as well
FI: European rates gradually grinded higher through the day.
FX: Alongside RUB, NOK was yesterday's underperformer with EUR/NOK moving back towards 9.60. EUR/SEK also edged higher and broke solidly through the 9.30 threshold. EUR/USD erased the initial gains close to 1.0950 and ended the session back below the 1.09 figure. EUR/GBP mirrored EUR/USD price action.
Credit: Mirroring the overall soft sentiment, credit markets continued to see widening in CDS indices on Monday. iTraxx Main closed the day 1bp wider at 78bp, while iTraxx Xover was 4bp wider at 376bp.
Technical Outlook and Review
DXY:
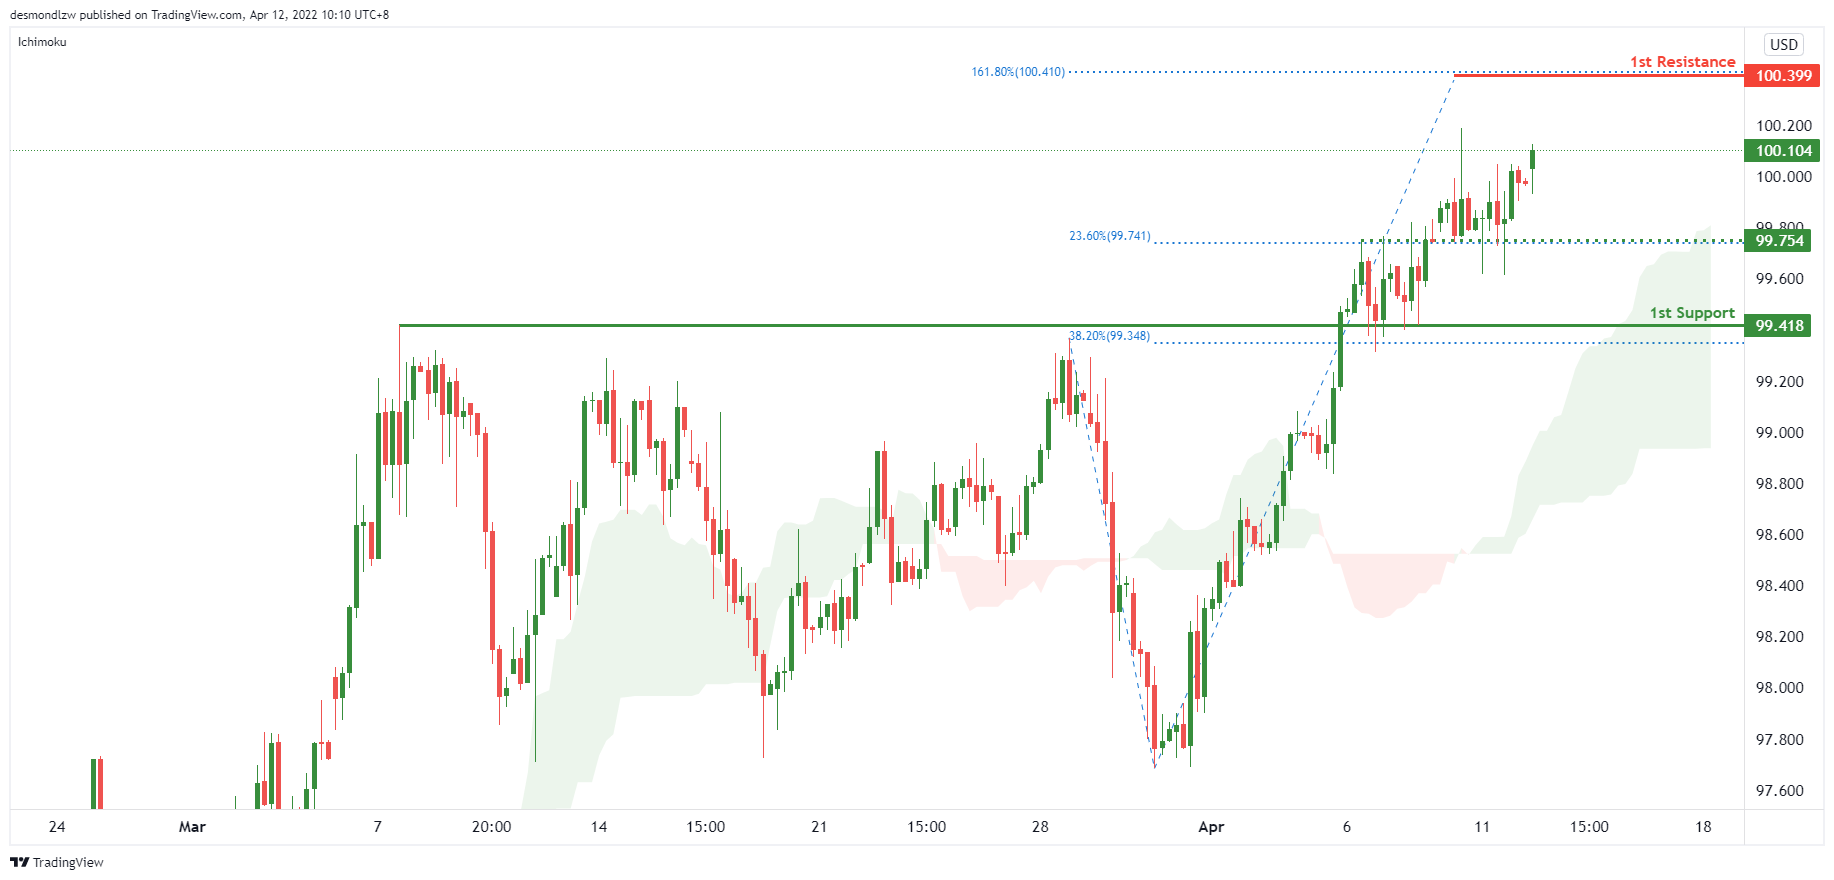
On the H4 timeframe, prices are consolidating on an intermediate support. We see the potential for a bounce from our intermediate support at 99.754 in line 23.6% Fibonacci retracement towards our 1st resistance at 100.399 in line with 161.8% Fibonacci projection. Prices are trading above our ichimoku cloud support, further supporting our bullish bias.
Areas of consideration:
- H4 time frame, 1st resistance at 100.399
- H4 time frame, 1st support at 99.754
XAU/USD (GOLD):
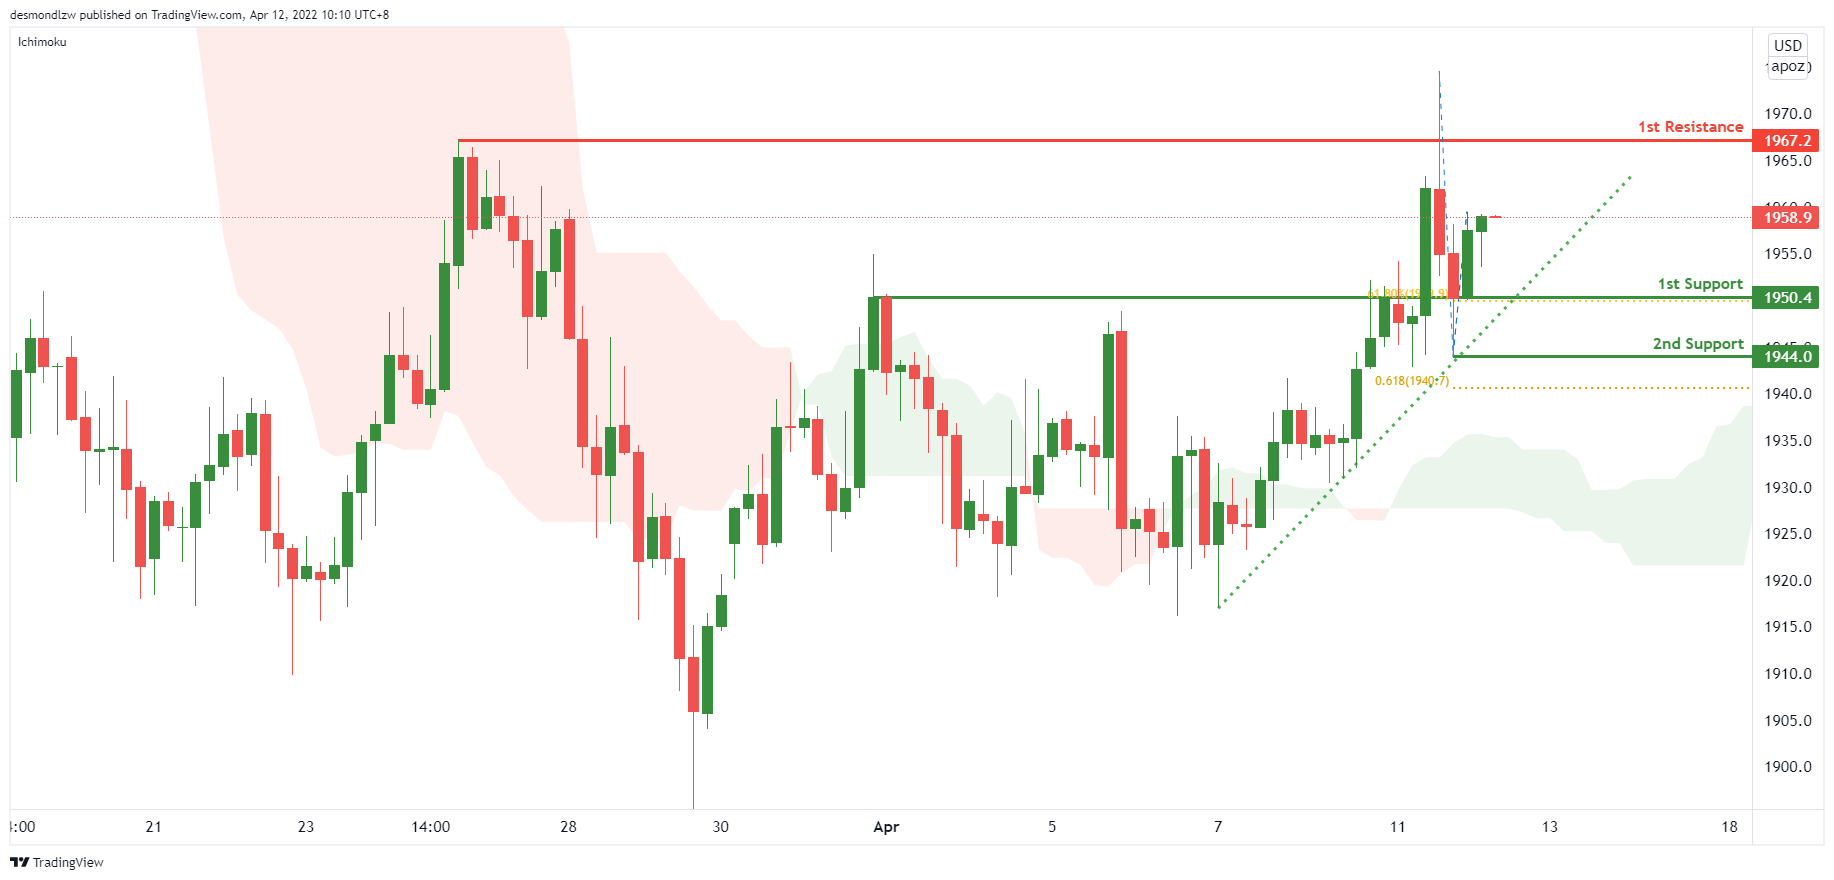
On the H4, prices are on bullish momentum and abiding by our ascending trendline. We see the potential for a bounce from our 1st support at 1950.4 in line with 61.8% Fibonacci retracement towards our 1st resistance at 1967.2 which is a graphical swing high. Prices are trading above our ichimoku cloud support, further supporting our bullish bias.
Areas of consideration:
- 4h 1st support at 1950.4
- 4h 1st resistance at 1967.2
GBP/USD:
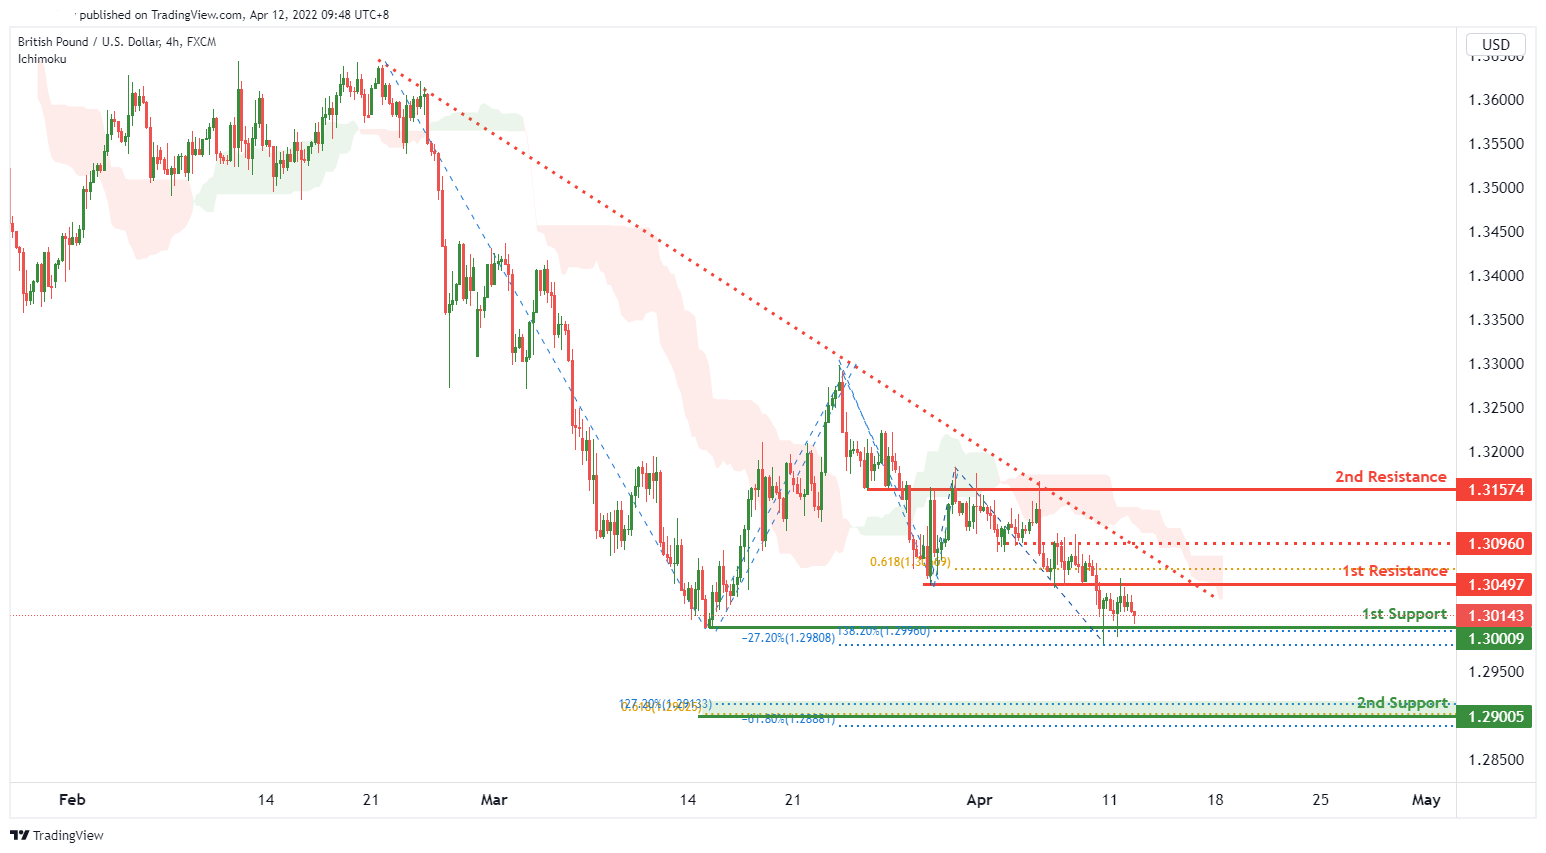
On the H4 timeframe, we expect to see a potential for bullish bounce from our 1st support level of 1.30009 in line with 138.2% Fibonacci extension and -27.2% Fibonacci expansion towards the 2nd resistance level of 1.31574 in line with a graphical overlap resistance. Alternatively, price might potentially dip from 1st resistance level of 1.30497 in line with 61.8% Fibonacci projection towards the 2nd support level of 1.29005 in line with Fibonacci confluence (61.8% Fibonacci projection, 127.2% Fibonacci extension and -61.8% fibonacci expansion). We have a neutral bias as we are waiting for price confirmation.
Areas of consideration:
- H4 1st resistance at 1.30497
- H4 1st support at 1.30009
USD/CHF:
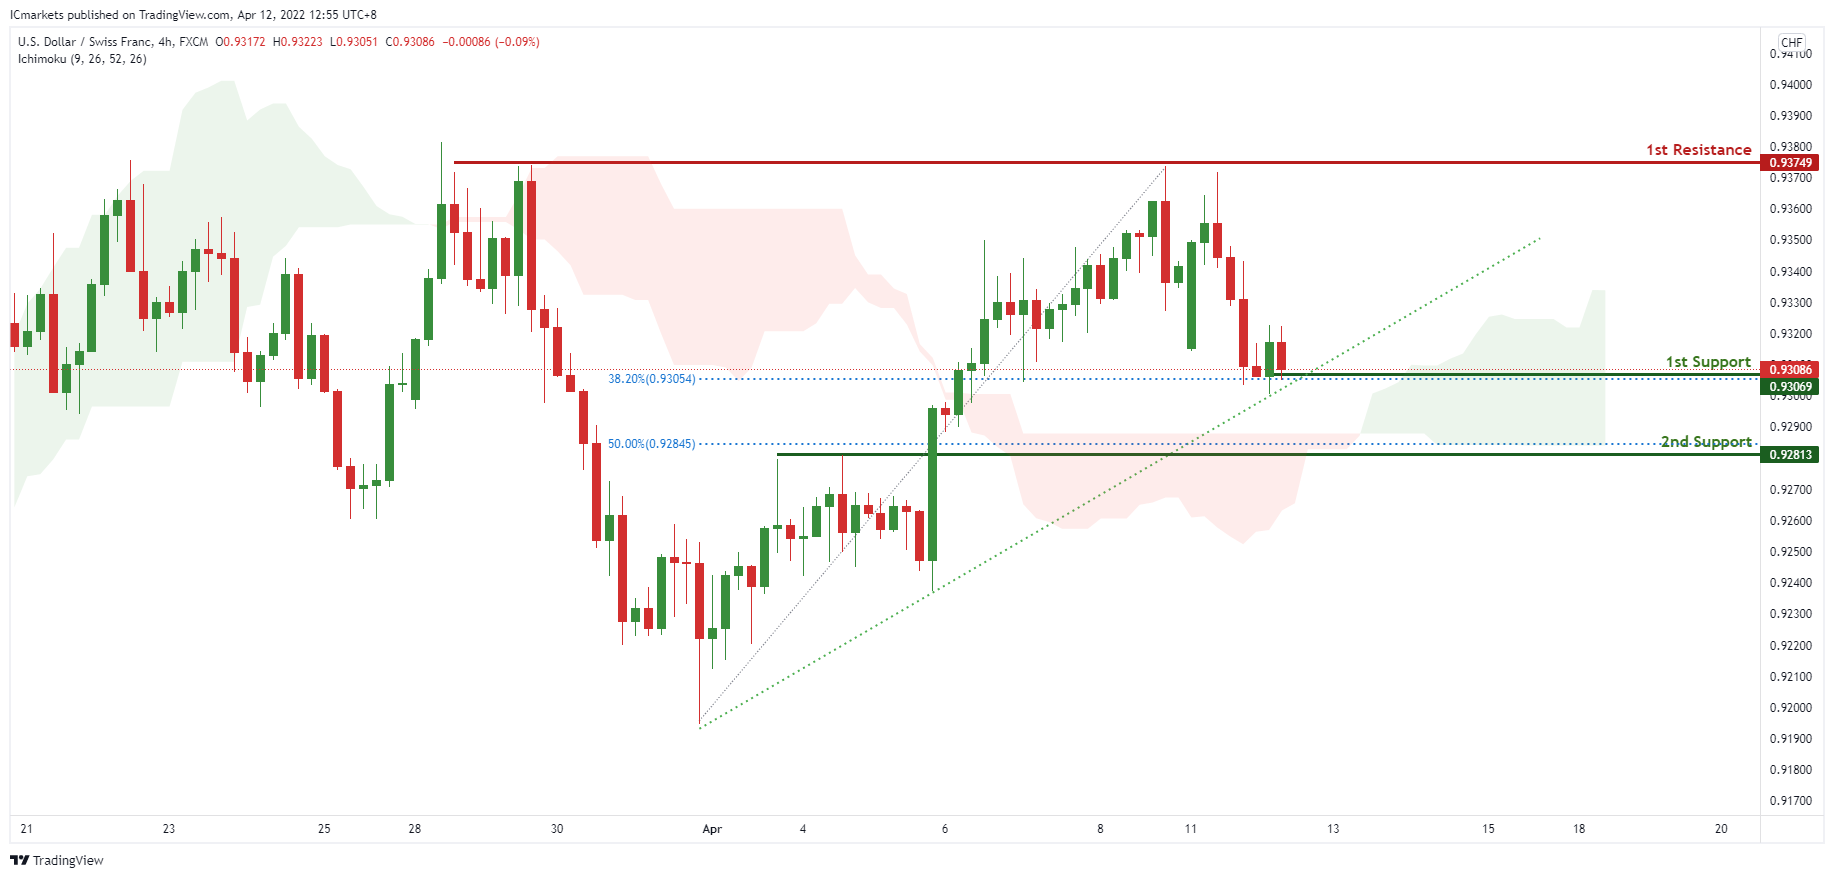
On the H4, prices are on bullish momentum and abiding by an ascending trendline support. We see the potential for further bullish continuation from our 1st support at 0.93069 in line with 38.2% FIbonacci retracement towards our 1st resistance at 0.93749 which is a graphical swing high and strong graphical resistance. Prices are trading above our ichimoku clouds, further supporting our bullish bias.
Areas of consideration
- 1st support level at 0.93069
- 1st resistance level at 0.93749
EUR/USD :
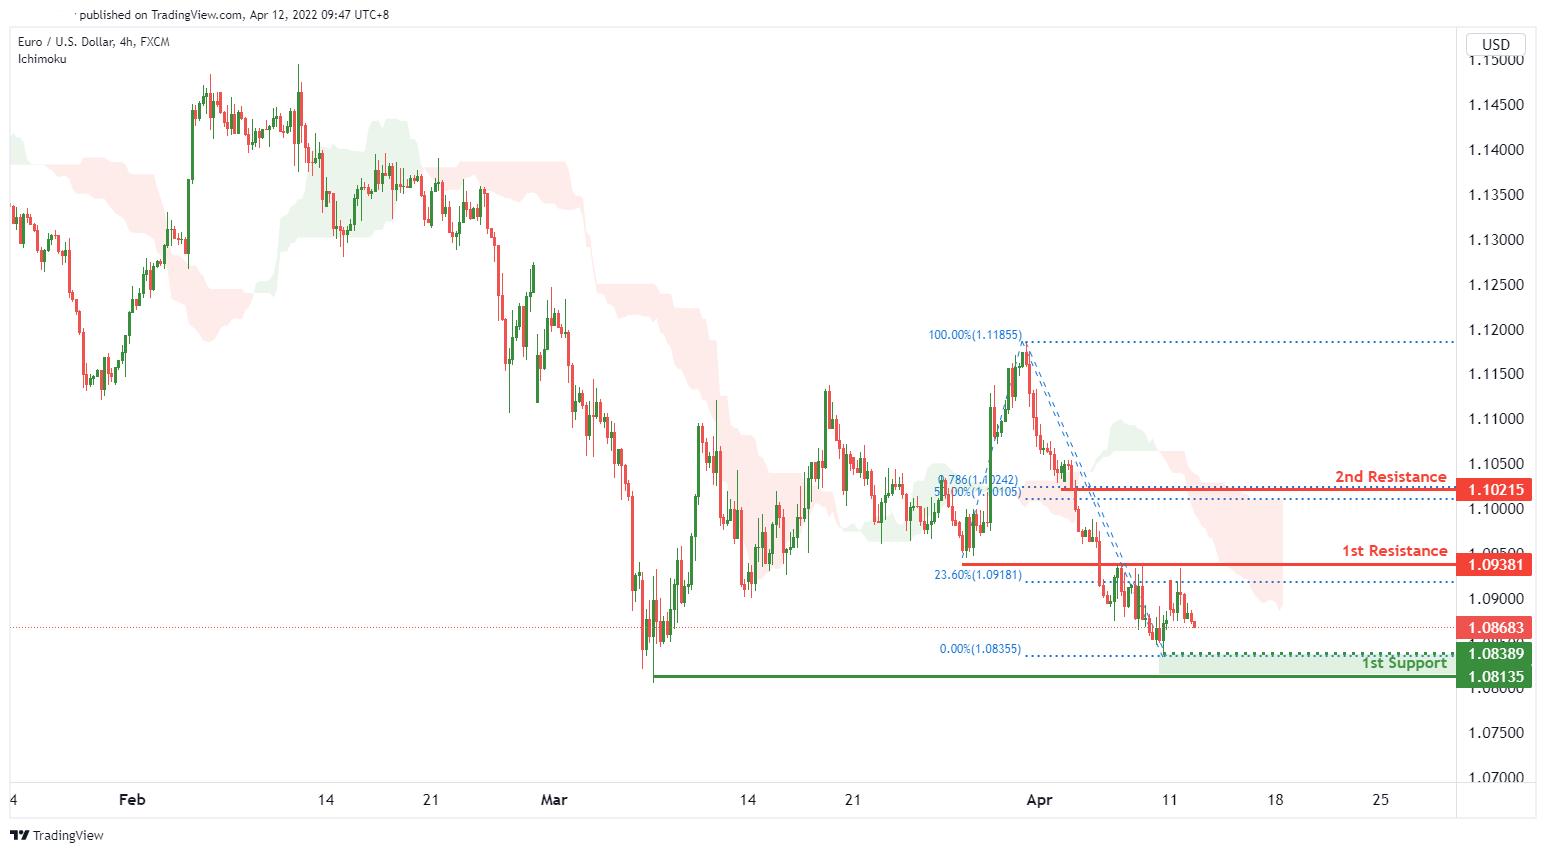
On the H4 timeframe, price is near a key pivot. We see the potential for a bearish reversal from our 1st resistance level of 1.09381 in line with 23.6% Fibonacci retracement towards our 1st support level of 1.08135 in line with a graphical swing low support. Our bearish bias is supported by price trading below the ichimoku cloud indicator.
Areas of consideration :
- H4 1st resistance at 1.09381
- H4 1st support at 1.08135
USD/JPY:
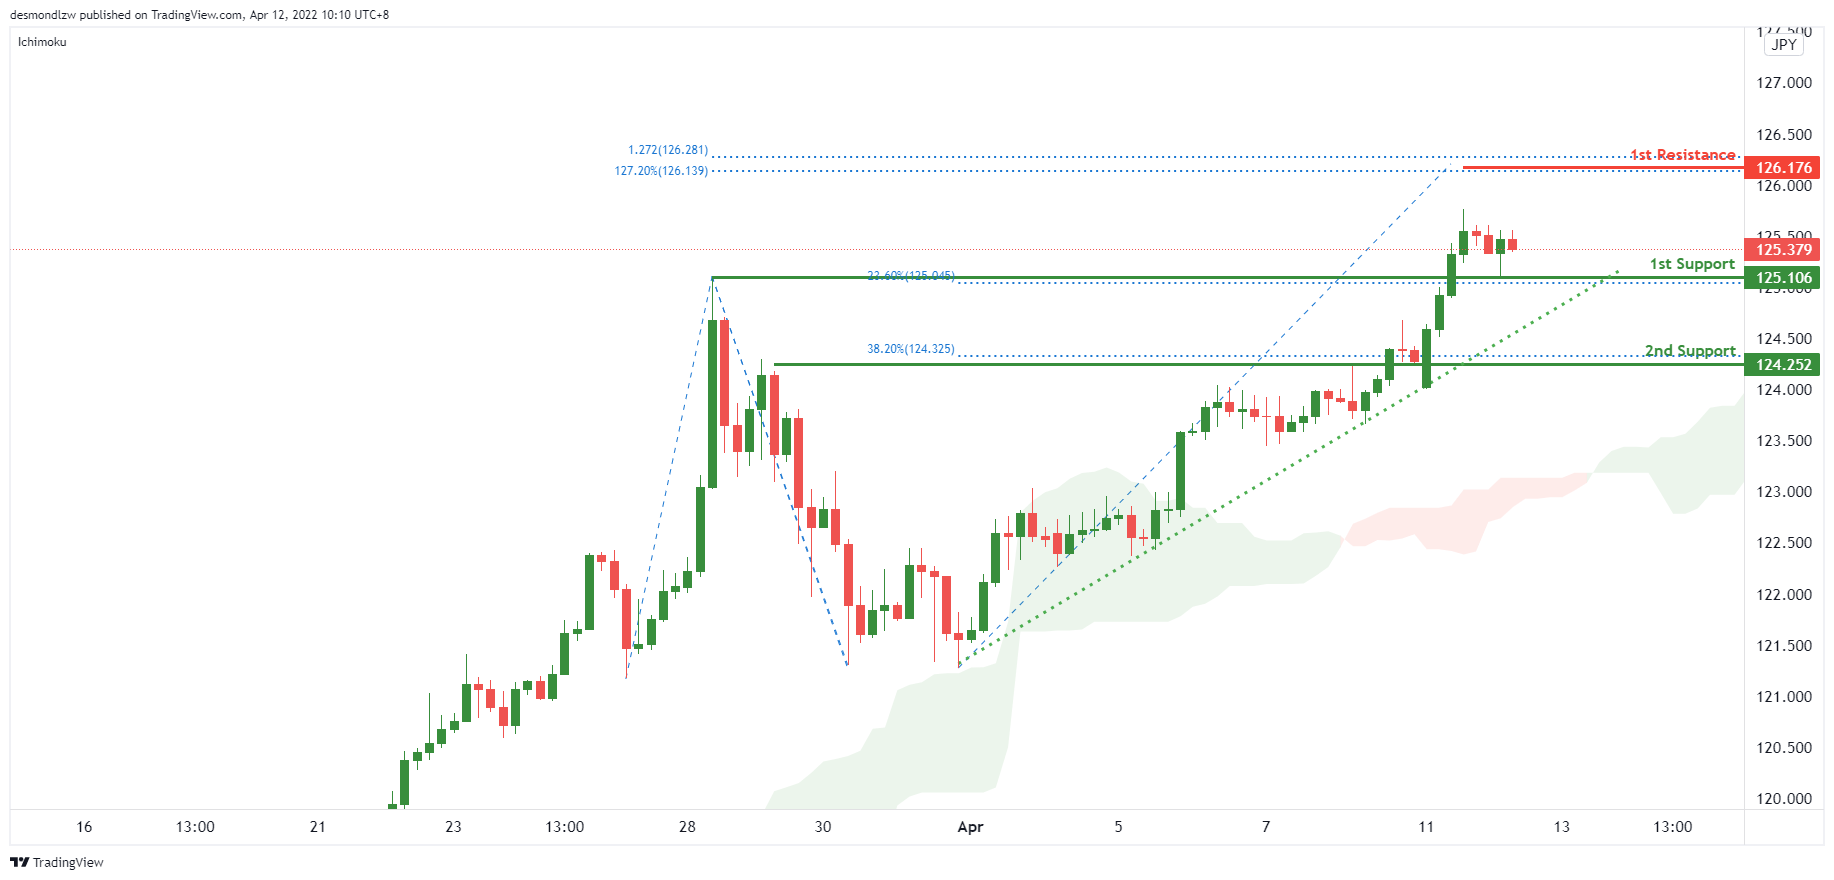
On the H4 timeframe, prices are on bullish momentum and abiding by an ascending trendline support. We see the potential for further bullish continuation from our 1st support at 125.106 in line with 23.6% Fibonacci retracement towards our 1st resistance at 126.176 which is an area of Fibonacci confluences. Breaking out 1st support will find prices dipping towards our 2nd support at 124.252 in line with 38.2% Fibonacci retracement. Prices are trading above our ichimoku clouds, further supporting our bullish bias.
Areas of consideration:
- H4 time frame, 1st resistance at 126.176
- H4 time frame, 1st support at 124.252
AUD/USD:
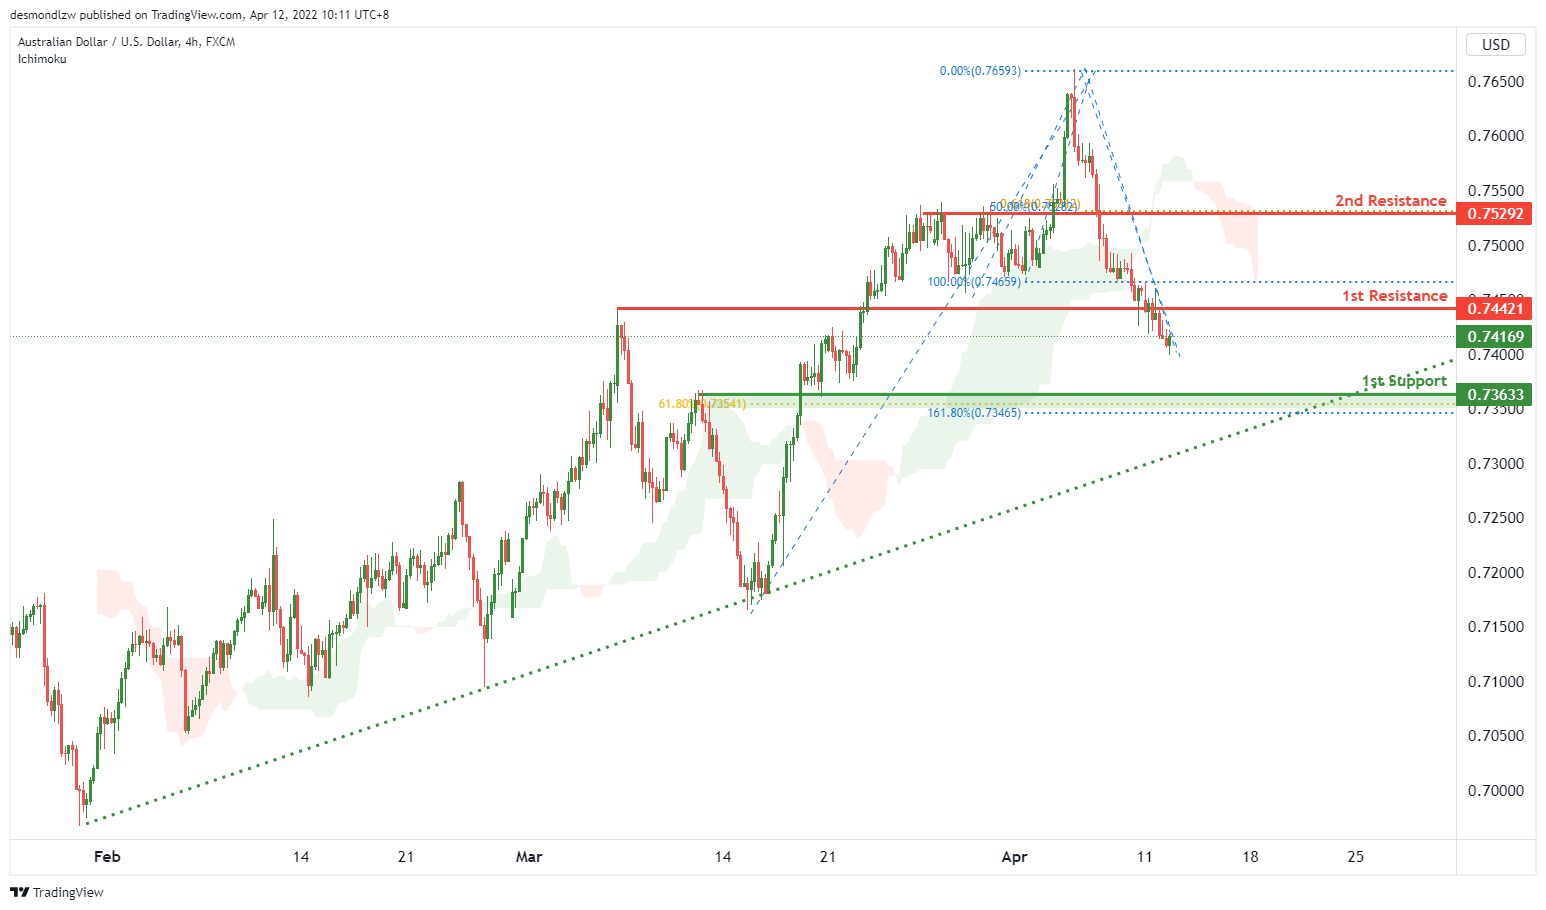
On the H4 timeframe, we see the potential for a bearish continuation from our 1st resistance level at 0.74421 in line with graphical overlap resistance towards our 1st support level at 0.73633 in line with 61.8% Fibonacci retracement and 161.8% Fibonacci extension. Our bearish bias is supported by price trading below the ichimoku cloud indicator.
Areas of consideration
- H4 1st resistance at 0.74421
- H4 1st support at 0.73633
NZD/USD:
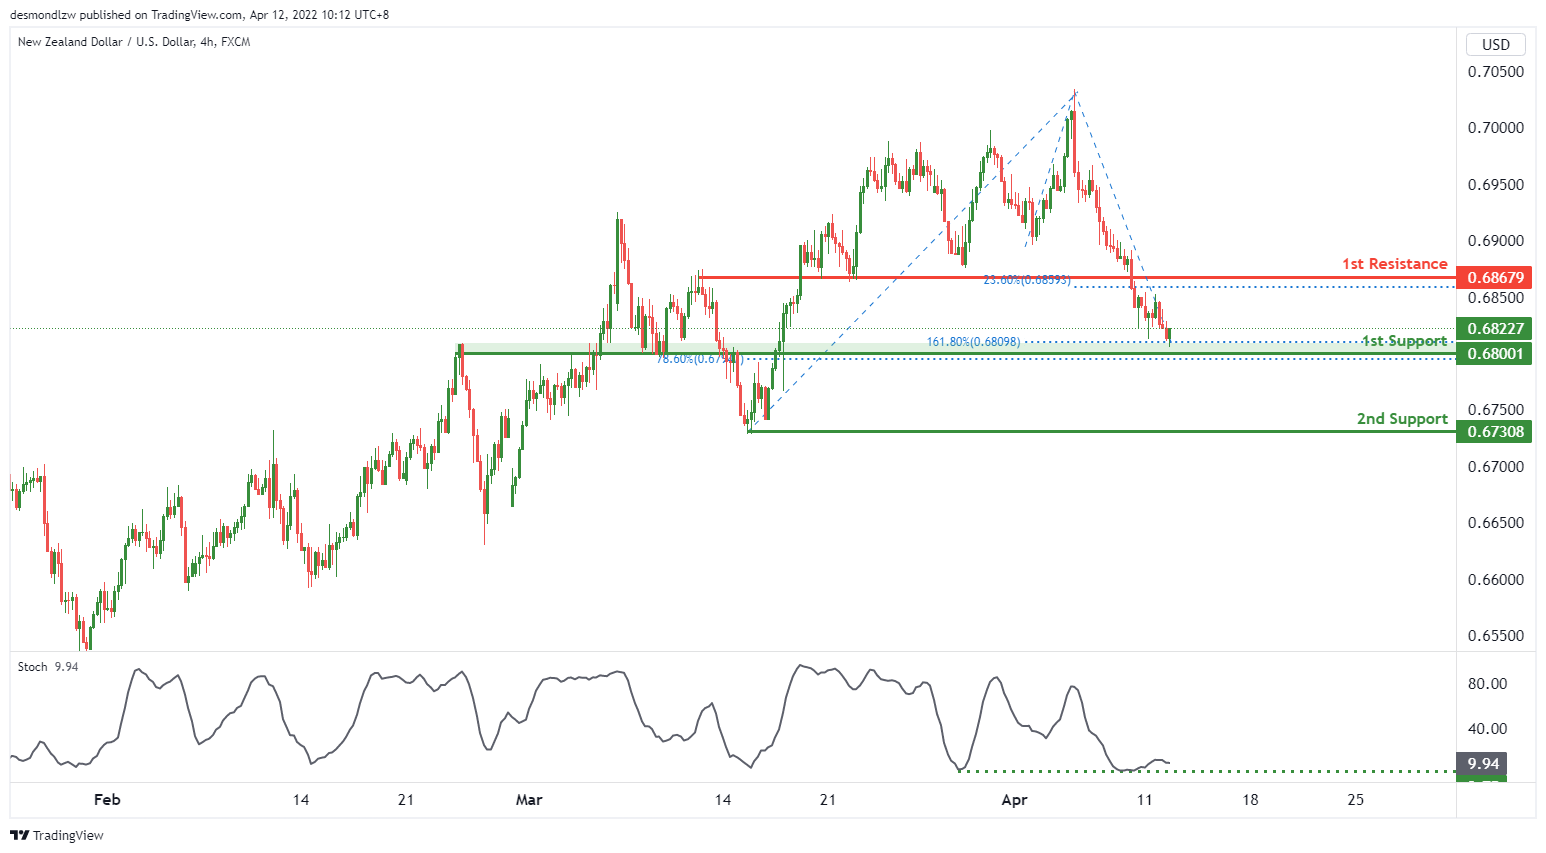
On the H4, we expect to see a potential for a bullish bounce from our 1st support of 0.68001 in line with the 78.6% fibonacci retracement and 161.8% Fibonacci extension towards our 1st resistance level at 0.68679 in line with the 23.6% Fibonacci retracement. Our bullish bias is supported by the stochastic indicator where price is at support level.
Areas of consideration:
- H4 time frame, 1st support at 0.68001
- H4 time frame, 1st resistance at 0.68679
USD/CAD:
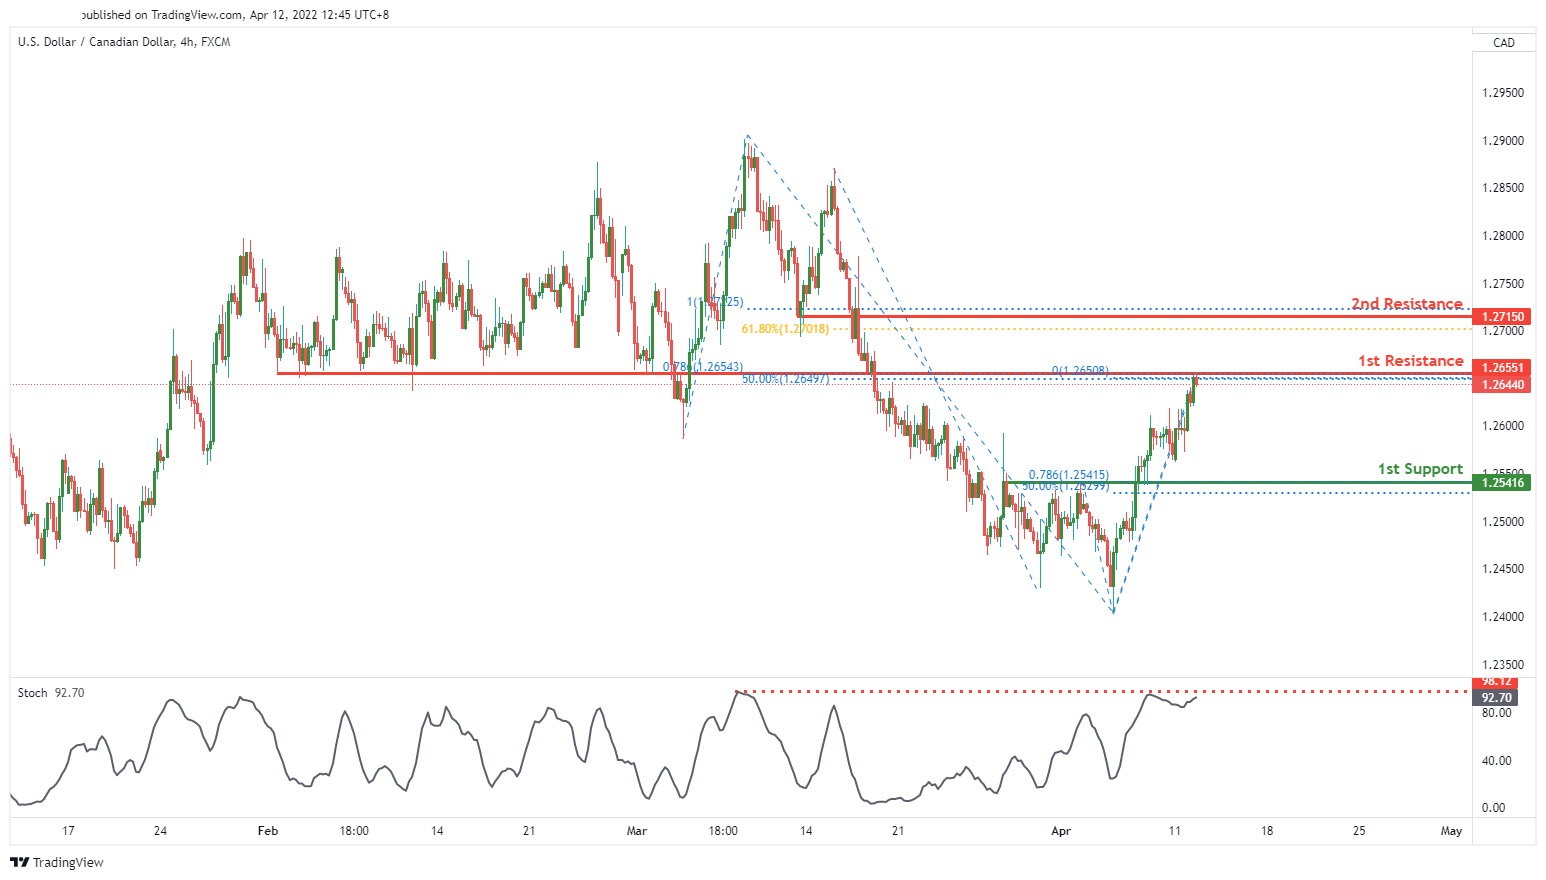
On the H4, we expect a potential for bearish reversal from 1st resistance level of 1.26551 in line with 50% Fibonacci retracement and 78.6% Fibonacci projection towards to 1st support level of 1.25416 in line with 50% Fibonacci retracement and 78.6% Fibonacci projection. Our bearish bias is supported by the stochastic indicator where price is trading at resistance level.
Areas of consideration:
- H4 time frame, 1st support at 1.26551
- H4 time frame, 1st resistance at 1.25416
OIL:
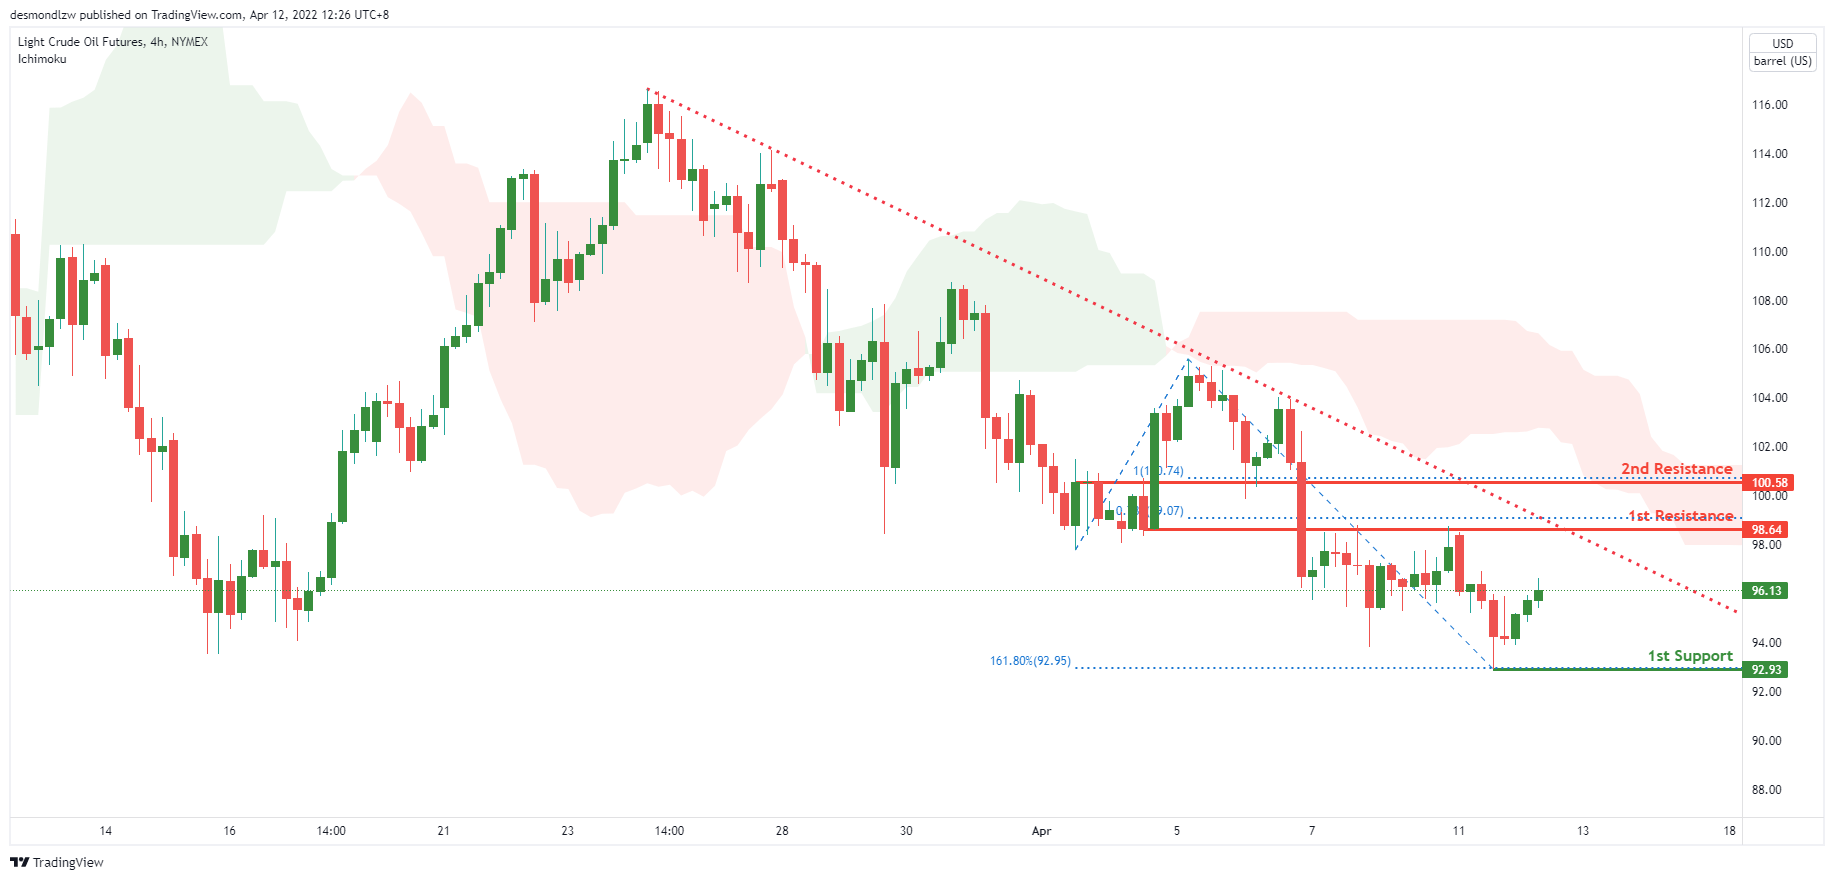
On the H4, prices are on bearish momentum and abiding by a descending trendline. We see the potential for a dip from our 1st resistance at 98.64 in line with 78.6% Fibonacci Projection towards our 1st support at 92.93 in line with graphical swing low and 161.8% Fibonacci projection. Alternatively, price may break 1st resistance and head for 2nd resistance at 100.58 in line with the 100% Fibonacci Projection.
Areas of consideration:
- H4 time frame, 1st resistance of 98.64
- H4 time frame, 1st support of 92.93
Dow Jones Industrial Average:
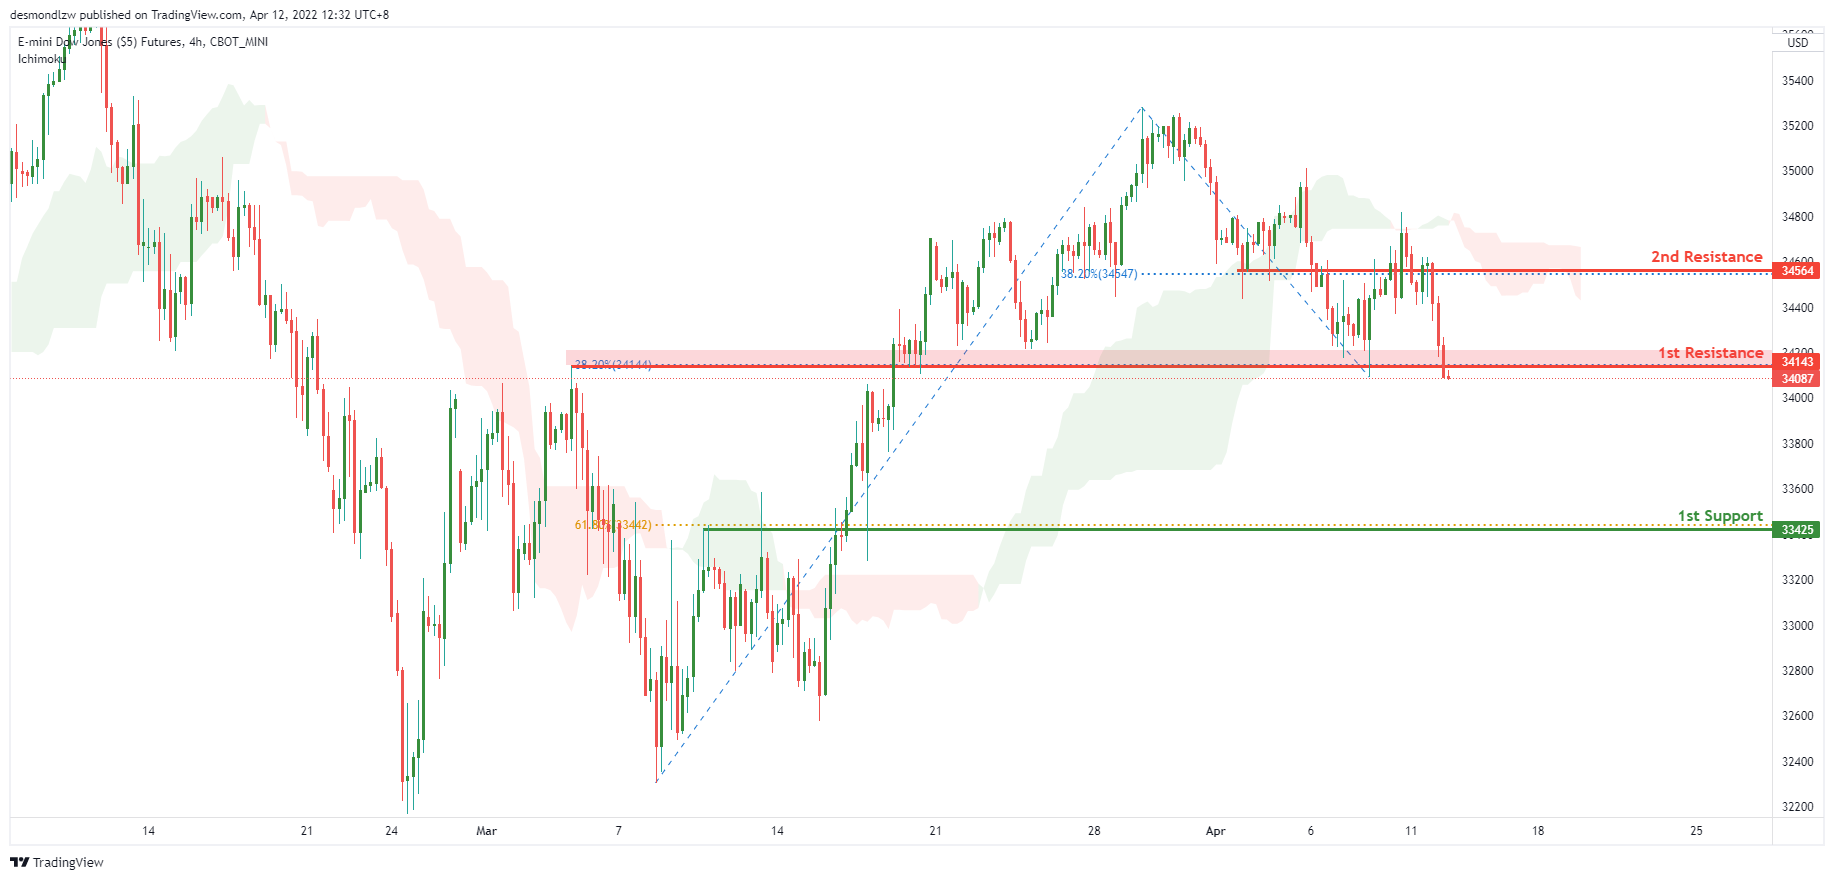
On the H4, with price trading below the ichimoku cloud, we have a bias that prices will dip to our 1st support at 33425 in line with the 61.8% Fibonacci retracement from our 1st resistance at 34143 in line with the horizontal overlap and 38.2% Fibonacci retracement. Alternatively, price may break 1st resistance structure and head for 2nd resistance at 34564 in line with 38.2% Fibonacci retracement.
Areas of consideration :
- H4 1st support at 33425
- H4 1st resistance at 34143