

Sample Category Title
USD/CAD Daily Outlook
Daily Pivots: (S1) 1.2586; (P) 1.2614; (R1) 1.2661; More...
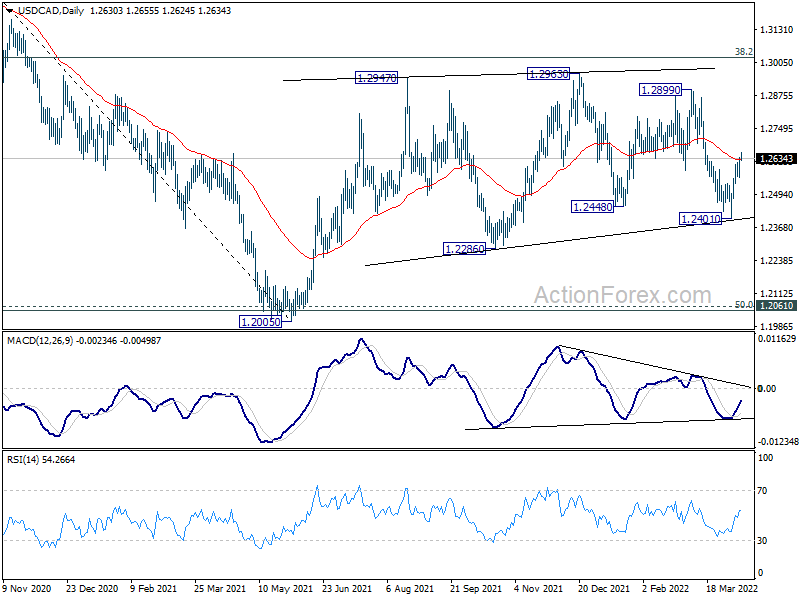
USD/CAD's rebound from 1.2401 resumed by breaking through 1.2617 temporary top. Intraday bias is back on the upside. Sustained trading above 55 day EMA (now at 1.2629) will bring further rally to upper side of recent range at 1.2963. On the downside, though, below below 1.2561 minor support will turn bias back to the downside for 1.2401 support again.
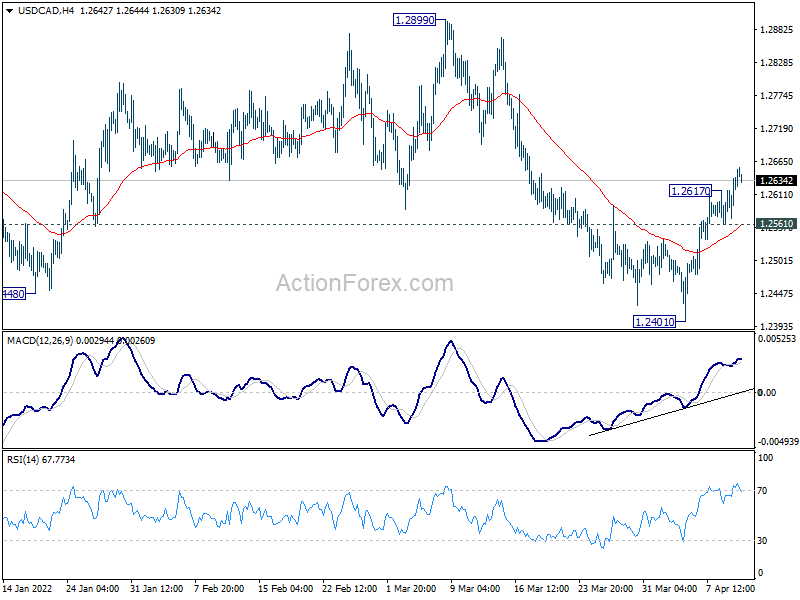
In the bigger picture, focus stays on 38.2% retracement of 1.4667 (2020 high) to 1.2005 (2021 low) at 1.3022. Sustained break there should confirm that the down trend from 1.4667 has completed after defending 1.2061 long term cluster support. Further rise would then be seen towards 61.8% retracement at 1.3650. However, rejection by 1.3022 will maintain medium term bearishness. Break of 1.2005 will resume the down trend from 1.4667 and that carries larger bearish implications too.
Dollar Turned Mixed as CPI Awaited, Yen Weakness Continues
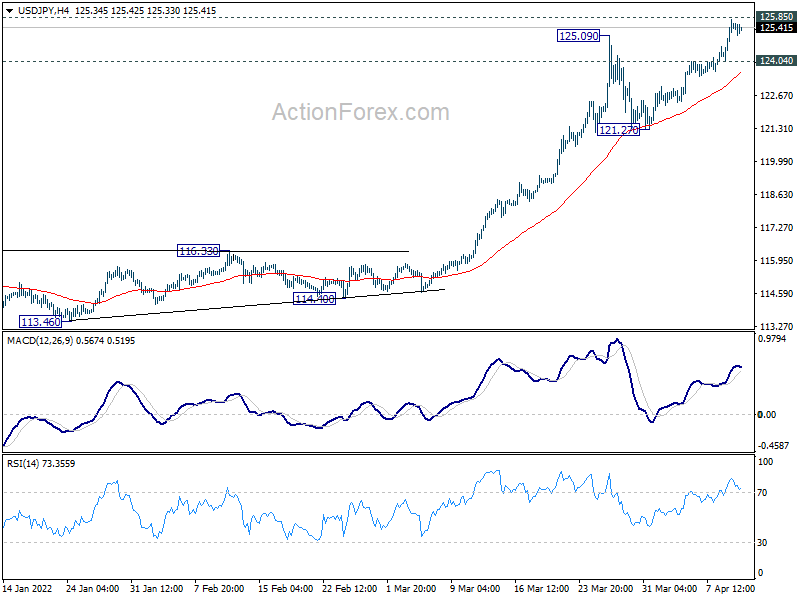
Dollar turned a bit mixed in Asian session as markets await consumer inflation data from the US today. The greenback is losing some momentum against Yen as it's pressing a long term resistance level at 125.85. Meanwhile, it ticks down against European majors, which are recovering. On the other hand, Dollar is extending rebound against Canadian, which is now the second weakest, even though a big 50bps rate hike is expected from BoC later in the week.
Technically, a main focus today is on USD/JPY's reaction to 125.85 (2015 high). Strong break there will confirm resumption of up trend from 2011 low. Such development could come in reaction to strong CPI reading and extended rally in US treasury yields. Break of 124.04 minor support will turn USD/JPY into consolidations first, before setting up another attempt on 125.85.
In Asia, at the time of writing, Nikkei is down -1.92%. Hong Kong HSI is down -0.36%. China Shanghai SSE is up 0.08%. Singapore Strait Times is down -0.77%. Japan 10-year JGB yield is up 0.004 at 0.243. Overnight DOW dropped -1.19%. S&P 500 dropped -1.69%. NASDAQ dropped -2.18%. 10-year yield rose 0.067 to 2.780.
Fed Evans: Optionality of not going too far too quickly is important
Chicago Fed President Charles Evans said yesterday that 50bps rate hike in May is "obviously worthy of consideration; perhaps it's highly likely even if you want to get to neutral by December." But he also emphasized, "the optionality of not going too far too quickly is important."
He added that but the end of the year, Fed will know a lot more about inflation. "Is it going to be that some of these pricing pressures have crested, and they start coming down? Or are they going to stay high -- or are they going to be higher?" Evans said. "And if it's because of supply concerns, real resource pressures, there's going to be a lot of gnashing-of-teeth angst over the inflation versus the concern for the economy. And I think finding the right balance is going to always be at a premium."
Japan PPI rose 7.3% yoy in Mar, index at highest level since 1982
Japan corporate goods price index rose 7.3% yoy in March, slowed from 9.7% yoy but beat expectation of 9.3% yoy. The March index, at 112.0, was the highest level since December 1982. The yen-based import price index surged 33.4% yoy, signaling that Yen's depreciation could be amplifying import inflation.
Separately, Finance Minister Shunichi Suzuki warned, "The government will closely monitor developments in the foreign exchange market, including the recent depreciation of the yen with a sense of vigilance. That includes the impact on the Japanese economy."
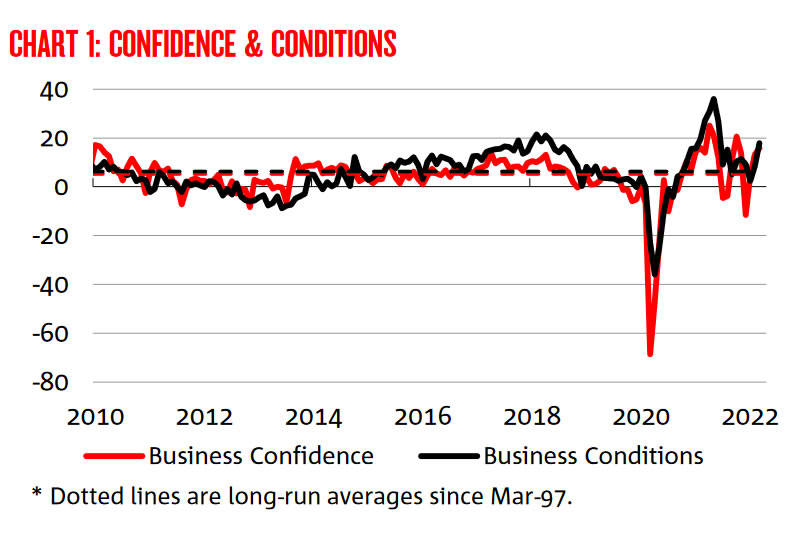
Australia NAB business confidence rose to 16, strong rebound led by consumer demand
Australia NAB business confidence rose from 13 to 16 in March. Business conditions rose from 9 to 18. Looking at some details, trading conditions rose from 11 to 24. Profitability conditions rose from 5 to 13. Employment conditions rose from 8 to 12.
"A surge in business conditions headlined a really strong March survey," said NAB Group Chief Economist Alan Oster. "Businesses reported very strong trading conditions and a sharp rise in profitability, which indicates demand is continuing to hold up as the economy rebounds from Omicron and growth gathers momentum."
"Business confidence continued to improve in March, with little evidence of any adverse impact from events in Ukraine," said Oster. "The outlook also strengthened in terms of forward orders which points to ongoing economic growth over coming months."
"Overall, the results depict a very strong rebound, led by strong consumer demand."
Looking ahead
UK employment data and Germany ZEW economic sentiment will highlight the European session. Germany will also release CPI final while France will release trade balance. Later in the day, US CPI will take center stage.
USD/CAD Daily Outlook
Daily Pivots: (S1) 1.2586; (P) 1.2614; (R1) 1.2661; More...
USD/CAD's rebound from 1.2401 resumed by breaking through 1.2617 temporary top. Intraday bias is back on the upside. Sustained trading above 55 day EMA (now at 1.2629) will bring further rally to upper side of recent range at 1.2963. On the downside, though, below below 1.2561 minor support will turn bias back to the downside for 1.2401 support again.
In the bigger picture, focus stays on 38.2% retracement of 1.4667 (2020 high) to 1.2005 (2021 low) at 1.3022. Sustained break there should confirm that the down trend from 1.4667 has completed after defending 1.2061 long term cluster support. Further rise would then be seen towards 61.8% retracement at 1.3650. However, rejection by 1.3022 will maintain medium term bearishness. Break of 1.2005 will resume the down trend from 1.4667 and that carries larger bearish implications too.
Economic Indicators Update
| GMT | Ccy | Events | Actual | Forecast | Previous | Revised |
|---|---|---|---|---|---|---|
| 22:00 | NZD | NZIER Business Confidence Q1 | -40 | -28 | ||
| 23:01 | GBP | BRC Like-For-Like Retail Sales Y/Y Mar | -0.40% | 2.60% | 2.70% | |
| 23:50 | JPY | Bank Lending Y/Y Mar | 0.50% | 0.50% | 0.40% | |
| 23:50 | JPY | PPI Y/Y Mar | 9.50% | 9.30% | 9.30% | 9.70% |
| 01:30 | AUD | NAB Business Confidence Mar | 16 | 13 | ||
| 01:30 | AUD | NAB Business Conditions Mar | 18 | 9 | ||
| 06:00 | GBP | Claimant Count Change Mar | -41.1K | -48.1K | ||
| 06:00 | GBP | ILO Unemployment Rate (3M) Feb | 3.80% | 3.90% | ||
| 06:00 | GBP | Average Earnings Including Bonus 3M/Y Feb | 5.70% | 4.80% | ||
| 06:00 | GBP | Average Earnings Excluding Bonus 3M/Y Feb | 3.70% | 3.80% | ||
| 06:00 | EUR | Germany CPI M/M Mar F | 2.50% | 2.50% | ||
| 06:00 | EUR | Germany CPI Y/Y Mar F | 7.30% | 7.30% | ||
| 06:45 | EUR | France Trade Balance (EUR) Feb | -9.3B | -8.0B | ||
| 09:00 | EUR | Germany ZEW Economic Sentiment Apr | -48 | -39.3 | ||
| 09:00 | EUR | Germany ZEW Current Situation Apr | -35 | -21.4 | ||
| 09:00 | EUR | Eurozone ZEW Economic Sentiment Apr | -46.5 | -38.7 | ||
| 10:00 | USD | NFIB Business Optimism Index Mar | 95 | 95.7 | ||
| 12:30 | USD | CPI M/M Mar | 1.10% | 0.80% | ||
| 12:30 | USD | CPI Y/Y Mar | 8.30% | 7.90% | ||
| 12:30 | USD | CPI Core M/M Mar | 0.50% | 0.50% | ||
| 12:30 | USD | CPI Core Y/Y Mar | 6.60% | 6.40% |
Australia NAB business confidence rose to 16, strong rebound led by consumer demand
Australia NAB business confidence rose from 13 to 16 in March. Business conditions rose from 9 to 18. Looking at some details, trading conditions rose from 11 to 24. Profitability conditions rose from 5 to 13. Employment conditions rose from 8 to 12.
"A surge in business conditions headlined a really strong March survey," said NAB Group Chief Economist Alan Oster. "Businesses reported very strong trading conditions and a sharp rise in profitability, which indicates demand is continuing to hold up as the economy rebounds from Omicron and growth gathers momentum."
"Business confidence continued to improve in March, with little evidence of any adverse impact from events in Ukraine," said Oster. "The outlook also strengthened in terms of forward orders which points to ongoing economic growth over coming months."
"Overall, the results depict a very strong rebound, led by strong consumer demand."
Japan PPI rose 7.3% yoy in Mar, index at highest level since 1982
Japan corporate goods price index rose 7.3% yoy in March, slowed from 9.7% yoy but beat expectation of 9.3% yoy. The March index, at 112.0, was the highest level since December 1982. The yen-based import price index surged 33.4% yoy, signaling that Yen's depreciation could be amplifying import inflation.
Separately, Finance Minister Shunichi Suzuki warned, "The government will closely monitor developments in the foreign exchange market, including the recent depreciation of the yen with a sense of vigilance. That includes the impact on the Japanese economy."
Fed Evans: Optionality of not going too far too quickly is important
Chicago Fed President Charles Evans said yesterday that 50bps rate hike in May is "obviously worthy of consideration; perhaps it's highly likely even if you want to get to neutral by December." But he also emphasized, "the optionality of not going too far too quickly is important."
He added that but the end of the year, Fed will know a lot more about inflation. "Is it going to be that some of these pricing pressures have crested, and they start coming down? Or are they going to stay high -- or are they going to be higher?" Evans said. "And if it's because of supply concerns, real resource pressures, there's going to be a lot of gnashing-of-teeth angst over the inflation versus the concern for the economy. And I think finding the right balance is going to always be at a premium."
GBP/USD Could Nosedive, UK Employment Report Next
Key Highlights
- GBP/USD settled below the 1.3120 pivot level.
- A key bearish trend line is forming with resistance near 1.3075 on the 4-hours chart.
- EUR/USD is facing an uphill task near 1.0950.
- The US CPI could increase 8.5% in March 2022 (YoY), up from +7.9%.
GBP/USD Technical Analysis
The British Pound started a fresh decline from well above the 1.3200 level against the US Dollar. GBP/USD declined below the 1.3120 support to move into a bearish zone.
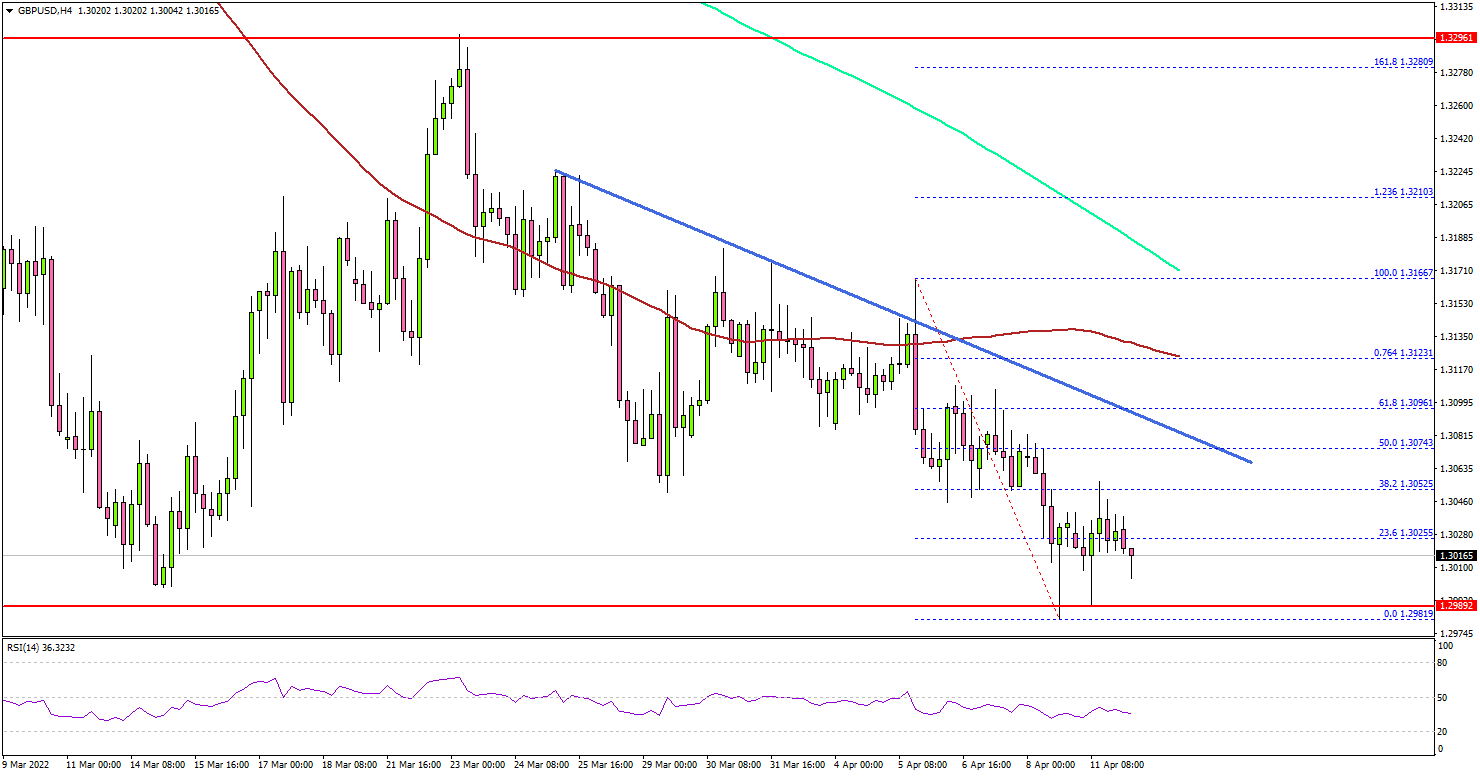
Looking at the 4-hours chart, the pair even traded below the 1.3050 level, the 200 simple moving average (green, 4-hours), and the 100 simple moving average (red, 4-hours).
The pair traded as low as 1.2981 and is currently consolidating losses. An immediate resistance on the upside is near the 1.3050 level.
The first major resistance is near the 1.3075 level. There is also a key bearish trend line forming with resistance near 1.3075 on the same chart. The next major resistance is near the 1.3120 level and the 100 simple moving average (red, 4-hours).
Any more gains might send the pair towards the 1.3200 level in the coming sessions. On the downside, an immediate support is near the 1.2980 level. The next major support is near the 1.2955 level. A downside break below the 1.2955 support level might send the pair towards the 1.2840 level.
Looking at EUR/USD, the pair is struggling below the 1.0950 resistance zone. If there is no recovery wave, the pair could extend decline below 1.0850.
Economic Releases
- UK Claimant Count Change for March 2022 – Forecast -30.0K, versus -48.1K previous.
- UK ILO Unemployment Rate Feb 2022 (3M) – Forecast 3.9%, versus 3.9% previous.
- German Consumer Price Index for March 2022 (YoY) – Forecast +7.3%, versus +7.3% previous.
- German Consumer Price Index for March 2022 (MoM) – Forecast +2.5%, versus +2.5% previous.
- US Consumer Price Index for March 2022 (MoM) – Forecast 1.2%, versus +0.8% previous.
- US Consumer Price Index for March 2022 (YoY) – Forecast +8.5%, versus +7.9% previous.
- US CPI for Ex Food & Energy for March 2022 (YoY) – Forecast +6.6%, versus +6.4% previous.
Platinum Elliott Wave Outlook
Precious metals and other commodities continue their bullish run as a result of inflationary pressure and war in Ukraine. In this article, we will take a look at Platinum. Platinum is considered as a precious metal. However, unlike gold, Platinum has industrial application. 75% of the worlds’ supply of gold is used in coins, bars and jewelry. Meanwhile, 65% of the world’s supply of Platinum is used for industrial and automotive applications. Only four countries have major platinum mining activities. South Africa has the most platinum deposits and accounts for 80% of global reserves. Below is a technical outlook of the metal.
Platinum Monthly Elliott Wave Chart
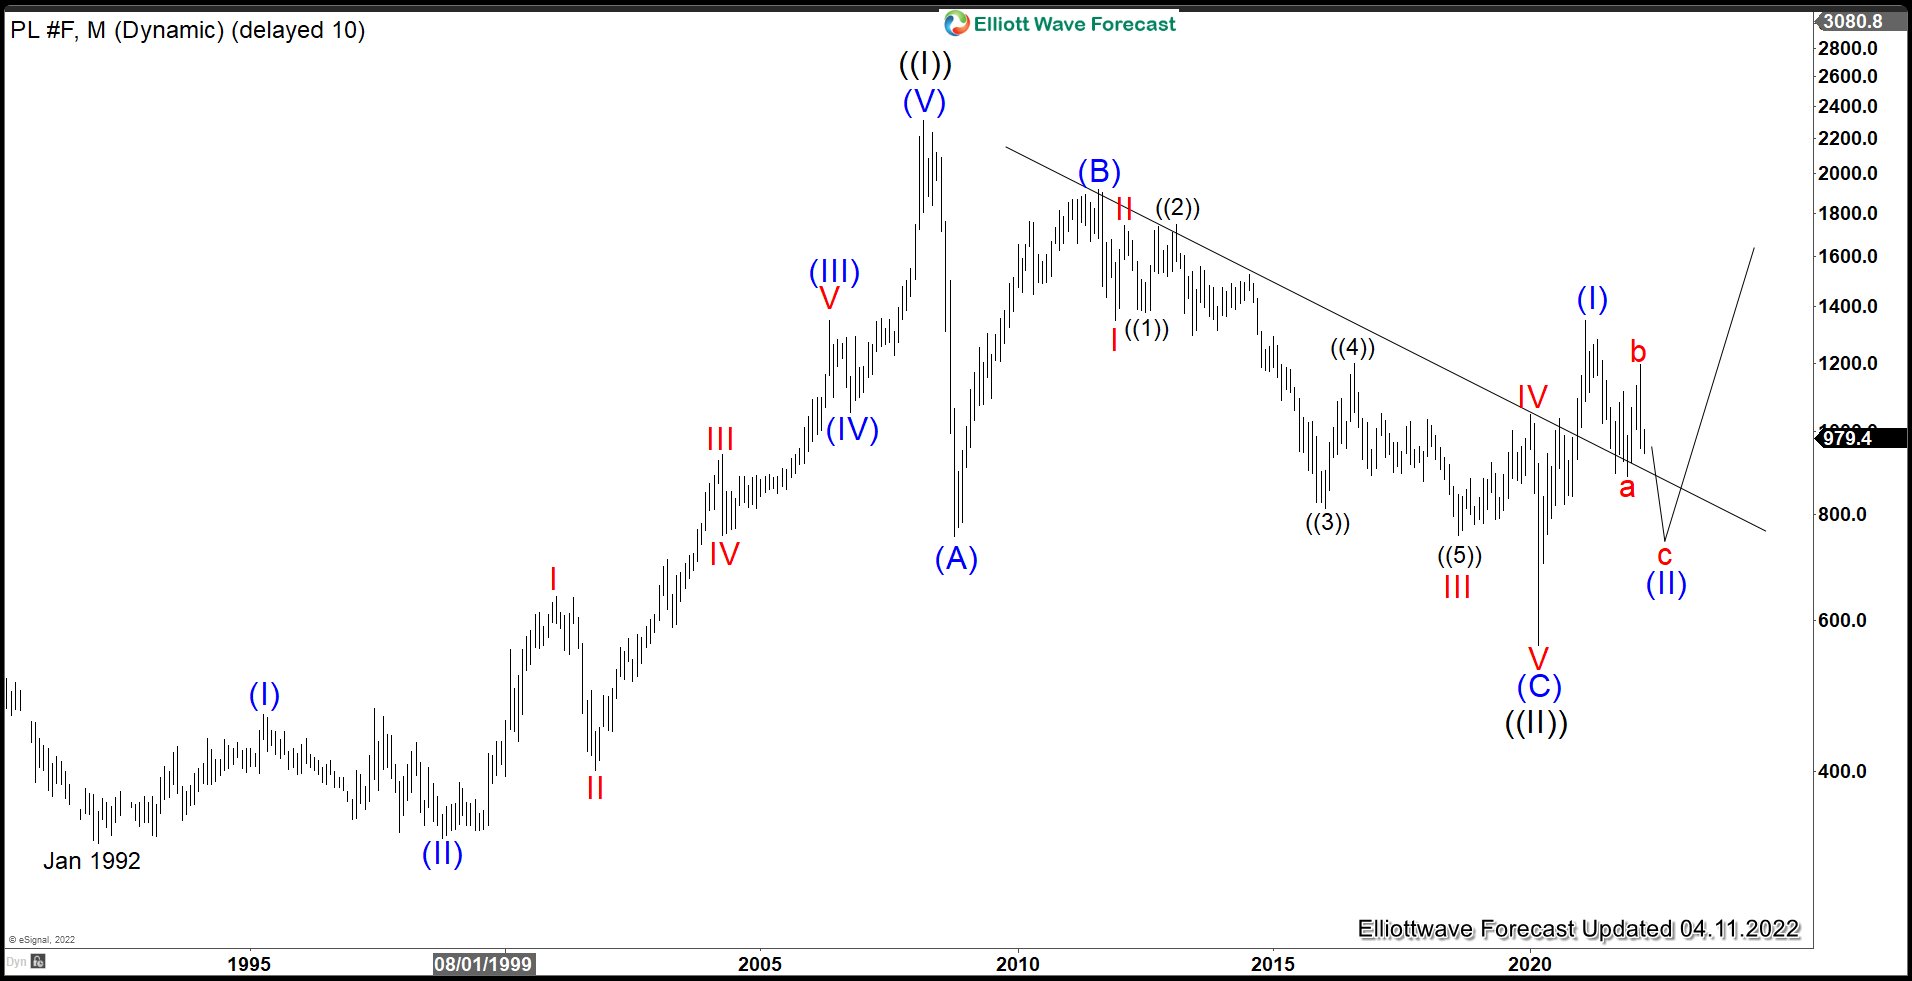
Monthly Elliott Wave outlook above suggests the rally from January 1992 ($329) ended Grand Super Cycle wave ((I)) at $2308. Up from January 1992 low, wave (I) ended at $466, and pullback in wave (II) ended at $334. The metal then resumes higher in wave (III) towards $1347 and pullback in wave (IV) ended at $1053. Final leg higher wave (V) of ((I)) ended at $2308 on March 2008. The metal then corrected for 11 years in wave ((II)) which ended on March 2020 low at $562. It has turned higher again in wave ((III)). Up from wave ((II)) low, wave (1) ended at $1348. Wave (II) is in progress as a zigzag to correct cycle from March 2020 low before the metal resumes higher again.
Platinum Daily Elliott Wave Chart
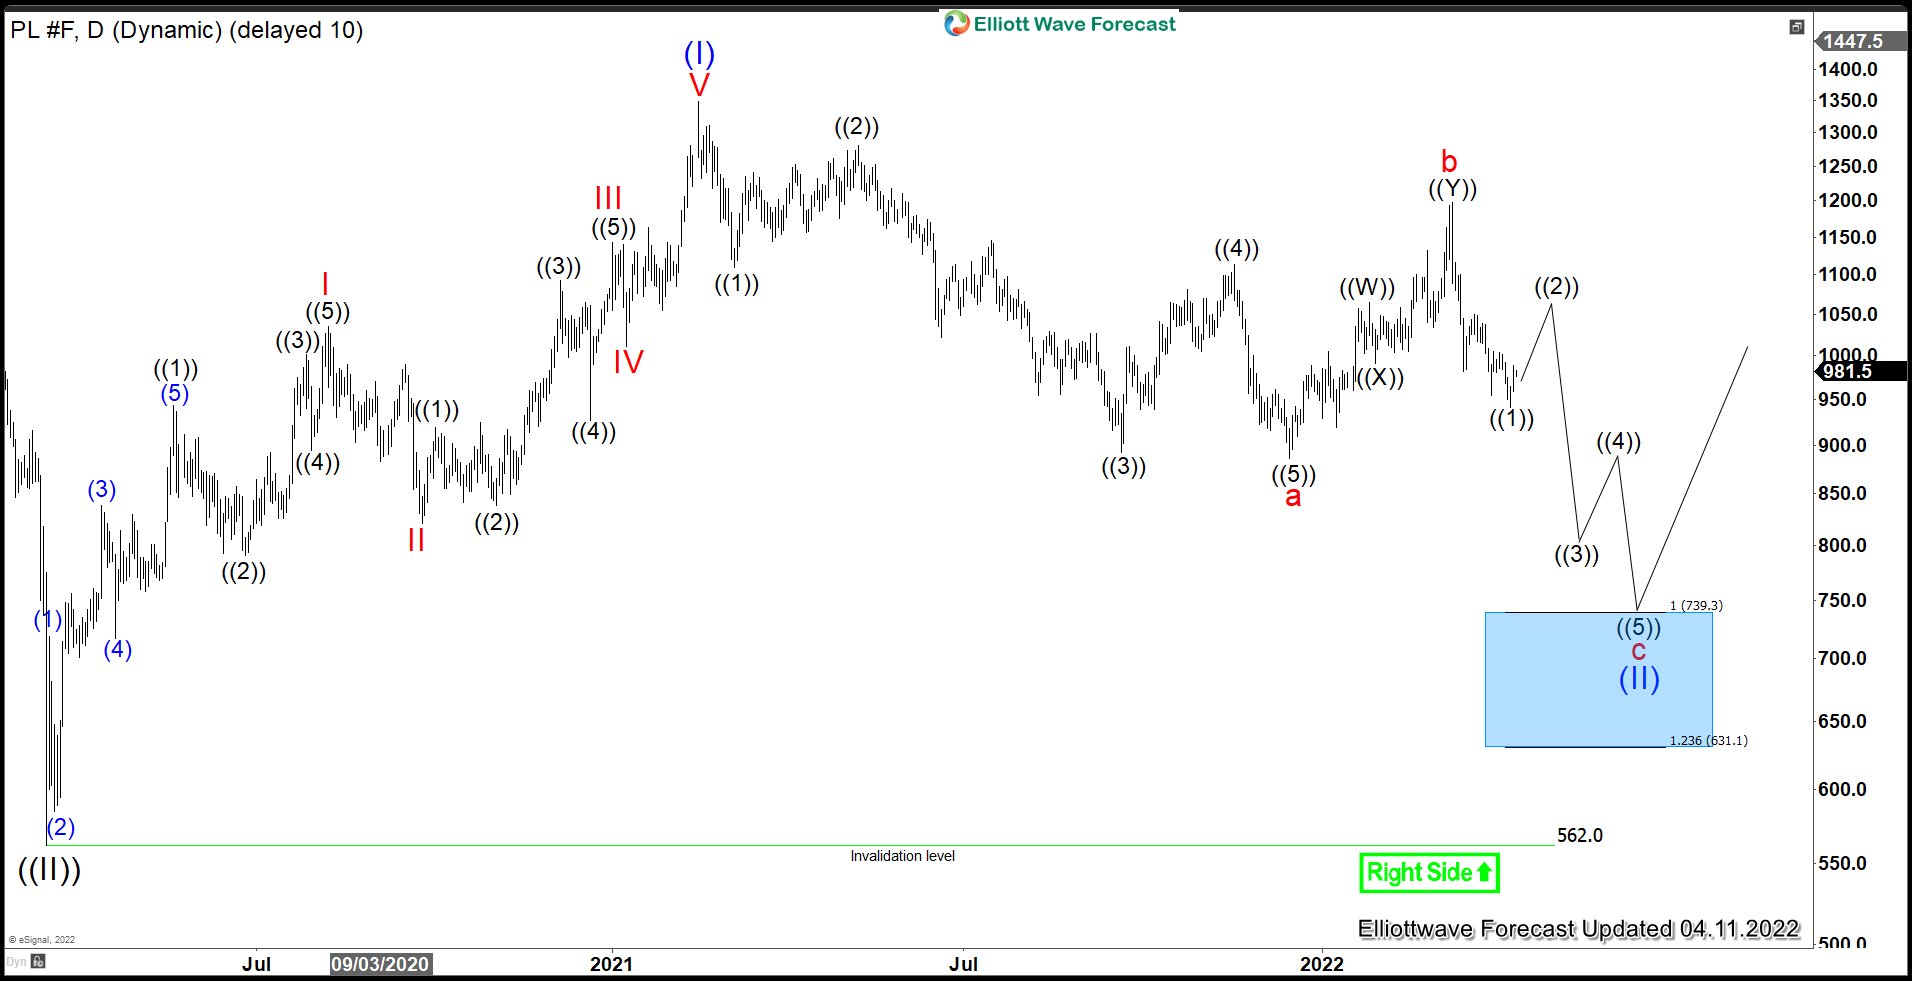
The daily Elliott Wave chart above shows more details of the monthly chart. Per the count above, we can’t rule out another leg lower in wave c to end wave (II). This will be a correction to the cycle from March 2020 low. the potential support will be at 100% – 123.6% Fibonacci extension of wave a which comes at $631 -$739 as denoted with the blue box. This area, if reached, should see buyers and the metal can then resume to new high.
Platinum Daily Alternate Elliott Wave Chart
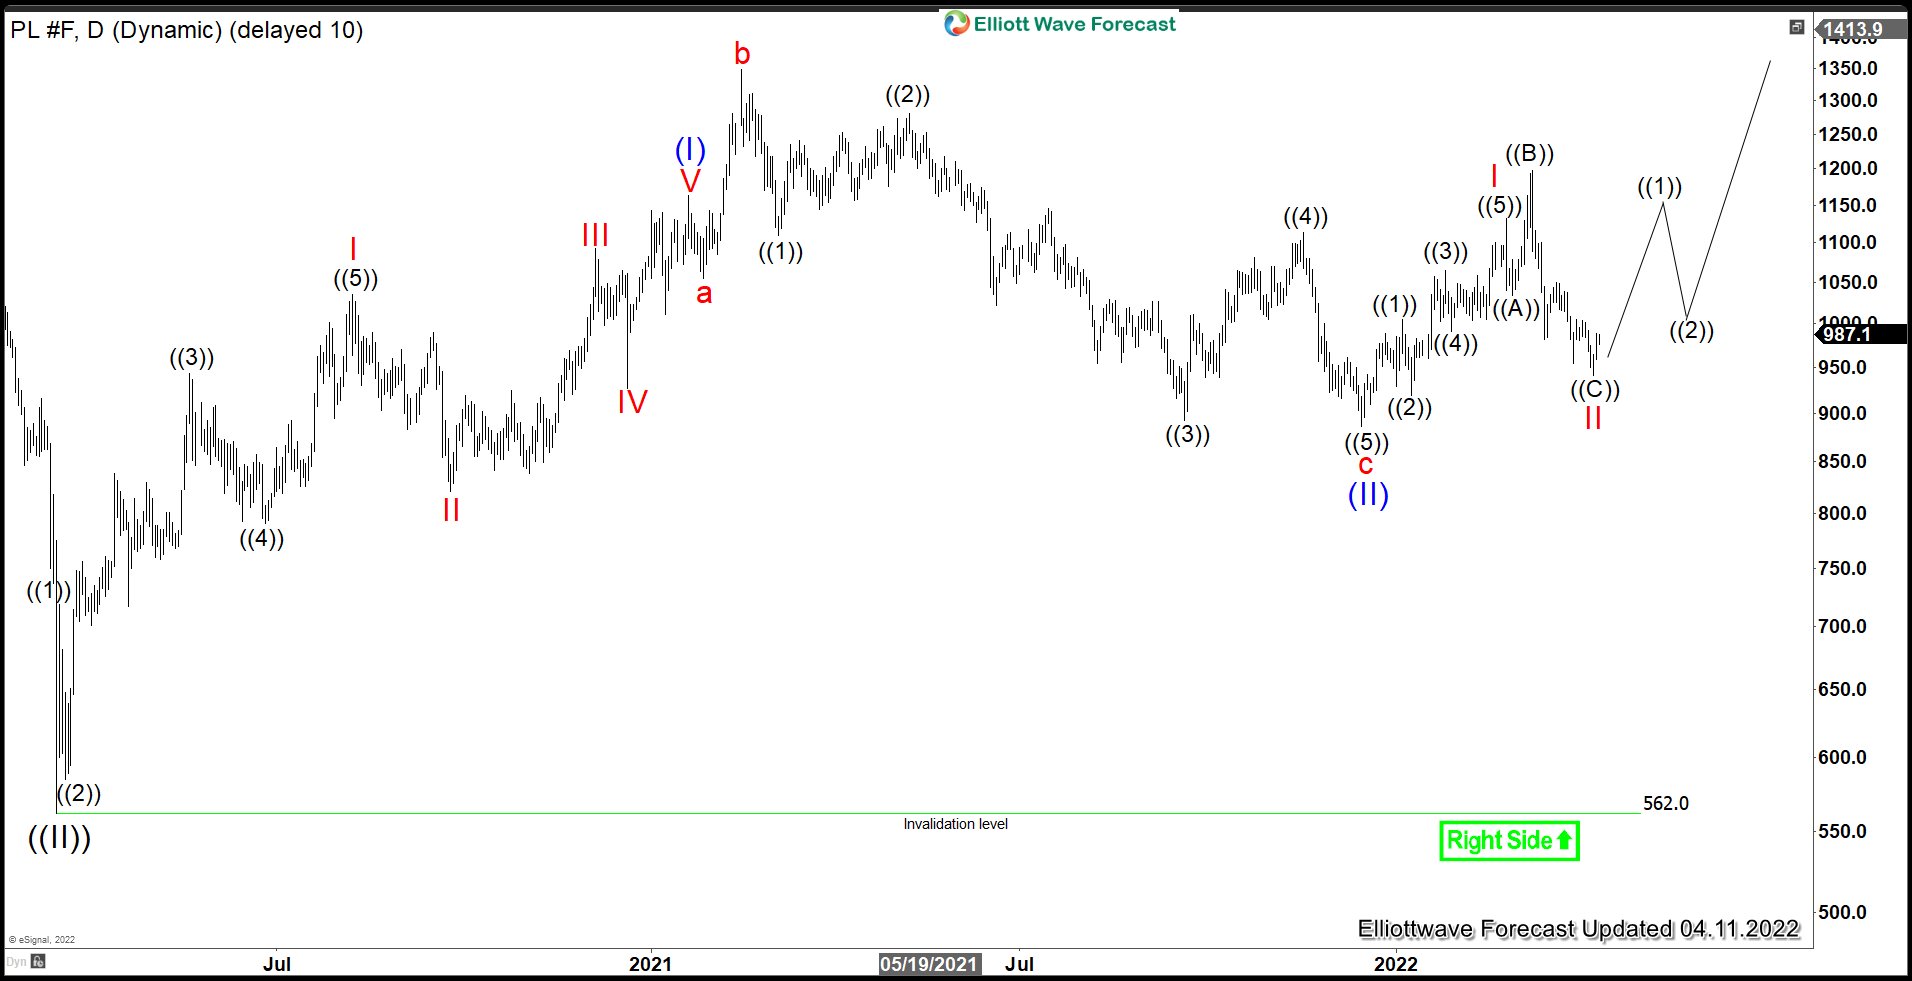
The daily chart above shows an alternate chart if Platinum does not make a new low below December 15, 2021 at $886. In the alternate scenario above, we can count wave (II) completed at $886 as an expanded flat. In this scenario, the metal should continue to see further upside without breaking below $886. Either way, March 2020 low is a major low in the metal and it should see further upside in coming years.
Elliott Wave View: S&P 500 (SPX) Turning Lower
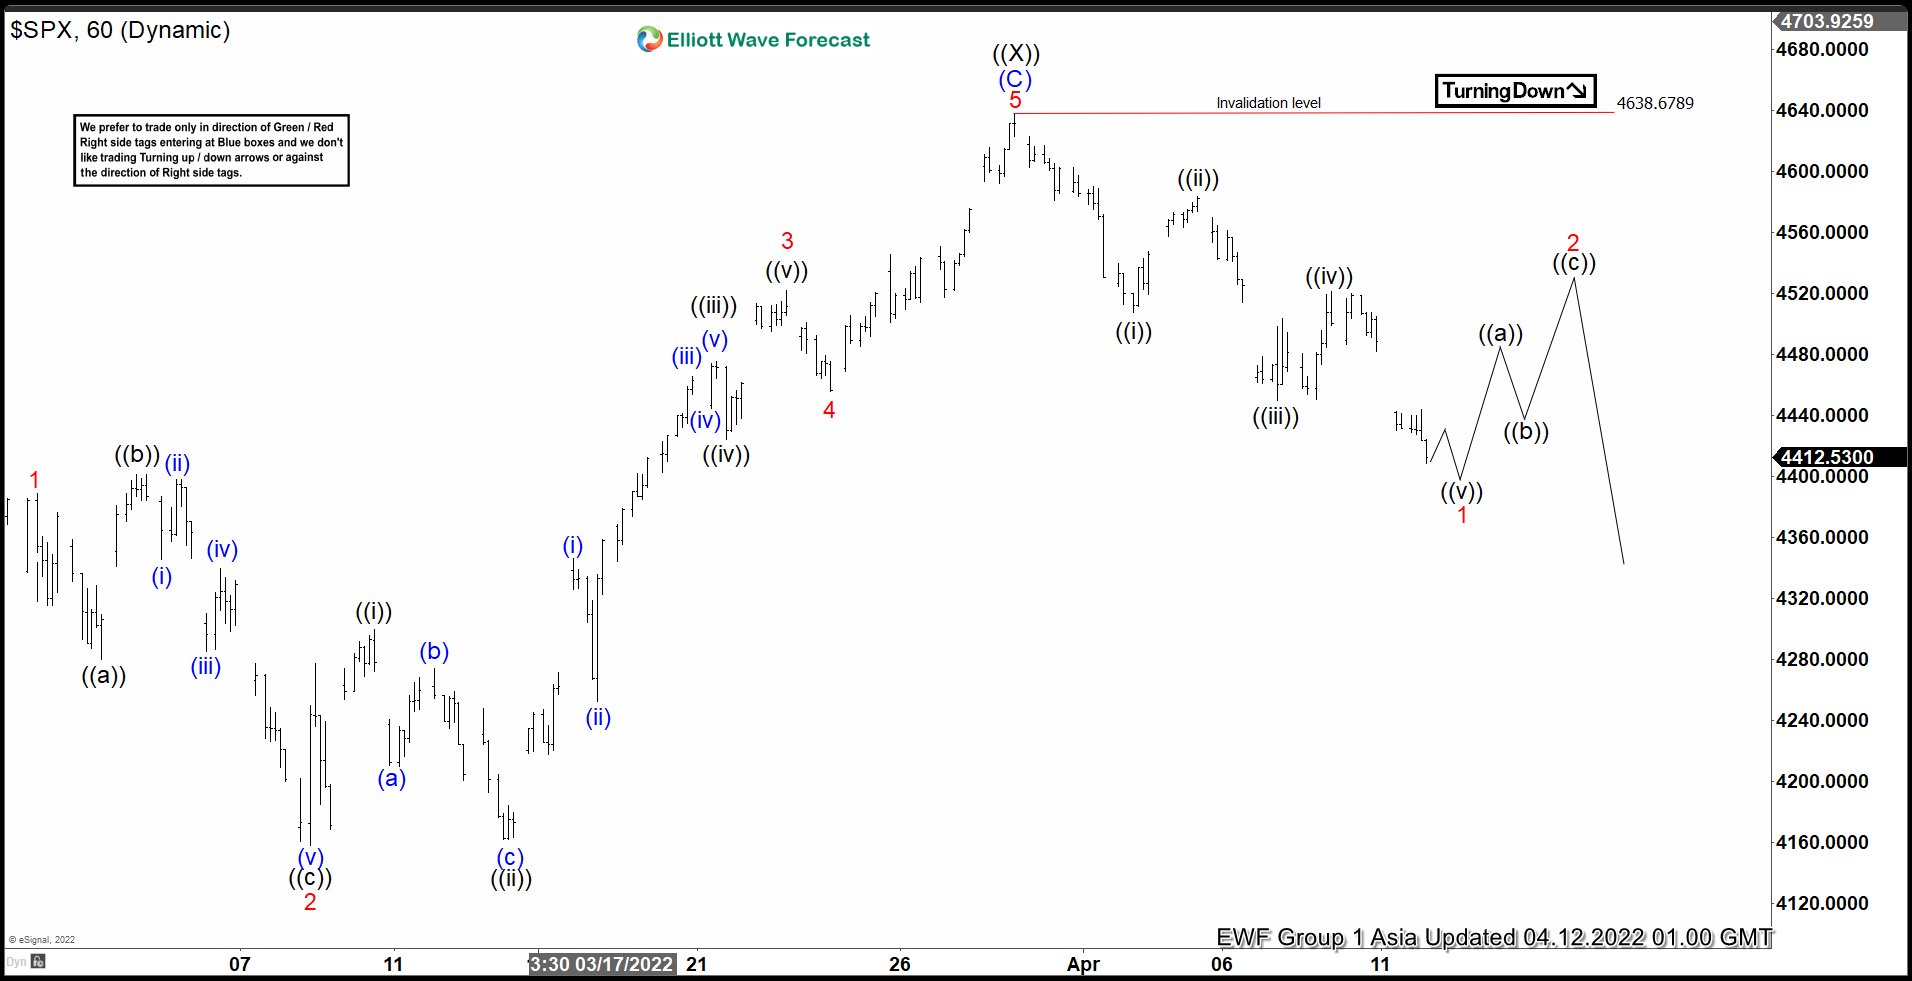
Short term Elliott Wave view in S&P 500 (SPX) suggests that the decline from January 4, 2022 is unfolding as a double three Elliott Wave structure. Down from January 4 peak, wave ((W)) ended at 4222.62 and wave ((X)) ended at 4638.67. Internal of wave ((X)) unfolded as an expanded Flat structure. Up from wave ((W)), wave (A) ended at 4595.3, wave (B) ended at 4153, and wave (C) higher ended at 4637.3. This completed wave ((X)) in higher degree.
The Index has since turned lower in wave ((Y)). Down from wave ((X)), the decline shows a 5 swing in the form of a diagonal. Wave ((i)) ended at 4507.57 and rally in wave ((ii)) ended at 4583.5. Index then resumes lower in wave ((iii)) to 4450.04, and rally in wave ((iv)) ended at 4521.16. Expect wave ((v)) to end soon which should complete wave 1. Afterwards, Index should rally in wave 2 to correct cycle from March 30 peak before it resumes lower again. Near term, as far as pivot at 4638.67 high stays intact, expect rally to fail in the sequence of 3, 7, or 11 swing for further downside.
$SPX 60 Minutes Elliott Wave Chart
USD/JPY: BoJ Intervention vs Godzilla US Yields
USD/JPY soared to new heights on Monday as the Bank of Japan pledged overnight to keep interest lows against the backdrop of rising US bond yields. The latest swing higher put USD/JPY within a whisker of breaking through the June 2015 high of 125.85. Eisuke Sakakibara, a former top currency diplomat, identified the 130 as a potential level where the Bank of Japan may intervene to support the yen in a recent Reuters article.Doing so, however, would require the Bank of Japan to use some of its c. $1.38 trillion of currency reserves and consent from the rest of the G7 counterparts, most notably the US.
Even if the Bank of Japan were to intervene, there is no guarantee of success. Traders are more apt to test the central bank’s resolve in light of its commitment to keep monetary policy ultra accommodative. Meanwhile, any verbal rather than direct intervention risks keeping USD/JPY down only temporarily. The last time the Bank of Japan directly intervened to prop up the yen was back in 1998 during the Asian financial crisis. Japan’s export driven economy has historically left the Bank of Japan to take a more hands off approach in the face of yen weakness.
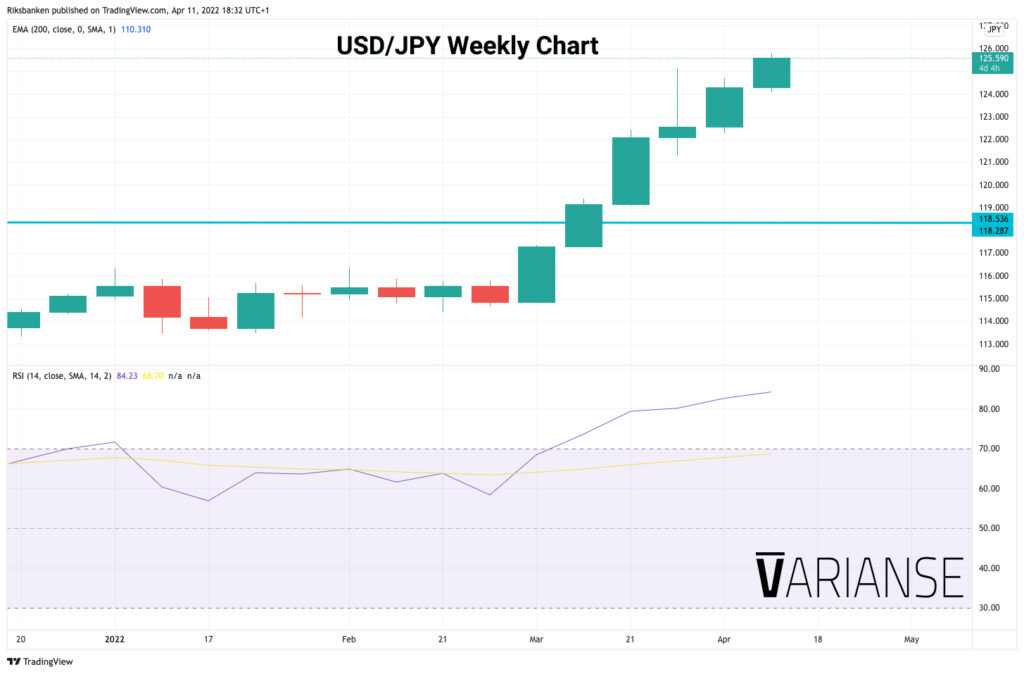
Nevertheless, the rise of the USD/JPY over recent weeks has been relentless. Back in late March, we were quick to highlight that the further above USD/JPY moved from the December 2016 swing high of 118.667 the bigger risk of a structural shift in the currency pair’s valuation. The market has moved far beyond that level now. That said, we’ve yet to see even a corrective move on the weekly timeframe as USD/JPY has soared higher, whilst we await confirmation of a new higher low on the daily chart. Traders should ponder those facts, and the risk of central bank intervention, and adjust any long position sizing accordingly.
Equally, traders with the guts to contemplate short positions should take consideration of the correlation between US yields and USD/JPY. The Bank of Japan’s commitment to ultra-accommodative policy really makes the yen’s performance more about what happens to US yields than what happens to those in Japan. Safer to look for confirmation that US yields may have topped out rather than solely relying on intervention from the Bank of Japan. The Bank of Japan truly faces a Godzilla challenge in terms retracing the yen’s losses in the face of ever higher US yields.
Eco Data 4/12/22
[php_everywhere instance="1"]