Sample Category Title
Fed George: We might have to go above neutral to bring inflation down
Kansas City Fed President Esther George told Bloomberg that "50 basis points is going to be an option that we will have to consider, along with other things" at the May FOMC meeting.
"We have to be very deliberate and intentional as we remove this accommodation. I am very focused on thinking about how the balance sheet moves in conjunction with policy-rate increases," she added.
"I think if you just look at where we are today, you might say we will have to go above neutral to bring inflation down," George said. "But there is a long time between now and the end of the year to see how the economy unfolds."
Technical Outlook and Review
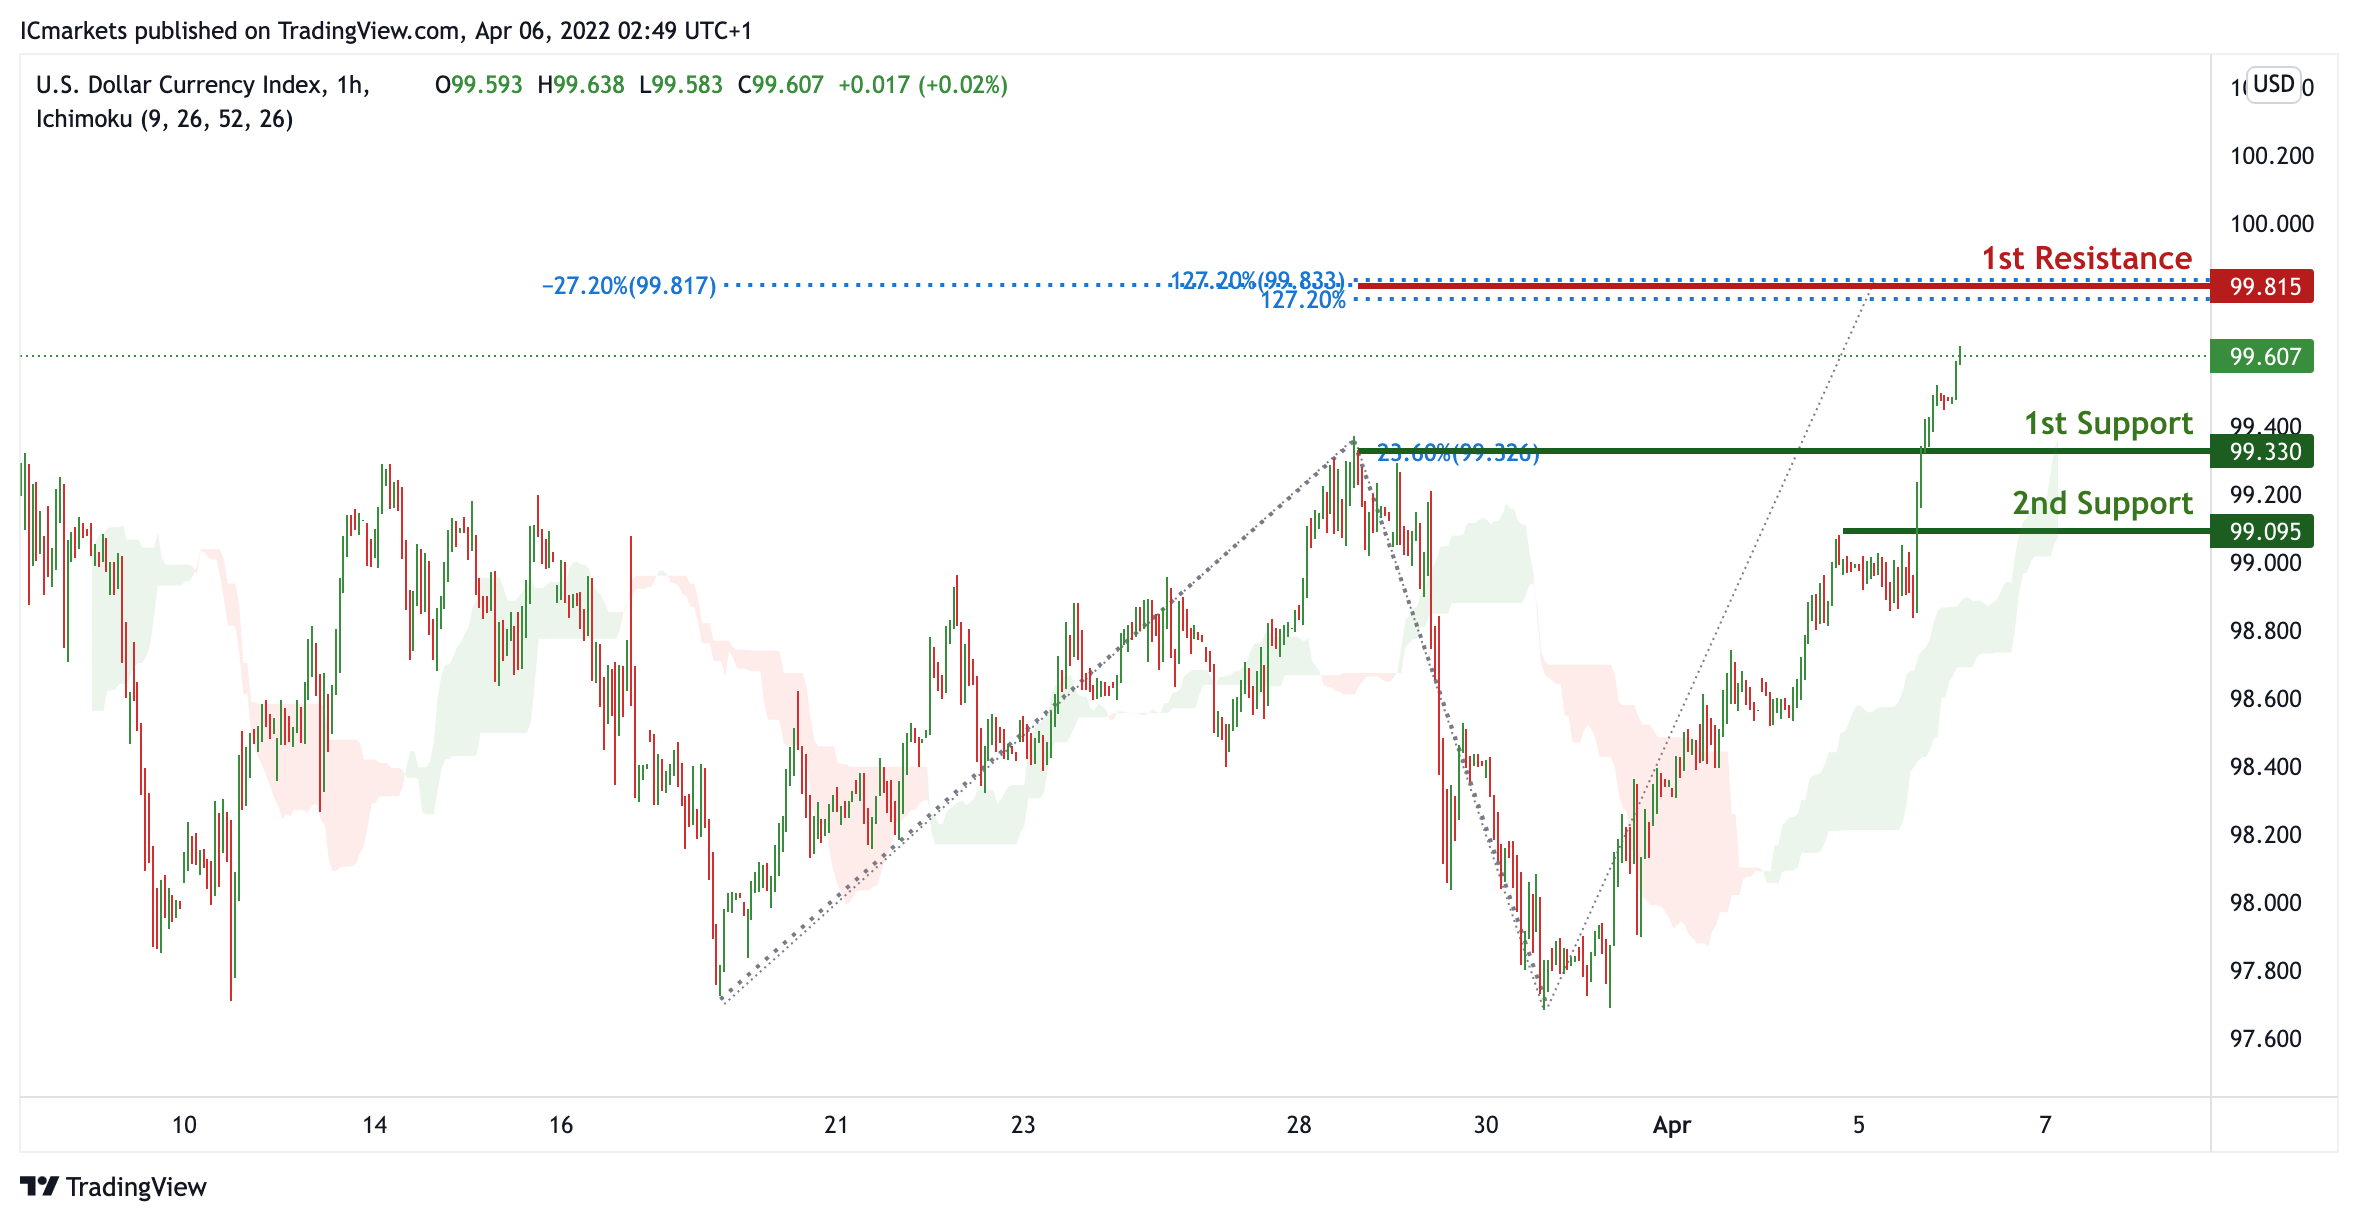
DXY:
On the H1 timeframe, prices are on bullish momentum. We see the potential for further bullish continuation from our 1st support at 99.33 in line with 23.6% Fibonacci Retracement towards our 1st resistance at 99.815 which is an area of Fibonacci confluences. Prices are trading above our ichimoku clouds, further supporting our bullish bias.
Areas of consideration:
- H4 time frame, 1st resistance at 99.815
- H4 time frame, 1st support at 99.33
XAU/USD (GOLD):
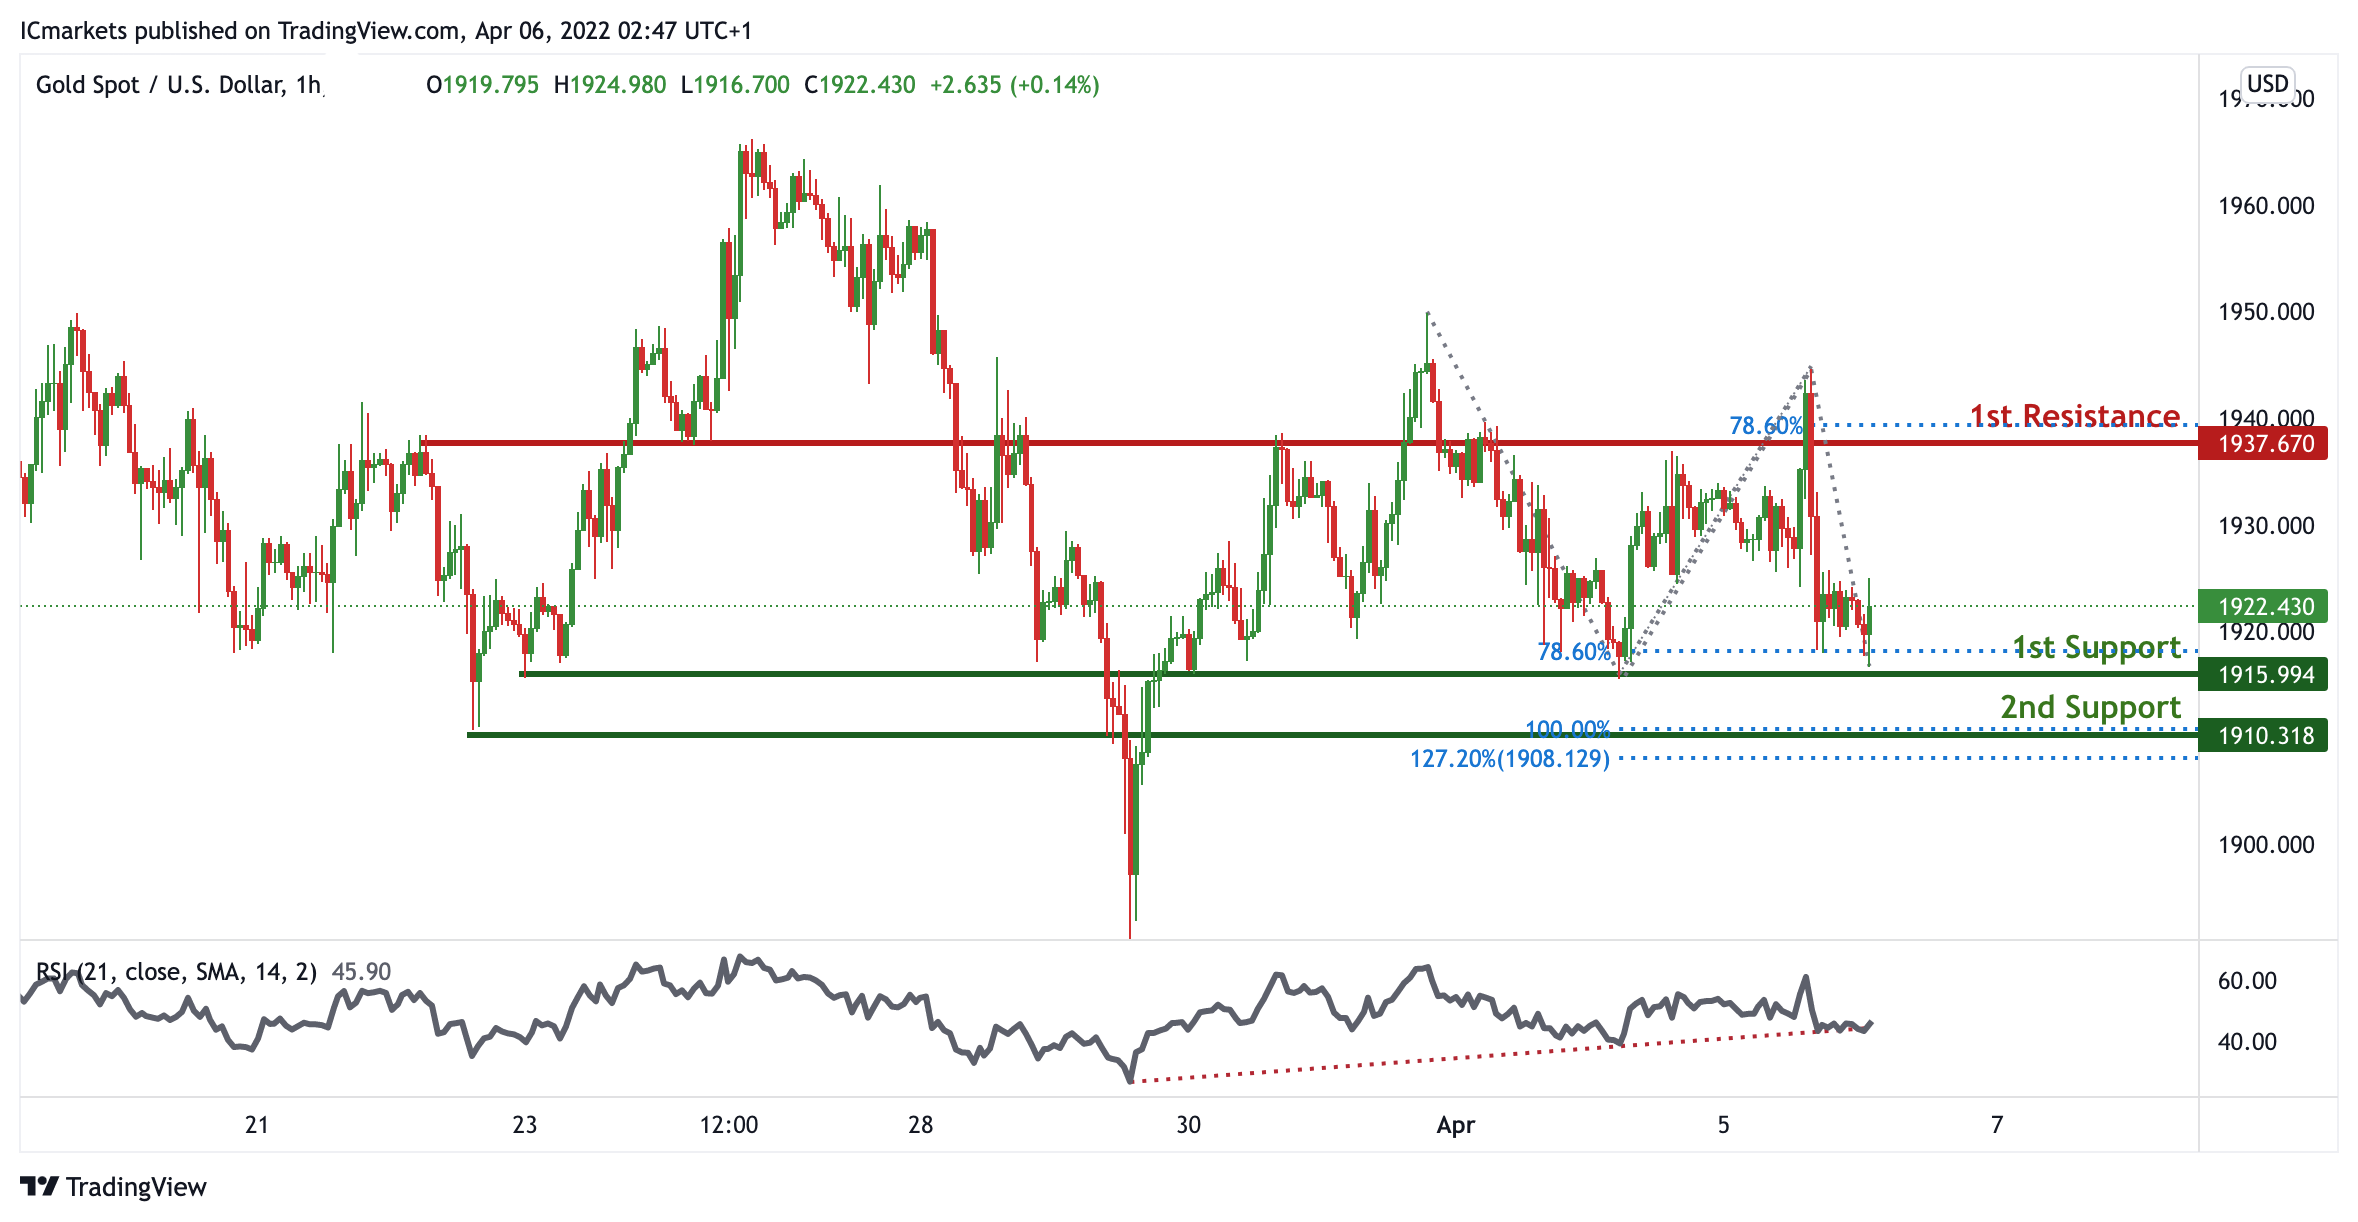
On the H1, prices are consolidating sideways. We see the potential for a bounce from our 1st support at 1915.994 which is in line with 78.6% Fibonacci projection towards our 1st resistance at 1937.627 in line which is a graphical overlap and in line with 78.6% Fibonacci Projection. RSI is on bullish momentum, further supporting our bullish bias.
Areas of consideration:
- 4h 1st support at 1915.994
- 4h 1st resistance at 1937.627
GBP/USD:
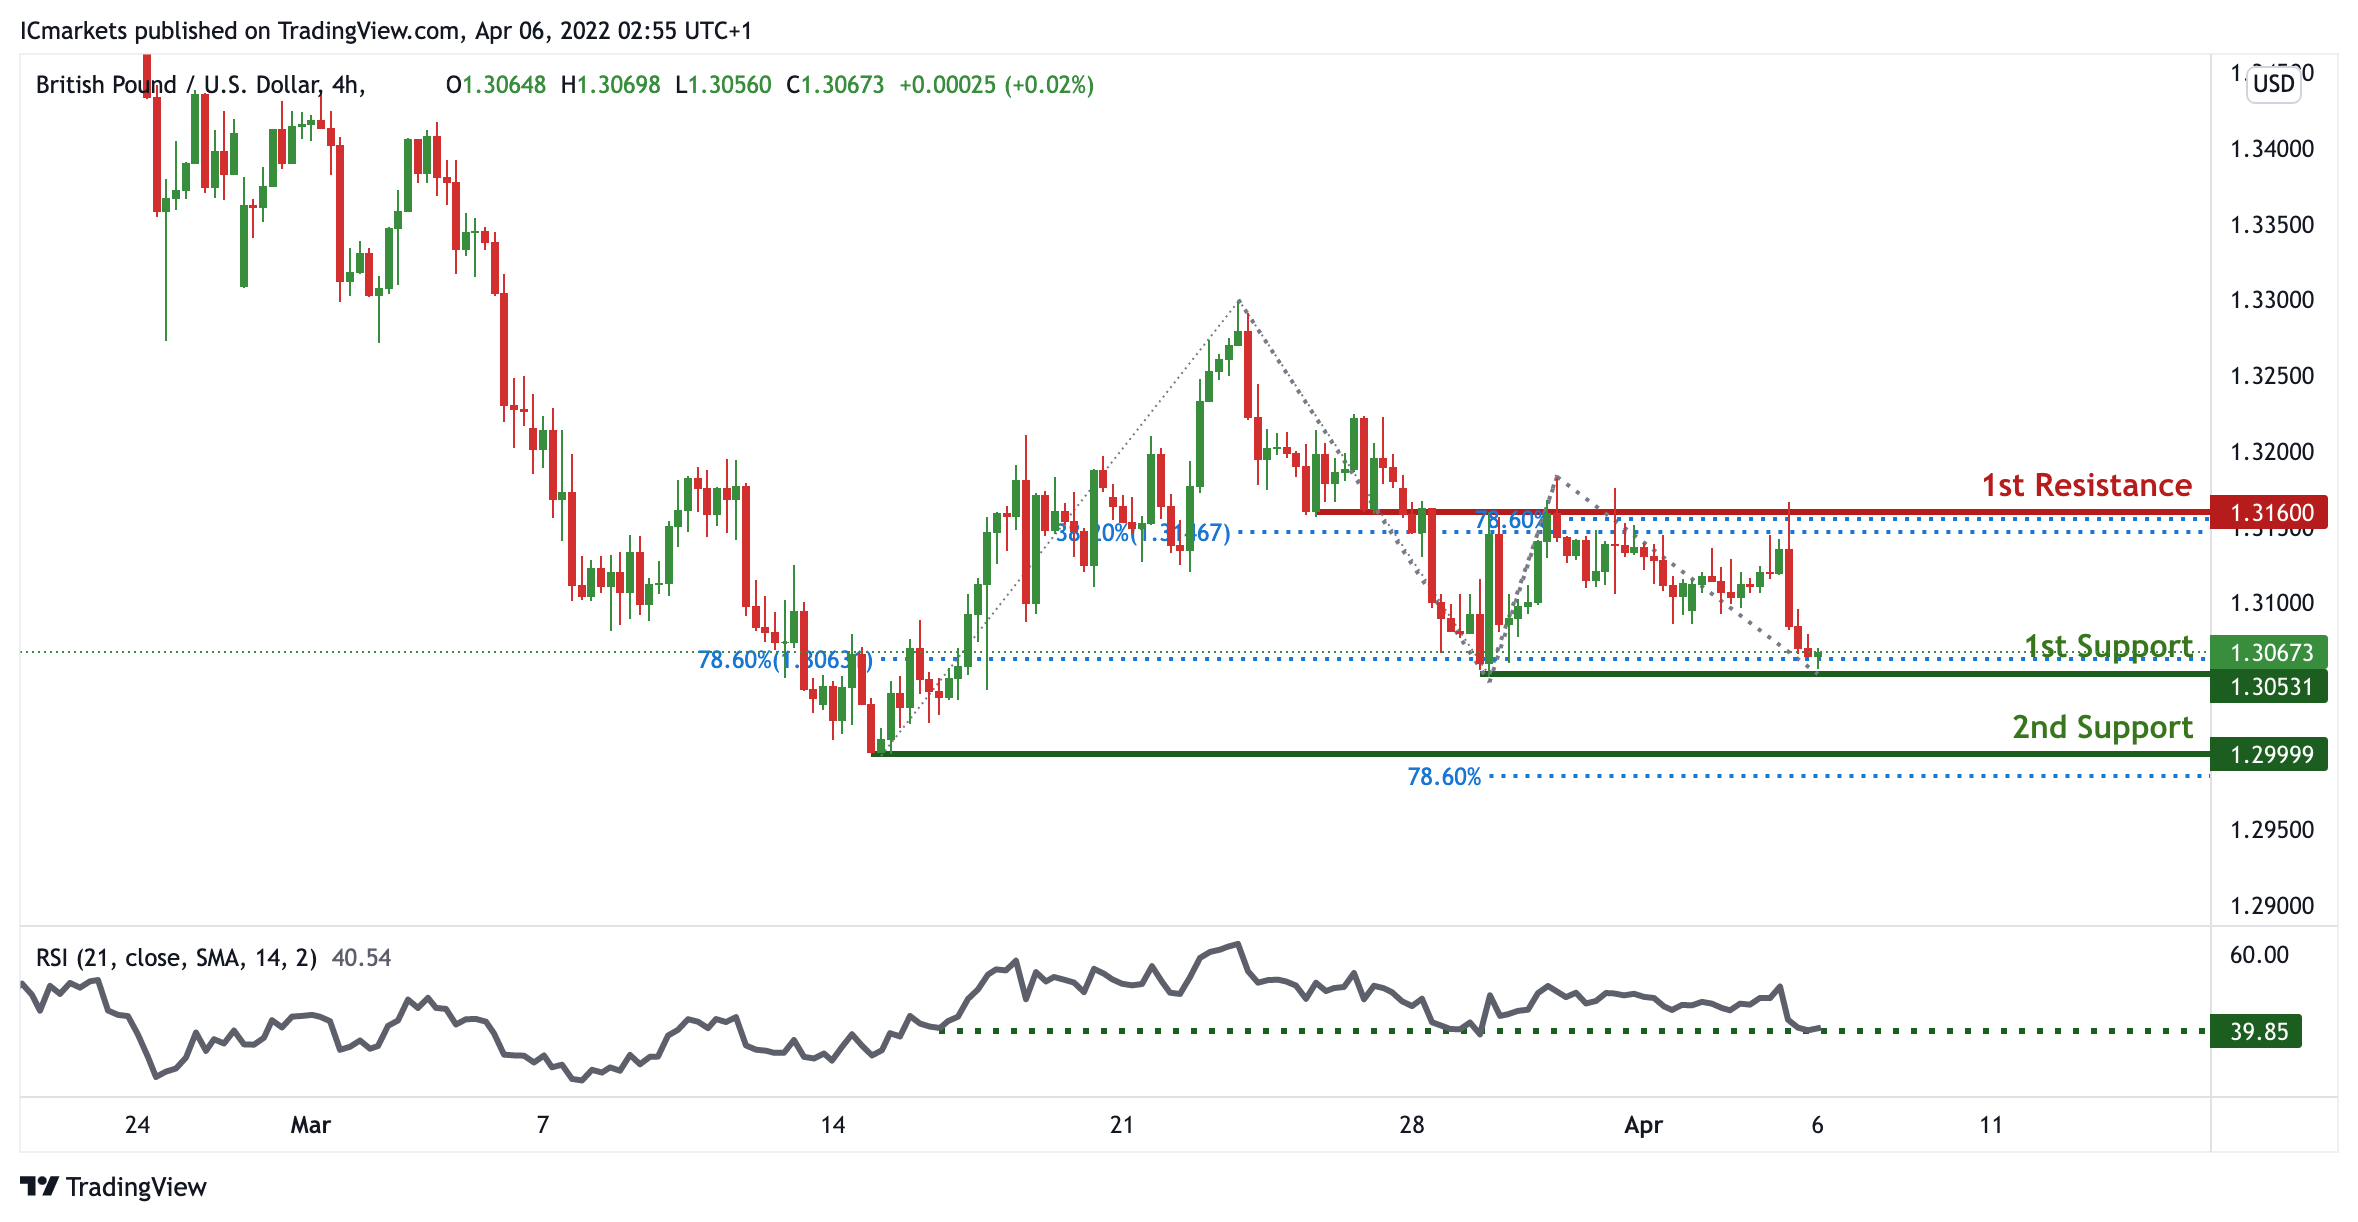
On the H4, prices are approaching a pivot. We see the potential for a bounce from our 1st support at 1.30531 in line with 78.6% Fibonacci projection towards our 1st resistance at 1.316 which is an area of Fibonacci confluences. Alternatively, our 1st support will find prices dropping further towards our 2nd support at 1.29999 in line with 78.6% FIbonacci projection. Our bullish bias is further supported by RSI being at levels where bounces previously occurred.
Areas of consideration:
- H4 1st resistance at 1.316
- H4 1st support at 1.30531
USD/CHF:
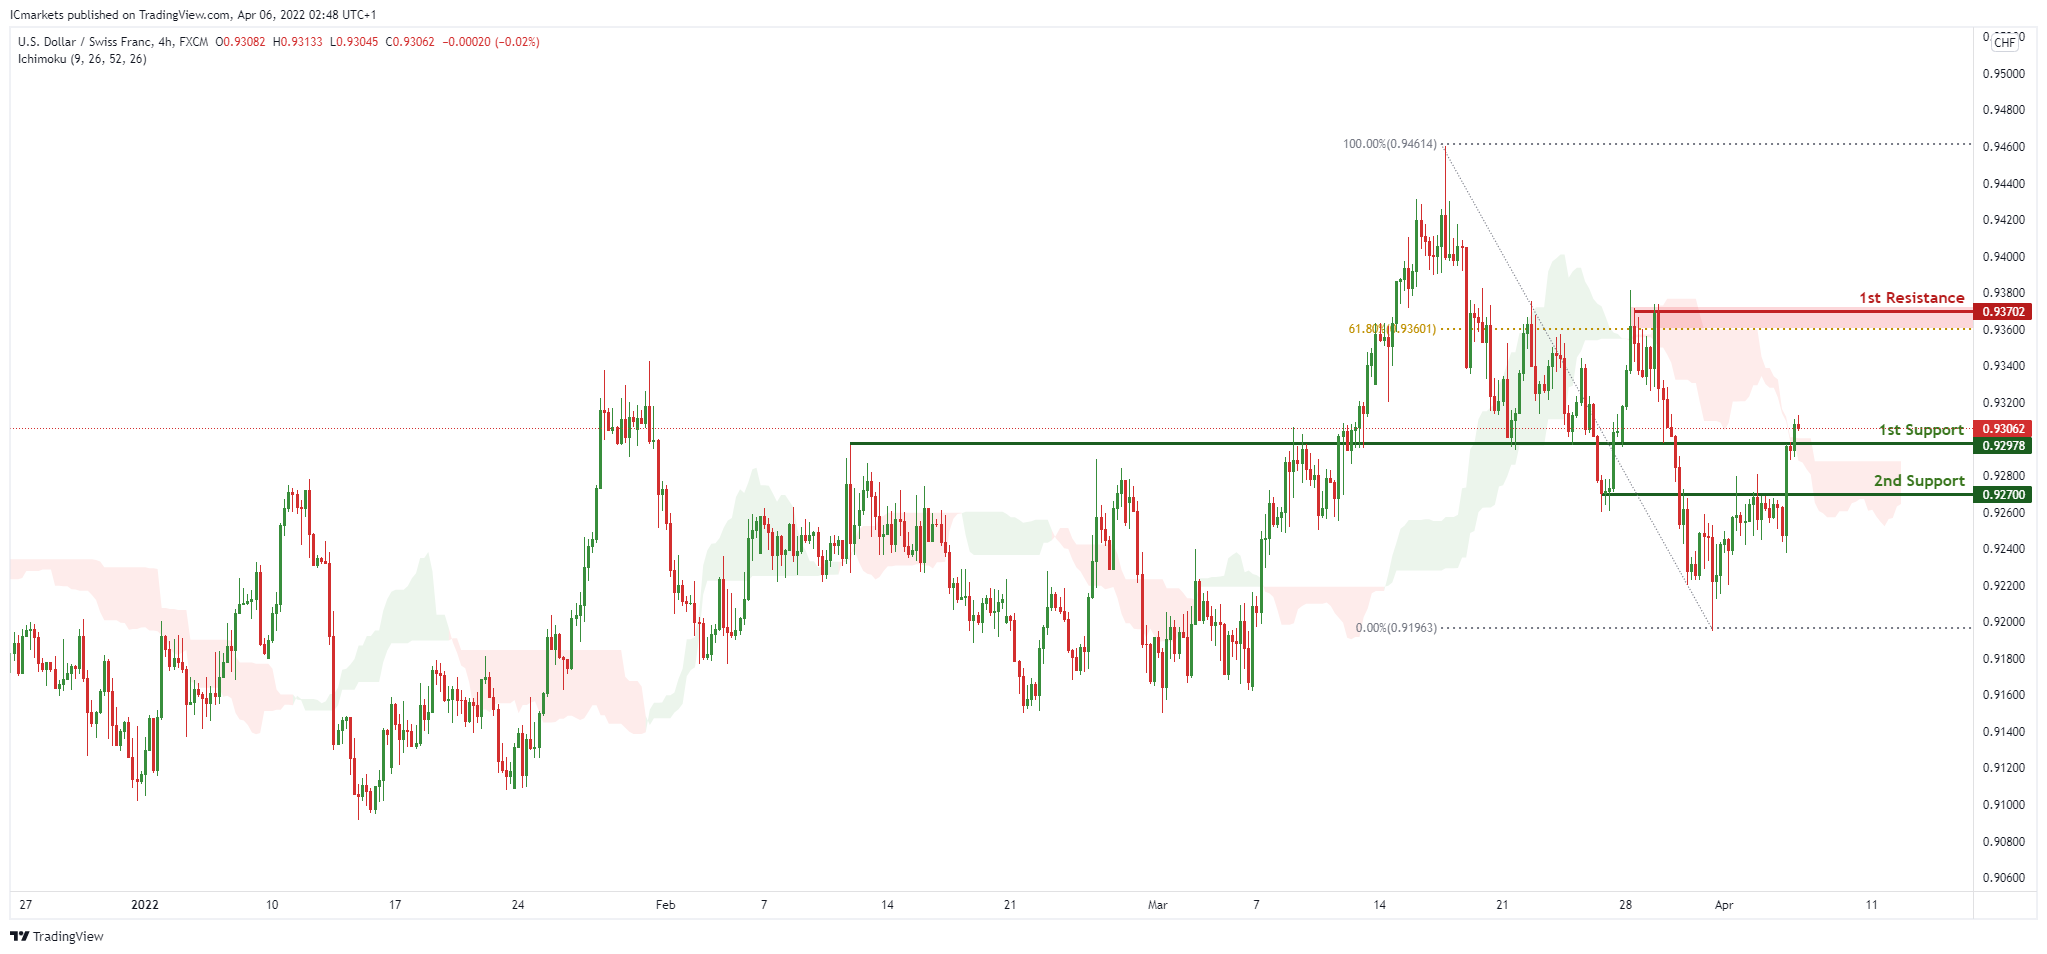
On the H4, with price moving above the ichimoku cloud, we have a bias that price will rise to our 1st resistance at 0.93702 in line with the 61.8% Fibonacci retracement from our 1st support at 0.92978 in line with the horizontal pullback support. Alternatively, price may break 1st support structure and head for 2nd support at 0.92700 in line with the swing pullback support.
Areas of consideration
- 1st support level at 0.92978
- 1st resistance level at 0.93702
EUR/USD :
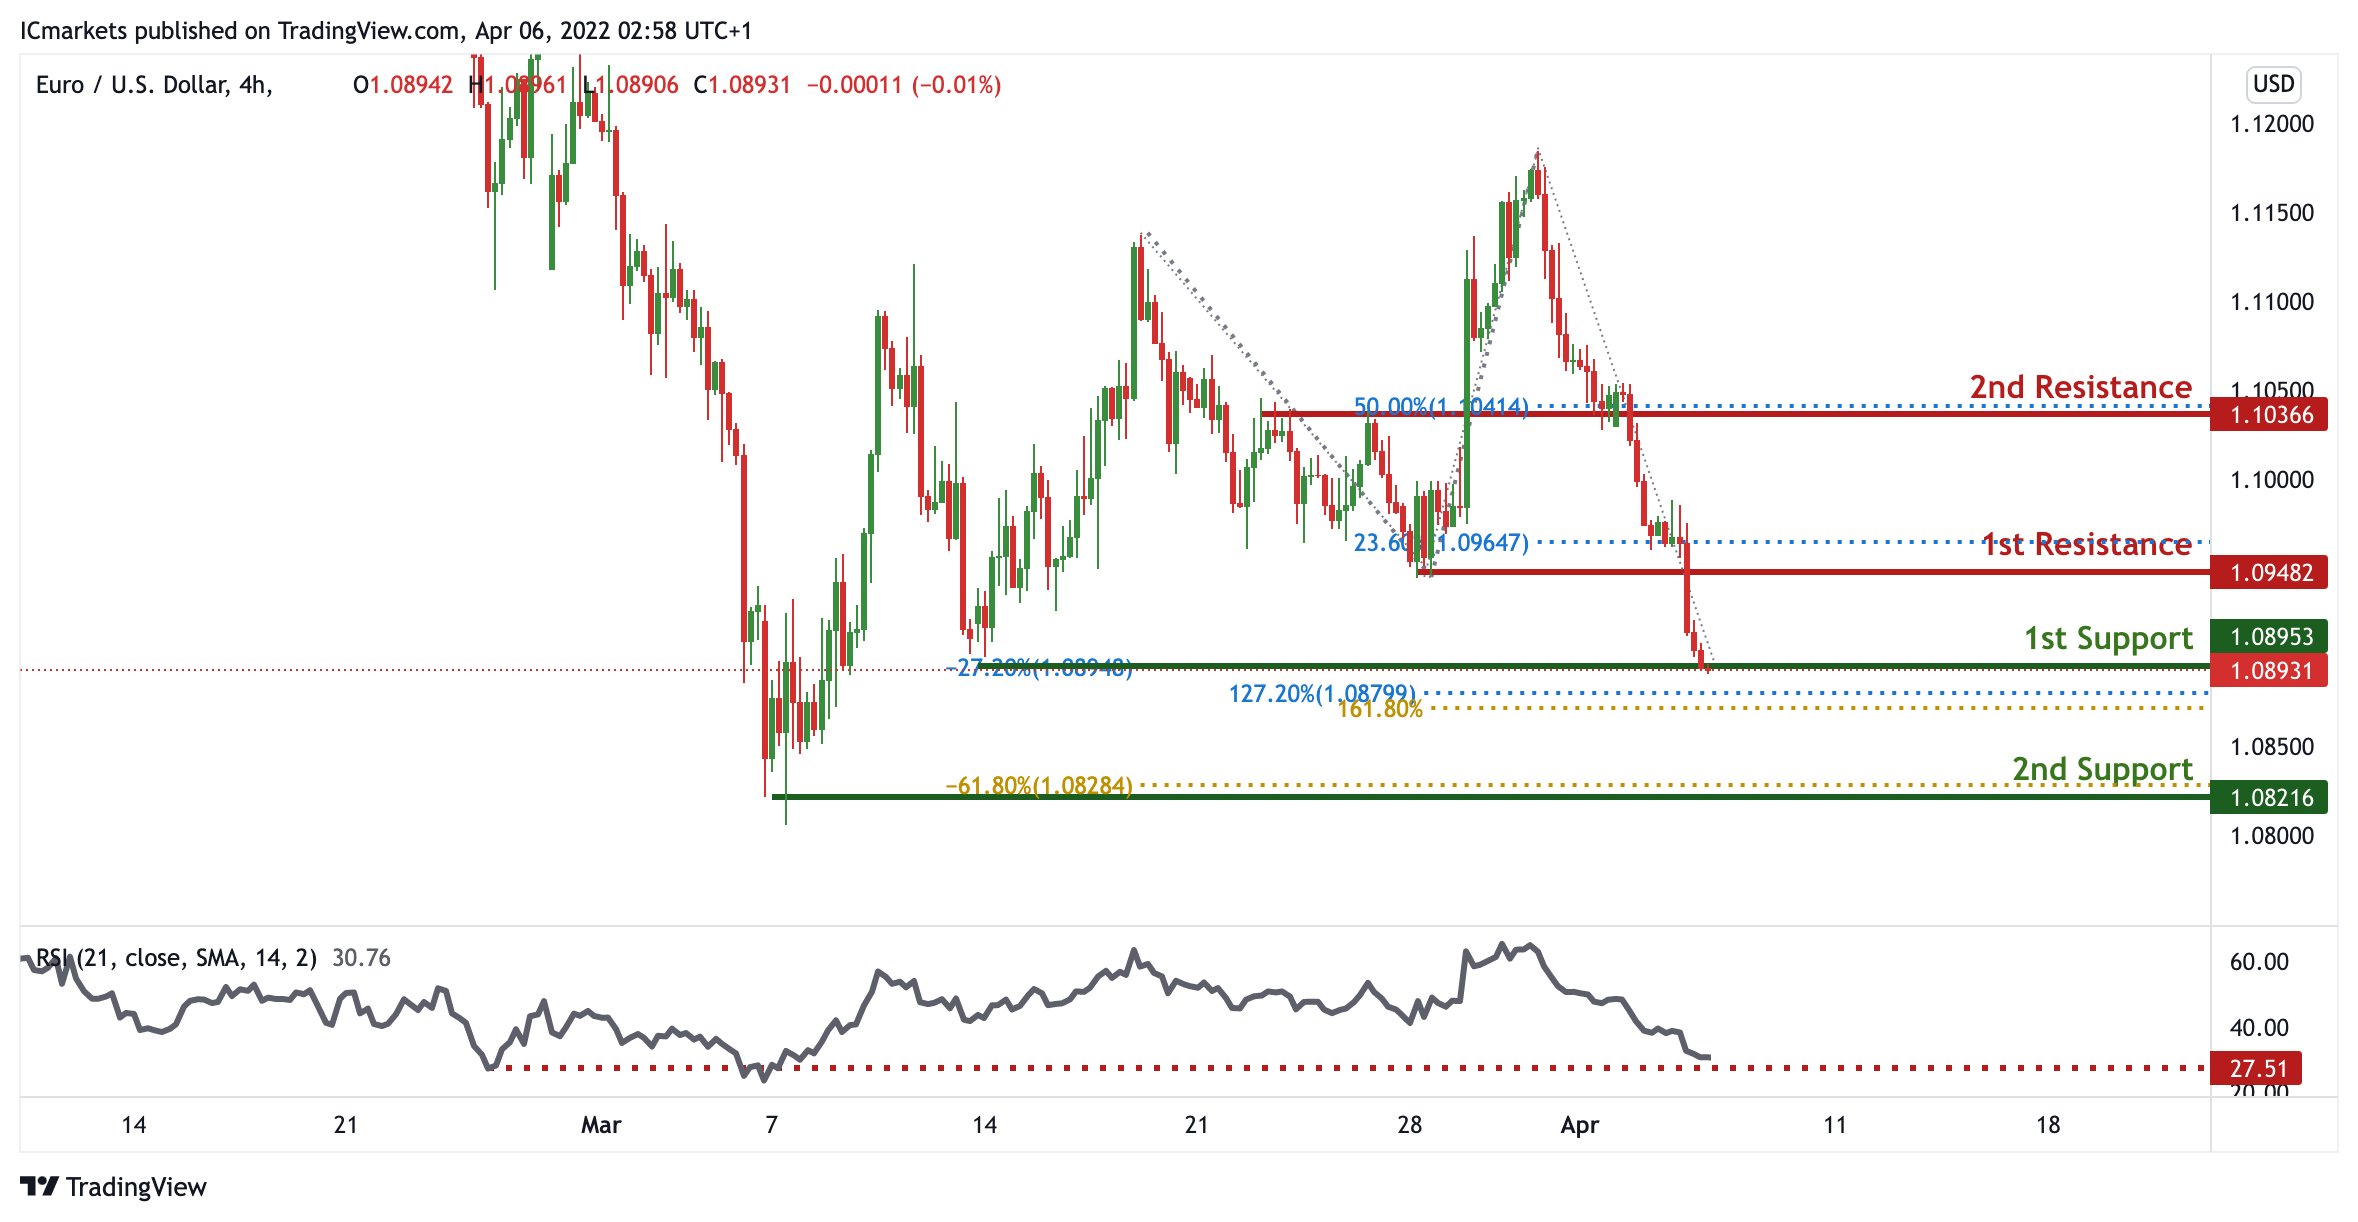
On the H4 timeframe, prices are on strong bearish momentum. We see the potential for slight pullback from our 1st support at 1.08953 which is an area of Fibonacci confluences towards our 1st resistance at 1.09482 in line with 23.6% Fibonacci retracement. RSI is at levels where bounces previously occurred.
Areas of consideration :
- H4 1st resistance at 1.09482
- H4 1st support at 1.08953
USD/JPY:
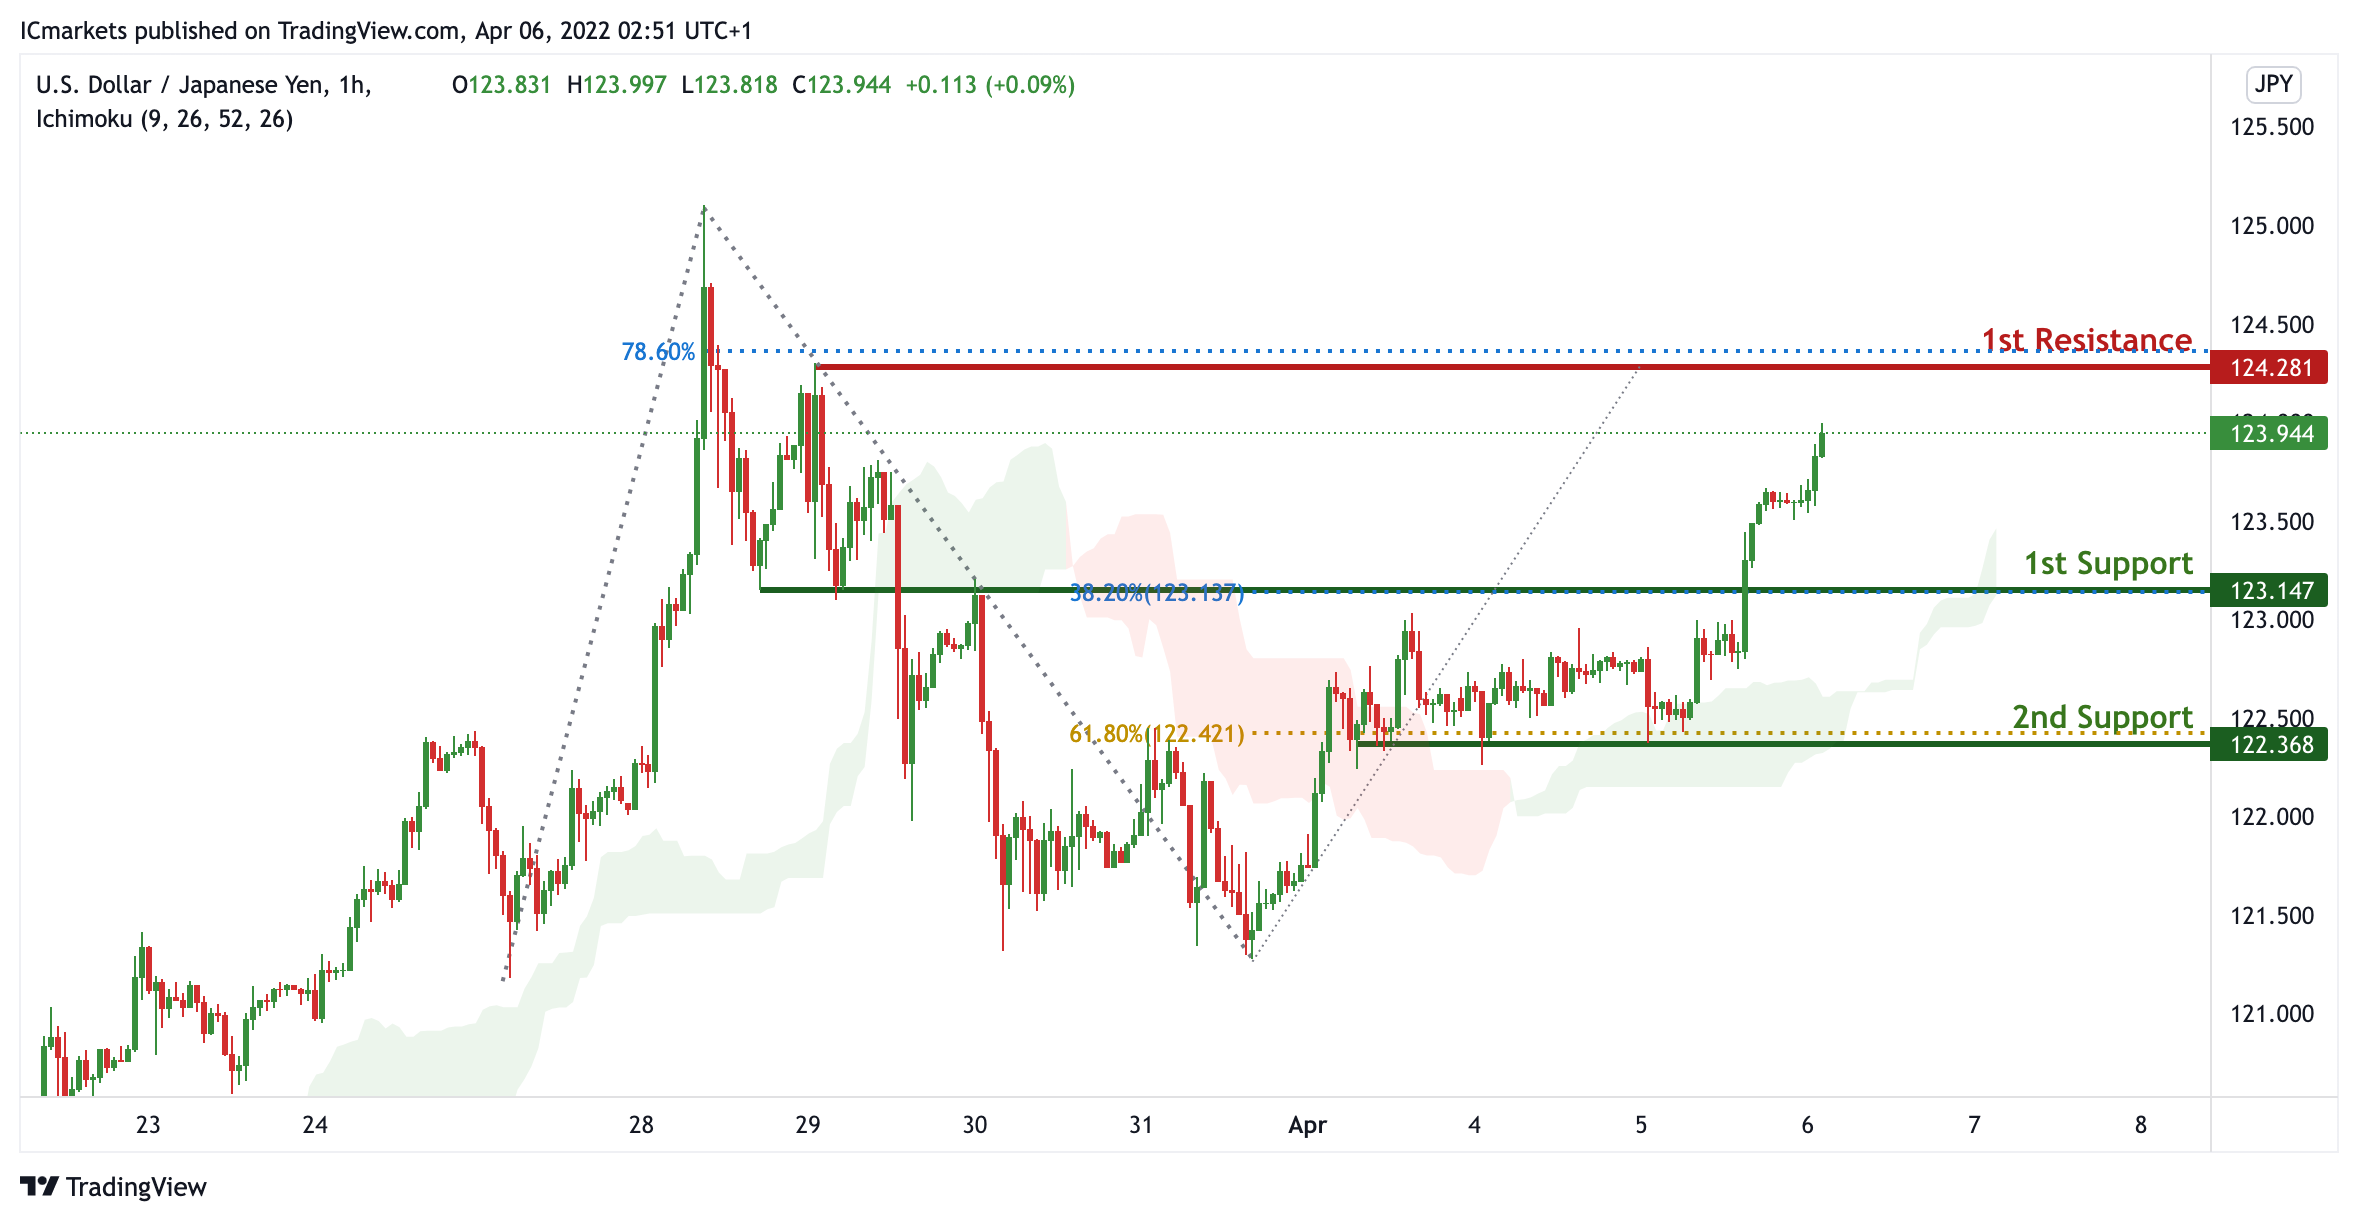
On the H4 timeframe, prices are on strong bullish momentum. We see the potential for further bullish momentum from our 1st support at 123.147 in line with 38.2% Fibonacci retracement towards our 1st resistance at 124.281 in line with 78.6% Fibonacci Projection. Prices are trading above our ichimoku clouds, further supporting our bullish bias.
Areas of consideration:
- H4 time frame, 1st resistance at 124.281
- H4 time frame, 1st support at 123.147
AUD/USD:
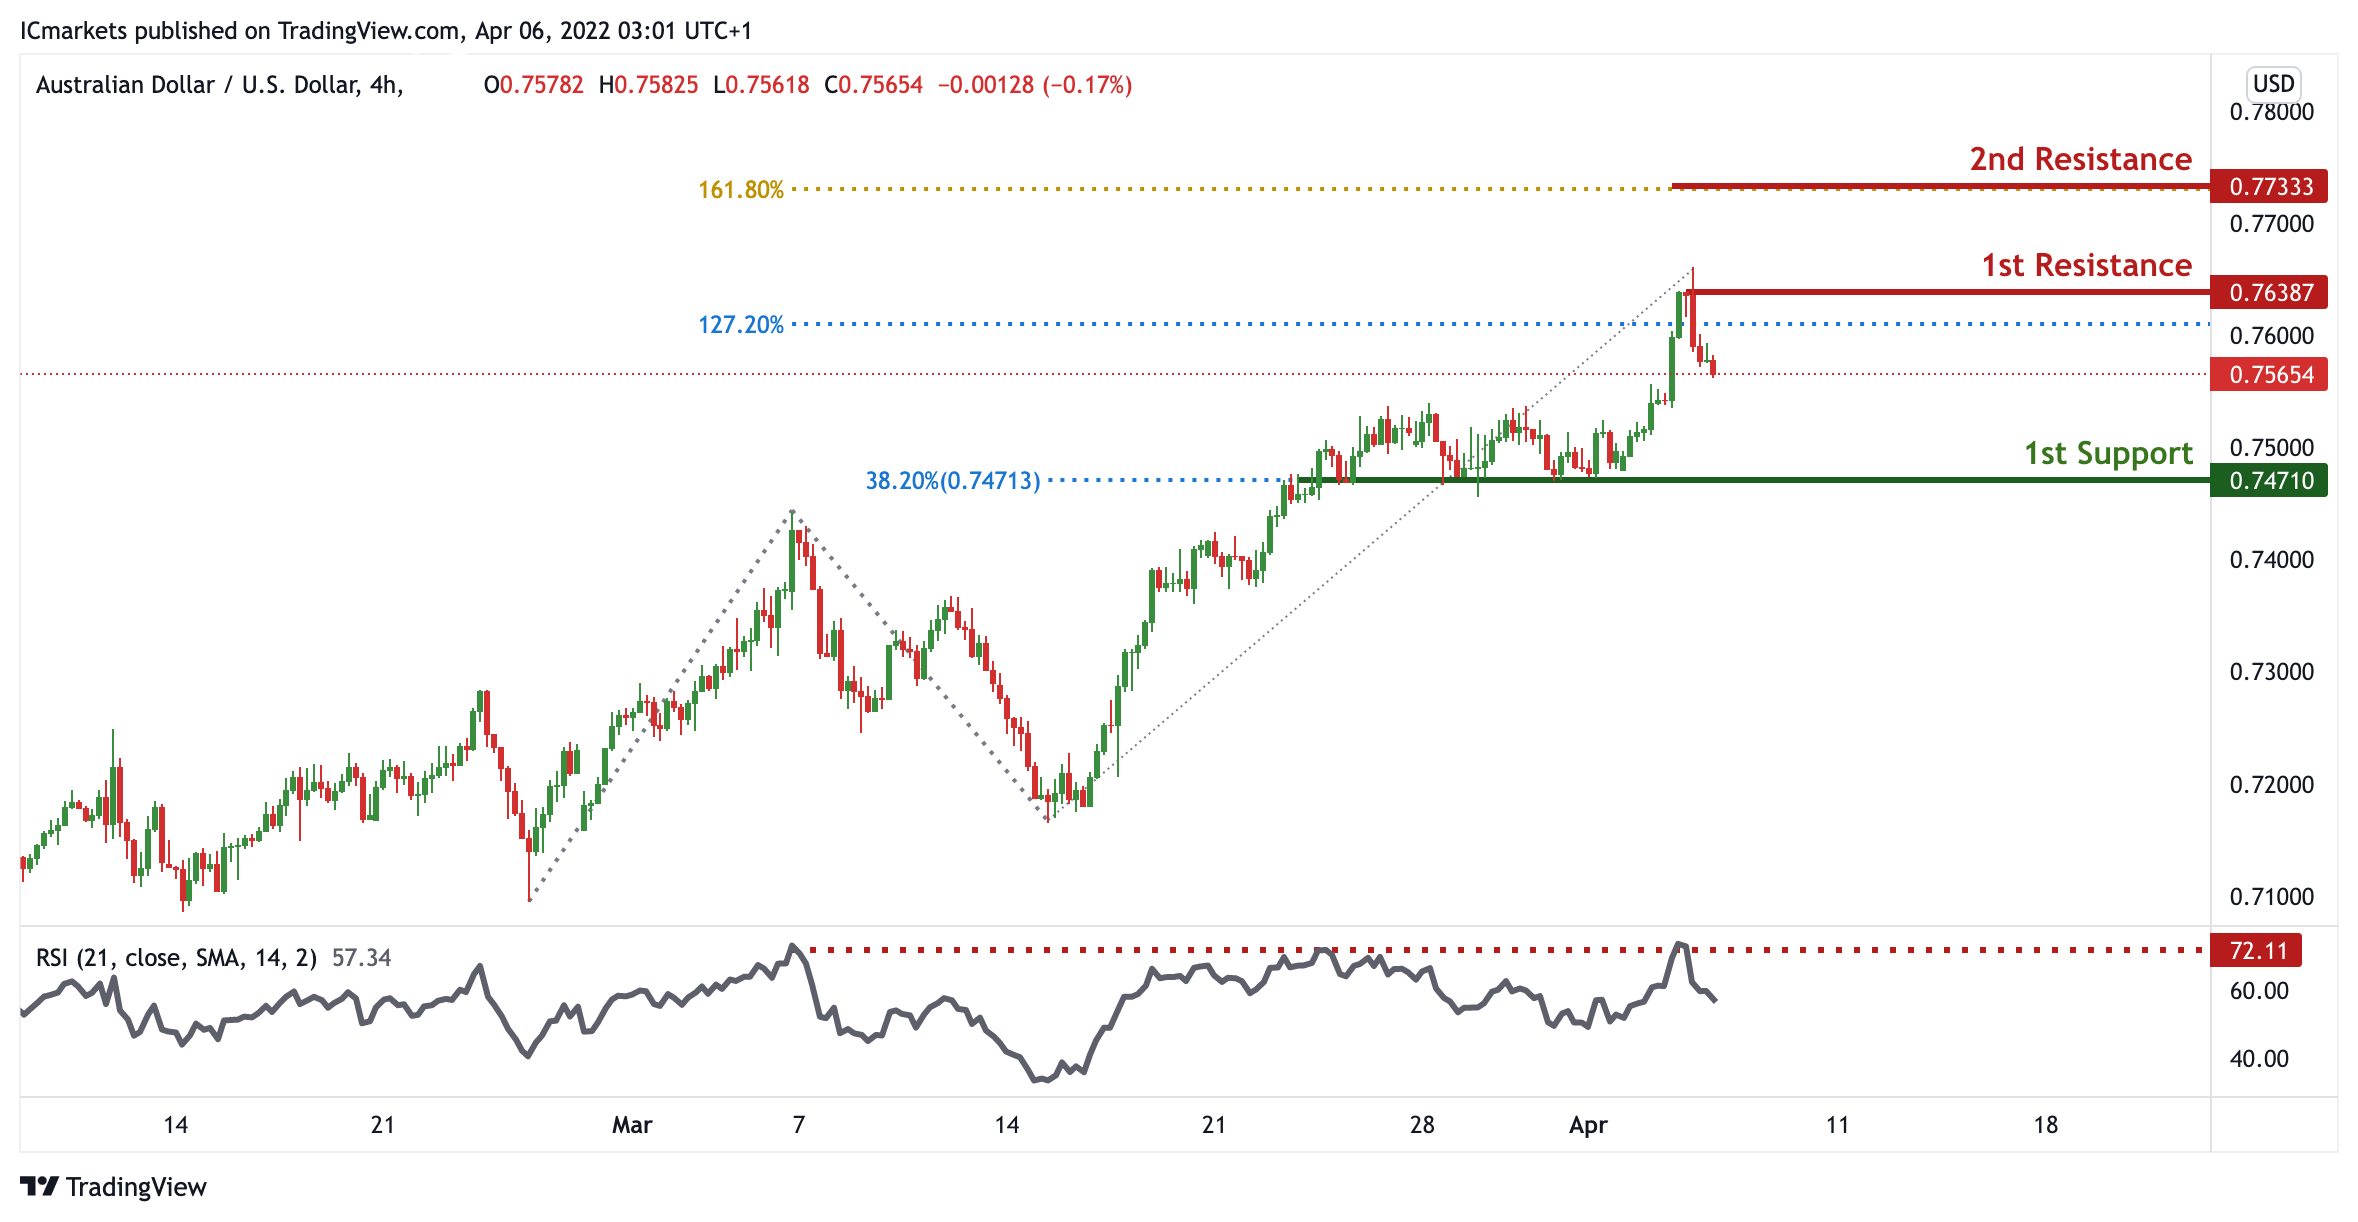
On the H4 timeframe, prices have bounced off a pivot. We see the potential for a dip from our 1st resistance at 0.76387 in line with 127.2% Fibonacci extension towards our 1st support at 0.74710 in line with 38.2% Fibonacci retracement. Our bearish bias is supported by RSI being at levels where dips previously occurred.
Areas of consideration
- H4 1st resistance at 0.76387
- H4 1st support at 0.74710
NZD/USD:
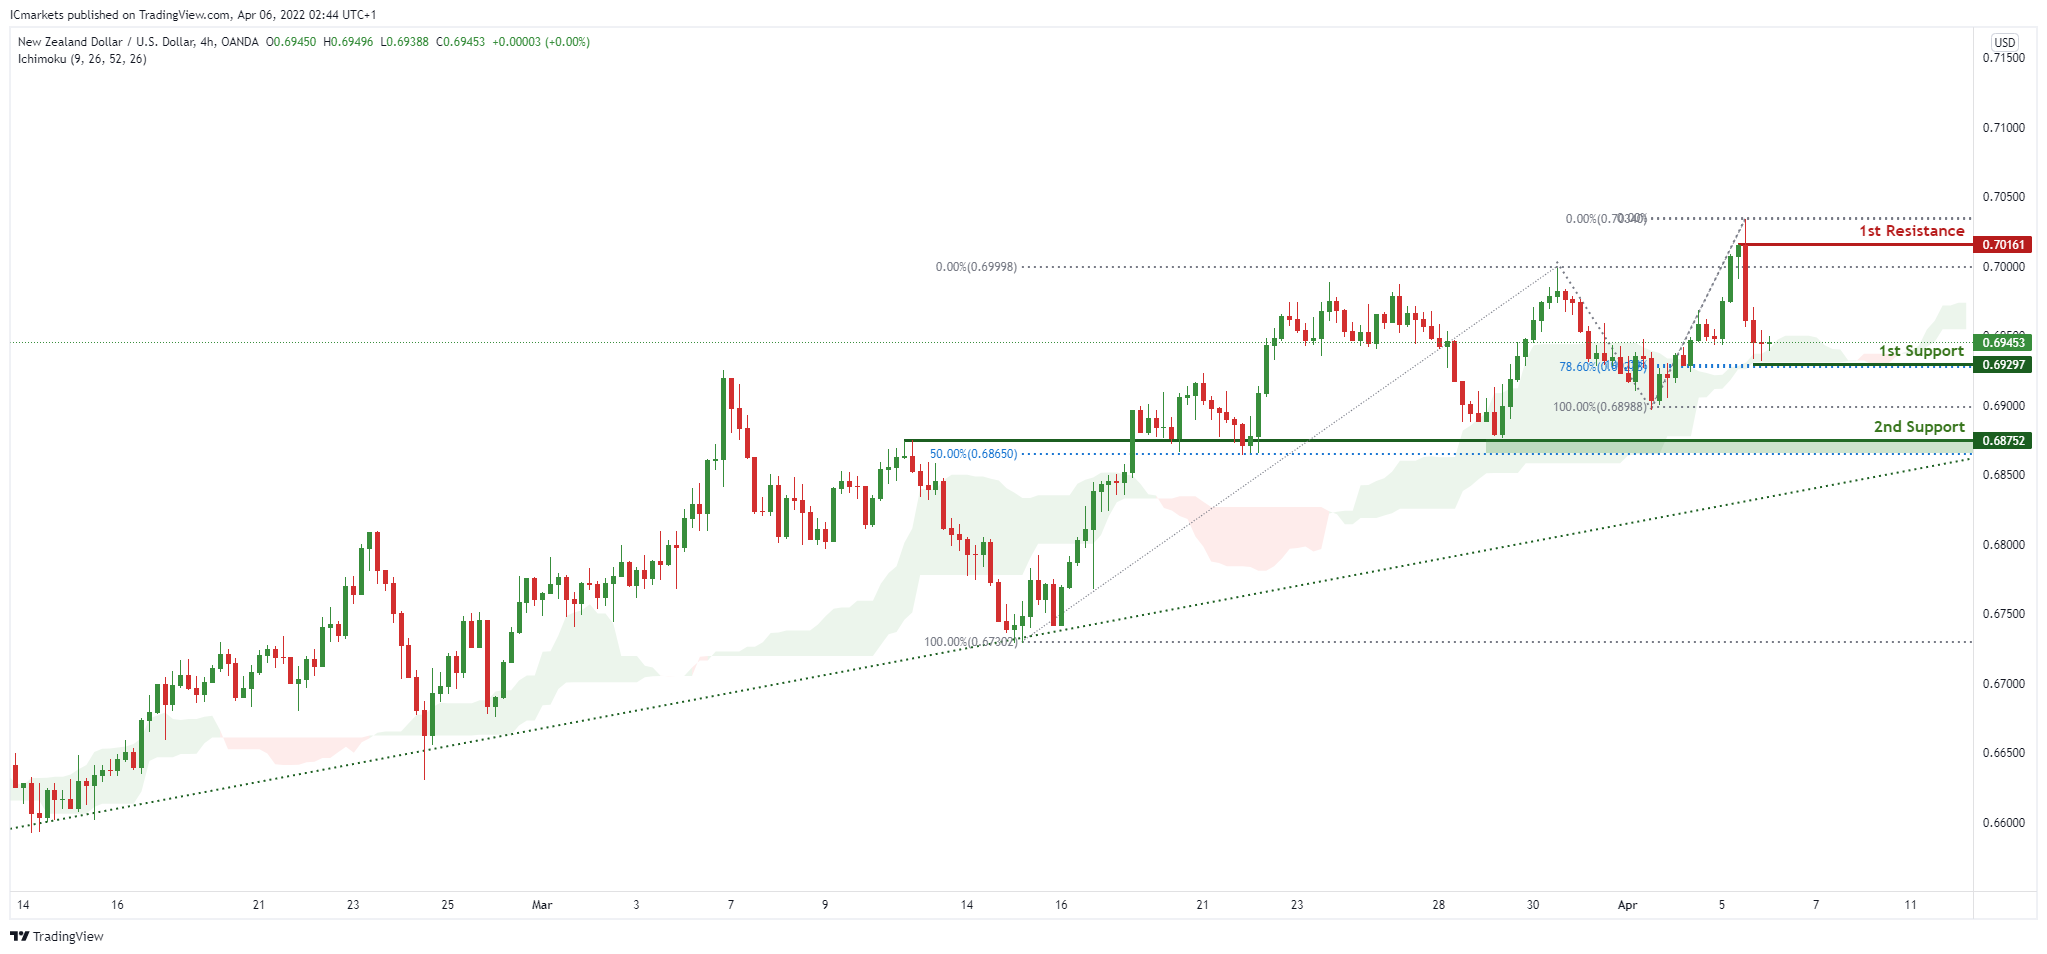
On the H4, with price expected to bounce off the support of the ichimoku cloud, we have a bias that price will rise to our 1st resistance at 0.70161 in line with the swing high resistance from our 1st support at 0.69297 in line with the horizontal overlap support, 78.6% Fibonacci projection. Alternatively, price may break 1st support structure and head for 2nd support at 0.68752 in line with the 50% Fibonacci retracement.
Areas of consideration:
- H4 time frame, 1st support at 0.69297
- H4 time frame, 1st resistance at 0.70161
USD/CAD:
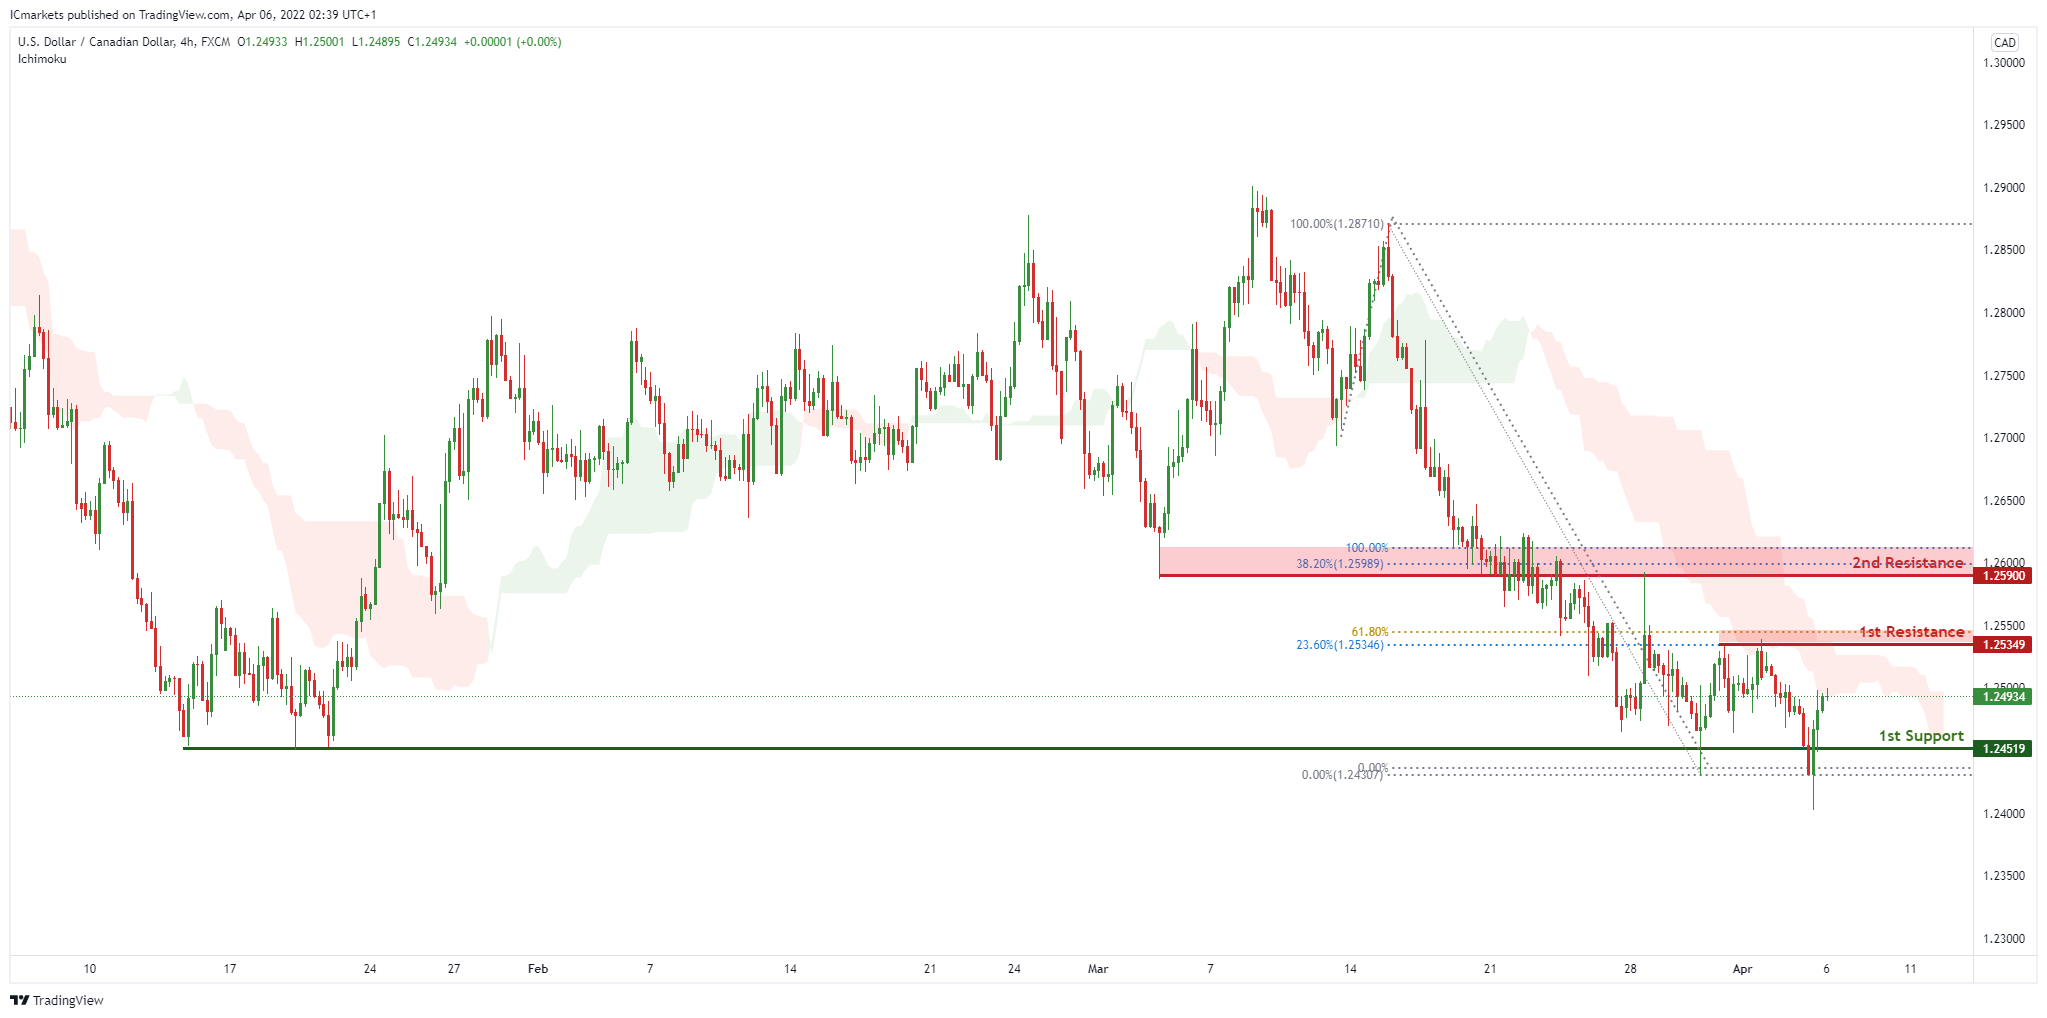
On the H4, with price moving below the ichimoku cloud, we expect to see a potential for bearish drop from our 1st resistance of 1.25349 in line with the 23.6% fibonacci retracement and 61.8% Fibonacci projection towards our 1st support level at 1.24519 in line with the swing low support. Alternatively, If price breaks out, it can potentially move towards our 2nd resistance level at 1.25900 which is in line with the 38.2% Fibonacci retracement and 100% Fibonacci projection.
Areas of consideration:
- H4 time frame, 1st support at 1.24519
- H4 time frame, 1st resistance at 1.25349
OIL:
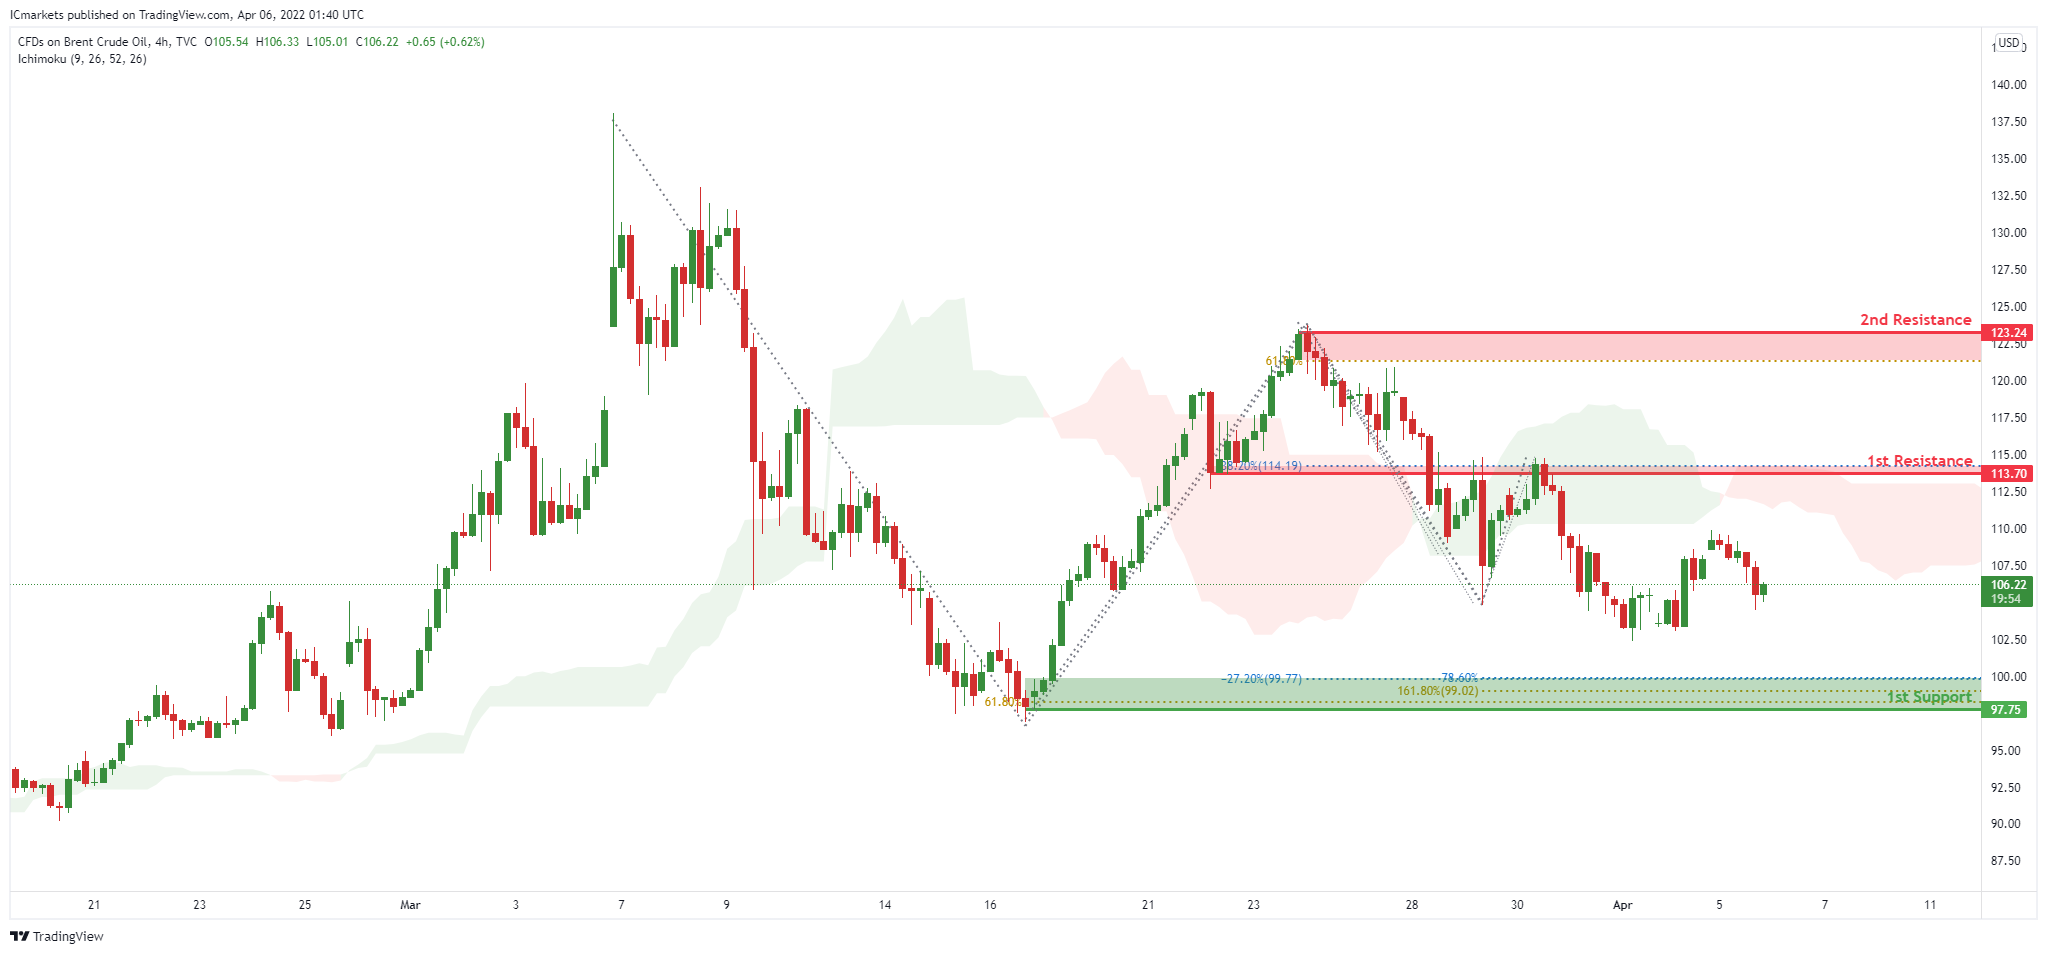
On the H4, with price moving below the ichimoku cloud, we expect to see a potential for bearish drop from our 1st resistance of 113.70 in line with the pullback resistance and 38.2% Fibonacci retracement towards our 1st support level at 97.75 in line with the 61.8% and 78.6% Fibonacci projection, 161.8% Fibonacci extension, -27.2% Fibonacci expansion. Alternatively, If price breaks out, it can potentially move towards our 2nd resistance level at 123.24 which is in line with the swing high resistance.
Areas of consideration:
- H4 time frame, 1st resistance of 113.70
- H4 time frame, 1st support of 98.14
Dow Jones Industrial Average:
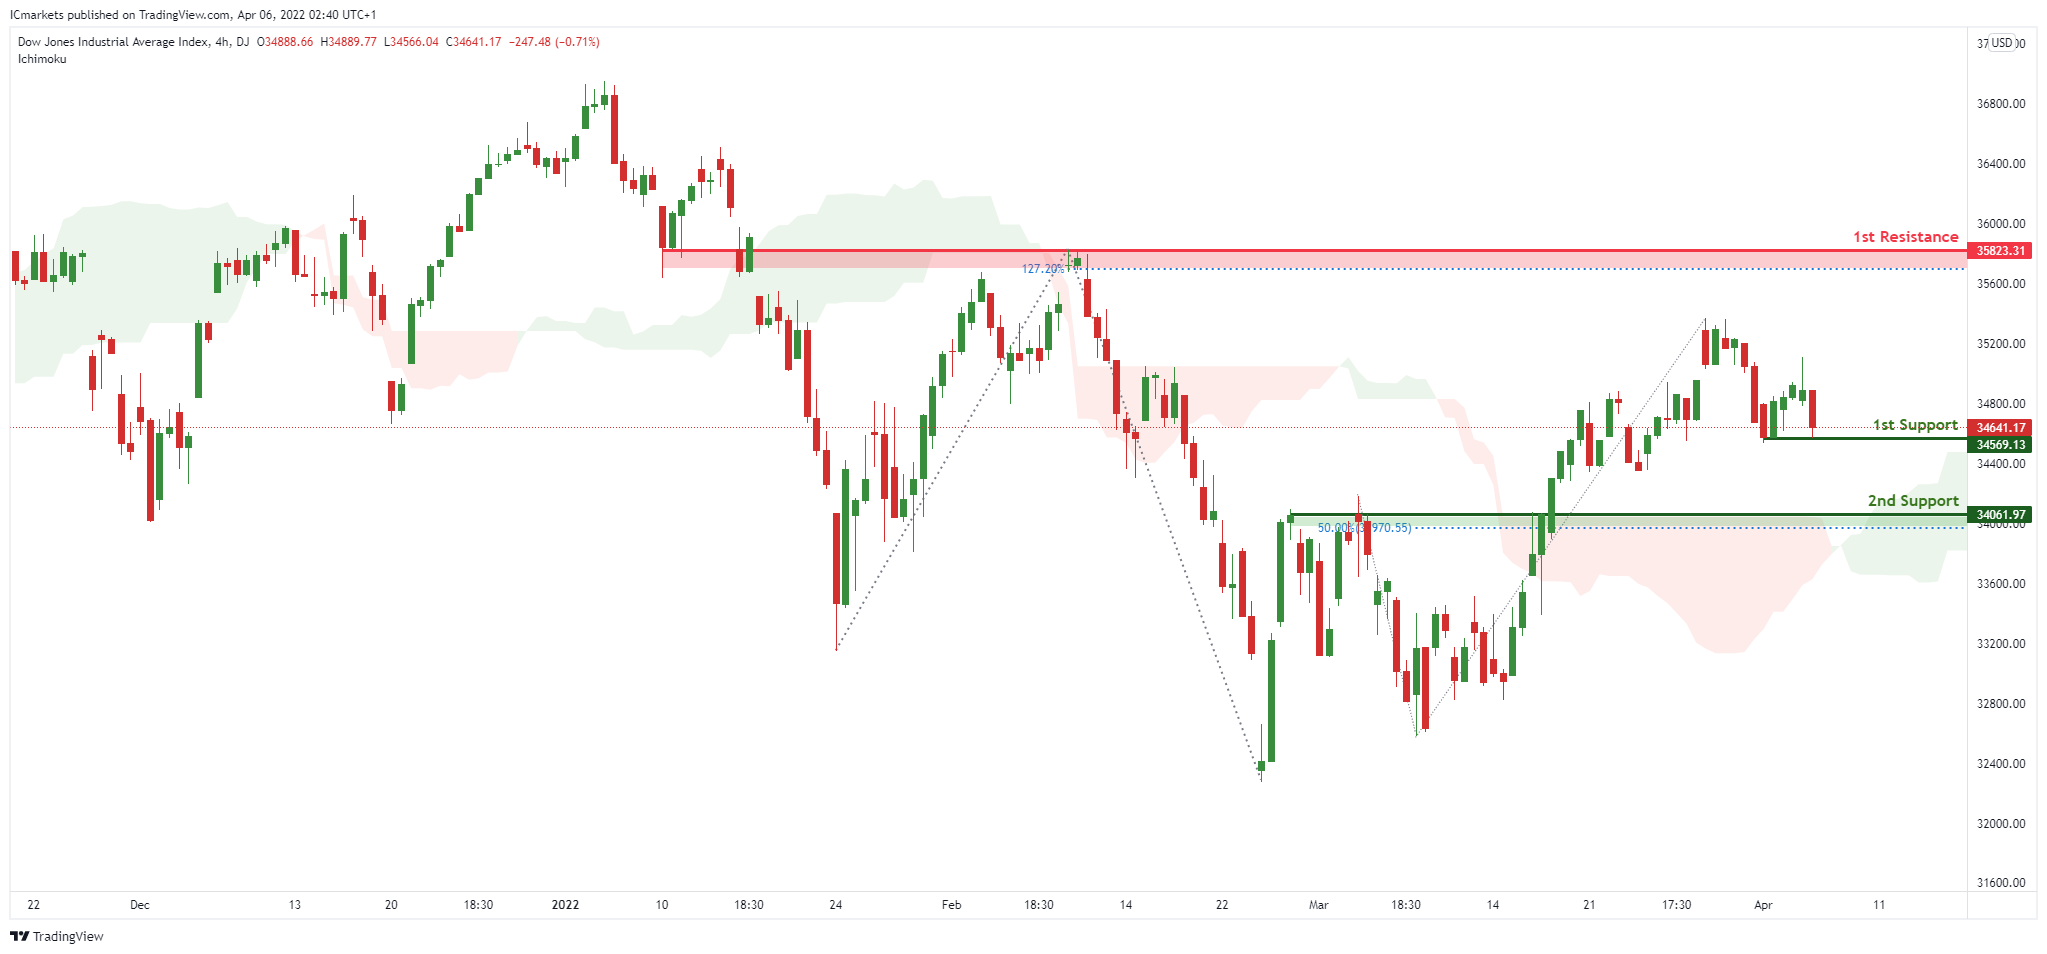
On the H4, with price moving above the ichimoku cloud, we have a bias that price will rise to our 1st resistance at 35823 in line with the 127.2% Fibonacci extension from our 1st support at 34569 in line with the horizontal pullback support and 50% Fibonacci retracement. Alternatively, price may break 1st support structure and head for 2nd support at 34061 in line with the horizontal swing low support.
Areas of consideration :
- H4 1st support at 34569
- H4 1st resistance at 35823
AUD/USD Rallies Above 0.7600, FOMC Next
Key Highlights
- AUD/USD started a strong increase above the 0.7520 resistance.
- A key bullish trend line is forming with support near 0.7530 on the 4-hours chart.
- EUR/USD extended decline below the main 1.0950 support.
- GBP/USD failed to clear the 1.3200 resistance.
AUD/USD Technical Analysis
The Aussie Dollar remained in a bullish zone above the 0.7400 level against the US Dollar. AUD/USD broke the 0.7500 and 0.7520 resistance levels to start a strong increase.
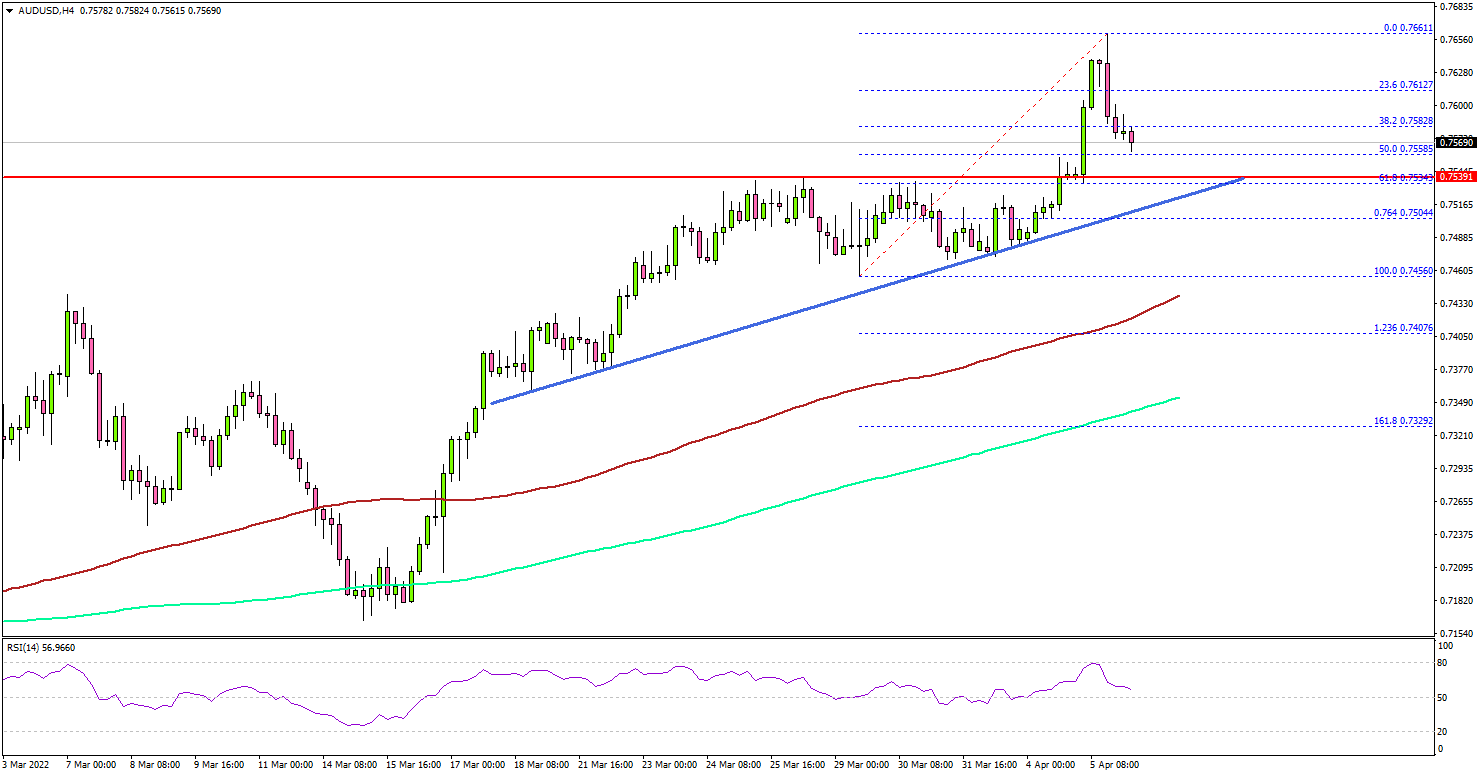
Looking at the 4-hours chart, the pair extended increase above the 0.7550 level. There was a close above the 0.7600 level, the 200 simple moving average (green, 4-hours), and the 100 simple moving average (red, 4-hours).
The upward move was such that the pair climbed above 0.7600 and traded to a new multi-week high. On the upside, an immediate resistance is near the 0.7650.
The next major resistance is near the 0.7700 level. Any more gains might send the pair towards the 0.7750 level in the coming sessions.
On the downside, the pair might find support near 0.7580. The main support now sits near the 0.7500 zone. There is also a key bullish trend line forming with support near 0.7530 on the same chart.
Fundamentally, the US ISM Services Index was released yesterday by the Institute for Supply Management (ISM). The market was looking for an increase from 56.5 to 58.0.
The actual result was better than the forecast, as the US ISM Services Index increased from 56.5 to 58.3 in March 2022. Besides, the ISM Services New Orders Index increased from 56.1 to 60.1.
Looking at EUR/USD, the pair seems to be struggling to stay above 1.0880, and GBP/USD failed to gain strength above the 1.3150 resistance zone.
Economic Releases
- FOMC Meeting Minutes.
EURJPY Incomplete Bullish Sequence Calls for More Upside
EURJPY has rallied 1300+ pips during three weeks of March. It found a low at 124.39 on March 7, 2022 and reached a high of 137.54 on March 28, 2022. This equates to 10.57% gain within just three weeks. It seems to have ended a cycle from March 7, 2022 low and pulling back. In today’s article, we will present the future path and also look at some charts from the recent past in which we showed the path to our members.
EURJPY Elliott Wave Analysis – Daily Time Frame – 19 February 2022
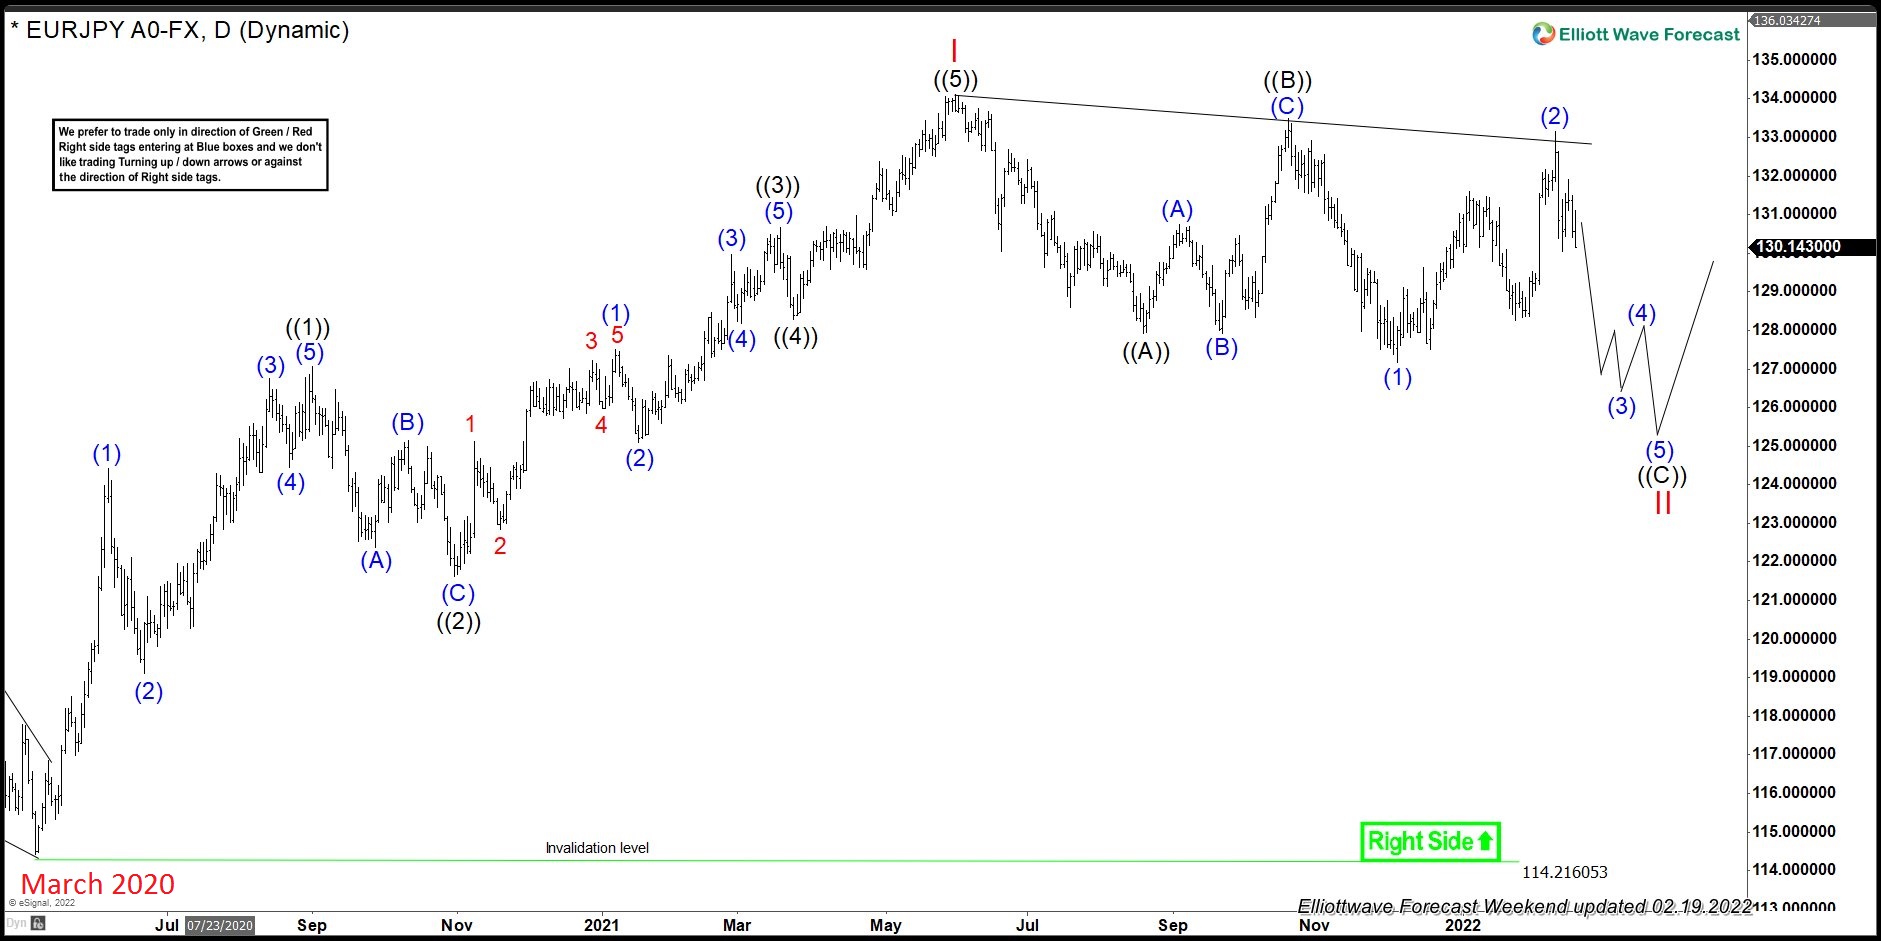
Chart below shows EURJPY cycle from March 2020 low ended at 134.12 on June 1, 2021. We labelled this rally as an Elliott wave impulse which has been nicely sub-divided into 5 waves. Following this peak, pair started a pull back to correct the cycle from March 2020 low. We can already see 3 waves down but based in market correlation, we expected the pair to see more downside and break below December 2021 low to complete the correction of March 2020 cycle before resuming the rally.
EURJPY Elliott Wave Analysis – Daily Time Frame – April 2, 2022
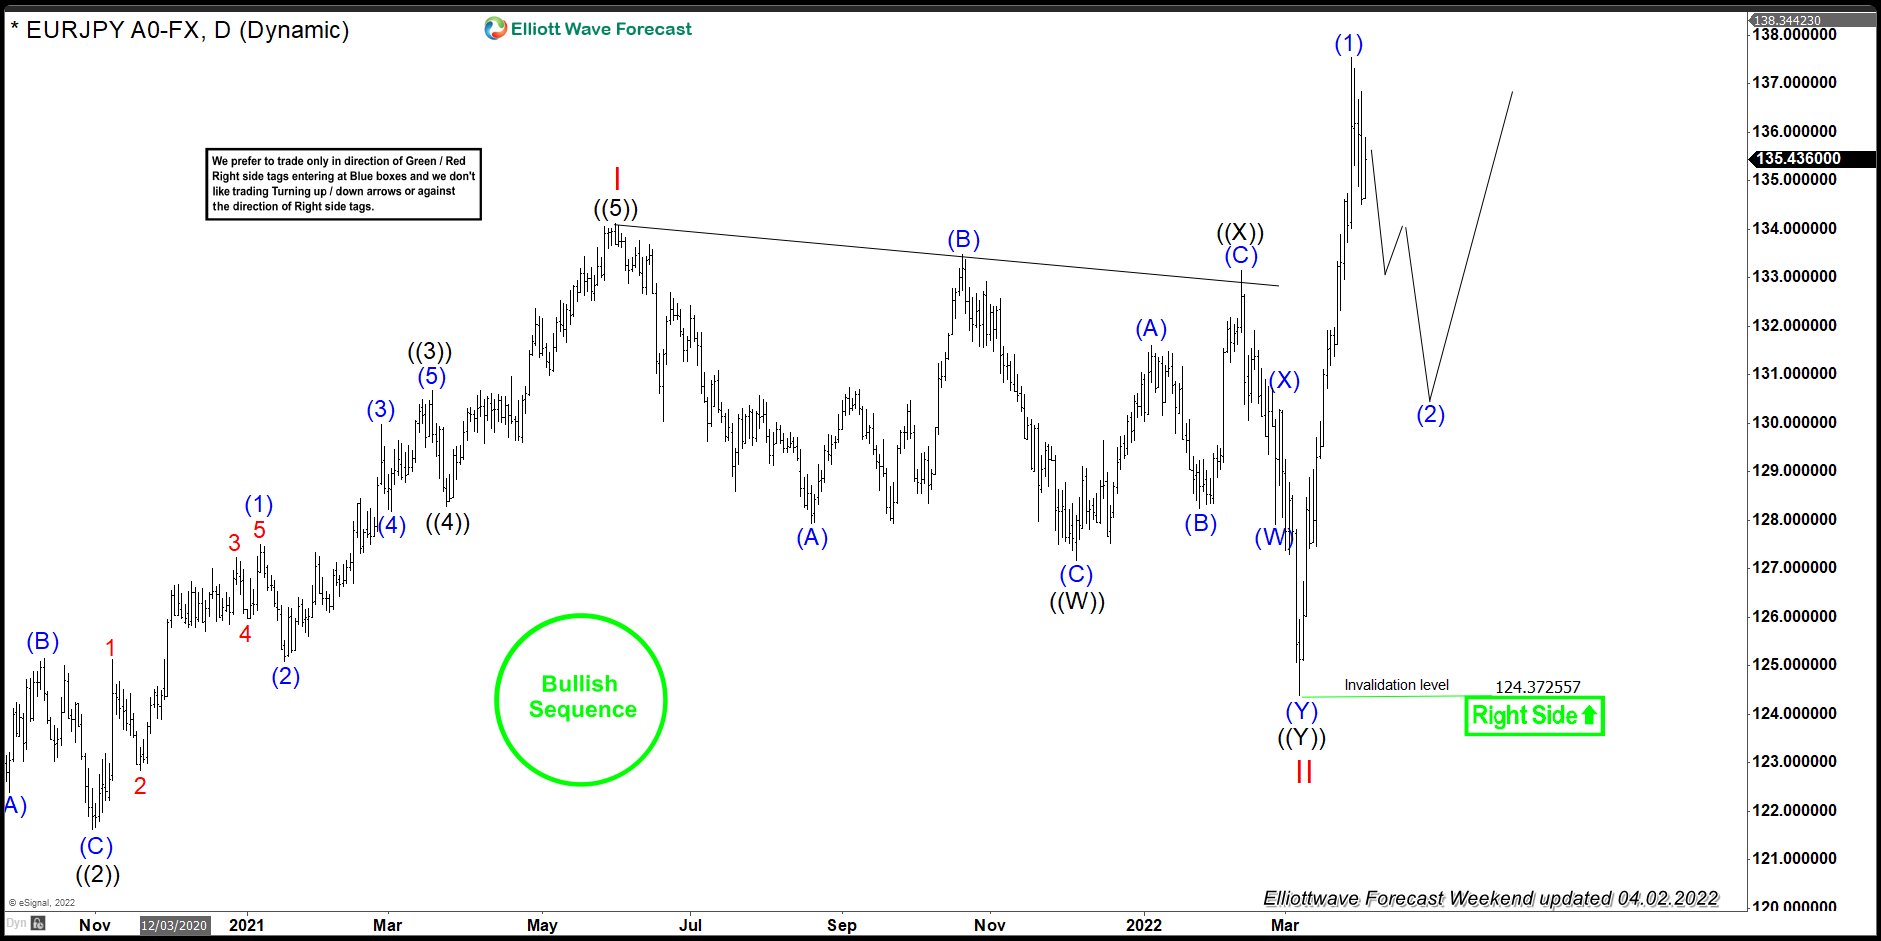
Chart below shows EURJPY extended the decline and went on to break below December 2021 low as expected to finish correcting March 2020 cycle. It found a low on March 7, 2022 at 124.39 and rallied to a high of 137.54 on March 28, 2022. Cycle from 124.39 low ended and pair is now expected to pull back to correct the cycle from March 7, 2022 low before pair turns higher to resume the rally. Right side is up and as dips hold above March 7, 2022 low, we expect pair to find buyers in the dips in 3, 7 or 11 swings.
EURJPY Double Incomplete Bullish Sequence
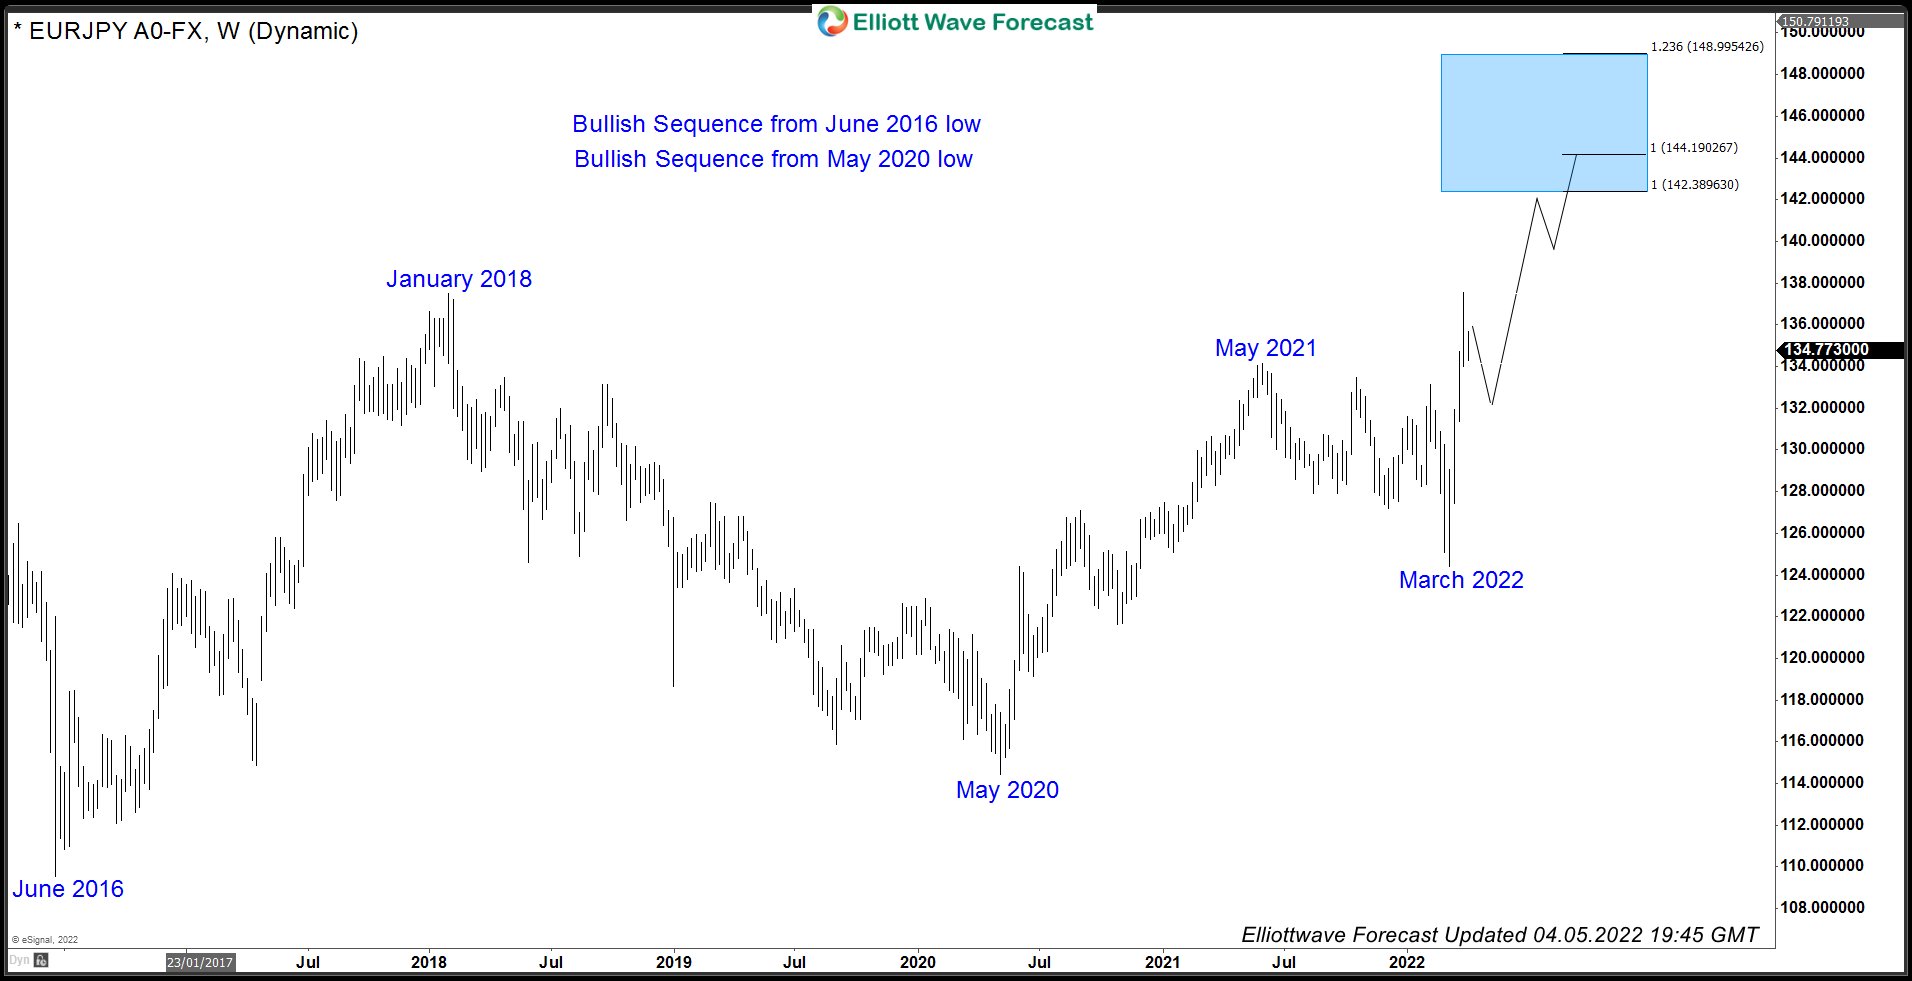
Pair recently broke above May 2021 peak and also broke above January 2018 peak which creates a double incomplete bullish sequence with target area between 142.38 – 148.99 at least. As dips hold above March 2022 low, buyers should remain in control and expect the pair to find buyers in the dips in 3, 7 or 11 swings.
Elliott Wave View: Gold Correction in Progress
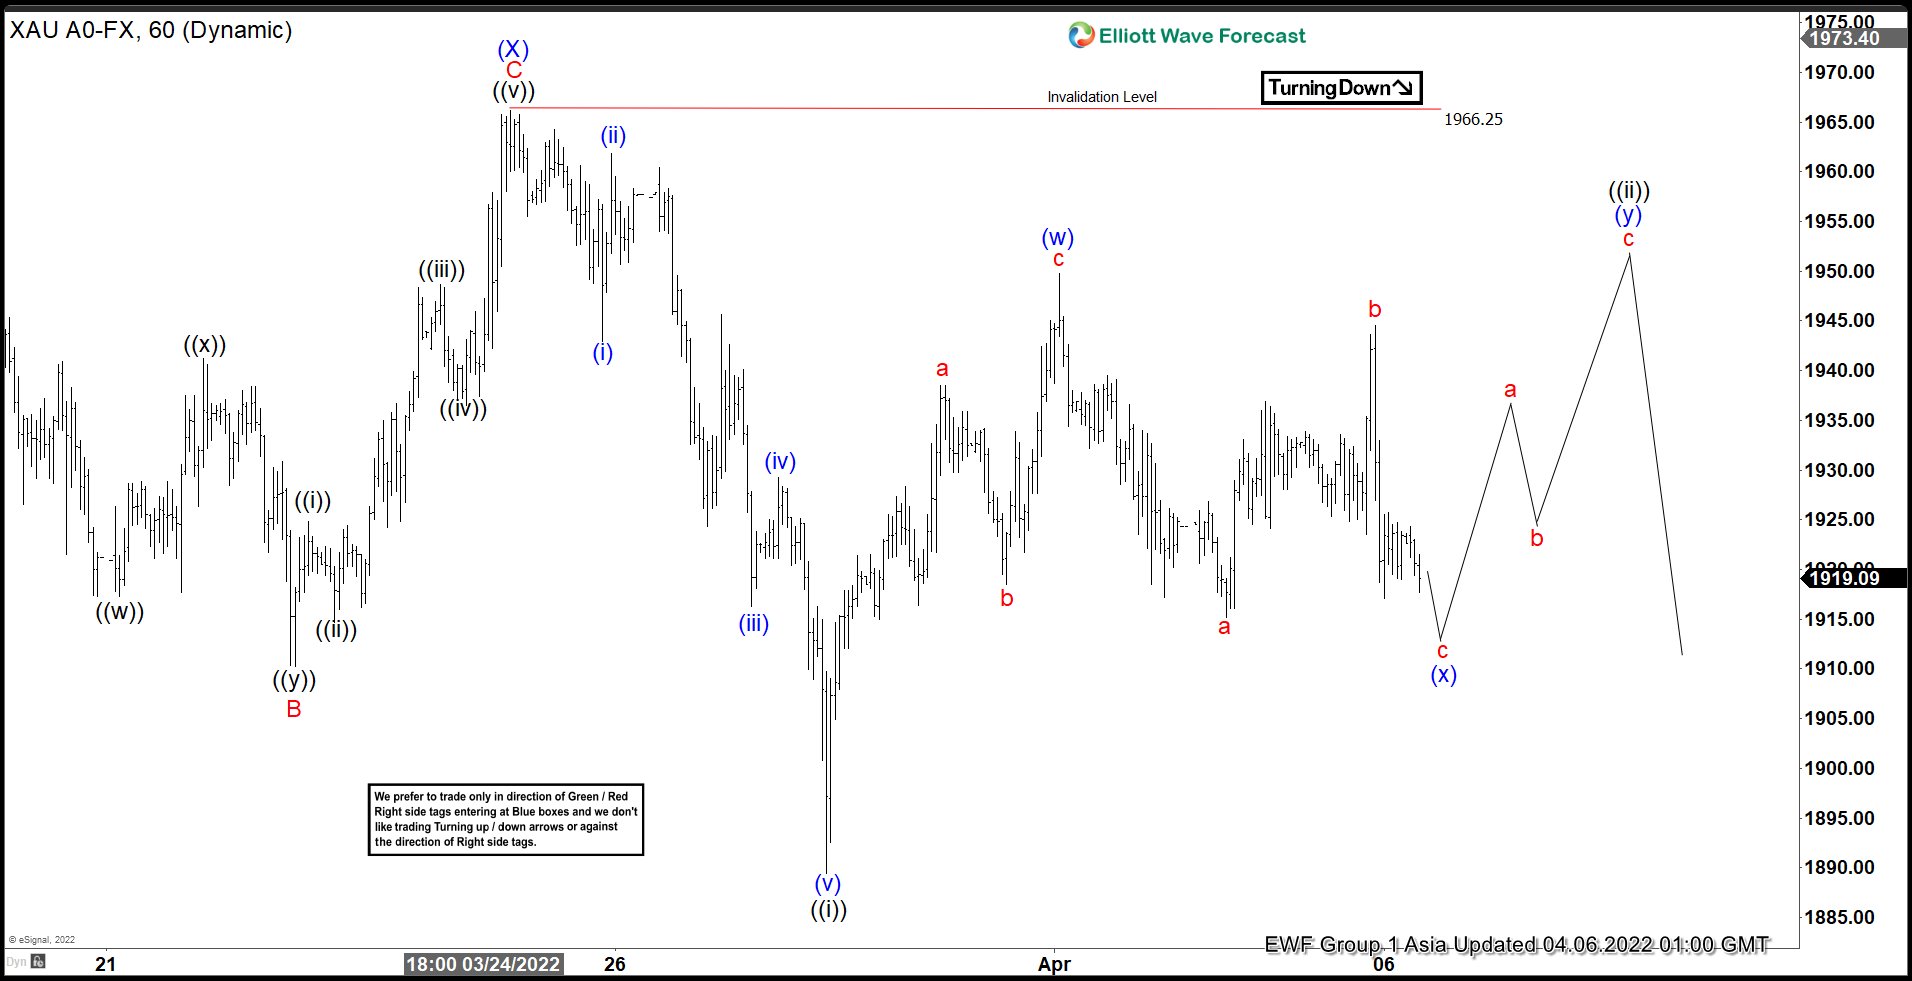
Short Term outlook in Gold (XAUUSD) suggests the decline from March 8 peak is unfolding as a double three Elliott Wave structure. Down from March 8, wave (W) ended at 1895.13 and rally in wave (X) ended at 1966.12. The metal has broken below 1895.13 again, suggesting that wave (Y) has resumed lower. Down from wave (X), wave (i) ended at 1942.92 and rally in wave (ii) ended at 1961.81. The metal then resumed lower in wave (iii) towards 1916.30 and wave (iv) ended at 1929.27. Final leg lower wave (v) ended at 1889.40 which completed wave ((i)) in larger degree. Wave ((ii)) corrective rally is now in progress as a double three.
Up from wave ((i)), wave a ended at 1938.54, wave b ended at 1918.50, and wave c ended at 1949.79. This completed wave (w) in larger degree. Pullback in wave (x) is now in progress as a zigzag where wave a ended at 1915.18 and wave b ended at 1944.55. Expect wave c to end soon which should complete wave (x). Afterwards, the metal can rally higher in wave (y) to complete wave ((ii)) before the decline resumes. Near term, as far as pivot at 1966.25 high stays intact, the metal has scope to extend lower within wave (Y).
Gold 60 Minutes Elliott Wave Chart
Gold Outlook: Incoming CPI Rates in Focus
Gold closed the previous week in red territory but overall maintained its wider sideways motion it has been moving within for the past months. Gold traders continue to carefully monitor economic and geopolitical developments around the world, as they can prove key to identifying the market’s movements or trend. In this report, we aim to bring forth the most significant matters currently surrounding the gold market while providing at the same time a Gold price analysis from a technical perspective.
In the past week, the most significant economic event was the US jobs report for March, that provided from our point of view some positivity for the US economy. According to the official numbers released on the 1st of April, the US economy added 431,000 jobs in the month of March, and the unemployment rate dropped by 0.2% to reach 3.6%. Unemployment is currently running across pre-pandemic levels displaying strong job growth and continuous economic recovery. We must note that Gold was trading downwards from the start of the day and even though moved sideways after the release of the report, it eventually closed the day lower. Gold’s reaction to the news could imply that positive economic data tends to invite selling interest for the metal. Instead, positive economic data from the US may be favoring the USD index that was up on the specific day. Yet, confirmation that the Jobs market continues to tighten, and inflation is running at record high levels seems to encourage some FOMC members to support a double rate (0.50%) hike in the coming month. As the Gold market expects the Federal Reserve to increase rates moving forward, the markets could be in an adaptation period at the moment and may increase volatility substantially in the near future.
On a separate note, US Treasury yields continue to be on the rise possibly making the Gold market seem unattractive to traders. The non-yielding bullion may be forced to carry out muted price action as Treasury yields rise.
Furthermore, tensions with Russia’s war in Ukraine seem to be ongoing and nations are forced to close in with more sanctions. As the situation remains ongoing, we could not exclude the possibility of an unexpected movement on Gold prices if the situation is to escalate further. Moreover, another subject that could be important for the Gold market remains the fact that the Chinese Province of Shanghai has extended lockdown measures in the latest days. Lockdowns could impact Chinese factory output and possibly affect other international markets.
In the days ahead three economic events from the US stand out in our opinion and could create notable volatility for Gold prices. First on Wednesday the 6th of April, the FOMC Meeting Minutes could provide further information on the pace of future rate hikes which depending on the actual outcome can move the Gold market accordingly. On the 7th of March we get the Initial Jobless claims figure for the week. Yet the key event in the next seven days is the US inflation data for March to be released on the 12th of April. CPI rates have traditionally moved Gold prices as the metal’s volatile nature can be used as a hedge for higher prices. CPI rates can create intense volatility across the board upon release, thus caution is advised.
Technical Analysis
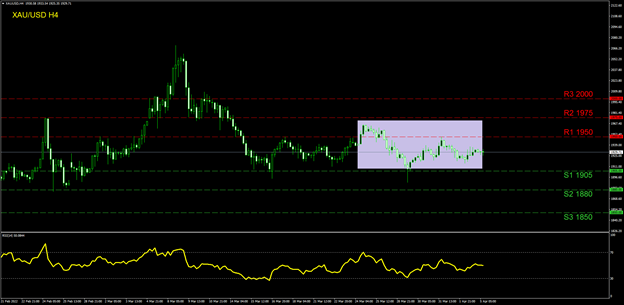
XAUUSD H4 chart
At the moment, Gold is trading between our (R1) 1950 resistance level and our (S1) 1905 support level. The (S1) has not been breached since late February proving it is a rather solid support line for traders to consider. The (R1) has been used as a resistance various times since March 15th and was breached only between the 24th and the 28th of March when the price action surged just below the (R2) 1975 resistance barrier but did not clearly test it. In general, the range between the (R2) 1975 resistance and the (S1) 1905 support is critical in our view, thus highlighted on our chart. If this range is breached to the upside, we could be seeing a formation of a solid buying trend. In the opposite direction if the breach is downwards, then it could signal a strong selling interest. In the scenario that buying orders are in excess we could see traders targeting the (R3) 2000 level which is our highest resistance level. In case of a selling trend extending into the following sessions we could see a test of the (S2) 1880 level initially and then the (S3) 1850 barrier coming into play. In our opinion, the precious metal continues to trade sideways and the RSI indicator below our chart seems to back this view, as it is currently moving across the 50-level.
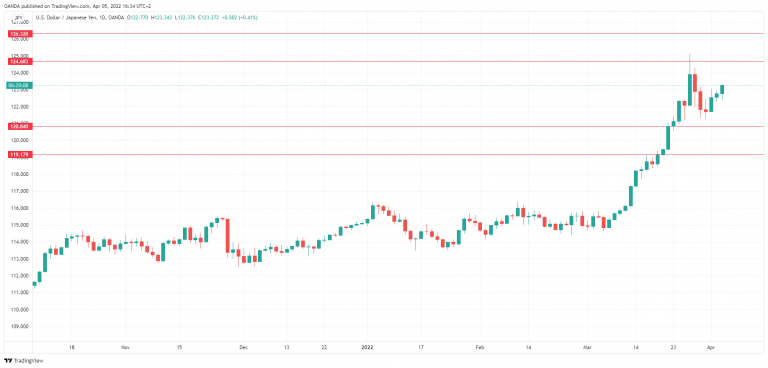
USDJPY Wave Analysis
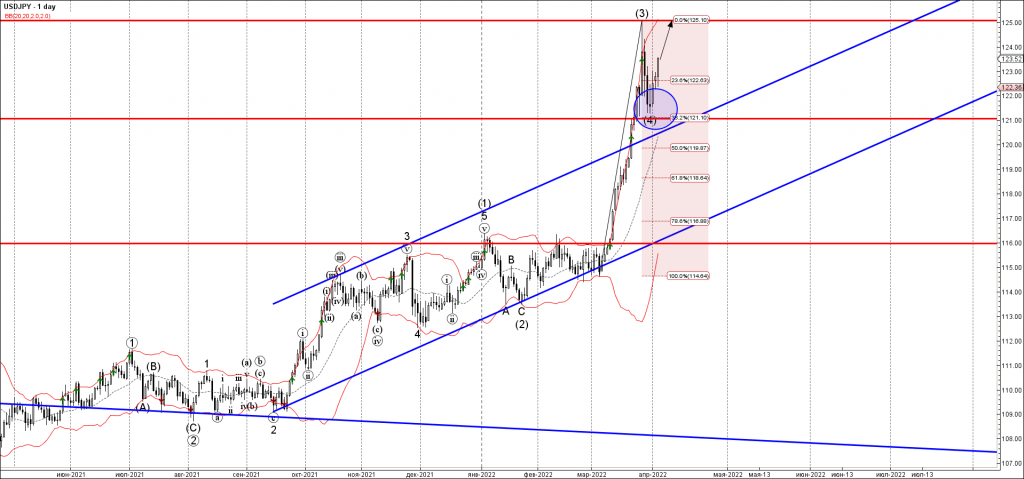
- USDJPY reversed from key support level 121.00
- Likely to rise to resistance level 125.00
USDJPY recently reversed up with the daily Morning Star from the key support level 121.00 intersecting with the 38.2% Fibonacci correction of the upward impulse from March.
The support area near the support level 121.00 was further strengthened by the upper trendline of the daily up channel from last Sepetmber (acting as support after it was broken previously).
USDJPY can be expected to rise further toward the next resistance level 125.00 (top of the previous impulse wave (3) from last month).
Eco Data 4/6/22
[php_everywhere instance="1"]
NZ Dollar Hits 15-Week High
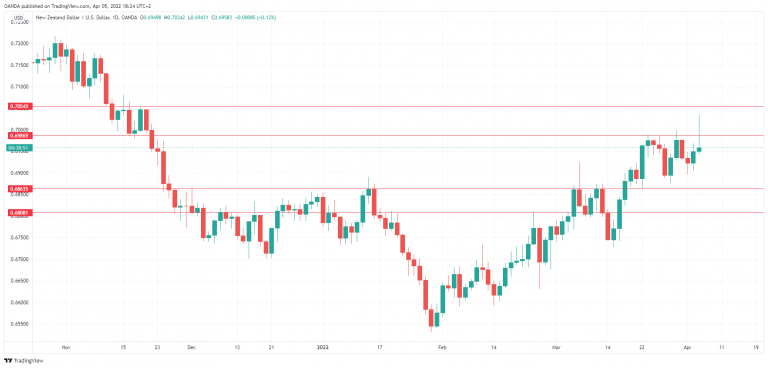
The New Zealand dollar continues to rally and is up 0.82% this week. Earlier in the day, NZD/USD punched above the symbolic 70 line and rose to 0.7034, its highest level since November 2021, before retreating lower.
US Services PMI accelerates
The US Services PMI for March pointed to continuing expansion, with a reading of 58.3. This was shy of the consensus of 58.9 but an improvement from the February reading of 56.5. The services sector has now grown for the 22nd month in a row, a further indication that the US economy is firing on all four cylinders. The PMI report found that businesses continue to be negatively impacted by supply chain problems and inflation. Inventories remain low as businesses continue to struggle to replenish stocks. On a positive note, the report noted that labor shortages have actually eased, as a downturn in Covid cases has led to officials relaxing health restrictions.
The New Zealand dollar is a commodity-based currency, which has been a godsend in a time of risk apprehension and turbulent markets. The surge in commodities has more than compensated for the currency’s sensitivity to risk, and NZD/USD gained 2.35% in March, despite the turmoil over the Russia-Ukraine war. The ANZ Commodity Price index will be released on Wednesday, with the index posting a gain of 3.9% in February, an 11-month high.
We’ll also get a look at NZIER Business Confidence for March, which has struggled. The index fell by 28% in February, as businesses remain pessimistic about the economic outlook.
The RBNZ is never far from the headlines, and investors are eyeing a key policy meeting next week. The central bank has embarked on a rate-hike cycle and has raised rates from a record-low 0.25% to 1.00%. Another increase next week would likely propel the New Zealand dollar to higher ground.
NZD/USD Technical
- NZD/USD broke above resistance at 0.6986 earlier, before retreating. Above, there is resistance at 0.7054
- There is support at 0.6863 and 0.6808
Japanese Yen Dips, Wage Growth Falls
USD/JPY was sailing in calm waters on Tuesday but has gained ground in the North American session. The yen is trading at 123.25, up 0.40% on the day.
Kuroda talks tough about the yen
Similar to what we saw last week, Japanese officials were talking about the yen, expressing concern about currency movements. BOJ Governor Kuroda used strong language in remarks earlier today, noting that “the recent moves in exchange rates seem somewhat rapid”. It’s becoming confusing what to make of Kuroda, as just last week he said that a weak yen was good for Japan’s economy. Perhaps weak means “weak but not too weak”. If today’s comments were meant to prop up the yen, it didn’t work very well as USD/JPY recovered after minimal losses and has punched above the 123 line.
Market participants eyeing the exchange rate will be giving far more weight to further BoJ intervention to protect the yield curve rather than comments from senior officials. With the BoJ stuck on an ultra-loose policy which is unlikely to change given the sluggish economy, I would pick the yen to hit 125 rather than fall to 120 in the short term. US Treasury yields are moving higher and the 10-year yield hit 2.48% earlier today, and a widening US/Japan rate differential will put pressure on the yen.
The weaker yen and soaring energy prices are taking their toll on Japanese consumers. Household Spending in February fell by 2.80% YoY, and real wages, a barometer of consumer purchasing power, were flat on an annual basis, as inflation continues to erode at household income. Prices for food, energy and commodities continue to rise, exacerbated by the ongoing war in Ukraine. Consumers are feeling the pinch as inflation accelerates, and consumer confidence indicators are likely to continue to show a pessimistic outlook about the economy.
USD/JPY Technical
- USD/JPY has support at 121.25 and 119.16
- 123.25 is under pressure resistance. Above there is resistance at 124.67