Sample Category Title
Australian NAB quarterly business confidence dropped to 14, still optimistic growth picture
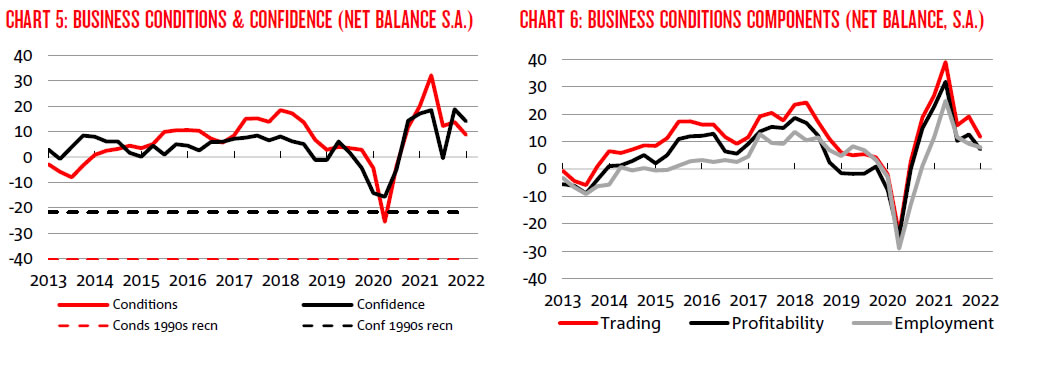
Australia NAB Quarterly business confidence dropped from 19 to 14 in Q1. Current business conditions dropped from 14 to 9. Business conditions for the next three months dropped from 29 to 21. Business conditions for the next 12 months dropped from 36 to 34. trading conditions dropped from 19 to 12. Profitability conditions dropped from 13 to 7. Employment conditions dropped from 9 to 8. Capex plans for the next 12 months dropped from 34 to 33.
"Overall, the survey continues to paint an optimistic picture on growth – including the potential for a pickup in business investment. This comes despite global events and still some disruption from the virus. That said, the challenges for both business and policy makers remain clear with price pressures continuing to build."
EUR/USD Could Resume Decline Below 1.0950
Key Highlights
- EUR/USD started a fresh decline from the 1.1135 region.
- A key bearish trend line is forming with resistance near 1.1050 on the 4-hours chart.
- GBP/USD is consolidating below the 1.3220 resistance zone.
- Gold and oil price might start another increase.
EUR/USD Technical Analysis
The Euro failed to clear the 1.1135 resistance zone against the US Dollar. EUR/USD started a fresh decline below the 1.1100 level.
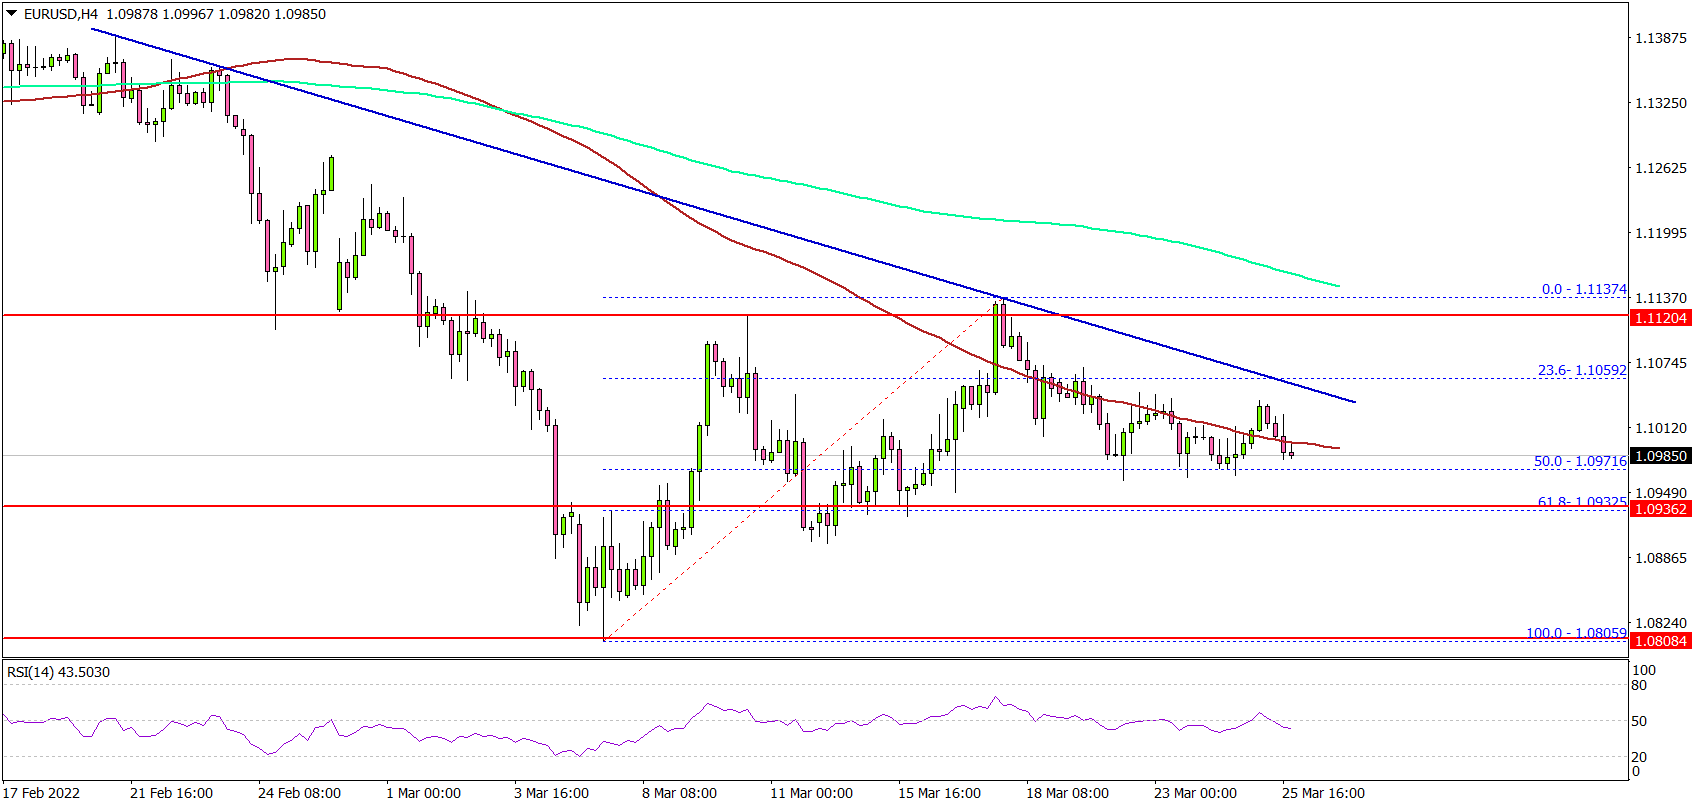
Looking at the 4-hours chart, the pair declined below the 1.1050 support zone and settled below the 200 simple moving average (green, 4-hours).
The pair even tested the 50% Fib retracement level of the upward move from the 1.0805 swing low to 1.1137 high. It moved below 1.1000 and the 100 simple moving average (red, 4-hours).
The main support is near the 1.0930 level. It is near the 61.8% Fib retracement level of the upward move from the 1.0805 swing low to 1.1137 high. A downside break below the 1.0930 level might call for a sharp decline.
The next major support sits near the 1.0880 level, below which the pair could revisit 1.0800. On the upside, an immediate resistance is near the 1.1050 level. The main resistance sits near the 1.1120 level. A clear move above the 1.1120 zone could set the pace for a move towards 1.1350.
Looking at GBP/USD, the pair struggled to stay above the 1.3220 support level, which may now act as a resistance in the near term.
Economic Releases
- Dallas Fed Manufacturing Business Index for March 2022 – Forecast 8, versus 14 previous.
Eco Data 3/28/22
[php_everywhere instance="1"]
Forex and Cryptocurrency Forecast
EUR/USD: A Tangle of Chaos and Paradoxes
The title of the previous EUR/USD review had a question of whether the market has gone crazy. Many analysts agreed that financial markets behaved at least illogically following the March Fed meeting. And at most, it's just absurd.
Despite aggressive tightening of monetary policy by the US regulator, despite a possible slowdown in economic growth in the US due to the actions of the Fed and anti-Russian sanctions, despite the worsening epidemiological situation in China, stock indices are going up. This is especially noticeable in the S&P500, which has added almost 10% since March 15, and it has more than doubled in the two years since the start of the COVID-19 pandemic (more precisely, it has gone up by 108%).
It is difficult to explain what is happening. The classic explanation that sounds most logical is that markets rise on expectations. Investors remembered how quickly stock indices recovered after the shock at the beginning of the pandemic and decided that something similar would happen again soon. That is, now is the time to buy shares before their price has flown to new heights.
As for EUR/USD, this pair behaved illogically as well. Markets were waiting for the difference in the monetary policies of the Fed and the ECB to push it sharply down. However, instead, the pair consolidated in the 1.1000 area, which fully confirmed the neutral forecast of experts and indicators given a week ago.
Apparently, investors believe that a sharp increase in interest rates by the Fed, although it will stop inflation, could create serious problems for the US industry. But Europe may expect good economic growth in Q3 and Q4.
US President Joe Biden said before his visit to the EU last week that he wanted to achieve new sanctions against Russia, including a complete embargo on Russian energy supplies. However, this did not happen, which supported the common European currency. The end of the armed conflict in Ukraine, or at least its transition from a hot phase to a frozen state, can further strengthen the euro. The situation on the debt market, which is much better in Germany, the locomotive of the European economy, than in the United States, also keeps the EUR/USD pair from falling.
At the same time, macro statistics look quite contradictory, introducing additional confusion into the assessment of the current situation. Thus, business activity in the eurozone slowed down from 55.5 to 54.5 this month. But it is still better than the forecast of 53.7 points. And in the US, the composite index of business activity jumped from 55.9 to 58.5 against the forecast of 55.4 points. And this is another paradox: how can this happen when anti-Russian sanctions are putting pressure on the economy on both sides of the Atlantic, and fuel prices are skyrocketing?
Even more confusion and chaos was added by President Putin's decision to sell energy resources for rubles. True, this only applies to countries that are unfriendly to him, but this list includes the United States and all EU countries, as well as Great Britain, Japan, Australia, New Zealand, Canada and Switzerland.
The UN Conference on Trade and Development has already lowered its forecast for US GDP for 2022 from 3.0% to 2.4%. There was also an adjustment for the GDP of the Eurozone, and it turned out to be more significant: the figure was halved, to 1.7%. This seems to be due to the EU's geographic proximity to war-torn Ukraine, as well as Europe's much greater dependence on Russian oil and gas. And now nobody knows how to buy them for rubles. There has never been anything like it in world practice. Therefore, most likely, purchases will take place through intermediary countries, for example, from North Africa or the Middle East, which will lead to another increase in prices.
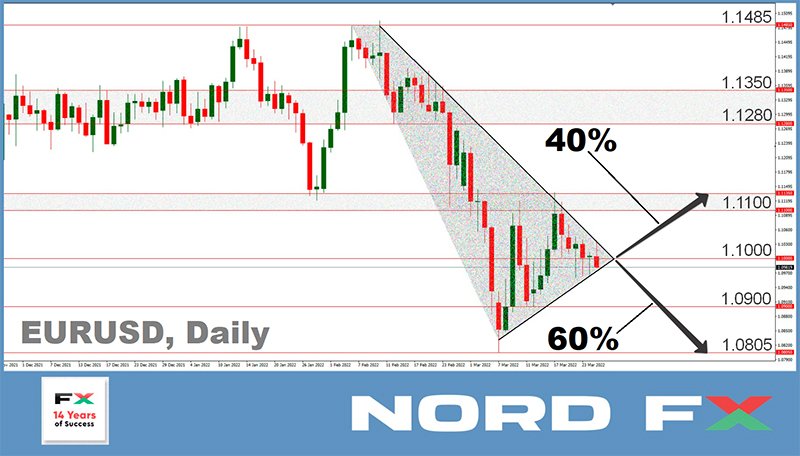
The EUR/USD pair relied on support at 1.0960-1.0965 throughout the past week and ended the trading session at 1.0982. Most analysts (60%) believe that the pair will try to break through the support in the 1.0900 zone and retest the March 07 low at 1.0805. Then, with luck, the 2020 low of 1.0635 and the 2016 low of 1.0325 will follow. The strategic goal is parity at the level of 1.0000. The remaining 40% of experts have opposed such a scenario and vote for a bullish forecast. The nearest target for them is a breakdown of the resistance zone around 1.1050. Then there are zones 1.1100-1.1135, 1.1280-1.1350 and the highs of January 13 and February 10 in the area of 1.1485. At the same time, if we switch from the weekly to the median forecast for the whole of April, then the Pivot Point of the month is in the region of 1.1000, as it is now.
Among the oscillators on D1, the picture is mixed: 35% of them are colored red, 30% are green and the remaining 35% are gray neutral. Trend indicators have 100% on the red side.
The coming week will bring many important economic statistics. The value of the harmonized consumer price index in Germany will become known on Wednesday, March 30, and the volume of retail sales in this country on the next day. Statistics on consumer prices in general for the Eurozone will be published on Friday, April 01. In addition to European statistics, data on employment in the private sector and US GDP will be released on Wednesday, March 30, and in addition to data on business activity (ISM), we are traditionally waiting for a portion of statistics from the US labor market on Friday, including the number of new jobs created outside the agricultural sector (NFP).
GBP/USD: Narrow Channel Amid Uncertainty
As with the euro, GBP/USD bulls and bears are at a complete loss. The reasons are the same: a strange increase in the global risk appetite of investors and the unpredictable situation with energy resources. As a result, the pair has been moving east all week, trapped in a narrow corridor 1.3120-1.3220. The attempt of the bulls to break through in the middle of the five-day period above the horizon of 1.3300 ended in a fiasco, and the pair finished in the center of the named corridor, at the level of 1.3180.
Experts' forecast for the GBP/USD pair for the coming week is as follows: 50% vote for moving north, 25% vote for moving south, the remaining 25% vote for a sideways trend. Among the oscillators on D1 at the time of writing, 70% are looking up, 30% are looking down. For trend indicators, the opposite is true: 80% side with the bears, 20% - with the bulls.
The nearest support is located in the area of 1.3150, then there is a zone of 1.3080-1.3100 and the March 15 (and at the same time 2021-2022) low of 1.3000, followed by the support of 2020. Resistance levels are 1.329-1.3215, then 1.3270-1.3325, 1.3400, 1.3485, 1.3600, 1.3640.
From the events related to the economy of the United Kingdom, we can highlight the speech of the Governor of the Bank of England Andrew Bailey on Monday, March 28, as well as the publication of UK GDP data for the Q4 2022 on Thursday March 31.
USD/JPY: New Anti-Record of the Japanese Currency
The yen fell to a six-year low last week, reaching 119.15 JPY per 1 USD. The record was updated this week: the pair was marked at the level of 122.43 on Friday, March 25.
The Bank of Japan, which does not want to change its ultra-soft monetary policy, is to blame for such a sharp weakening of the yen. The position of the Japanese regulator contrasts sharply with the plans and actions of the Fed, the Bank of England and even the ECB. It still believes that a premature withdrawal of stimulus policies could do more harm than good. Admittedly, there are certain reasons for this. Inflation in the country amounted to only 0.9% in February in annual terms against 0.5% in January. This indicator, although it was the highest since April 2019, is simply insignificant compared to the inflation rate in the UK or in the US, where it reached 7.9%, the highest in the last 39 years.
This dovish position was once again confirmed during the speech of the head of the Bank of Japan Haruhiko Kuroda on March 22, who said that it was too early to discuss the possibility of curtailing the quantitative easing (QE) program, as well as raising the interest rate. Recall that it has been at a negative level for a long time - minus 0.1%.
Three other factors also pushed the yen down and USD/JPY up. The first one is the departure of investors from quiet currency havens to risky assets. The second factor is the Fed Chairman's rhetoric that has become even more hawkish. Speaking on March 21 at the US National Association of Economics and Business, Jerome Powell said that the US Central bank is ready to act even more aggressively if necessary. These words led the markets to think that the Fed could raise interest rates 10-11 times by the end of 2023. Based on such expectations, the yield on 10-year US government bonds rose from 2.146% to 2.282%, reaching a maximum since May 2019. And as we know, the exchange rate of the Japanese currency traditionally correlates with these securities. If the yield on ten-year Treasury bills grows, so does the USD/JPY pair. Which is what we saw last week.
And finally, the third factor is the decision of the Russian leadership to introduce payments for gas in rubles. "We do not quite understand what Russia's intentions are and how it will do it," Finance Minister Shun'ichi Suzuki said at a meeting of the Japanese Parliament on March 23.
Most analysts have been waiting for the end of the bullish rally for the past two weeks, but it still has not happened. On the contrary, the pair USD/JPY has added about 700 points. And now this "majority" of 70-80% has "shrunken" to 50%. Moving from a weekly to a monthly forecast, the number of those voting for the pair's reversal to the south and its fall at least to 117.00-118.00 is still large and amounts to 85%.
Among the indicators on D1, there is complete unanimity after such a powerful breakthrough to the north. 100% of trend indicators and oscillators are looking up, although 35% of the oscillators are already in the overbought zone.
The previous bullish forecast called the 119.80-120.20 zone as the target, which is now far below. It is difficult to point to any new targets in the current situation. Most likely, it is worth focusing on subsequent round levels with a backlash of plus/minus 15-20 points. This approach was confirmed last week, when the pair finished at 122.08. The range of support zones has also become wider due to very strong volatility. These are the zones 120.60-121.40, 119.00-119.40, 118.00-118.35.
The economic calendar of the week can mark Friday, April 1, when the Bank of Japan publishes the Tankan Large Producers Index. This is quite an important indicator that reflects the general business conditions for export-oriented large industrial companies in the country.
CRYPTOCURRENCIES: In Anticipation of a Bull Rally
Investors' risk appetites, which caused the growth of stock indices, have dragged the crypto market along with them. Bitcoin reached the powerful resistance level of $45,000 on the evening of Friday, March 25, for the fifth time since the beginning of the year. it is still an open question whether it will be able to gain a foothold above this level. The previous four attempts failed; the BTC/USD pair rolled back down. However, the rising wedge is clearly visible on its chart, in which each next drawdown becomes smaller and smaller. So the main cryptocurrency fell to $32.945 on January 24, to $34.415 a month later, and it hit the bottom at $37.170 on March 7.
The total market capitalization rose to $2.280 trillion at the peak on March 25, but it also failed to gain a foothold above this significant mark, and at the time of writing the review it is trading at $1.995 trillion ($1.880 trillion a week ago). The Crypto Fear & Greed Index finally moved out of the Extreme Fear zone to the middle of the scale, rising from 25 to 47 points.
Ethereum creator Vitalik Buterin condemned Russia's invasion of Ukraine in an interview with Time. At the same time, in his opinion, this event reminded the crypto community that the purpose of digital assets is to bring real benefits to people, and cryptocurrencies can become a counterbalance to authoritarian governments and undermine the "suffocating control" of technology giants.
Arthur Hayes, co-founder of the BitMEX cryptocurrency exchange, agrees with Buterin, he believes that due to anti-Russian sanctions, bitcoin will gain an advantage over the US dollar, and possibly gold. In his opinion, sanctions against Russia and other countries only encourage their citizens to invest in gold and bitcoin, and not to keep money in dollars. Hayes explained that in a difficult economic situation, citizens have more confidence in assets with a limited supply or offer, considering them a more reliable way to save money.
The BitMEX co-founder believes that Russia's disconnection from the SWIFT international payment system, that is, the isolation of one of the energy leaders, may have long-term negative consequences for the global financial system. Gold will become the dominant asset for some time, as it will be used for international trade in energy and food products. After some time, Central banks will begin to save this precious metal, it will become increasingly difficult for them to make such payments. And this will contribute to the widespread introduction of digital currencies.
Cryptocurrencies need a clear regulation to become really popular. This is the opinion of Matt Hougan, investment director at Bitwise Asset Management. He believes that the current stage in the history of the digital industry is paving the way for growth that will occur this year and will continue next year.
One of the important regulatory steps, according to the top manager of Bitwise, is the recent decree of US President Joe Biden, which could lead to an increase in the price of bitcoin. Recall that this document instructs federal agencies to study the impact of cryptocurrencies on national security and the economy by the end of the year, as well as outline the necessary changes in legislation. In particular, it is supposed to coordinate the work of the SEC (Securities and Exchange Commission) and the CFTC (Commodity Futures Trading Commission), as well as the definition of roles for government agencies - from the State Department to the Department of Commerce.
Bank of America crypto strategist Alkesh Shah also believes regulation of the crypto market will increase confidence and capitalization to a record high. "Ultimately we need some governance and some level of trust, but regulators want to ban when something goes wrong," the expert explained. Therefore, in his opinion, a semi-decentralized system is optimal: blockchains, which are secretly managed by centralized organizations. "I think that $30 trillion for the semi-decentralized part of the cryptocurrency ecosystem is quite real capital," Shah concluded.
If we talk about the foreseeable future, the analytical company Glassnode expects a repeat of the bitcoin high of $69,000. The coin has been trading below the 200-day Simple Moving Average (SMA) For the past 9 weeks but continues to rise. A similar situation was observed during the accumulation period of 2021, which paved the way for a rally in the fourth quarter, when an all-time high was reached. Glassnode data also shows that long-term holders are still hoarding bitcoin and the number of bitcoins on exchanges is declining. The company's specialists interpret this data as the end of the downward correction period.
According to some experts, ethereum is now even slightly better off than bitcoin, as many investors are now buying ETH for BTC. In addition, the community is waiting for the long-awaited update to the ethereum mainnet. The Merge update is approaching rollout following successful testing on the testnet. Before its launch, more than $5.0 billion in ETH tokens had already been withdrawn from circulation as a result of burning. As burning reduces the total supply of ethereum, this can positively affect its price, contributing to the rally of the altcoin.
Analysts at FXStreet suggest that its price could rise by 20% in the current uptrend. But for this to happen, the ETH/USD pair needs to gain a firm foothold above $3,033, which could lead to a perfect bullish breakout for the first time since October 2021.
EUR/JPY Weekly Outlook
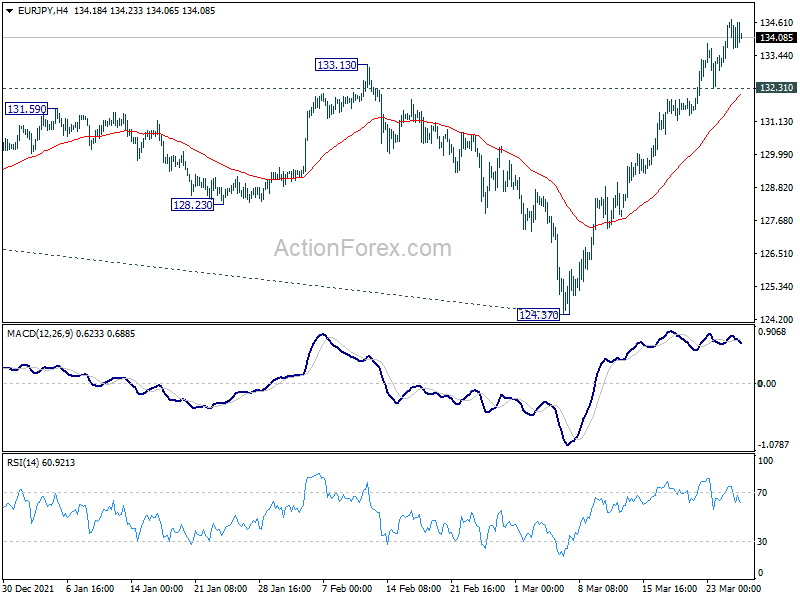
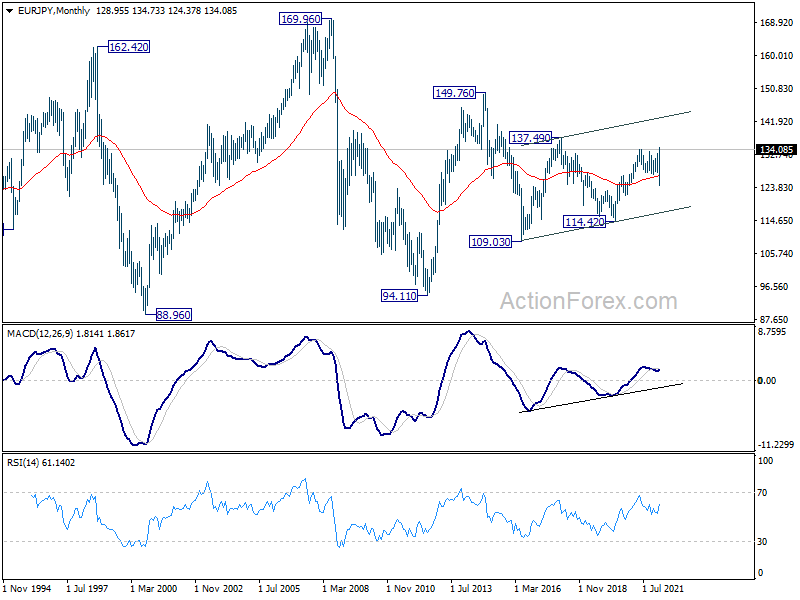
EUR/JPY rose to as high as 134.73 last week, and break of 134.11 resistance suggests resumption of larger up trend. Initial bias stays on the upside this week. Sustained trading above 134.11 will target 136.53 projection level next. On the downside, though, break of 132.31 minor support will delay the bullish case, and turn intraday bias neutral for some consolidations first.
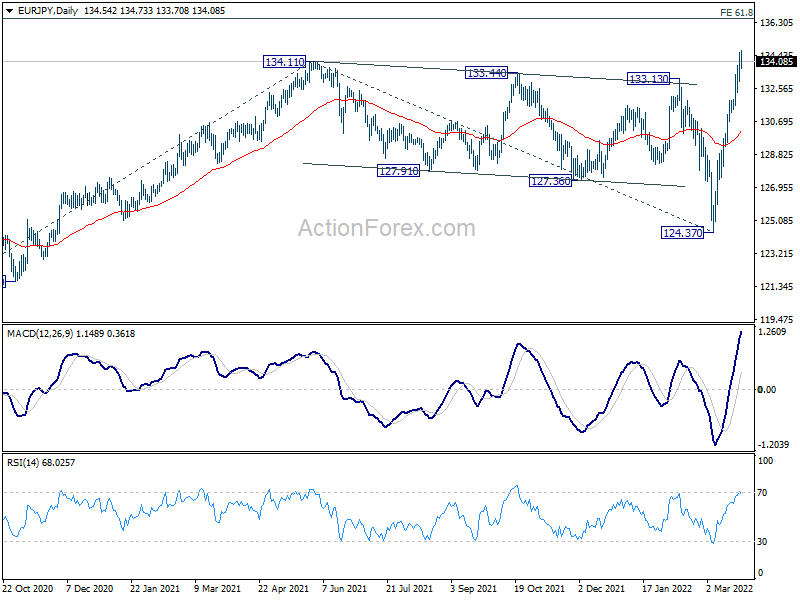
In the bigger picture, up trend from 114.42 (2020 low) is in progress and resuming. Next target is 61.8% projection of 114.42 to 134.11 from 124.37 at 136.53, and then 137.49 (2018 high). In any case, outlook will now remain bullish as long as 124.37 support holds, in case of deep pull back.
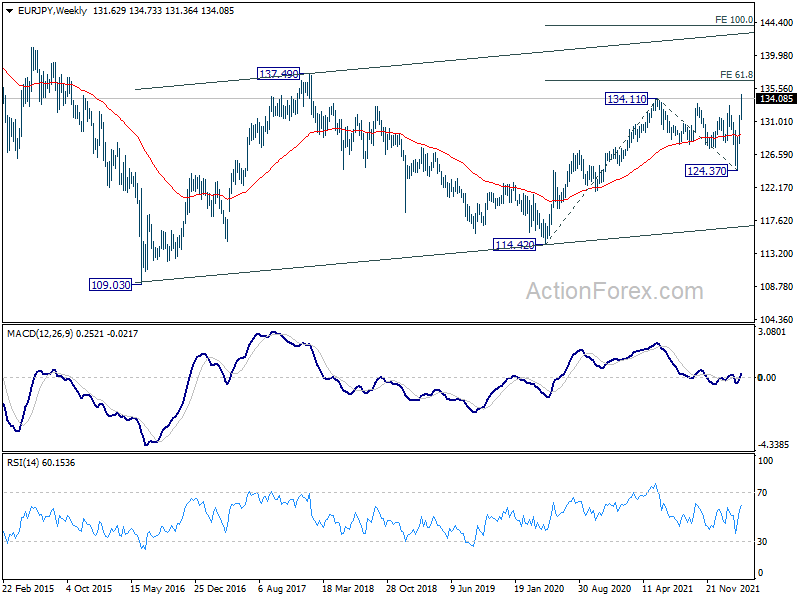
In the long term picture, EUR/JPY is staying in long term sideway pattern, established since 2000. Long term outlook will remain neutral until breakout from the range of 109.03/137.49.
EUR/USD Weekly Outlook
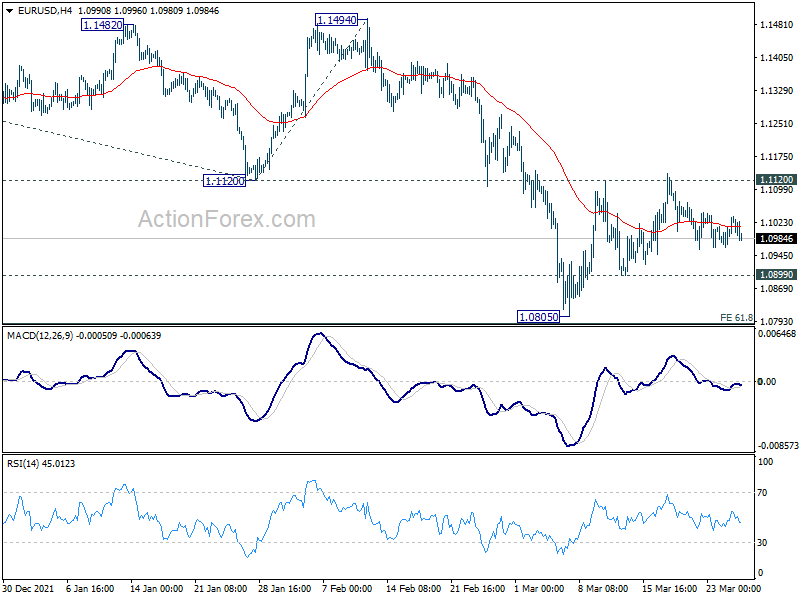
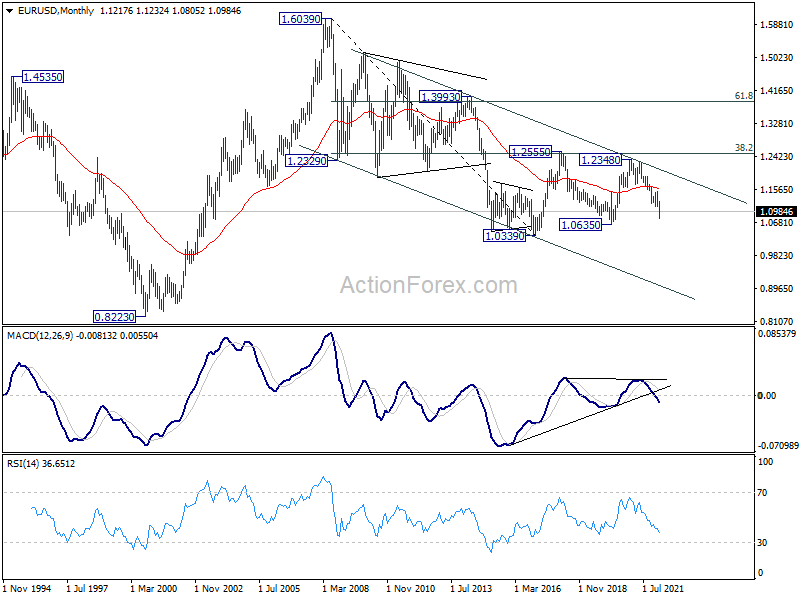
EUR/USD stayed in range trading last week and outlook is unchanged. Further decline is still in favor with 1.1120 support turned resistance intact. On the downside, break of 1.0899 minor support will target 61.8% projection of 1.2265 to 1.1120 from 1.1494 at 1.0786. However, firm break of 1.1120 will confirm short term bottoming at 1.0805. Bias will be back on the upside for 55 day EMA (now at 1.1178) and above.
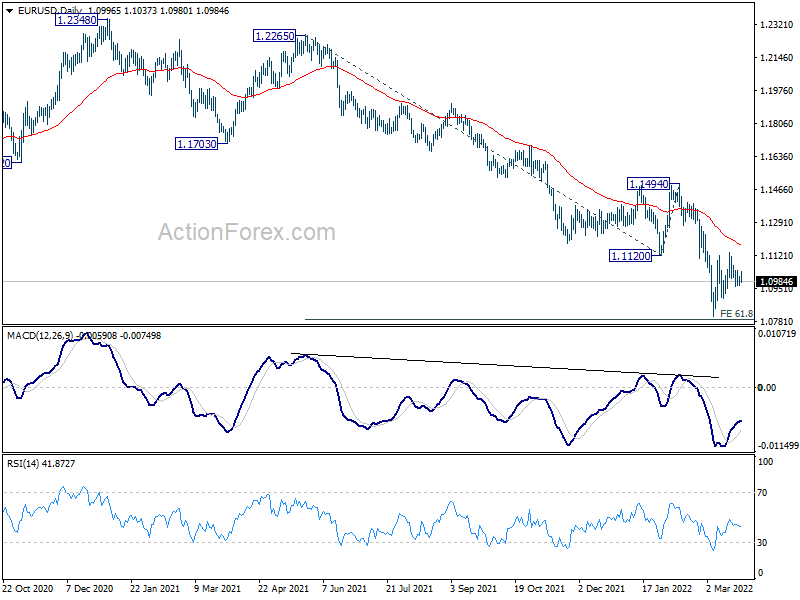
In the bigger picture, the decline from 1.2348 (2021 high) is expected to continue as long as 1.1494 resistance holds. Firm break of 1.0635 (2020 low) will raise the chance of long term down trend resumption and target a retest on 1.0339 (2017 low) next. Nevertheless, break of 1.1494 will maintain medium term neutral outlook, and extending term range trading first.
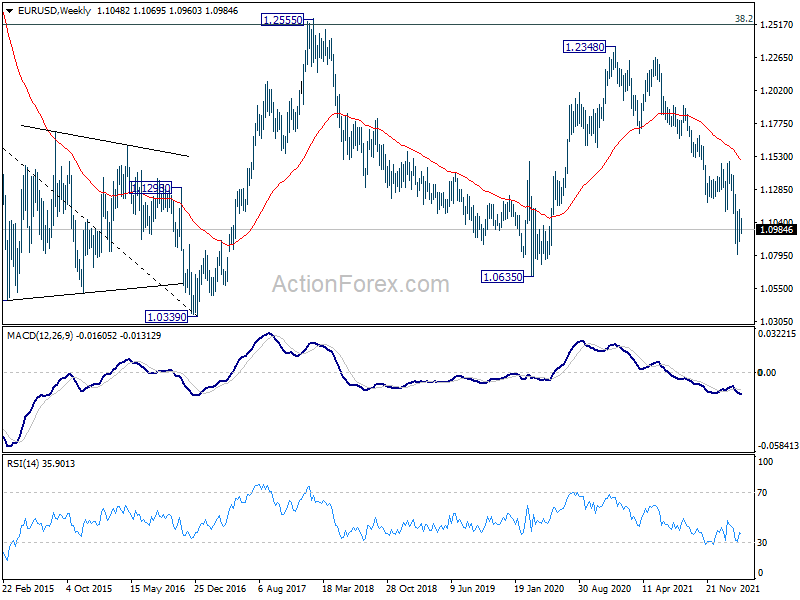
In the long term picture, in any case, as long as 38.2% retracement of 1.6039 (2008 high) to 1.0339 (2017 low) at 1.2516 holds, the down trend from 1.6039 could still resume through 1.0339 low. However, sustained trading above 1.2516 will argue that the long term trend has reversed.
USD/JPY Weekly Outlook
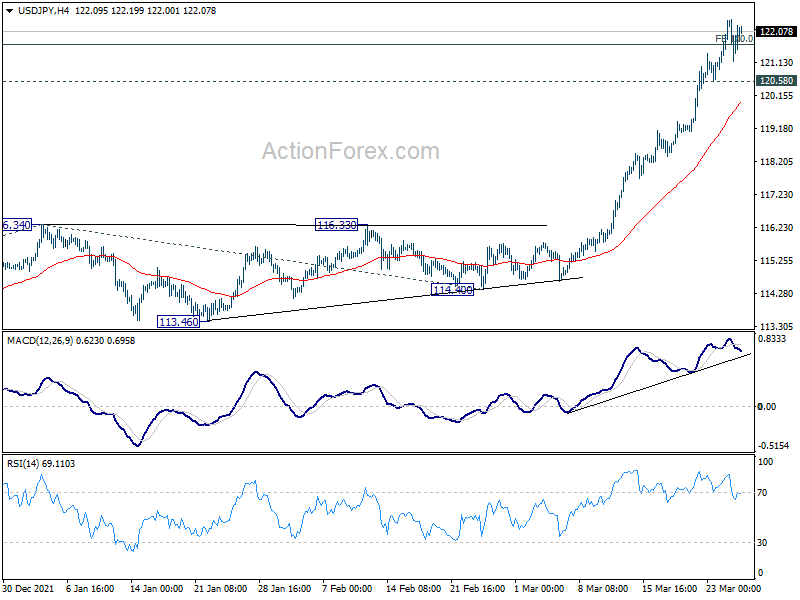
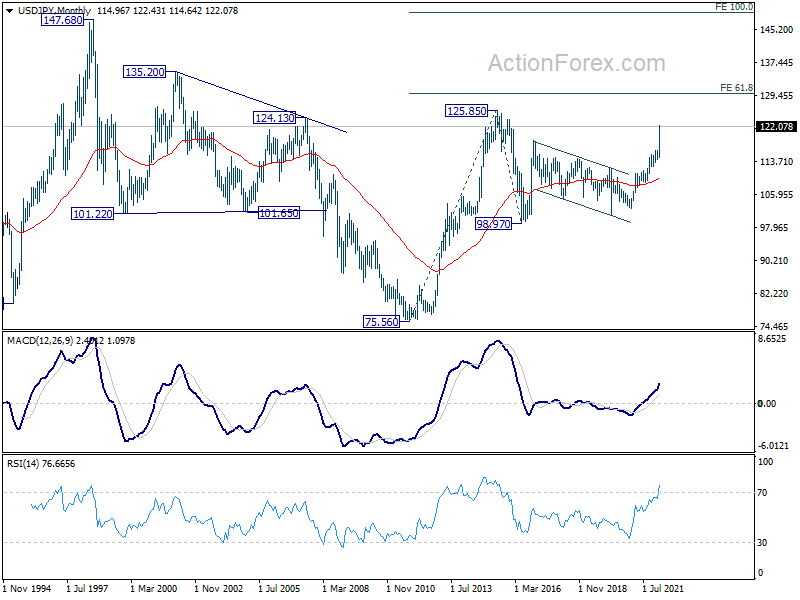
USD/JPY's up trend accelerated further to as high as 122.43 last week, and met 100% projection of 109.11 to 116.34 from 114.40 at 121.63 already. Further rise is expected as long as 120.58 support holds. Sustained trading above 121.63 will pave the way to 161.8% projection at 126.09, which is close to 125.85 long term resistance. On the downside, break of 120.58 minor support will turn intraday bias neutral and bring consolidation first, before staging another rally.
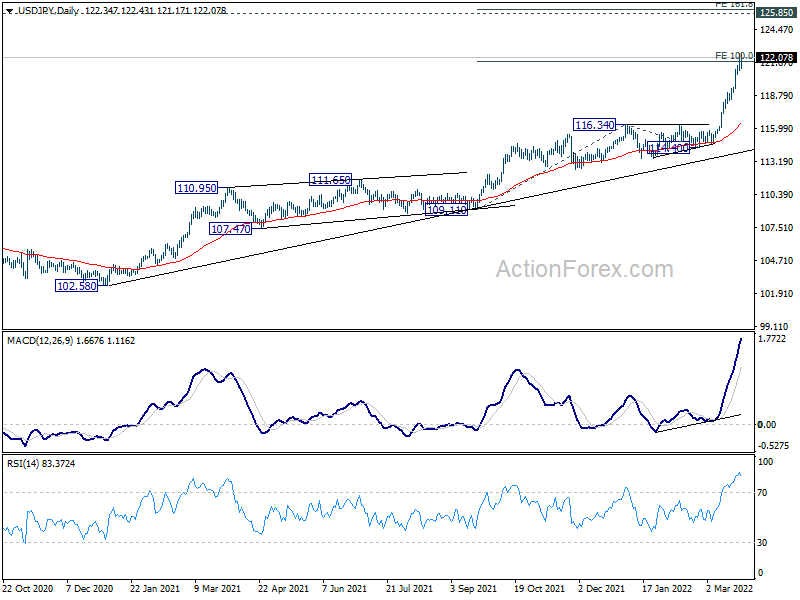
In the bigger picture, up trend from 98.97 (2016 low) in in progress for retesting 125.85 (2015 high). Sustained break there will confirm long term up trend resumption. Next target will be 61.8% projection of 75.56 (2011 low) to 125.85 (2015 high) from 98.97 at 130.04. This will now remain the favored case as long as 116.34 resistance turned support holds.
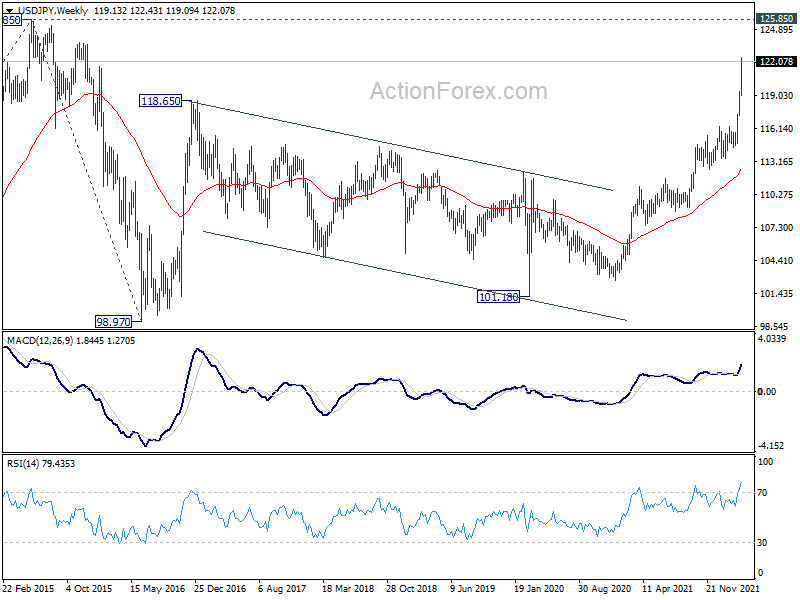
In the long term picture, the rise from 75.56 (2011 low) long term bottom to 125.85 (2015 high) is viewed as an impulsive move, no change in this view. Price actions from 125.85 are seen as a corrective pattern that might have completed at 98.97 already. Firm break of 125.85 will target 61.8% projection of 75.56to 125.85 from 98.97 at 103.04. Next is 100% projection at 149.26, which is close to 147.68 (1998 high).
GBP/USD Weekly Outlook
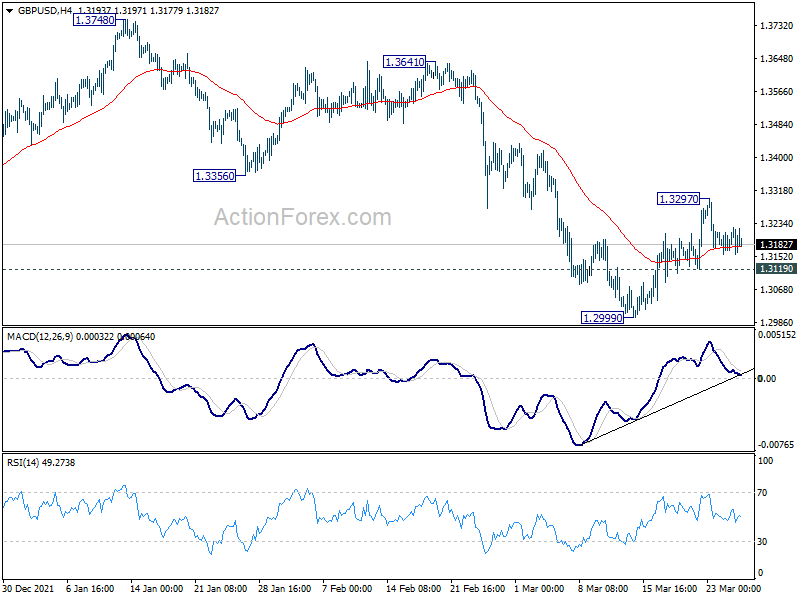
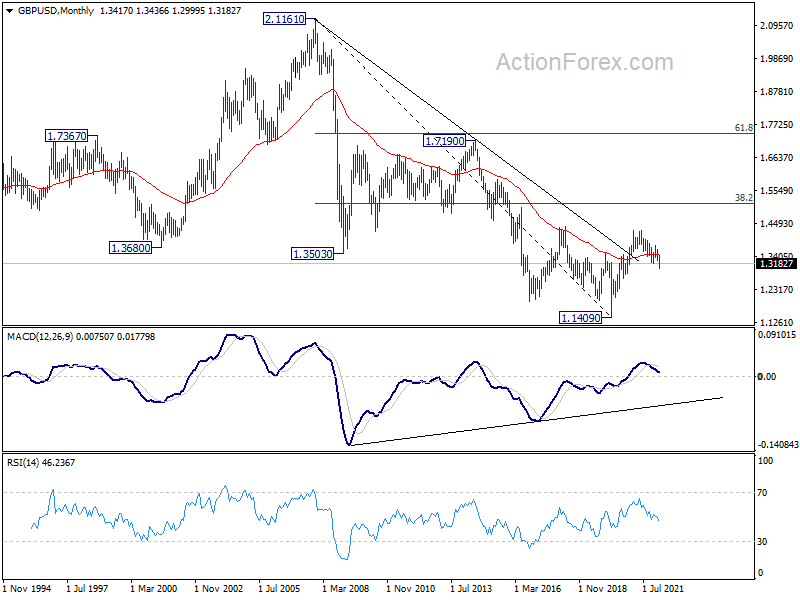
GBP/USD recovered further to 1.3297 last week but retreated since then. Initial bias remains neutral this week first. On the upside, above 1.3297 will resume the rebound from 1.2999 to 55 day EMA (now at 1.3340). On the downside, below 1.3119 minor support will turn bias back to the downside for retesting 1.2999 low. Firm break there will resume larger down trend from 1.4248.
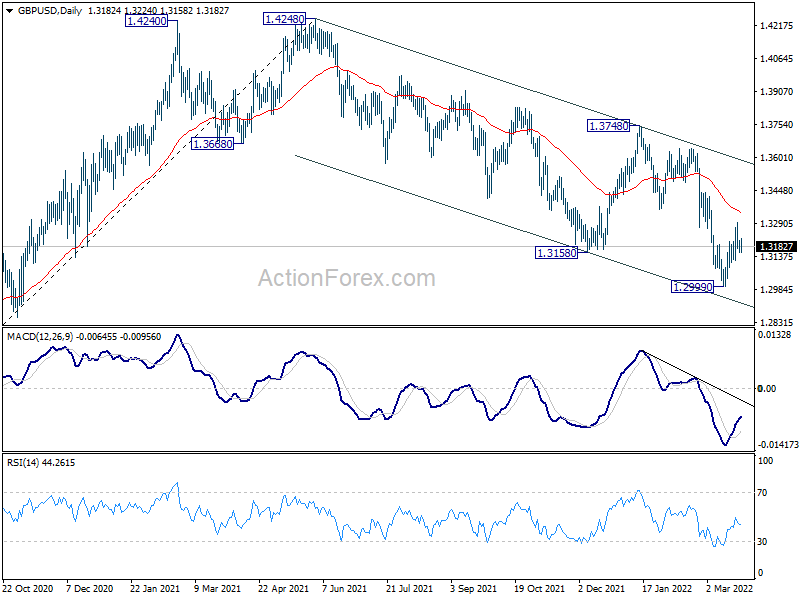
In the bigger picture, current development suggests that the up trend from 1.1409 (2020 low) has completed at 1.4248. Decline from 1.4248 could still be a corrective move, or it could be the start of a long term down trend. In either case, deeper decline would be seen back to 61.8% retracement of 2.1161 to 1.1409 at 1.2493. In any case, break of 1.3748 resistance is needed to indicate medium term bottoming, or outlook will stay bearish.
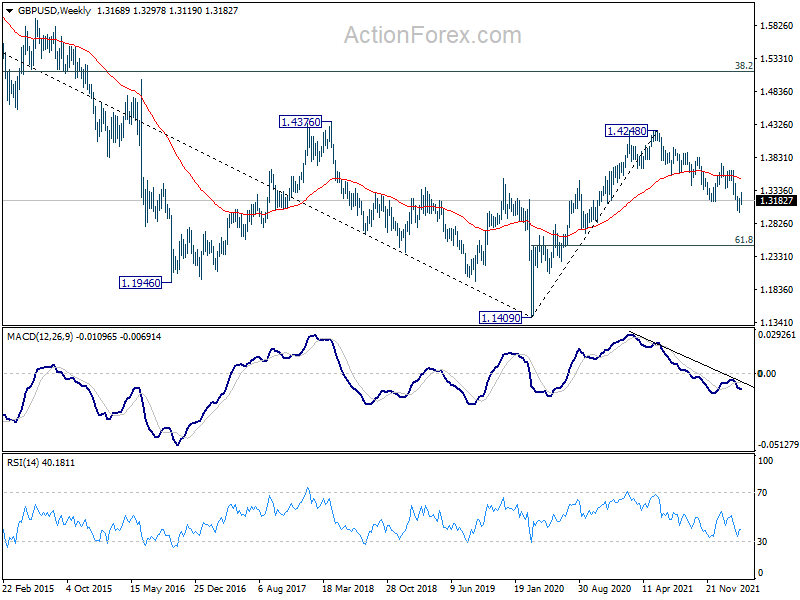
In the longer term picture, rebound from 1.1409 long term bottom could have completed at 1.4248 already, well ahead of 38.2% retracement of 2.1161 to 1.1409 at 1.5134. The development argues that price actions from 1.1409 are developing into a corrective pattern only. That is, long term bearishness is retained for resuming the downside from 2.1161 (2007 high) at a later stage.
USD/CHF Weekly Outlook
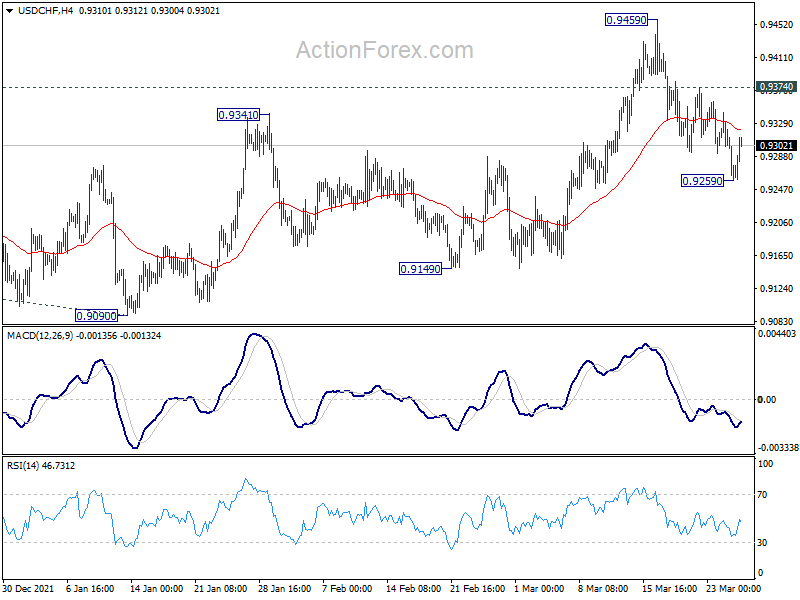
USD/CHF gyrated lower to 0.9259 last week but recovered. Initial bias is turned neutral this week first. On the upside, break of 0.9374 minor resistance will suggest that the pull back from 0.9459 has completed. Support from 55 day EMA will also retain near term bullishness. Intraday bias will be back on the upside for 0.9459 first. Break will resume the rise from 0.8756 to 61.8% projection of 0.8756 to 0.9471 from 0.9090 at 0.9532. However, sustained break of 55 day EMA (now at 0.9256) will target 0.9149 support.
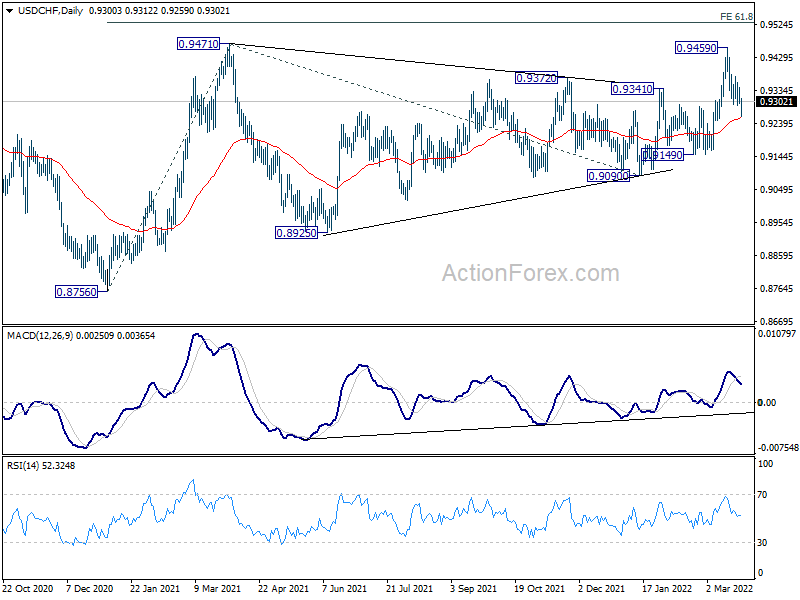
In the bigger picture, medium term outlook will be neutral at best as long as 0.9471 resistance holds. Larger down trend could still extend through 0.8756 (2021 low). However, firm break of 0.9471 will argue that whole down trend form 1.0342 (2016 high), has completed with waves down to 0.8756. A medium term up trend should be set up to target 1.0237/0342 resistance zone.
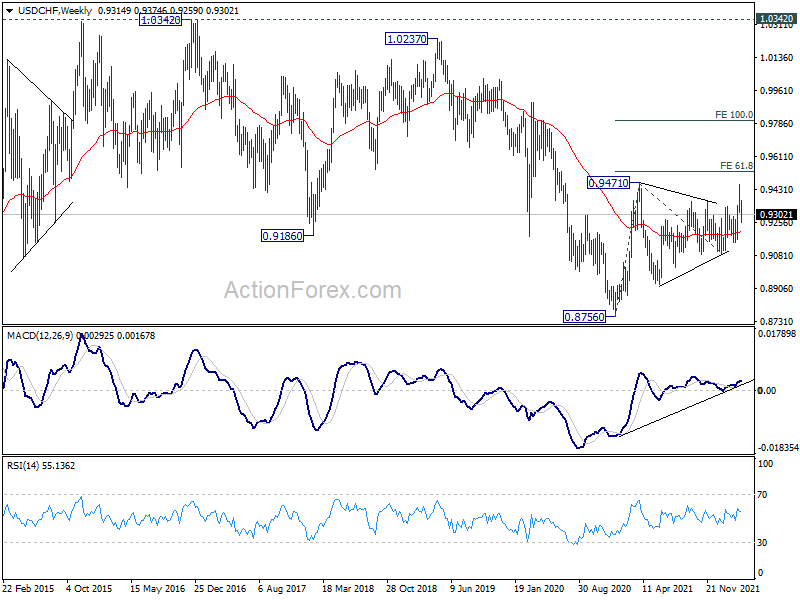
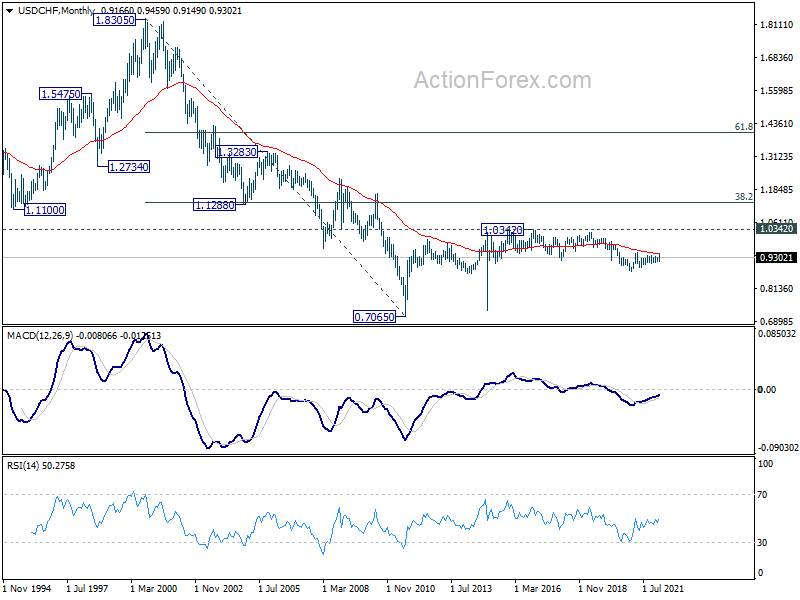
In the long term picture, price actions from 0.7065 (2011 low) are currently seen as developing into a long term corrective pattern, at least until a firm break of 1.0342 resistance.
AUD/USD Weekly Outlook
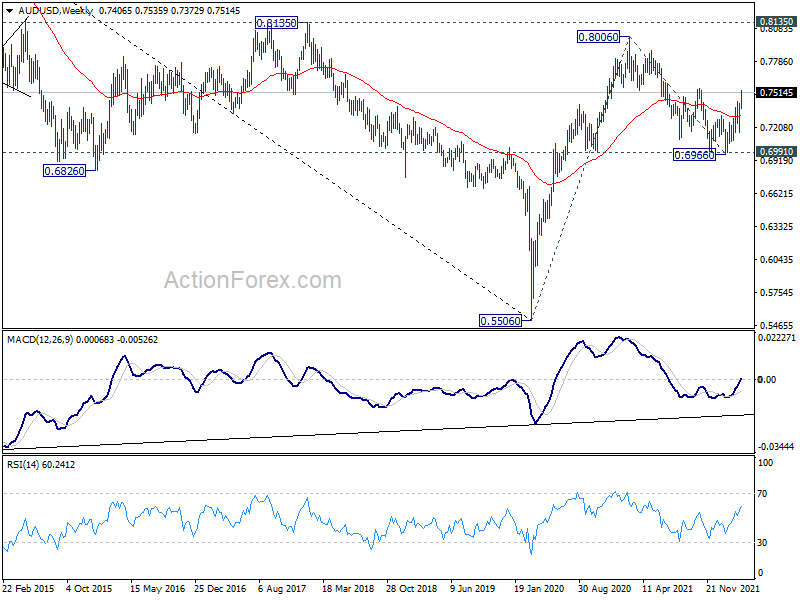
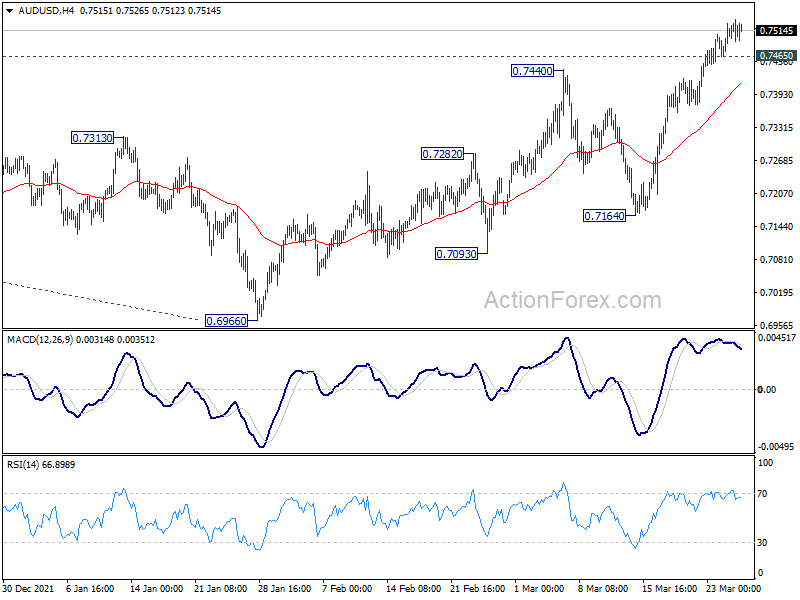
AUD/USD's break of 0.7440 resistance last week confirmed resumption of rise from 0.6966. Initial bias remains on the upside this week for 0.7555 resistance. Decisive break there should confirm that whole corrective decline from 0.8006 has completed at 0.6966. Further rise should then be seen back to retest 0.8005. On the downside, below 0.7465 minor support will turn intraday bias neutral and bring consolidations first.
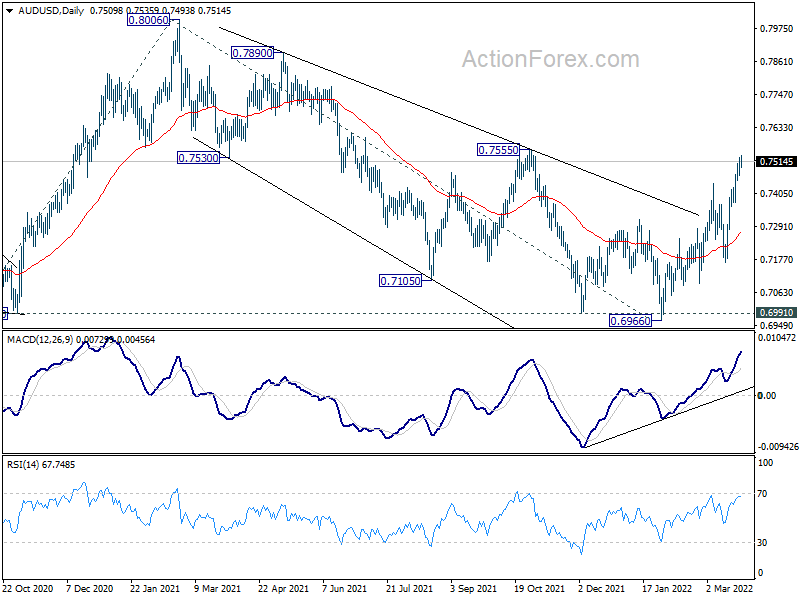
In the bigger picture, correction from 0.8006 could have completed at 0.6966, after drawing support from 0.6991. That is, up trend from 0.5506 (2020 low) might be ready to resume. Firm break of 0.8006 will target 61.8% projection of 0.5506 to 0.8006 from 0.6966 at 0.8511 next. This will remain the favored case as long as 0.7164 support holds.
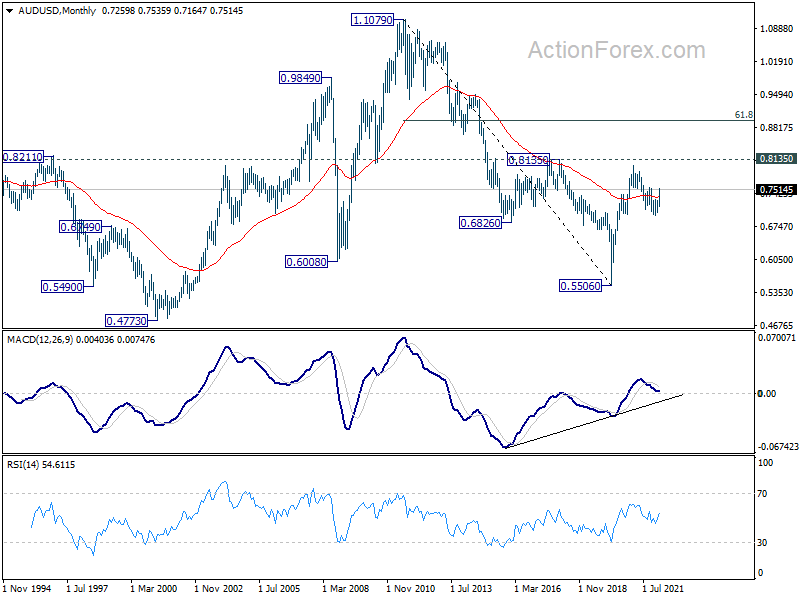
In the longer term picture, focus remains on 0.8135 structural resistance. Decisive break there will argue that rise from 0.5506 is developing into a long term up trend that reverses whole down trend from 1.1079 (2011 high). However, rejection by 0.8135 will keep long term outlook neutral at best.