Sample Category Title
Selling Focus Turns to Sterling as Yen Digests Losses
Yen remains the weakest one today, but there is some short covering as global benchmark treasury yields also retreat. Selling focus is turning Sterling instead. For now, Aussie and Dollar are the strongest one for the day, followed by Canadian. Euro is mixed, helped by recovery against Swiss Franc. Gold recovers quickly after initial dip and it's struggling to get a clear direction. WTI oil is trying to defend 110 handle.
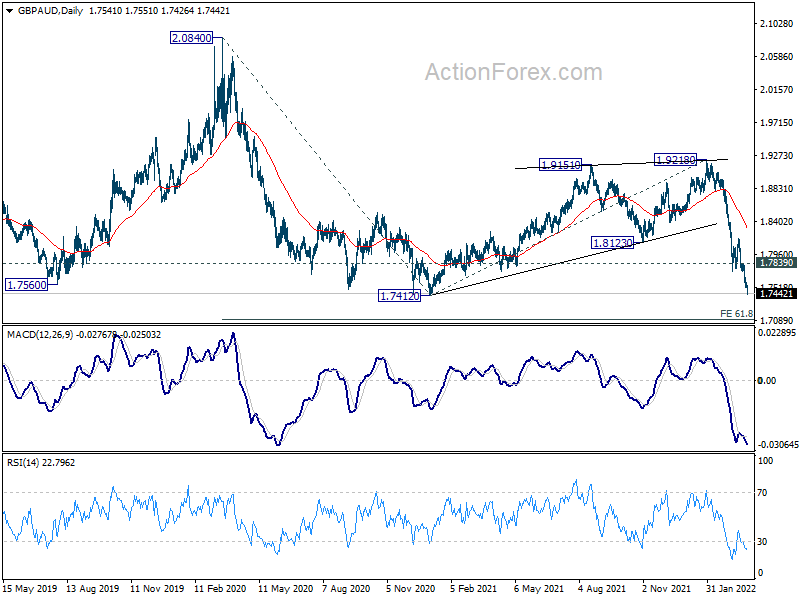
Technically, GBP/AUD is breaking through 1.7412 low to resume the down trend from 2.0840 (2020 high). Near term outlook will stay bearish as long as 1.7839 resistance holds. Next medium term target is 61.8% projection of 2.0840 to 1.7412 from 1.9218 at 1.7099. GBP/USD might also trying to catch up and break through 1.2999 near term support to resume larger down trend.
In Europe, at the time of writing, FTSE is up 0.43%. DAX is up 1.41%. CAC is up 1.34%. Germany 10-year yield is down -0.019. Earlier in Asia, Nikkei dropped -0.73%. Hong Kong HSI rose 1.31%. China Shanghai SSE rose 0.07%. Singapore Strait Times rose 0.54%. Japan 10-year JGB yield rose 0.0196 to 0.260.
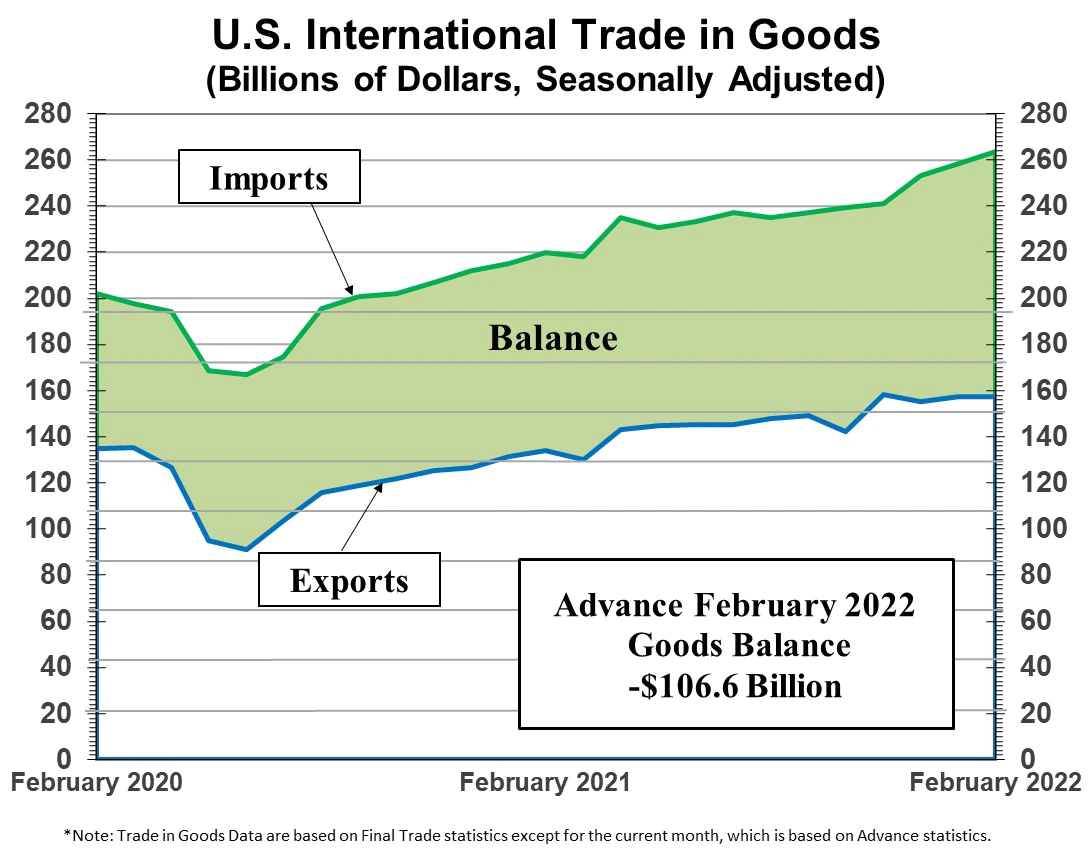
US exports rose $1.9B in Feb, imports rose $0.9B
US exports of goods rose USD 1.9B to USD 157.2B in February. Imports of goods rose USD 0.9B to USD 263.7B. Trade deficit narrowed from USD -107.6B to USD -106.6B, still larger than expectation of USD -106.0B.
Wholesales inventories rose 2.1% mom to USD 814.7B. Retail inventories rose 1.1% mom to USD 665.6B.
BoE Bailey: Takes time to properly assessment join experience of COVID and Ukraine
BoE Governor Andrew Bailey said today, the forward guidance language was "very cautious" because of the high uncertainty. And it will take time to properly assessment how the "joint experience of COVID and Ukraine invasion causes world economy to emerge into new steady state."
"Liquidity conditions have deteriorated in many commodity markets, margining costs have risen, which is of course a reflection of much higher volatility and risks in these markets," he said. "We can't take resilience, in particular in that part of the market, for granted. There's a strong need to work together on this," he said.
Bailey added that he's starting to see evidence of an economic slowdown in business and consumer surveys. "We expect that this pressure on demand will weigh down on domestically generated inflation, other things equal at the moment," he said.
GBP/USD Mid-Day Outlook
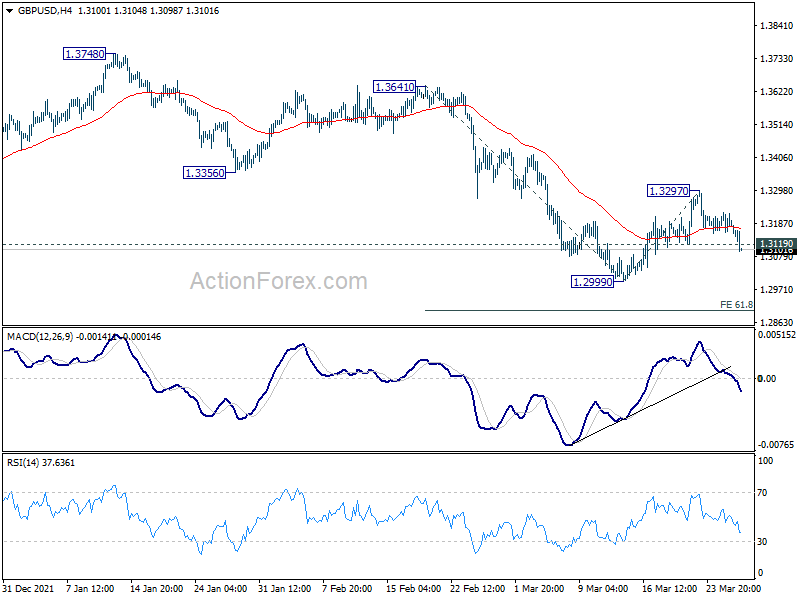
Daily Pivots: (S1) 1.3153; (P) 1.3189; (R1) 1.3219; More...
GBP/USD's break of 1.3119 minor support argues that corrective rebound from 1.2999 has completed at 1.3297 already. Failure to hit 55 day EMA keeps near term outlook bearish. Intraday bias is back on the downside for 1.2999 low first. Break will resume larger down trend from 1.4248. Next near term target is 61.8% projection of 1.3641 to 1.2999 from 1.3297 at 1.2900, and then 100% projection at 1.2655. For now, risk will stay on the downside as long as 1.3297 resistance holds, in case of recovery.
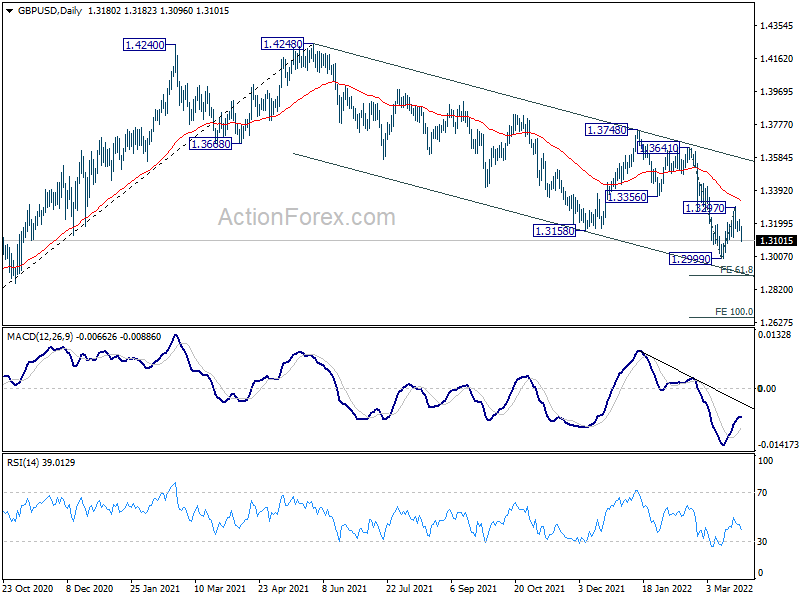
In the bigger picture, current development suggests that the up trend from 1.1409 (2020 low) has completed at 1.4248. Decline from 1.4248 could still be a corrective move, or it could be the start of a long term down trend. In either case, deeper decline would be seen back to 61.8% retracement of 2.1161 to 1.1409 at 1.2493. In any case, break of 1.3748 resistance is needed to indicate medium term bottoming, or outlook will stay bearish.
Economic Indicators Update
| GMT | Ccy | Events | Actual | Forecast | Previous | Revised |
|---|---|---|---|---|---|---|
| 12:30 | USD | Goods Trade Balance (USD) Feb P | -106.6B | -106.0B | -107.6B | |
| 12:30 | USD | Wholesale Inventories Feb P | 2.10% | 1.30% | 0.80% | 1.10% |
US exports rose $1.9B in Feb, imports rose $0.9B
US exports of goods rose USD 1.9B to USD 157.2B in February. Imports of goods rose USD 0.9B to USD 263.7B. Trade deficit narrowed from USD -107.6B to USD -106.6B, still larger than expectation of USD -106.0B.
Wholesales inventories rose 2.1% mom to USD 814.7B. Retail inventories rose 1.1% mom to USD 665.6B.
BoE Bailey: Takes time to properly assessment join experience of COVID and Ukraine
BoE Governor Andrew Bailey said today, the forward guidance language was "very cautious" because of the high uncertainty. And it will take time to properly assessment how the "joint experience of COVID and Ukraine invasion causes world economy to emerge into new steady state."
"Liquidity conditions have deteriorated in many commodity markets, margining costs have risen, which is of course a reflection of much higher volatility and risks in these markets," he said. "We can't take resilience, in particular in that part of the market, for granted. There's a strong need to work together on this," he said.
Bailey added that he's starting to see evidence of an economic slowdown in business and consumer surveys. "We expect that this pressure on demand will weigh down on domestically generated inflation, other things equal at the moment," he said.
Euro Looking for Direction
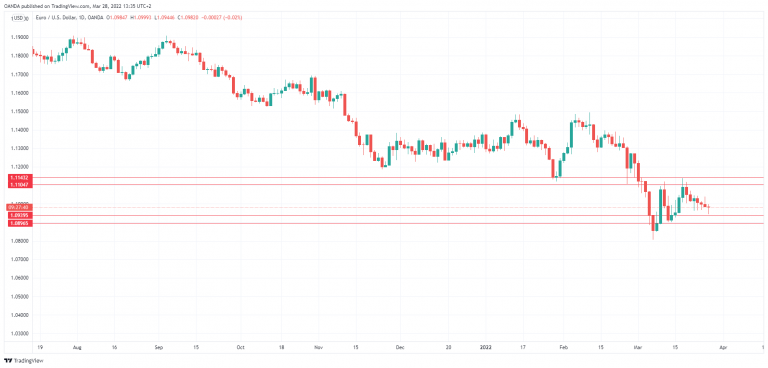
The euro has shown limited movement over the past several days and that trend has continued on Monday. EUR/USD is almost unchanged, trading at 1.0985 in the European session. There are no eurozone releases on the calendar today and only minor events out of the US, so I expect an uneventful Monday session.
The Ukraine conflict continues to be a key driver for the euro, with the war on the doorstep of Western Europe. There haven’t been many developments of late, with a stalemate between the Russian and Ukraine armies. The biggest headline over the weekend was President Biden’s (mis)statement that President Putin “cannot remain in power”. US officials quickly explained that Biden didn’t mean that Putin should be removed from office, but that Putin shouldn’t exercise power over his neighbors. It sounds like damage control to me, as Biden’s comments were quite clear, but in the extremely unstable situation in Ukraine, US officials don’t want to escalate matters with Putin. This is a relief for the Europeans, who are on board with severe sanctions against Moscow but are at the same time dependent on Russian energy imports.
The war in Ukraine is weighing on the German economy, the bellwether of the eurozone. Germany’s recovery is in danger of being derailed by the surge in energy prices and possible disruptions in natural gas imports from Russia. The emergence from Covid has resulted in supply chain disruptions, which will only worsen with a war being waged in Europe.
Germany could report a contraction in growth in the first quarter, which would mean that technically the country is in recession since Q4 showed negative growth. If Germany continues to post weak numbers, it will weigh on the eurozone and on the euro, which has declined by 2% in the month of March.
EUR/USD Technical
- EUR/USD has support at 1.0940, followed by 1.0896
- There is resistance at 1.1049, followed by 1.1114
Dollar Yen – Up, Up and Away
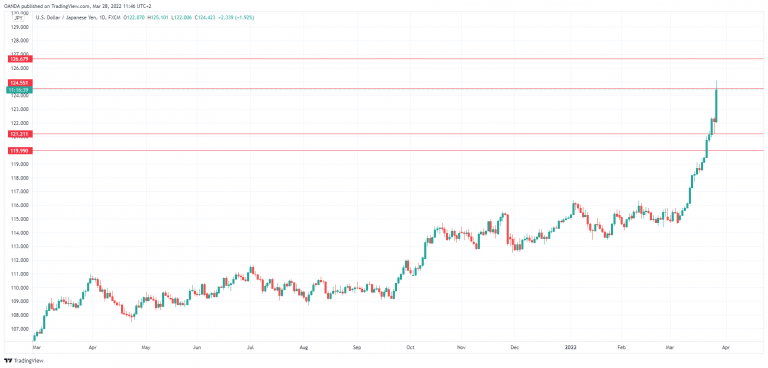
The misery continues for the Japanese yen, which has plummeted at the start of the week USD/JPY is trading at 124.62 in the European session, up 2.06%.
BoJ move sinks yen
USD/JPY broke above the symbolic 125 line in the European session, as the yen is seeing all red today. The yen was hammered after the BoJ rushed to defend its yield target today, making two offers to buy unlimited 10-year JGBs at 0.25%, an implicit ceiling for 10-year bonds. The Bank’s unusual move to intervene in order to maintain its ultra-accommodative policy has pushed the yen to its lowest level since August 2015.
The yen has plunged in March, with USD/JPY soaring 8.45%. The weakening currency is adding to inflation by making imports more expensive, which could make it difficult for the BoJ to continue trying to cap yields at ultra-low rates. The yen has been walloped by the US/Japan rate differential, which continues to widen. US Treasury yields remain on an upswing, with the 10-year yield inching higher to 2.50% today.
Aside from the Bank of Japan, another key player which is monitoring the yen’s movement is the Ministry of Finance (MOF). On Friday, in an attempt to shore up support for the woozy yen, Minister of Finance Suzuki said that “Exchange-rate stability is important, and sharp volatility is undesirable.” No doubt that Suzuki is in a sour mood on Monday, with the yen extending its slide against the dollar.
Will the MOF become more forceful if the yen continues to weaken? The MOF is uncomfortable with the yen’s sharp downswing, and a BofA note on Monday said that if the yen falls below 125, the ministry could warn speculators against intervention. If USD/JPY breaks above 1.30, there is the possibility of actual intervention by the MOF, according to BofA.
USD/JPY Technical
- 124.55 is a weak resistance line. Above, there is resistance at 1.2666
- There is support at 121.21 and 119.98
EURUSD Continues to Slide as Positive Hopes Fade
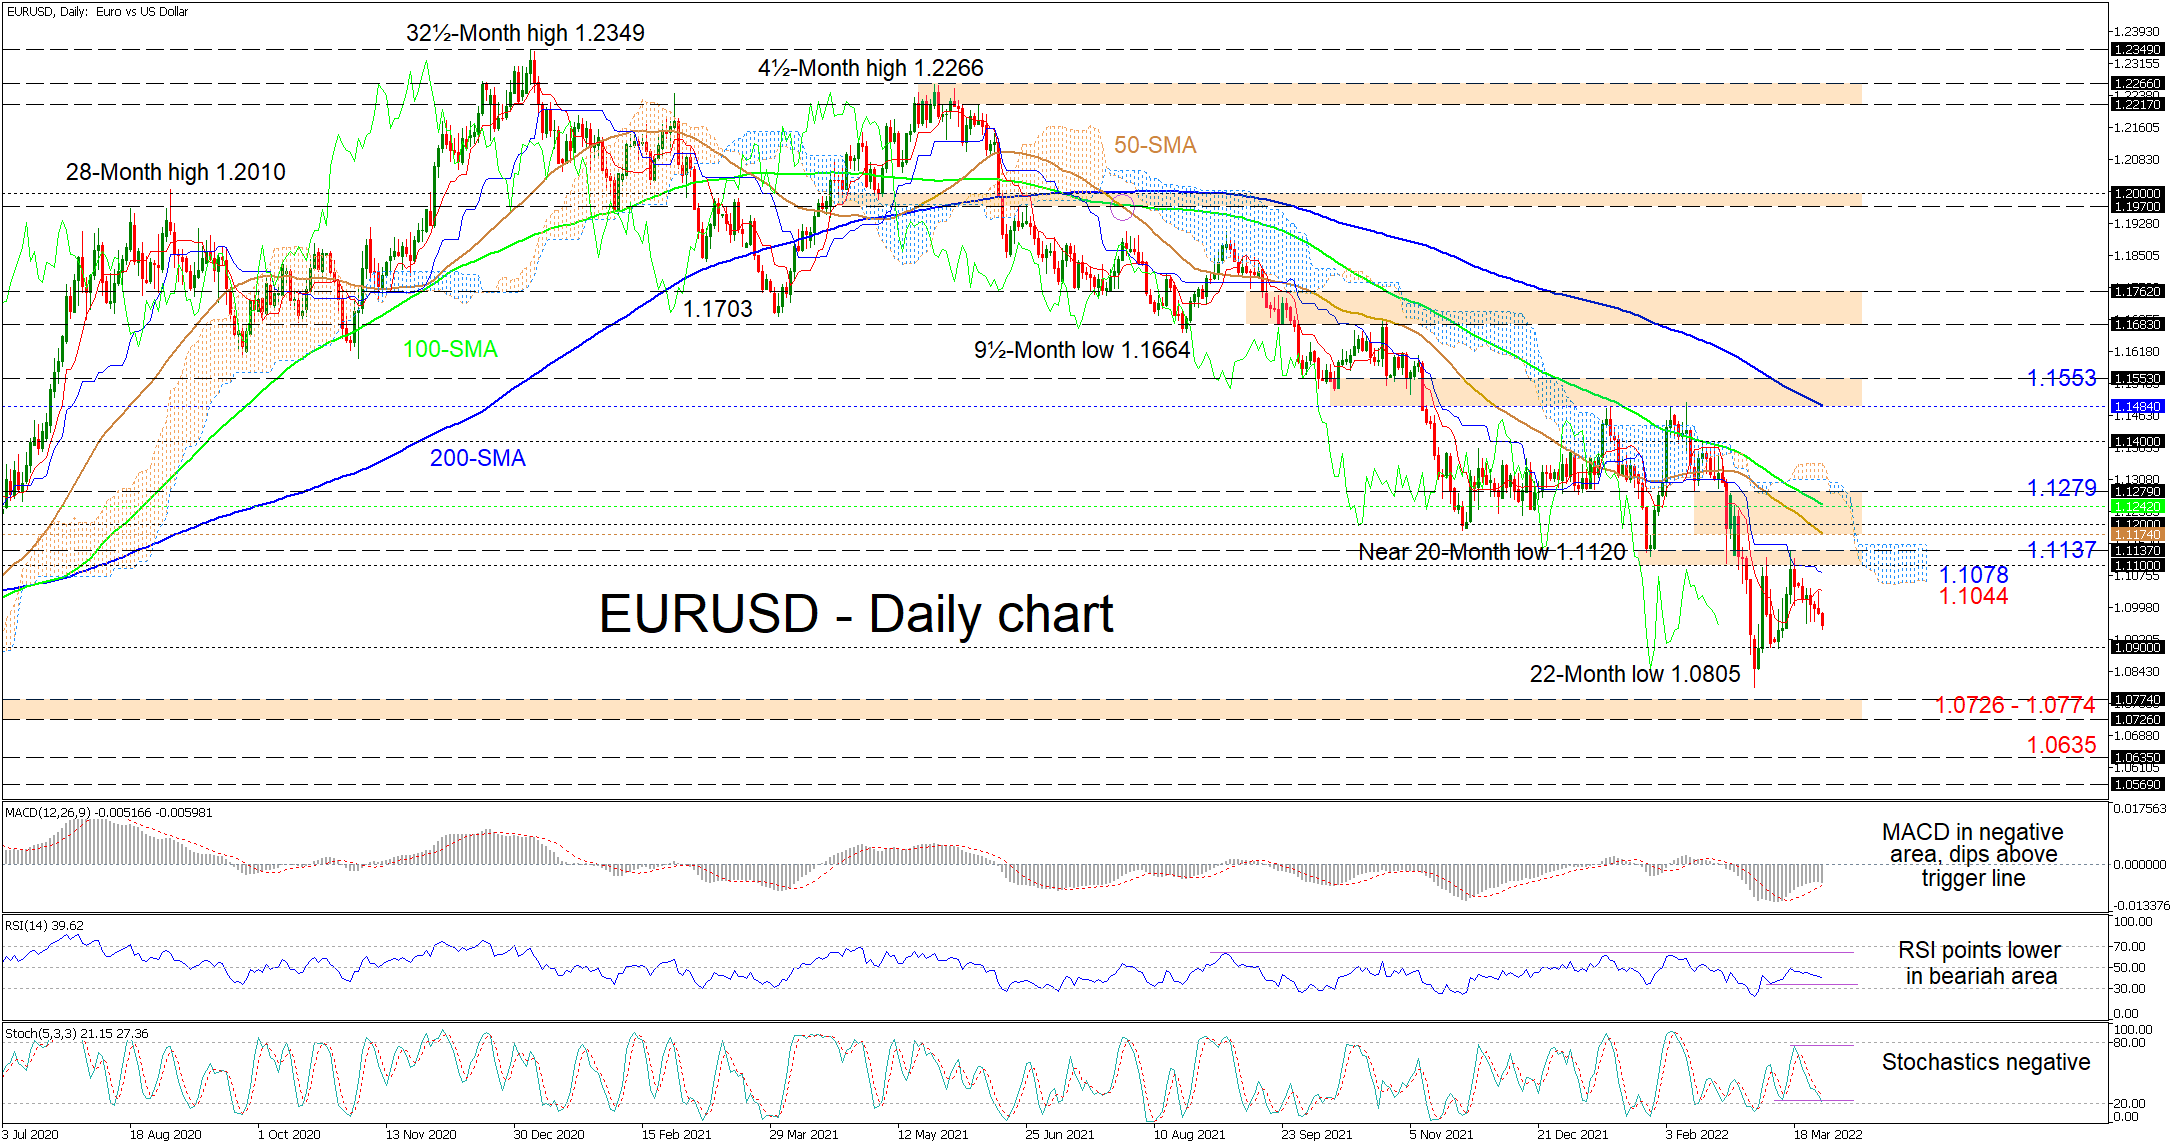
EURUSD is edging lower toward the 1.0900 handle after bullish developments in the pair were unable to overpower the 1.1100 hurdle. The falling simple moving averages (SMAs) are endorsing the 10-month bearish trend from the May 2021 high of 1.2266.
Currently, the Ichimoku lines indicate that bearish forces remain active, while the short-term oscillators are skewed to the downside. The MACD is south of the zero threshold and looks set to return beneath its red trigger line, while the RSI is gliding towards the 30 oversold level. Moreover, the negatively charged stochastic oscillator is promoting additional downward price action in the pair.
To the downside, preliminary support could occur at the 1.0900 border, while moving lower, the 22-month trough of 1.0805 may contest sellers’ efforts to uphold the decline. For sellers to resuscitate the broader descent, downward pressures would need to not only crush the key 1.0805 trough, but subsequently the 1.0726-1.0774 support barrier, linked to the April until mid-May 2020 area of lows. Should the pair surrender extra ground, the critical 1.0635 bottom resulting from the March 2020 collapse could then draw traders’ attention.
On the other hand, if buying interest picks up, resistance could originate from the nearby Ichimoku lines at 1.1044 and 1.1078, along with the neighbouring 1.1100-1.1137 resistance band. Nonetheless, should buyers’ triumph, a successive tough region of resistance from the 50-day SMA at 1.1174 until the 1.1279 obstacle may prove to be more challenging for buyers to surpass. However, successfully piloting above the cloud, the bulls could then jump towards the 1.1400 boundary before eyeing the 1.1484-1.1553 resistance border.
Summarizing, EURUSD is sustaining a sturdy bearish bias below the 1.1100-1.1137 hurdle and the SMAs. A dive beyond the 1.0726-1.0774 barricade is likely to renew strong negative tendencies. Meanwhile, a climb in the price extending past the 1.1279 barrier may inject some optimism in the pair.
EUR/USD Looks Down for a Bottom: Elliott Wave analysis
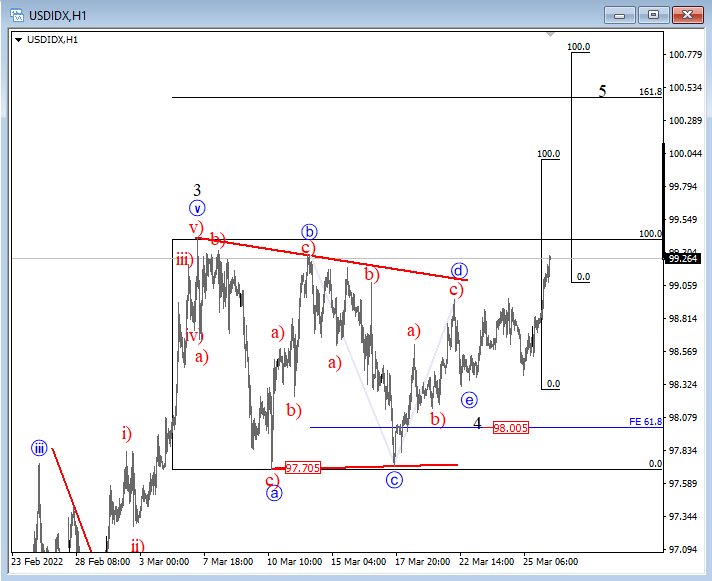
Welcome back to the new trading week, which may stay volatile due to the situation in Ukraine, EU inflation data, and US jobs figures on Friday. We see 10 years US notes still trading lower, now in the fifth wave of five so DXY can be finally breaking out from a triangle and towards 100. Keep in mind that this move on DXY can be final within a higher degree uptrend, so at some point, the price will stop at resistance, ideally later this week.
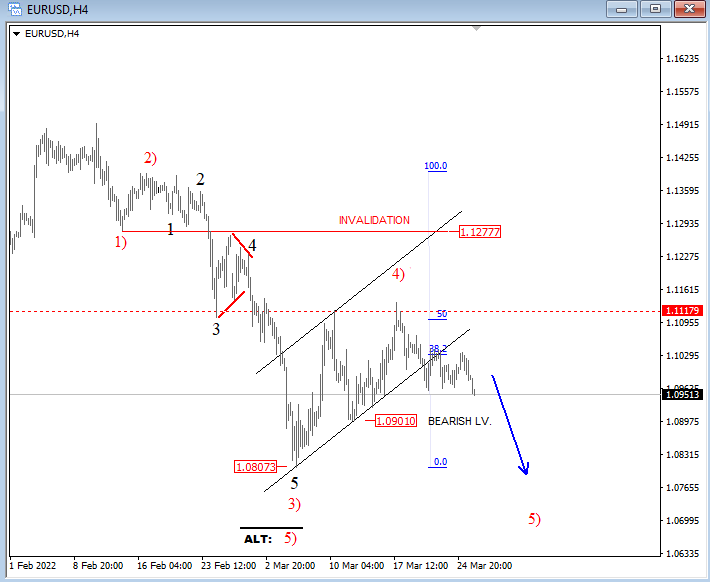
EURUSD found some support recently, but move from the low is not in five waves for now, so we are still tracking a higher degree downtrend, currently with a pause that appears like a wave 4), now zigzag back to 50% Fib resistance from where price came down at the end of the week. So ideally, the pair is making now another turn south for wave 5).
EUR/USD 4h Elliott Wave analysis
Bitcoin and Other Altcoins Rise as Momentum Accelerates
The price of crude oil continued rising on Monday morning as the war of words between the US and Russia escalated during the weekend. In a speech, Joe Biden said that Putin cannot remain in power and called him a butcher. The State Department walked back the statement and said that it was not calling for a regime change in the country. It said that such a decision will only be made by Russians. Still, analysts believe that such claims will only worsen the situation in Ukraine, which will lead to lower oil supplies. Some oil traders have already started halting purchases from the Russian market.
American futures tilted higher even as risks to the market continued. The main indices have already risen in the past two straight weeks and are approaching their year-to-date highs. This performance comes even as the Federal Reserve embraces a more hawkish tone. In statements last week, analysts at Citigroup and Bank of America warned that they see the bank delivering several 50 basis points this week. Some of the top stocks to watch this week will be Xpeng, Micron, Jefferies, Five Below, and Walgreens Boots Alliance.
Cryptocurrency prices continued rising during the weekend as demand from investors kept rising. Bitcoin rose above $47,000 while Ethereum jumped above $3,000. The total market cap of all digital currencies rose to over $2.2 trillion. There are some catalysts for this price action. For example, there are signs that many Russians are turning to Bitcoin. Last Friday, there were also rumours that the Russian economy will start accepting BTC for natural gas and oil purchases.
XBRUSD
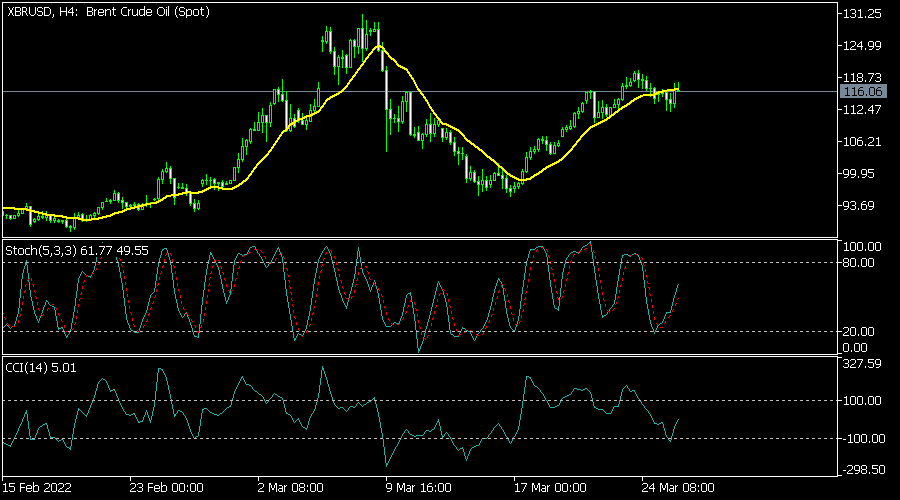
The XBRUSD pair maintained a bullish trend on Monday morning as concerns about demand remained. It is trading at 116, which is sharply higher than where it started the year. It has moved above the 25-day and 50-day moving averages while the MACD and the Stochastic Oscillator have pointed upwards. Therefore, the pair will likely keep rising as bulls target the next key resistance level at 120.
EURUSD
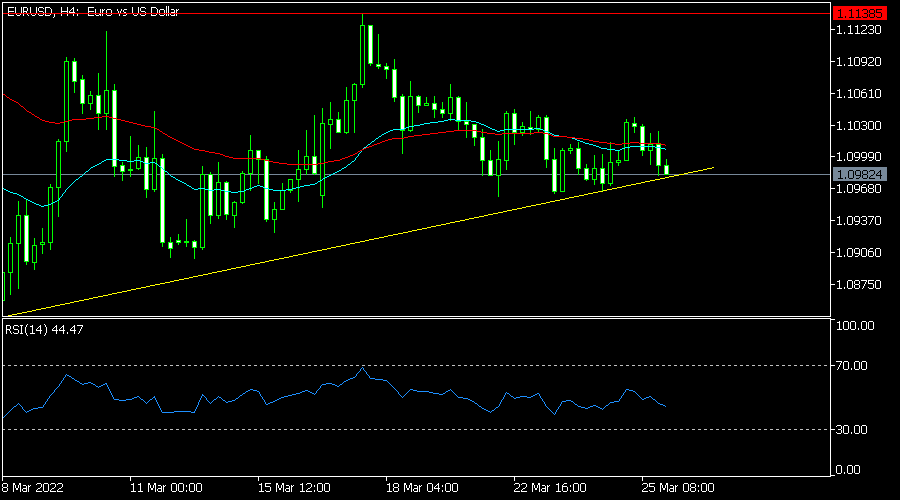
The EURUSD pair has been under intense pressure in the past few days. It is trading at 1.0982, which is significantly lower than this month’s high of 1.1138. The pair has moved slightly below the 25-day moving average and is along the ascending trendline shown in yellow. The Relative Strength Index (RSI) has pointed lower. Therefore, the pair will likely keep falling as bears target the next key support at 1.0900.
USDCAD
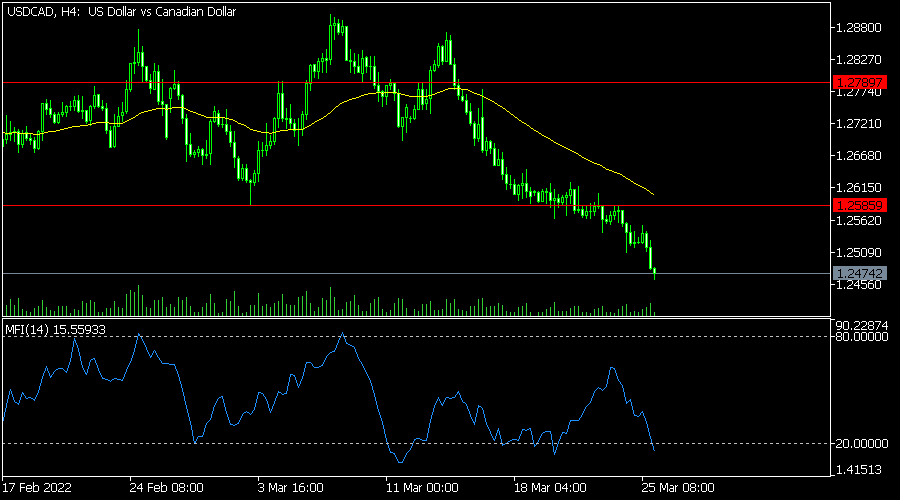
The USDCAD pair has been in a strong bearish trend and is now trading at the lowest level since January 18. The pair has moved below the 25-day and 50-day moving averages while the Relative Strength Index (RSI) has moved below the oversold level. It has also moved below the important support level at 1.2585, which was the lowest level in March. Therefore, the pair will likely maintain the bearish momentum on Monday.
Are Bond Markets Predicting a Recession?
Investing in 2022 has proved to be challenging for many investors. Inflation has been skyrocketing in almost all developed and emerging economies, central banks are racing towards raising interest rates, China continues to impose lockdowns to contain surging Covid-19 cases, and no one seems to know when and how the Ukrainian conflict will end. These factors combined have led to sharp selloffs in equity and bond markets, wiping trillions of dollars from the financial system.
However, many investors have seen the steep selloff in stocks as an opportunity to buy again at reasonable valuations. After falling by almost 15% from its record high, the S&P 500 is now up 10.4% from its February trough and the Nasdaq Composite has rallied 12.6% over the past two trading weeks.
Investors are now challenged by the latest inversion of part of the US yield curve for the first time since 2006. The 5-year / 30-year Treasury yield spread has turned negative following the inversion of the 5-year / 10-year spread earlier this month. Futures markets are now anticipating an increase in interest rates by 218 basis points by year-end, suggesting nine 25-basis point rate hikes over the next six FOMC policy meetings. That alone explains a lot of the movement in US bond yields as the shorter end reflects the trajectory in monetary policy, and the longer end reflects economic growth expectations.
When yield curves begin to invert, it's usually a signal that investors have lost their confidence in the economic recovery story and are now preparing for a slowdown or possibly a recession over the next few quarters. The only reason you’d buy a long-term bond at a lower yield than a short-term one was if you thought yields were going to fall.
However, the US Federal Reserve has also played an essential role in the shape of the curve as it bought massive amounts of Treasuries during its bond-buying program, keeping the longer end of the curve under pressure. The 3-month / 10-year yield curve is at its steepest level since early 2017, and this tells us a different story.
The shape of the curve is likely to change when the Federal Reserve begins shrinking its balance sheet, so we could likely see steepening of the curve all over again in the upcoming months. While the risks of a recession have increased, it's not likely to be a 2022 story but rather one that takes place in 2023 or 2024. So, investors need to ignore the noise in bond markets and keep focusing on economic fundamentals and corporate earnings which so far remain solid.
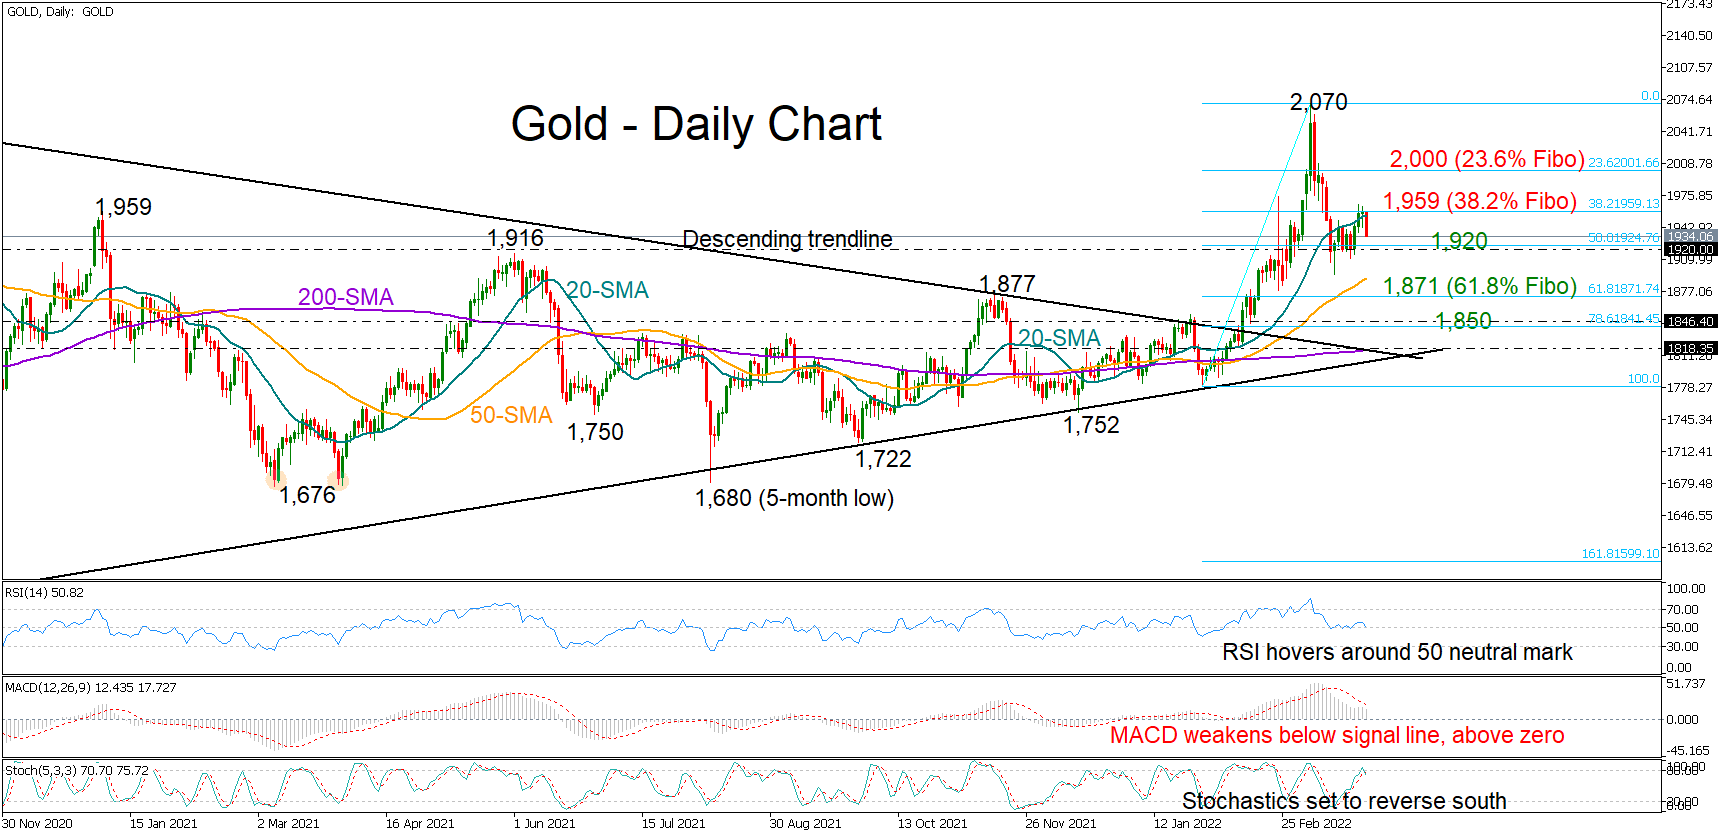
Gold Loses Steam Near 1,959 Resistance; Bias Neutral-to-Bearish
Gold could not find enough buyers to cross the key resistance of 1,959 last week, with the price tumbling to 1,933 early on Monday.
The short-term bias is looking neutral-to-bearish as the RSI keeps fluctuating around its 50 neutral mark. The Stochastics have lost steam and are set for a downside reversal, while the MACD remains negatively charged between its signal and zero lines.
If sellers manage to breach the 1,920 floor, where the 50% Fibonacci retracement of the 1,780 – 2,070 upleg happens to be, the spotlight will immediately turn to the 50-day simple moving average (SMA) at 1,890. The 61.8% Fibonacci level of 1,870 is within breathing distance and may delay any declines towards the 1,850 handle.
Alternatively, for bullion to touch the crucial 2,000 number, upside pressures will need to successfully speed above the 1,959 bar. If the aforementioned levels prove easy to overcome, the bulls may attempt to print fresh record highs above the 2020 top of 2,079. In this case, the 161.8% Fibonacci extension of the latest downfall at 2,178 will be closely watched.
Summarizing, the precious yellow metal has started the week on the back foot, but the nearby support of 1,920 is still intact. A clear close below that base could strengthen selling tendencies.