Sample Category Title
AUD/USD Daily Report
Daily Pivots: (S1) 0.7459; (P) 0.7500; (R1) 0.7532; More...
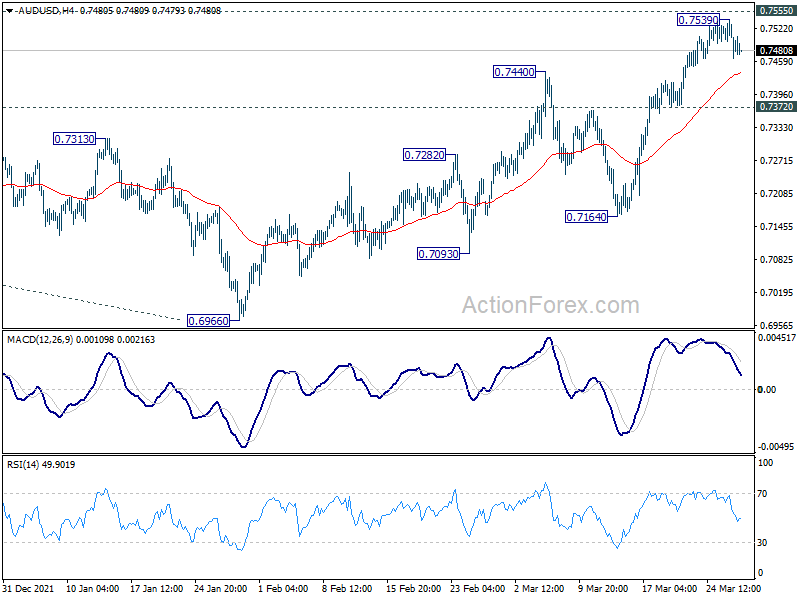
A temporary top is formed at 0.7539 in AUD/USD, just ahead of 0.7555 resistance. Intraday bias is turned neutral for some consolidations first. Further rise is expected as long as 0.7372 minor support holds. On the upside, decisive break of 0.7555 should confirm that whole corrective decline from 0.8006 has completed at 0.6966. Further rise should then be seen back to retest 0.8005. However, break of 0.7372 will dampen this bullish view and turn bias back to the downside for 0.7164 support instead.
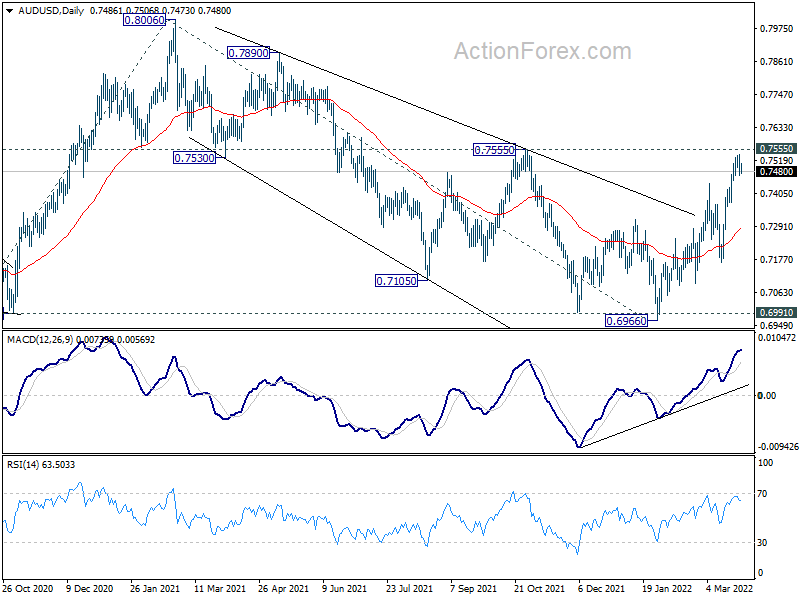
In the bigger picture, correction from 0.8006 could have completed at 0.6966, after drawing support from 0.6991. That is, up trend from 0.5506 (2020 low) might be ready to resume. Firm break of 0.8006 will target 61.8% projection of 0.5506 to 0.8006 from 0.6966 at 0.8511 next. This will remain the favored case as long as 0.7164 support holds.
Yen Consolidates as BoJ Defends Yield Cap, Dollar Firming Up
The forex markets are digesting recent moves in mixed Asian session today. Yen is recovering slightly but remains the worst performer for the week. BoJ is still trying hard to defend the 0.25% 10-year JGB yield cap. On the other hand, Euro and Dollar are the strongest ones so far. The greenback is trying to recover against commodity currencies and there is some near term upside prospect. Euro, on the other hand, is helped by its recovery against the Pound and Swiss Franc.
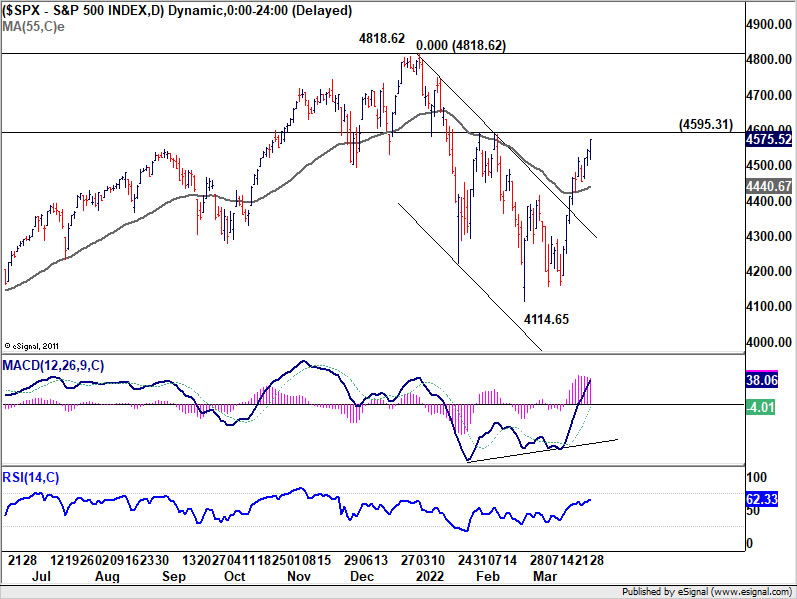
Technically, some attention will be paid to S&P 500 today after yesterday's 0.71% rise. SPX should be testing 4959.31 resistance soon. The correction from 4818.62 should have completed with three waves down to 4114.65 already. Firm break of 4595.31 will solidify upside momentum for retest of 4818.62 high. Such development could give Yen some renewed pressure.
In Asia, at the time of writing, Nikkei is up 0.67%. Hong Kong HSI is up 0.45%. China Shanghai SSE is down -0.43%. Singapore Strait Times is down -0.23%. Japan 10-year JGB yield is down -0.0069 at 0.253. Overnight, DOW rose 0.27%. S&P 500 rose 0.71%. NASDAQ rose 1.31%. 10-year yield dropped -0.015 to 2.477.
BoJ opinions emphasize importance to maintain monetary easing
In the Summary of Opinions of the March 17-18 meeting, BoJ noted, "unlike the United States and the United Kingdom, Japan is not in a situation where the inflation rate will likely exceed the price stability target of 2 percent in a continuous manner." Hence, "it is important for the Bank to continue with monetary easing to support the economic recovery from the pandemic."
Situations surrounding Ukraine have "caused price rises of energy and other items", and this will "push down domestic demand while raising the CPI." Under these circumstances, it is "necessary to improve labor market conditions and provide stronger support for wage increases".
One member warned that "if downward pressure on economic activity and prices increases, the economy may instead be in danger of falling into deflation again. If it becomes difficult to achieve the price stability target, the Bank should act nimbly and without hesitation."
Japan FM Suzuki carefully watching bad yen weakening
Japan Finance Minister Shunichi Suzuki said the government is carefully watching the foreign exchange market to avoid "bad yen weakening". He repeated that currency stability was important. While a weak Yen is positive for exporters, it's negative for household on popping up living costs.
Yesterday, BoJ started offering four days of unlimited bond purchases to defend the 0.25% cap of 10-year JGB yield. The first offer drew no bid but JPY 64.5B in JGBs were accepted in the second offer. According to the current guidance, BoJ targets to keep 10-year JGB yield at around 0% with 25bps limit up and down.
Released from Japan, unemployment rate dropped from 2.8% to 2.7% in February, better than expectation of 2.8%.
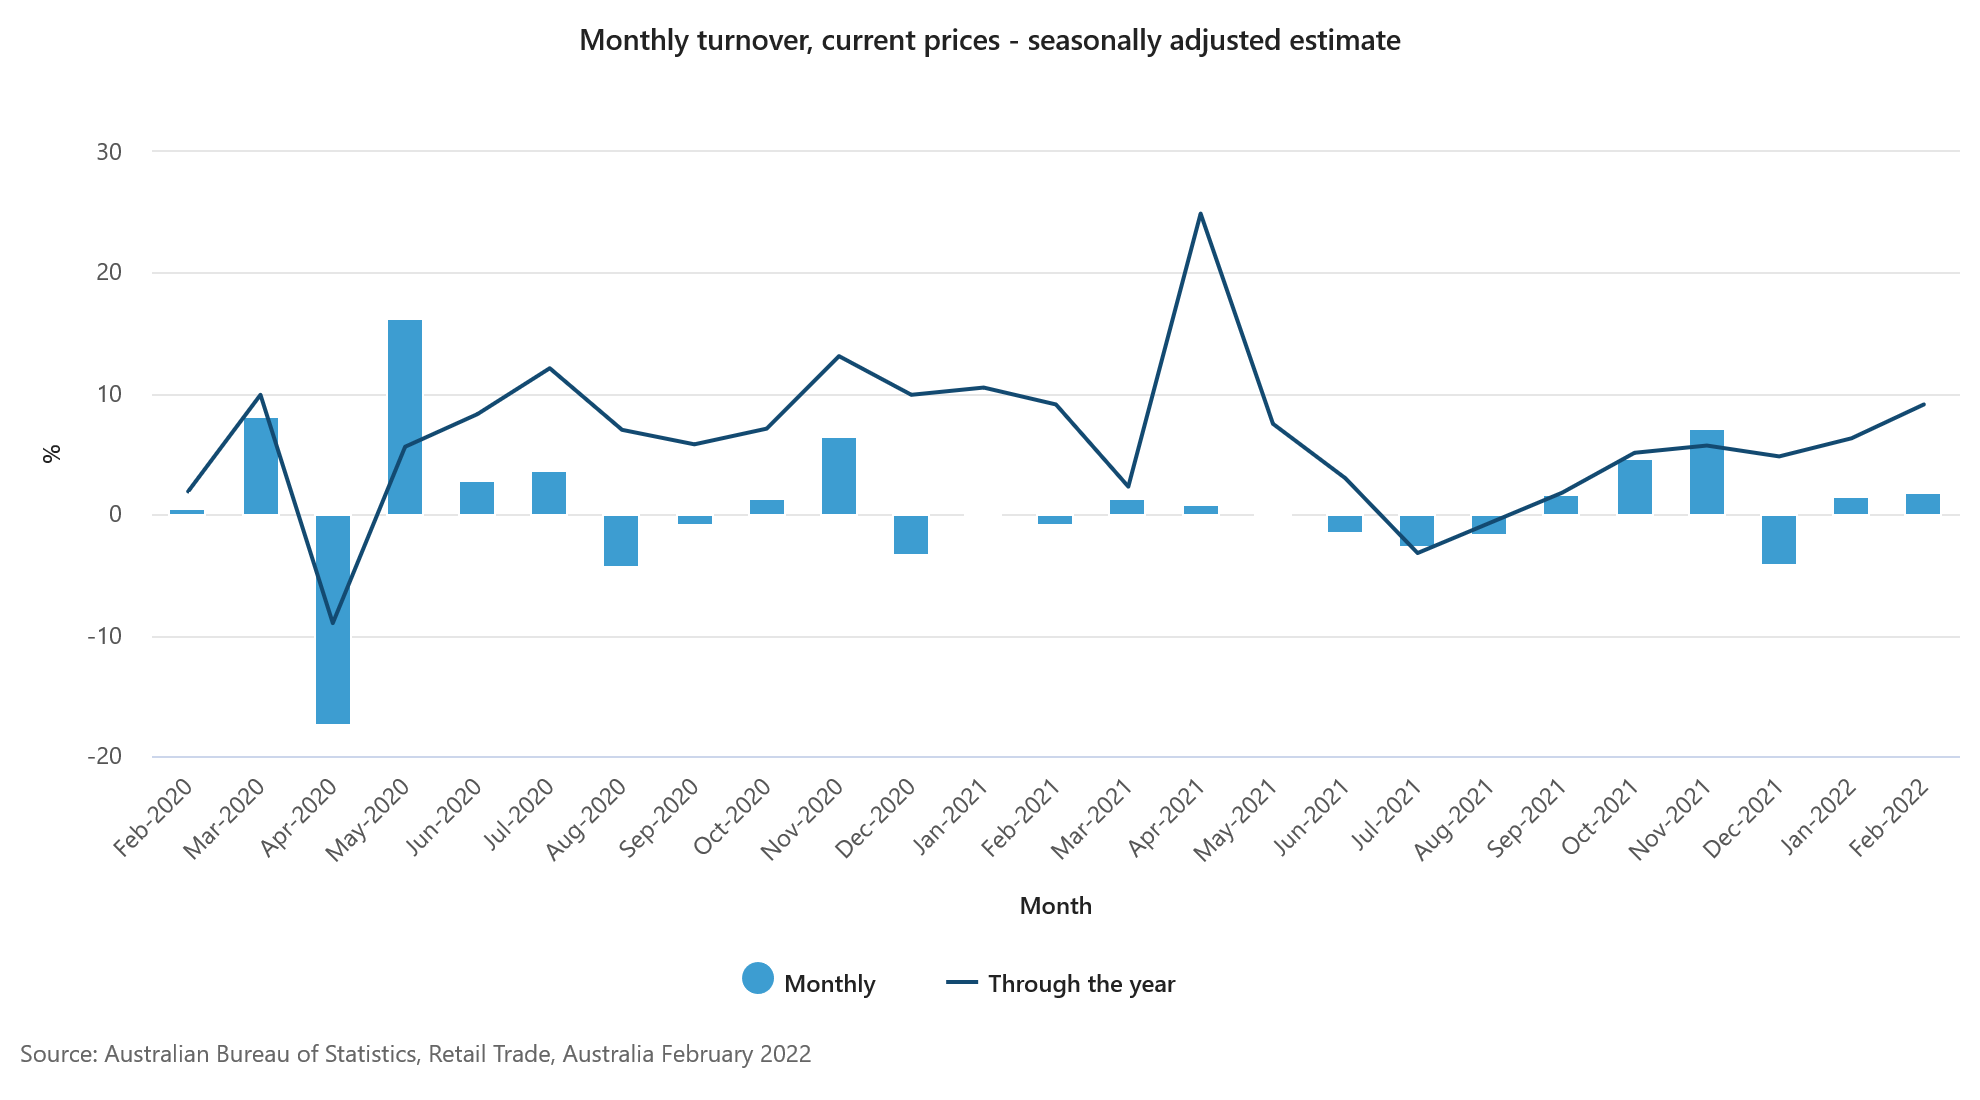
Australia retail sales rose 1.8% mom in Feb, hitting second highest on record
Australia retail sales rose 1.8% mom to AUD 33.09B in February, well above expectation of 1.0% mom.
Director of Quarterly Economy Wide Statistics, Ben James, said February's result saw retail sales reach their second highest level on record after November 2021 and turnover continuing to regain lost momentum caused by the peak of the Omicron outbreak in January.
"Lower COVID-19 case numbers in February, alongside the further easing of restrictions over the month, saw consumer spending return to similar behaviour seen previously as states and territories come out of a COVID-19 wave," James said.
Looking ahead
Germany Gfk consumer sentiment and import prices, UK mortgage approvals and M4 money supply, will be release in European session. Later in the day, US will release house price index and consumer confidence.
AUD/USD Daily Report
Daily Pivots: (S1) 0.7459; (P) 0.7500; (R1) 0.7532; More...
A temporary top is formed at 0.7539 in AUD/USD, just ahead of 0.7555 resistance. Intraday bias is turned neutral for some consolidations first. Further rise is expected as long as 0.7372 minor support holds. On the upside, decisive break of 0.7555 should confirm that whole corrective decline from 0.8006 has completed at 0.6966. Further rise should then be seen back to retest 0.8005. However, break of 0.7372 will dampen this bullish view and turn bias back to the downside for 0.7164 support instead.
In the bigger picture, correction from 0.8006 could have completed at 0.6966, after drawing support from 0.6991. That is, up trend from 0.5506 (2020 low) might be ready to resume. Firm break of 0.8006 will target 61.8% projection of 0.5506 to 0.8006 from 0.6966 at 0.8511 next. This will remain the favored case as long as 0.7164 support holds.
Economic Indicators Update
| GMT | Ccy | Events | Actual | Forecast | Previous | Revised |
|---|---|---|---|---|---|---|
| 23:30 | JPY | Unemployment Rate Feb | 2.70% | 2.80% | 2.80% | |
| 23:50 | JPY | BoJ Summary of Opinions | ||||
| 00:30 | AUD | Retail Sales M/M Feb | 1.80% | 1.00% | 1.80% | |
| 06:00 | EUR | Germany Gfk Consumer Confidence Survey Apr | -12 | -8.1 | ||
| 06:00 | EUR | Germany Import Price Index M/M Feb | 2.10% | 4.30% | ||
| 08:30 | GBP | Mortgage Approvals Feb | 73K | 74K | ||
| 08:30 | GBP | M4 Money Supply M/M Feb | 0.50% | 0.10% | ||
| 13:00 | USD | S&P/Case-Shiller Home Price Indices Y/Y Jan | 18.40% | 18.60% | ||
| 13:00 | USD | Housing Price Index M/M Jan | 1.40% | 1.20% | ||
| 14:00 | USD | Consumer Confidence Mar | 107.9 | 110.5 |
Australia retail sales rose 1.8% mom in Feb, hitting second highest on record
Australia retail sales rose 1.8% mom to AUD 33.09B in February, well above expectation of 1.0% mom.
Director of Quarterly Economy Wide Statistics, Ben James, said February's result saw retail sales reach their second highest level on record after November 2021 and turnover continuing to regain lost momentum caused by the peak of the Omicron outbreak in January.
"Lower COVID-19 case numbers in February, alongside the further easing of restrictions over the month, saw consumer spending return to similar behaviour seen previously as states and territories come out of a COVID-19 wave," James said.
BoJ opinions emphasize importance to maintain monetary easing
In the Summary of Opinions of the March 17-18 meeting, BoJ noted, "unlike the United States and the United Kingdom, Japan is not in a situation where the inflation rate will likely exceed the price stability target of 2 percent in a continuous manner." Hence, "it is important for the Bank to continue with monetary easing to support the economic recovery from the pandemic."
Situations surrounding Ukraine have "caused price rises of energy and other items", and this will "push down domestic demand while raising the CPI." Under these circumstances, it is "necessary to improve labor market conditions and provide stronger support for wage increases".
One member warned that "if downward pressure on economic activity and prices increases, the economy may instead be in danger of falling into deflation again. If it becomes difficult to achieve the price stability target, the Bank should act nimbly and without hesitation."
Japan FM Suzuki carefully watching bad yen weakening
Japan Finance Minister Shunichi Suzuki said the government is carefully watching the foreign exchange market to avoid "bad yen weakening". He repeated that currency stability was important. While a weak Yen is positive for exporters, it's negative for household on popping up living costs.
Yesterday, BoJ started offering four days of unlimited bond purchases to defend the 0.25% cap of 10-year JGB yield. The first offer drew no bid but JPY 64.5B in JGBs were accepted in the second offer. According to the current guidance, BoJ targets to keep 10-year JGB yield at around 0% with 25bps limit up and down.
Technical Outlook and Review
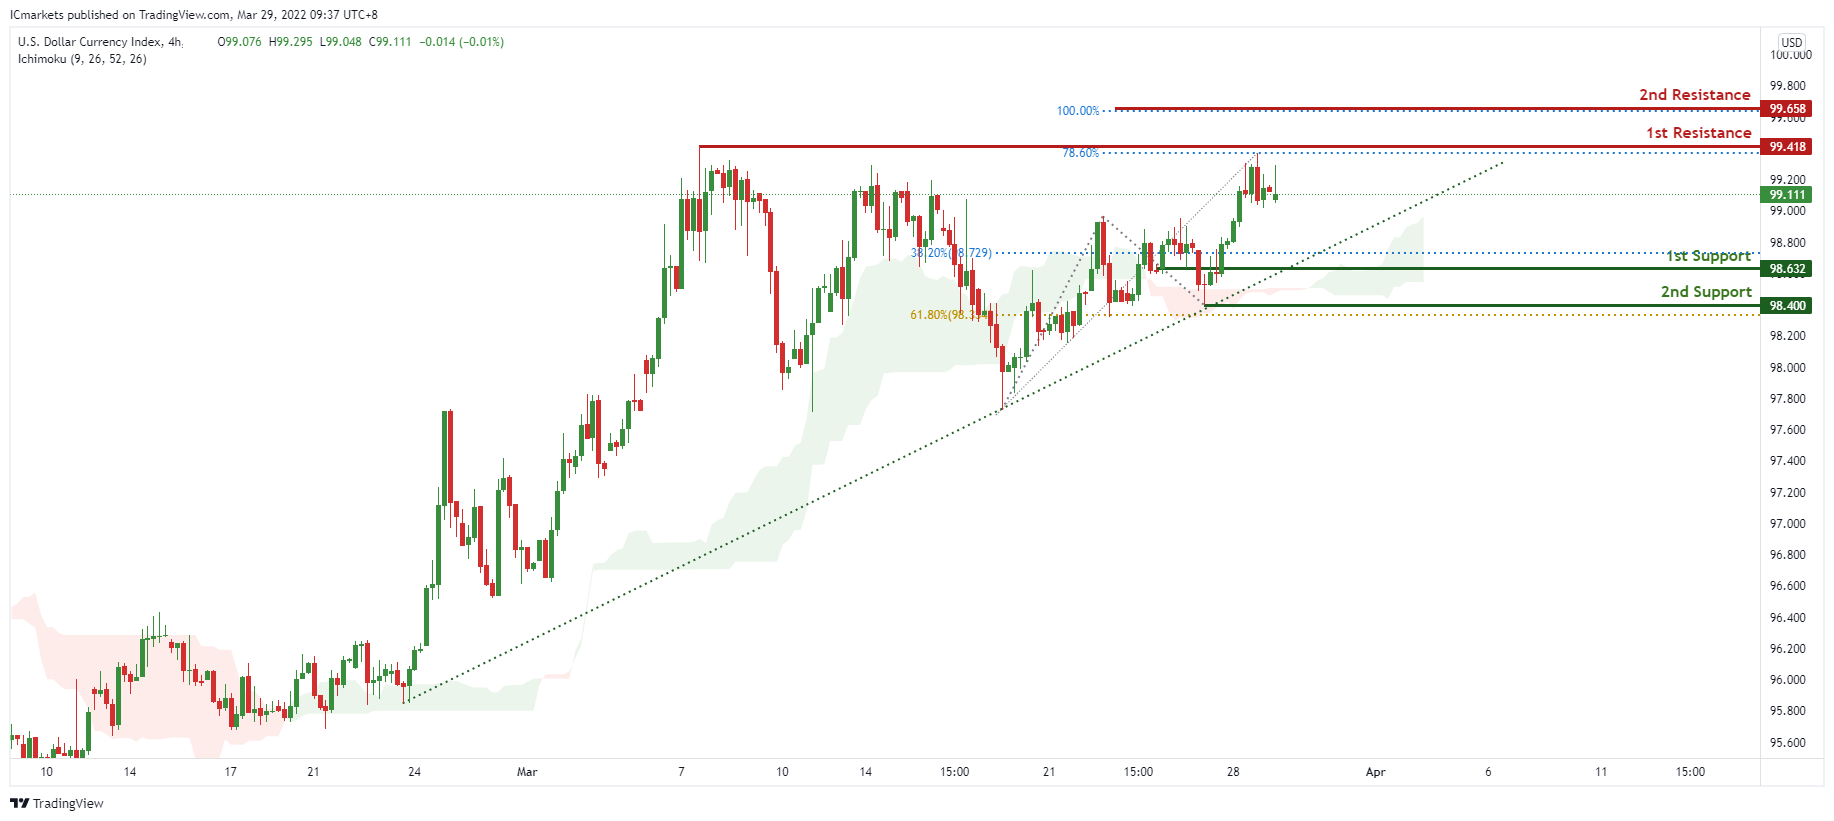
DXY:
On the H4 timeframe, prices are on bullish momentum and abiding by our ascending trendline support. We see the potential for a bounce from our 1st support at 98.632 in line with 38.2% Fibonacci retracement towards our 1st resistance at 99.418 in line with 78.6% Fibonacci projection. Prices are trading above our ichimoku cloud support, further supporting our bullish bias.
Areas of consideration:
- H4 time frame, 1st resistance at 99.658
- H4 time frame, 1st support at 98.632
XAU/USD (GOLD):
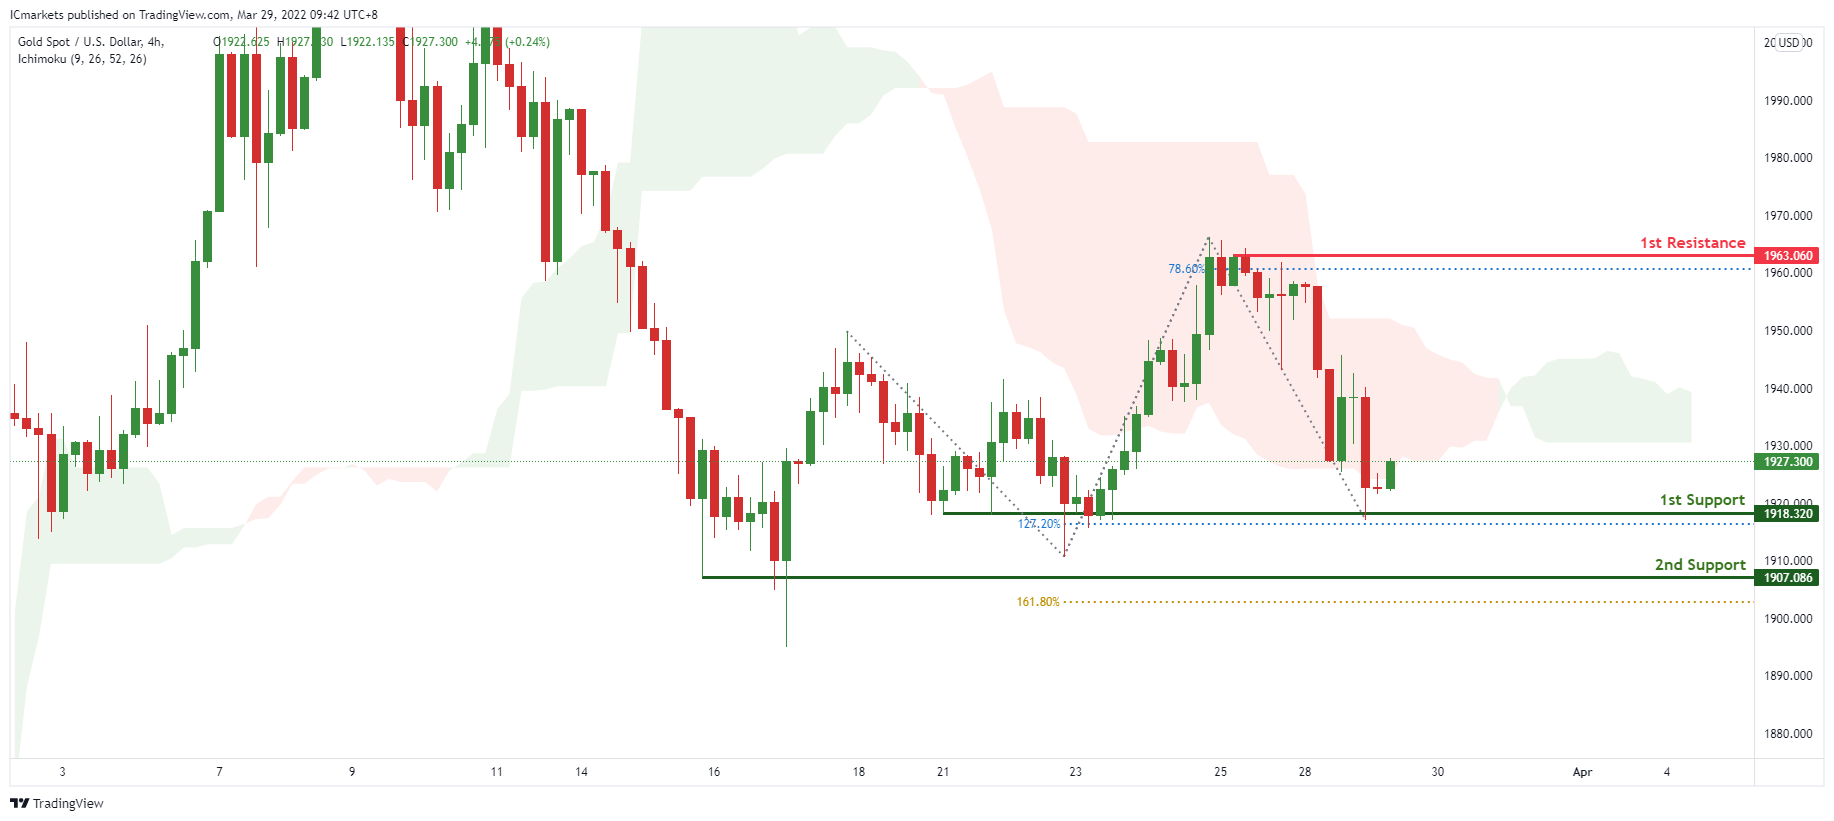
On the H4, prices are approaching a key pivot. We see the potential for a bounce from our 1st support at 1918.32 which is in line with 127.2% Fibonacci extension towards our 1st resistance at 1963.060 in line with 78.6% Fibonacci Projection and also graphical swing high. Prices are trading below our ichimoku clouds, further supporting our bearish bias.
Areas of consideration:
- 4h 1st support at 1918.32
- 4h 1st resistance at 1963.060
GBP/USD:
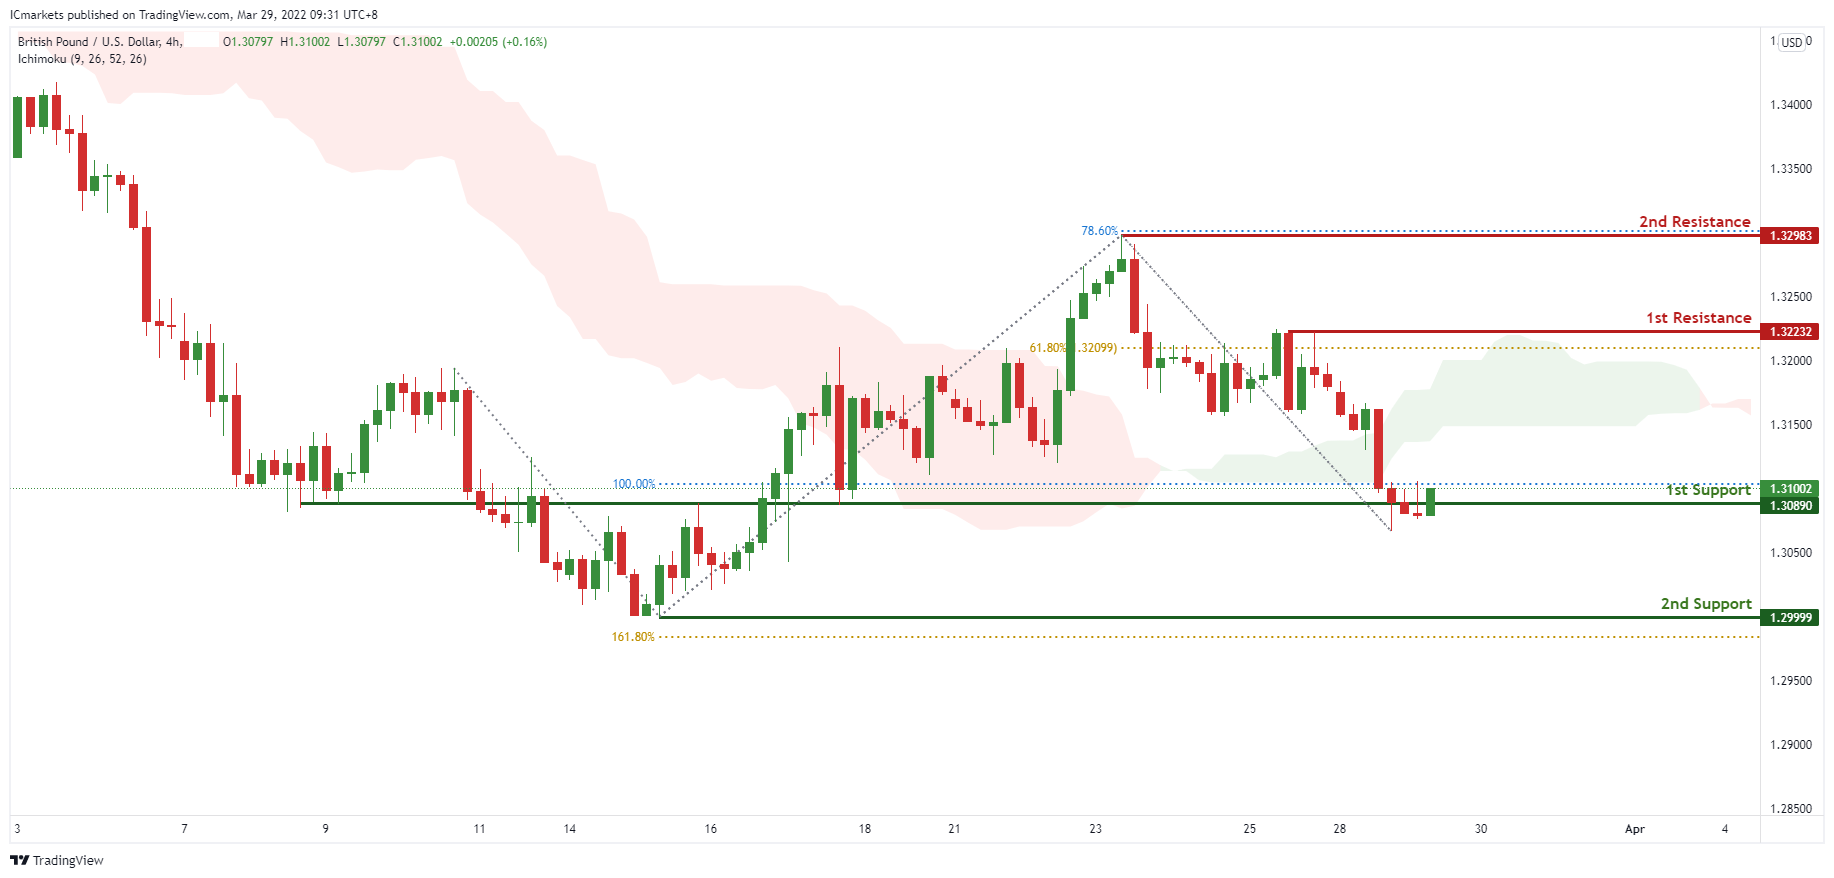
On the H4, prices are on bullish momentum. We see the potential for a bounce from our 1st support at 1.30890 which is a graphical overlap and in line with 100% Fibonacci Projection towards our 1st resistance at 1.32232 in line with 61.8% Fibonacci Projection. Ichimoku clouds are showing green clouds, further supporting our bullish bias. Alternatively, breaking the 1st support will call for a further bullish continuation towards our 2nd support at 1.29999 which was a graphical swing low and in line with 161.8% Fibonacci Projection.
Areas of consideration:
- H4 1st resistance at 1.32232
- H4 1st support at 1.30890
USD/CHF:
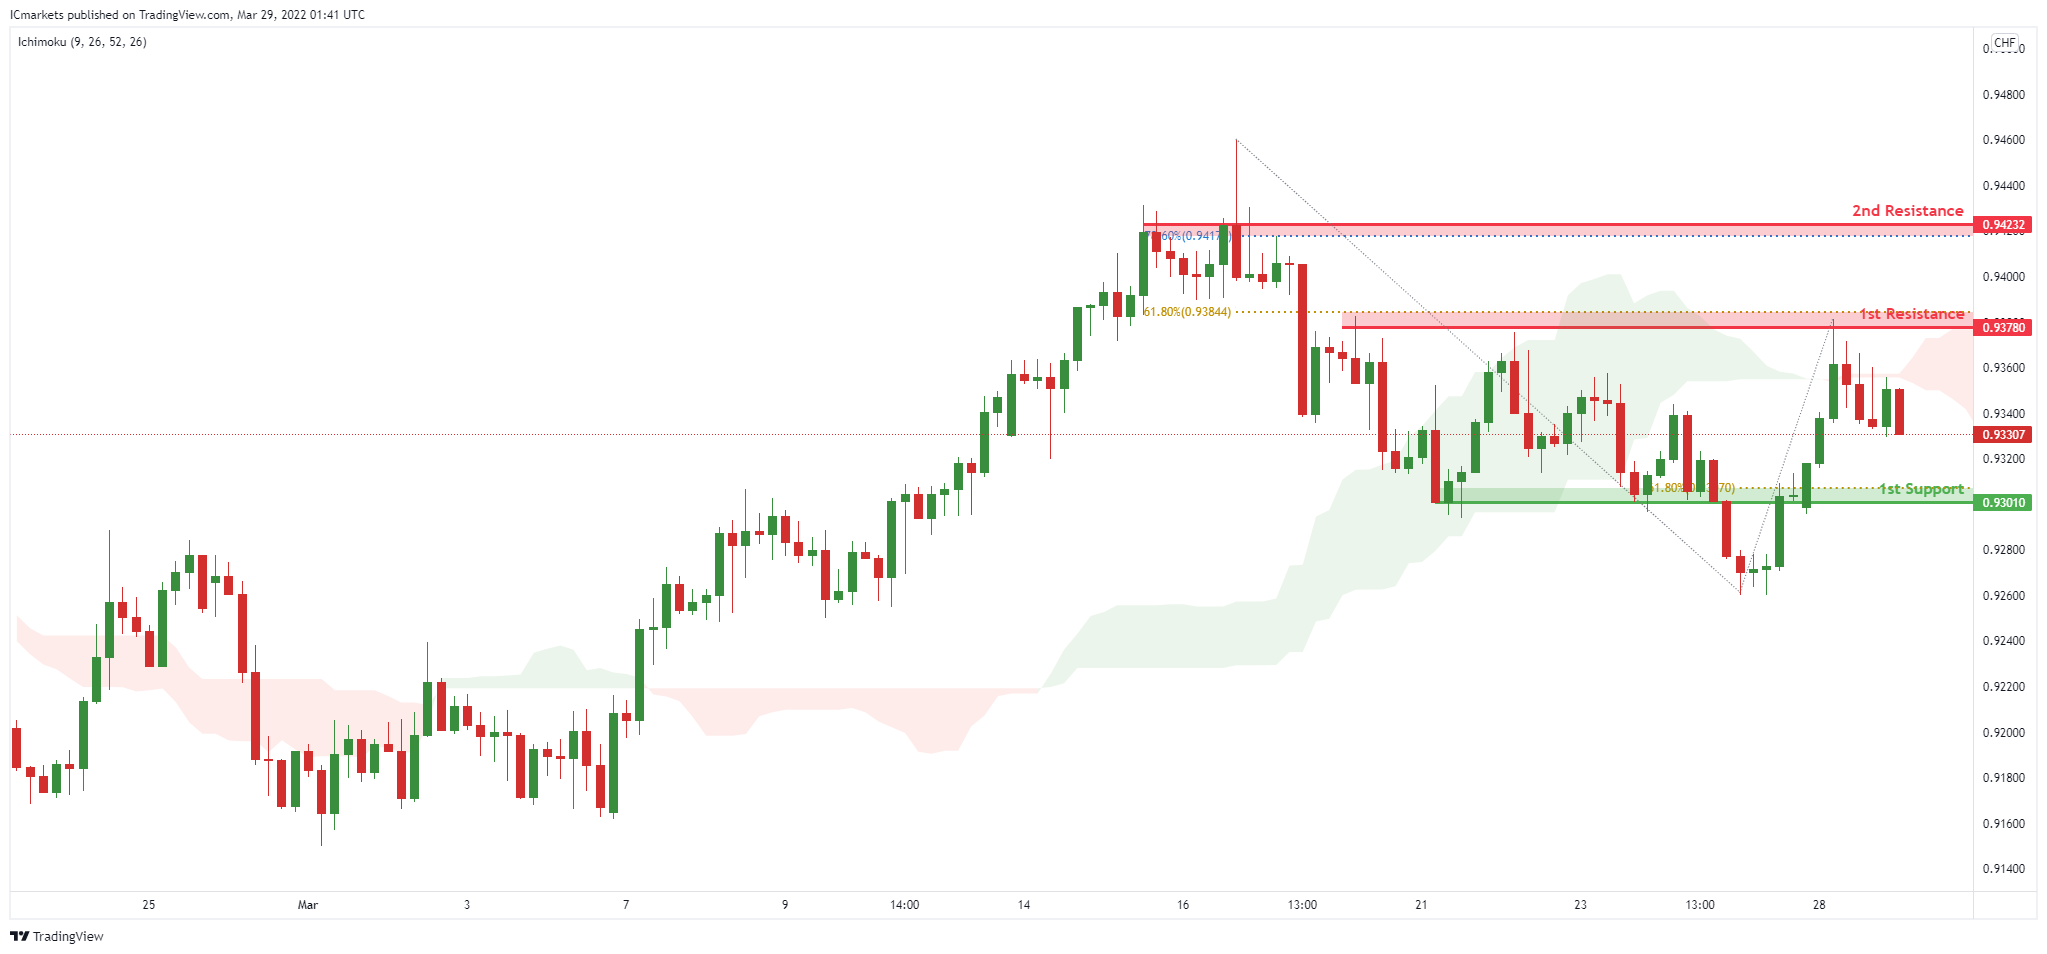
On the H4, with price moving below our ichimoku cloud, we have a bias that price will drop from 1st resistance at 0.93743 in line with the horizontal pullback resistance and 61.8% Fibonacci retracement to 1st support at 0.93010 in line with the pullback support and 61.8% Fibonacci retracement . Alternatively, price may break 1st resistance and head for 2nd resistance at 0.94232 in line with the 78.6% Fibonacci retracement.
Areas of consideration
- 1st support level at 0.93010
- 1st resistance level at 0.93743
EUR/USD :
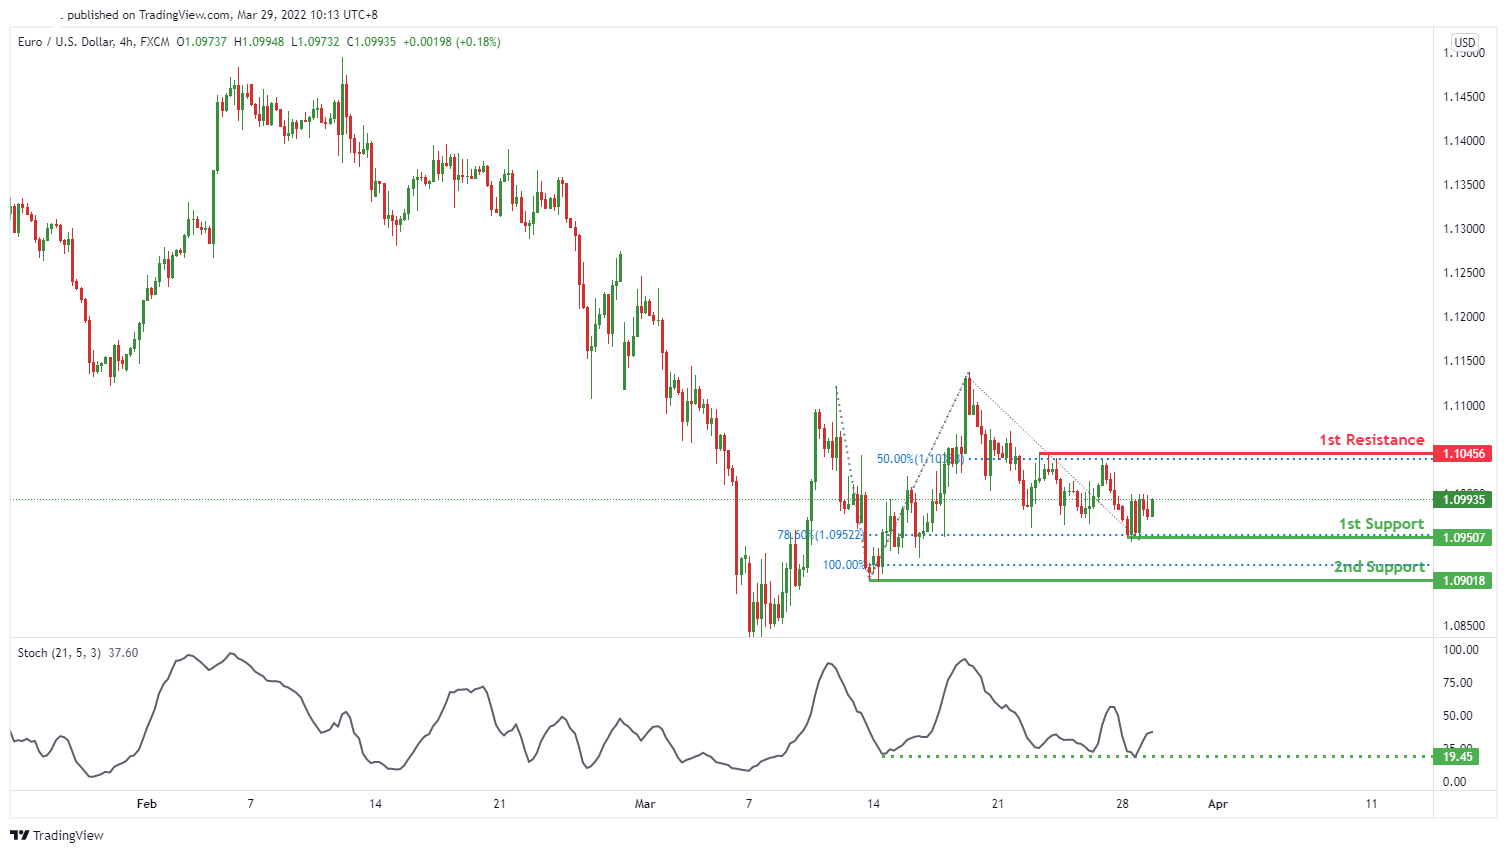
On the H4 timeframe, we see the potential for a bullish pressure from our 1st support at 1.09507 in line with 78.6% Fibonacci retracement towards our 1st resistance at 1.10456 in line with 50% Fibonacci retracement. Our bullish bias is supported by the stochastic indicator where price is at support level.
Areas of consideration :
- H4 1st resistance at 1.10456
- H4 1st support at 1.09507
USD/JPY:
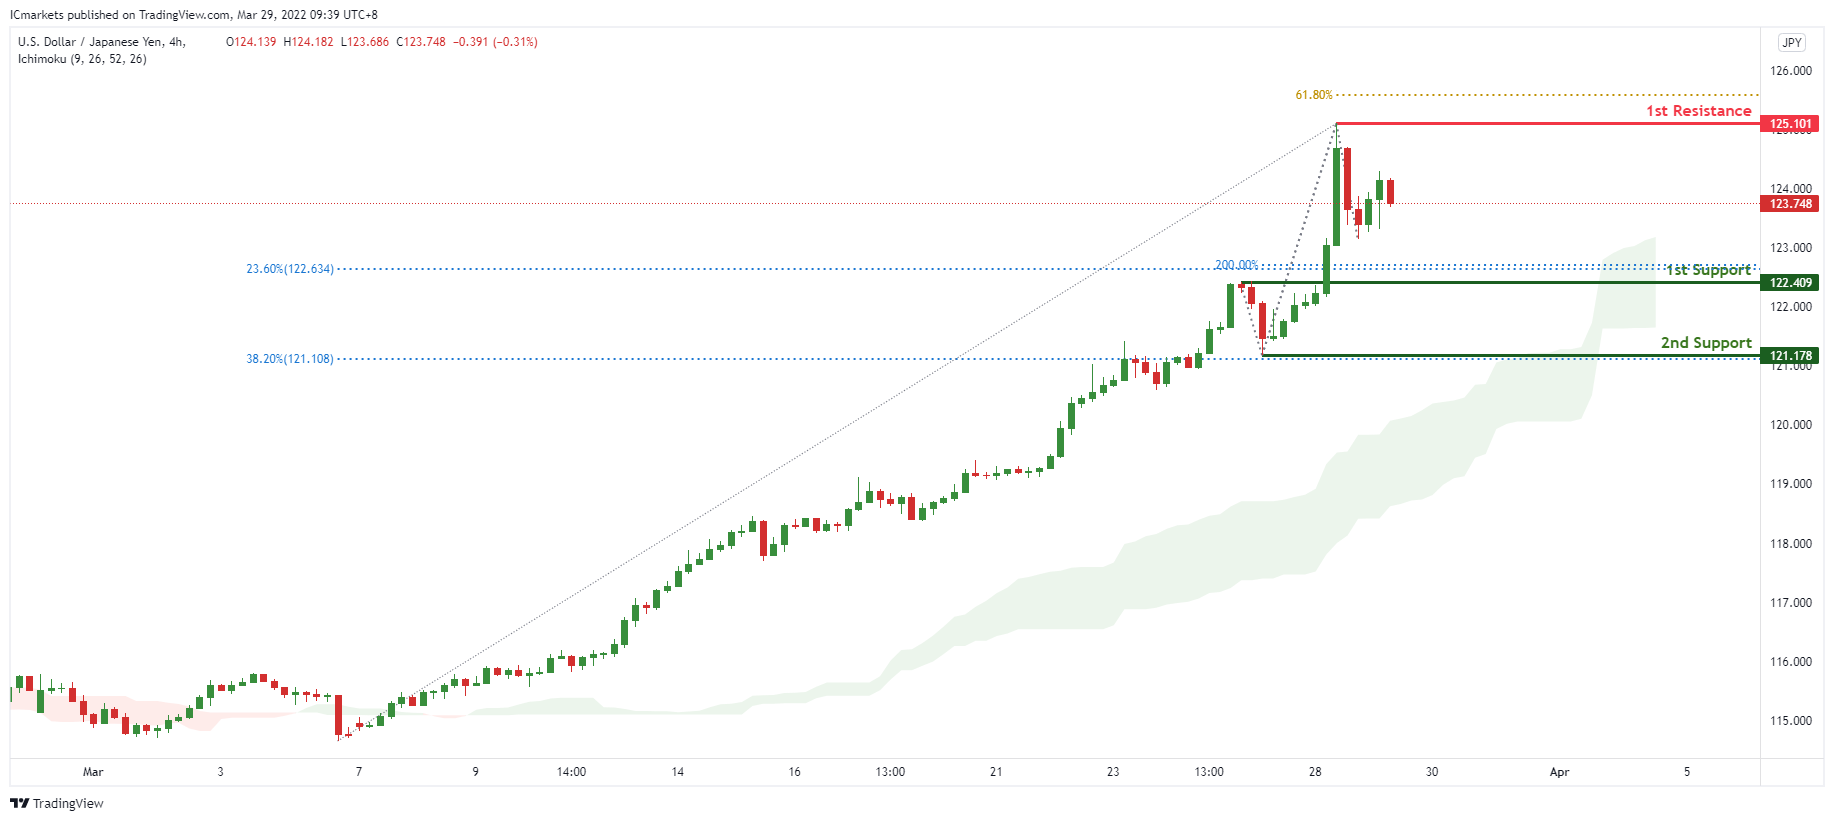
On the H4 timeframe, prices are on bullish momentum. We see the potential for further bullish continuation from our 1st support at 121.409 in line with 23.6% Fibonacci retracement and 200% Fibonacci projection towards our 1st resistance at 125.101 which is in line with 61.8% Fibonacci Projection. Prices are trading above our ichimoku clouds, further supporting our bias.
Areas of consideration:
- H4 time frame, 1st resistance at 125.101
- H4 time frame, 1st support at 122.409
AUD/USD:
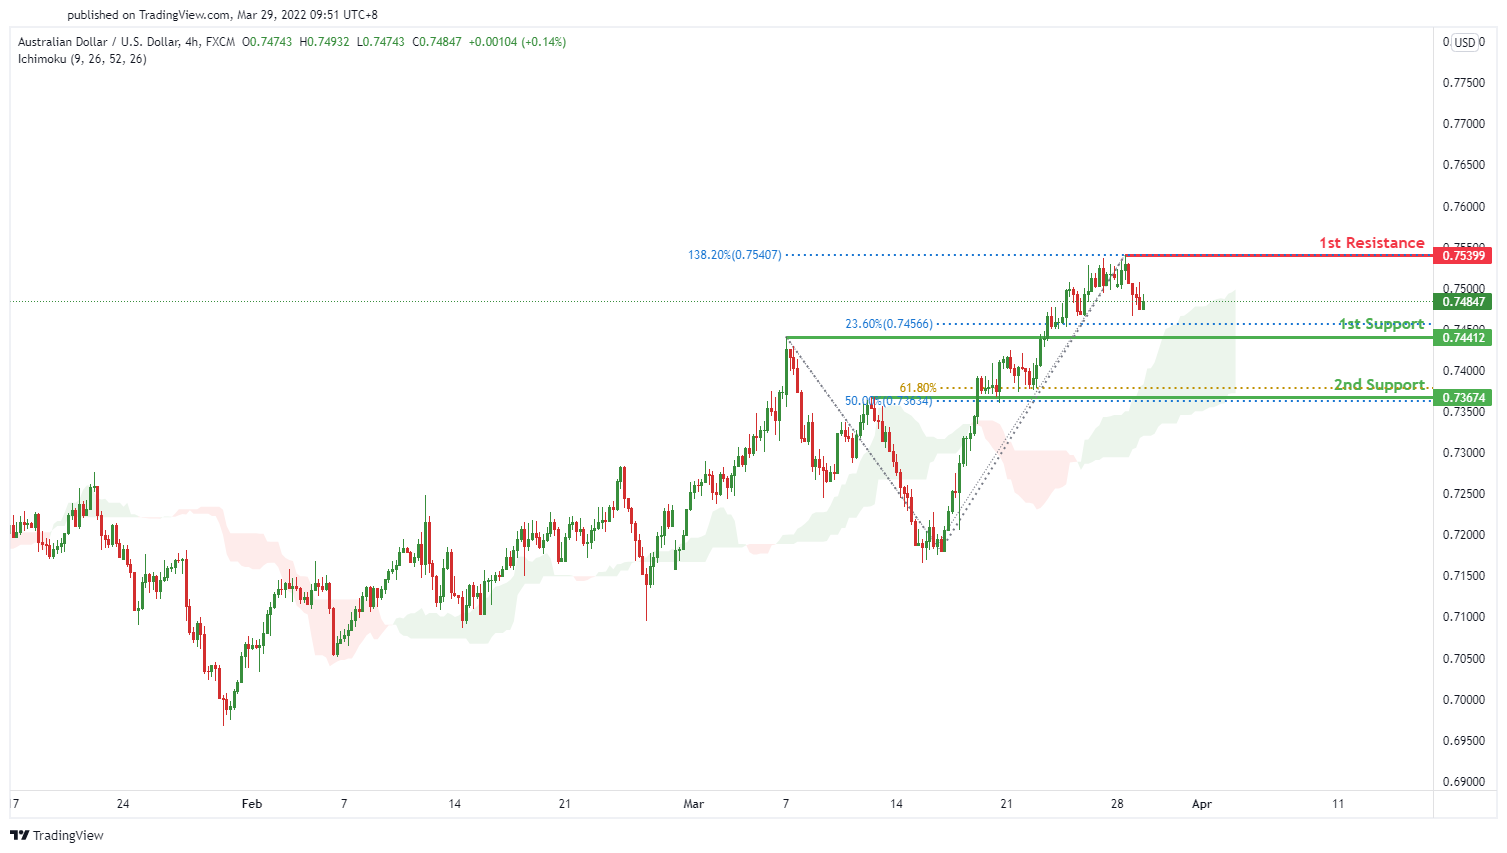
On the H4 timeframe, we see the potential for a bullish bounce from our 1st support at 0.74412 in line with 23.6% Fibonacci retracement towards our 1st resistance at 0.75399 in line with 138.2% Fibonacci extension. Our bullish bias is supported by price trading below the Ichimoku cloud indicator.
Areas of consideration
- H4 1st resistance at 0.75399
- H4 1st support at 0.74412
NZD/USD:
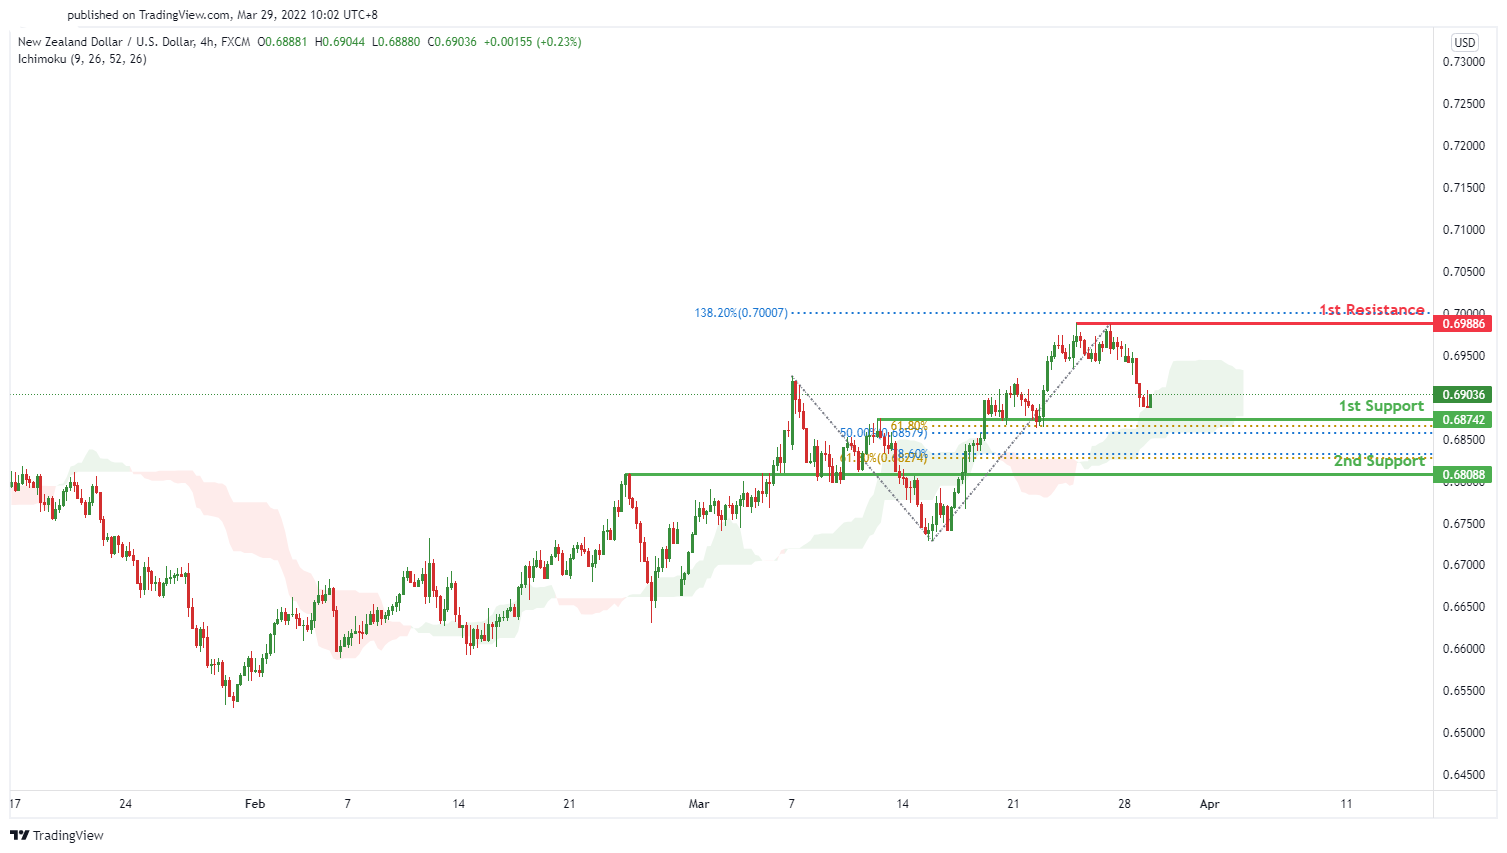
On the H4 timeframe, we see the potential for a bullish bounce from our 1st support at 0.68742 in line with 50% Fibonacci retracement and 61.8% Fibonacci projection towards our 1st resistance at 0.69886 in line with 138.2% Fibonacci extension. Our bullish bias is supported by price trading below the Ichimoku cloud indicator.
Areas of consideration :
- H4 1st resistance at 0.69886
- H4 1st support at 0.68742
USD/CAD:
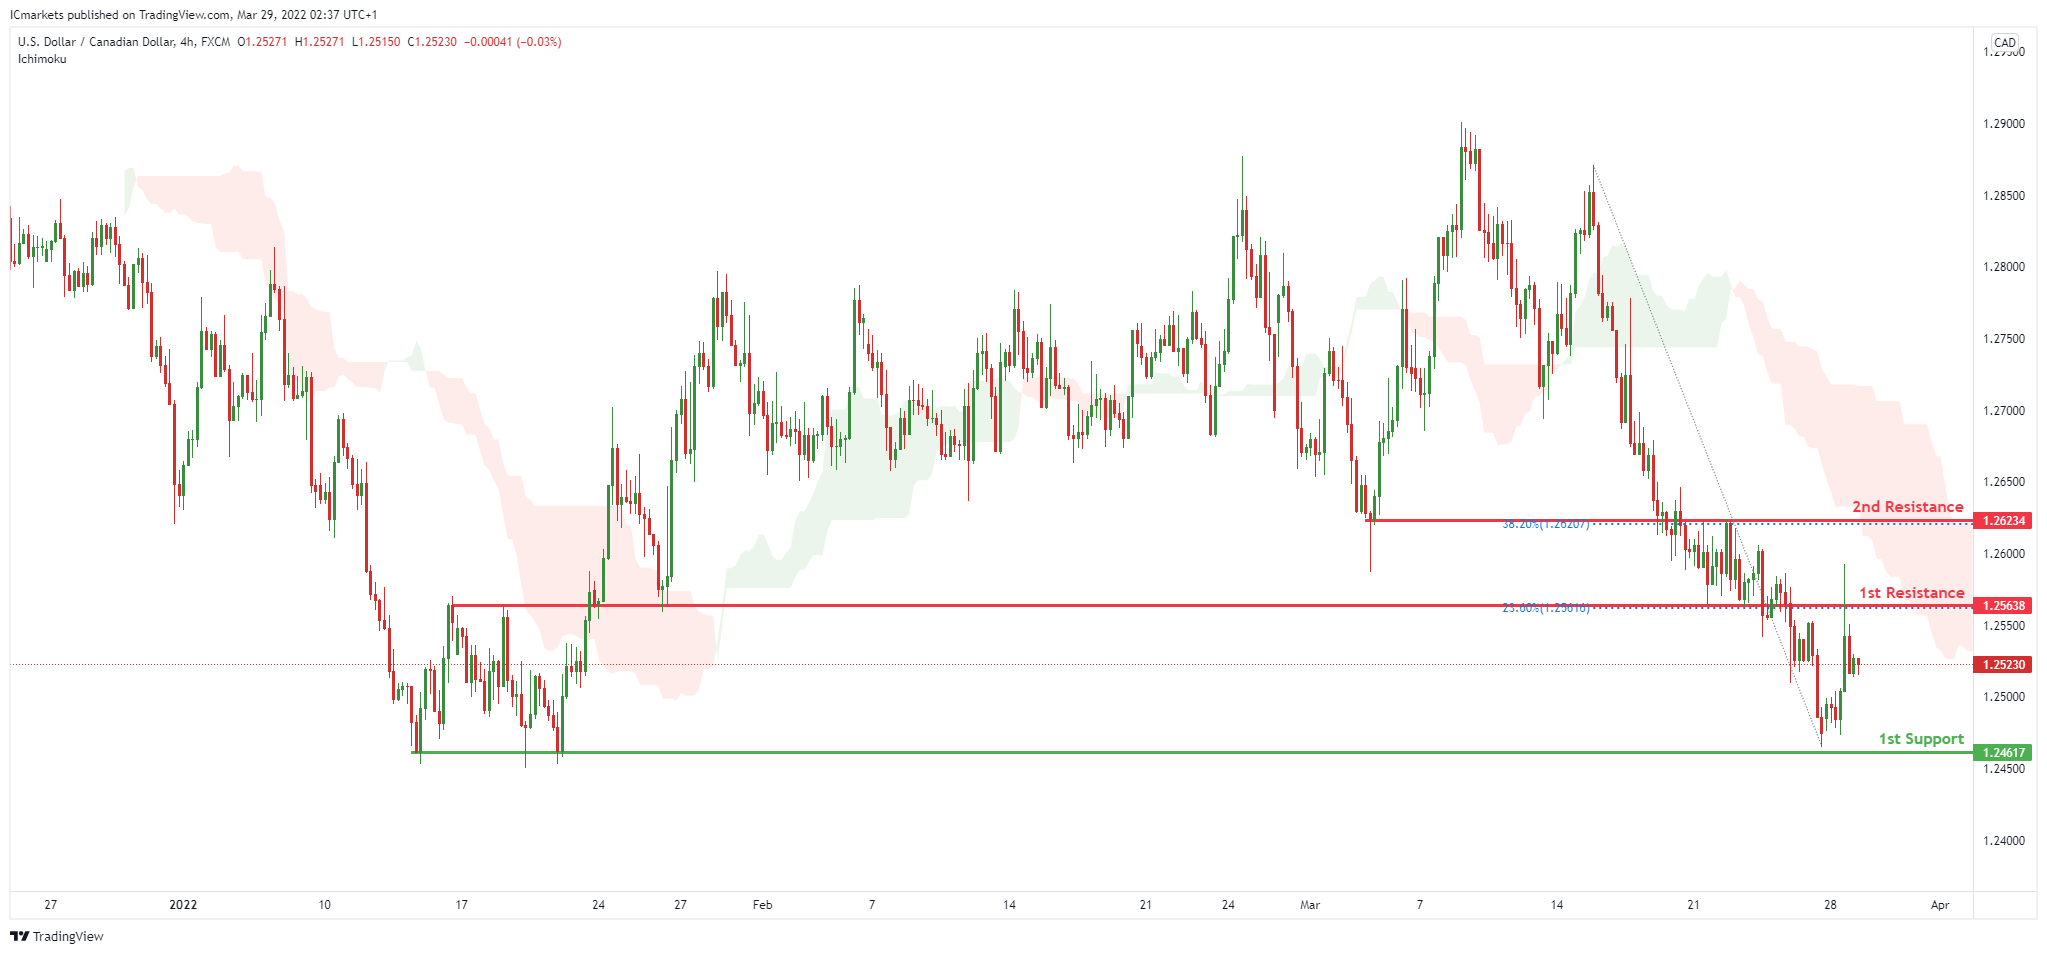
On the H4, with price moving below our ichimoku cloud, we have a bias that price will drop from 1st resistance at 1.25638 in line with the horizontal overlap resistance and 23.6% Fibonacci retracement to 1st support at 1.24617 in line with the swing low support . Alternatively, price may break 1st resistance and head for 2nd resistance at 1.26234 in line with the 38.2% Fibonacci retracement.
Areas of consideration:
- H4 time frame, 1st support at 1.24617
- H4 time frame, 1st resistance at 1.25638
OIL:
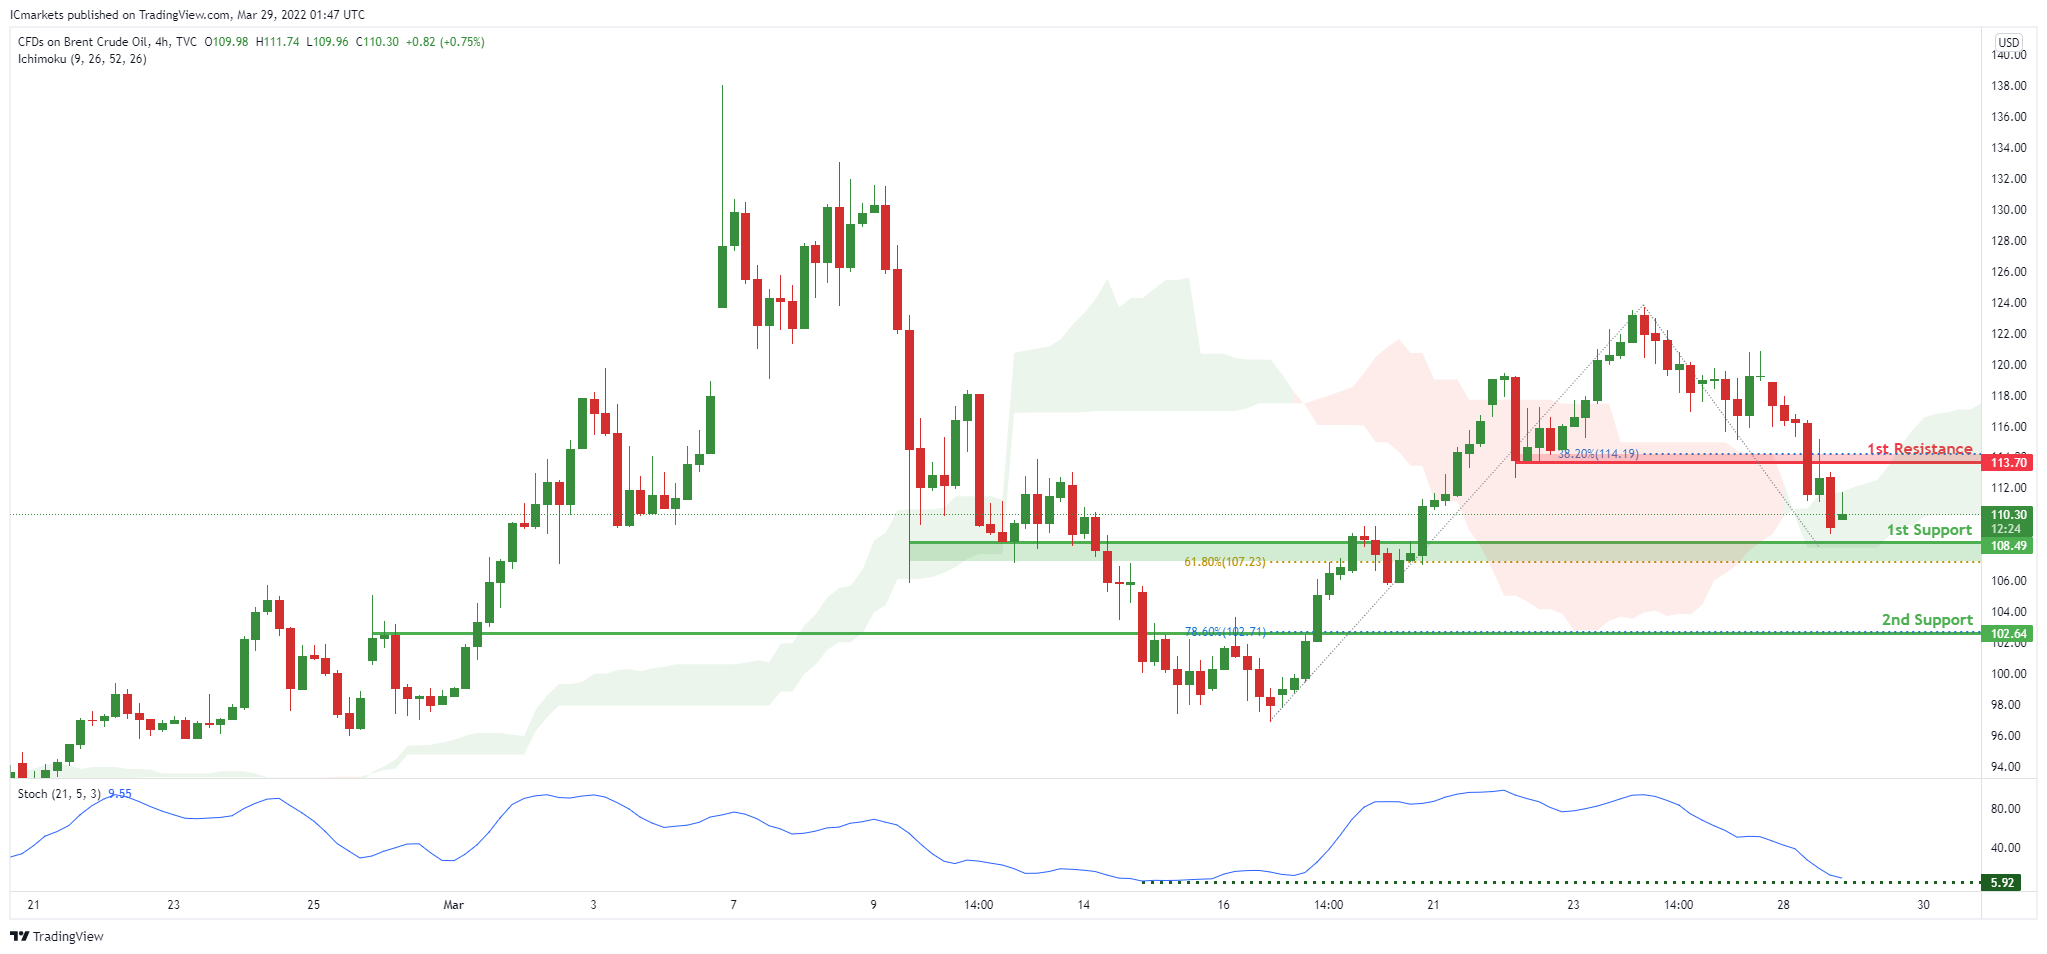
On the H4, with price expected to bounce off the support of the ichimoku cloud, we have a bias that price will rise to our 1st resistance at 113.70 in line with the 38.2% Fibonacci retracement from our 1st support at 108.49 in line with the horizontal overlap support and 61.8% Fibonacci retracement. Alternatively, price may break 1st support structure and head for 2nd support at 102.64 in line with the horizontal overlap support and 78.6% Fibonacci retracement.
Areas of consideration:
- H4 time frame, 1st resistance of 113.70
- H4 time frame, 1st support of 108.49
Dow Jones Industrial Average:
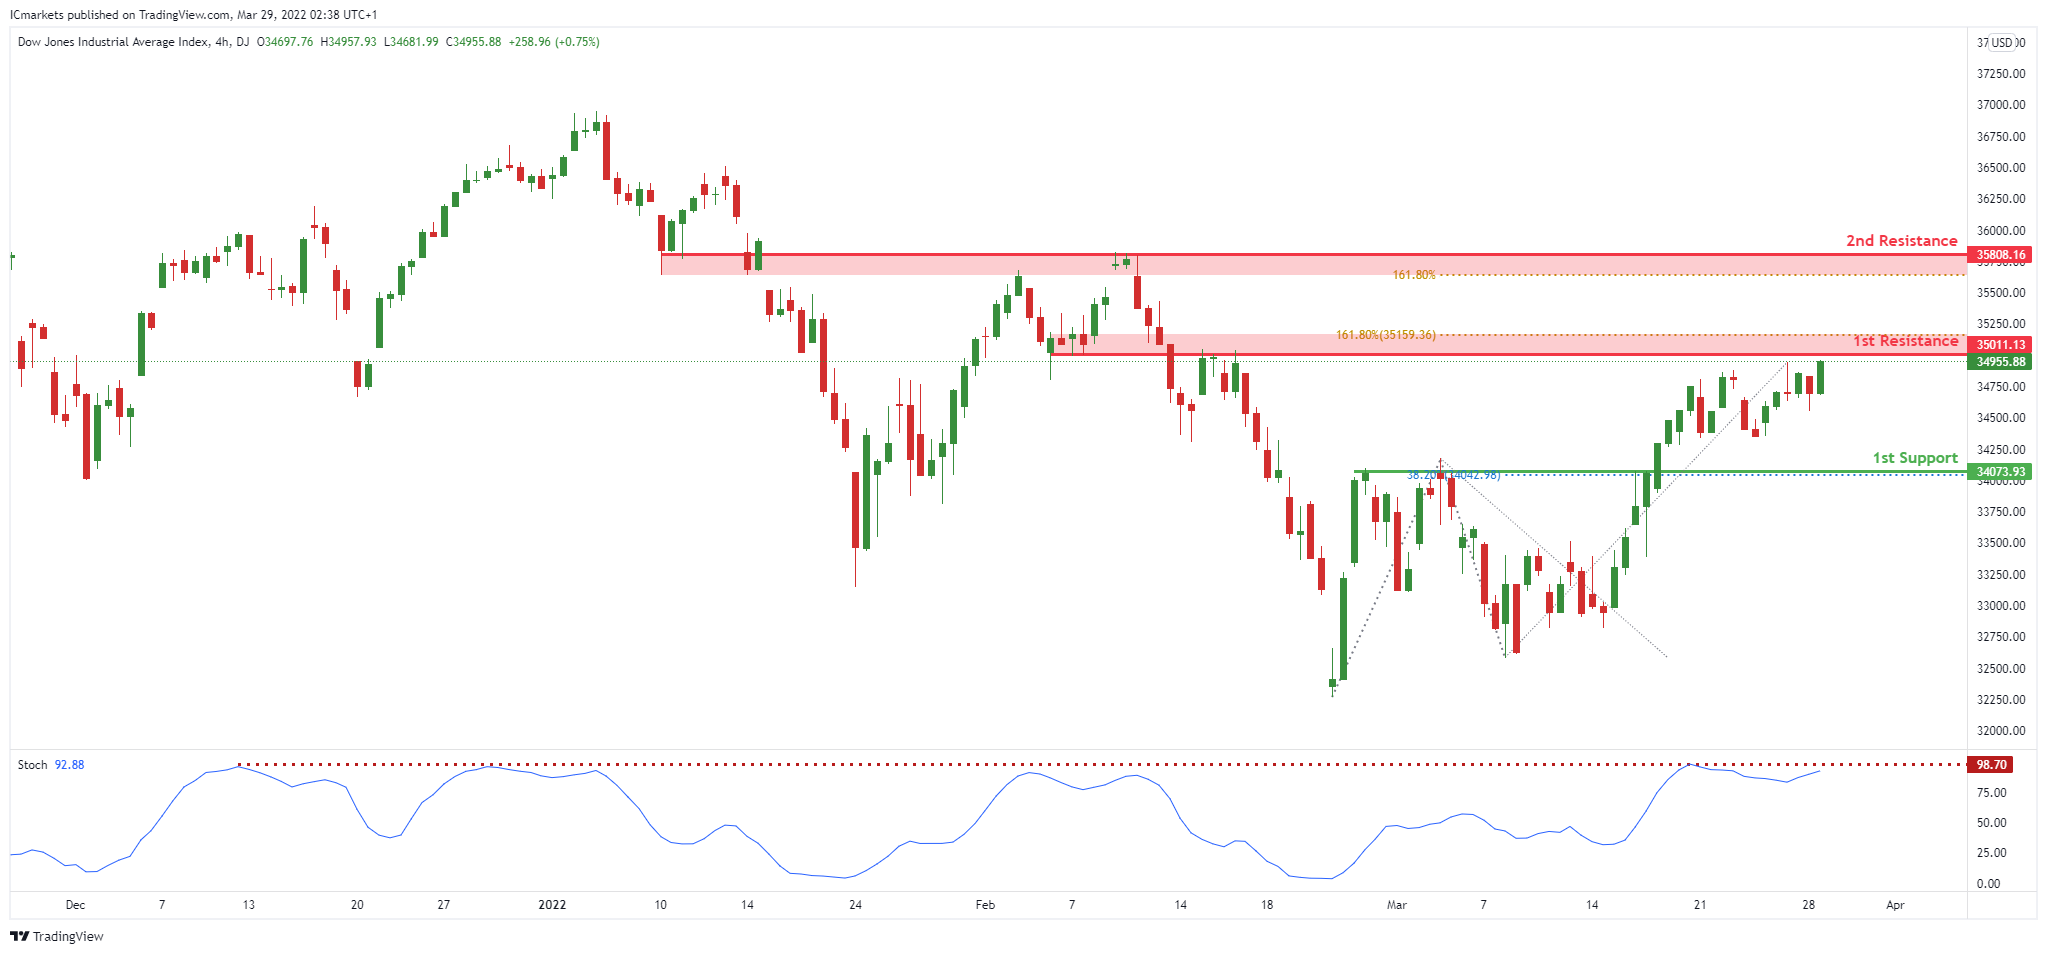
On the H4, with price expected to reverse off the stochastics level, we have a bias that price will drop from 1st resistance at 35011 in line with the horizontal overlap resistance and 161.8% Fibonacci extension to 1st support at 34073 in line with the pullback support .Alternatively, price may break 1st resistance and head for 2nd resistance at 35808 in line with the 161.8% Fibonacci extension.
Areas of consideration :
- H4 1st support at 34073
- H4 1st resistance at 35011
GBP/USD Remains At Risk of More Downsides
Key Highlights
- GBP/USD started a fresh decline from the 1.3300 region.
- It traded below a key bullish trend line with support near 1.3185 on the 4-hours chart.
- EUR/USD is struggling below the 1.1050 resistance zone.
- USD/JPY rallied above 124.00 before correcting gains.
GBP/USD Technical Analysis
The British Pound struggled to surpass the 1.3300 resistance zone against the US Dollar. GBP/USD started a fresh decline below the 1.3250 level.
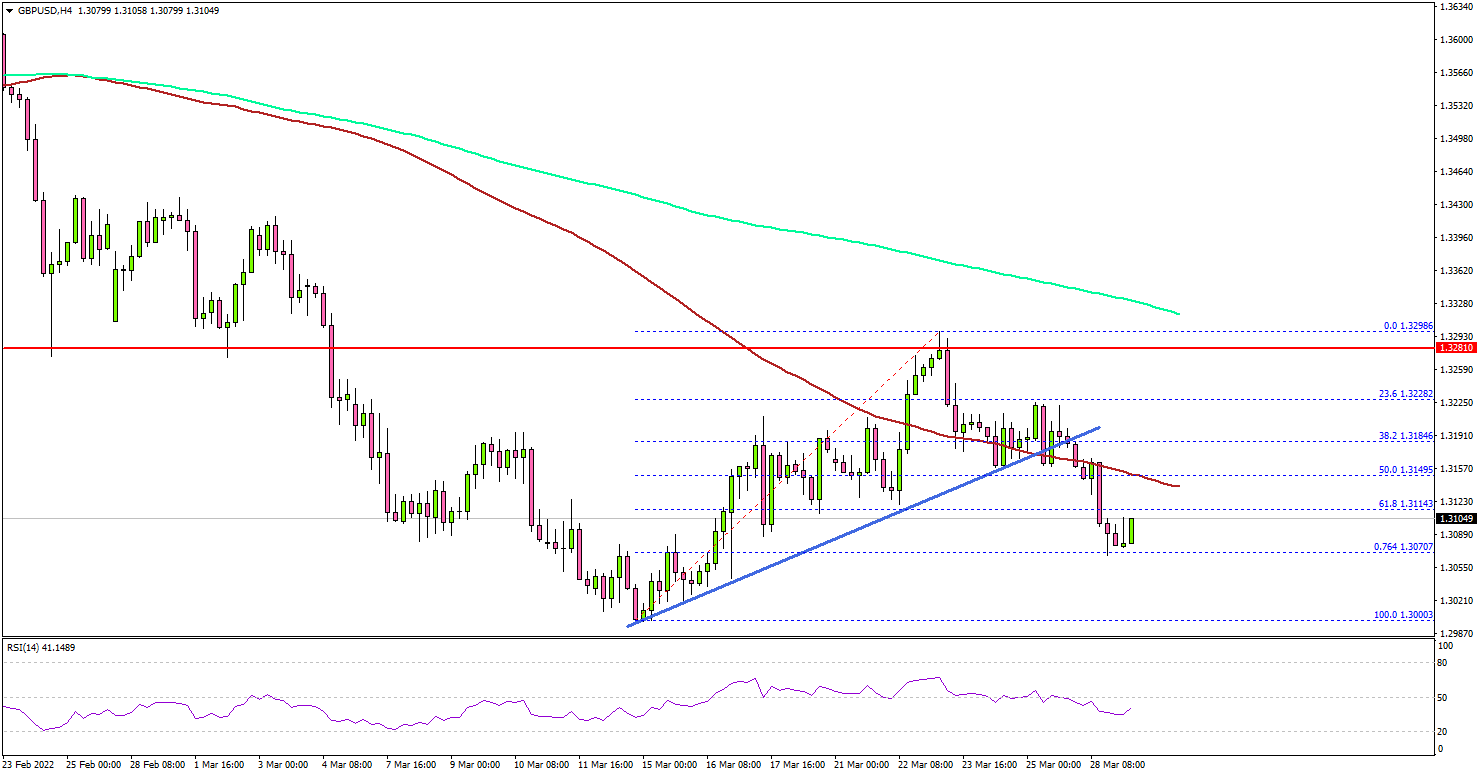
Looking at the 4-hours chart, the pair declined below the 1.3200 support zone and settled below the 200 simple moving average (green, 4-hours). There was a clear move below the 50% Fib retracement level of the upward move from the 1.3000 swing low to 1.3298 high.
It is now trading below the 1.3150 level and the 100 simple moving average (red, 4-hours). An initial support is near the 1.3070 level or the 76.4% Fib retracement level of the upward move from the 1.3000 swing low to 1.3298 high.
The main support is near the 1.3000 level. A downside break below the 1.3000 level might call for a sharp decline. The next major support sits near the 1.2920 level, below which the pair could revisit 1.2800.
On the upside, an immediate resistance is near the 1.3120 level. The main resistance sits near the 1.3150 level and the 100 simple moving average (red, 4-hours). A clear move above the 1.3150 zone could set the pace for a move towards 1.3300.
Looking at EUR/USD, the pair is showing bearish signs below the 1.1050 level and remains at a risk of more downsides.
Economic Releases
- US Housing Price Index for Jan 2022 (MoM) - Forecast +1.4%, versus +1.2% previous.
Bitcoin Storms to 2022 Peak Dragging Broader Crypto Markets Higher
Bitcoin price has been rallying in the past week, trading comfortably above the $47,000 mark in the current trading session. This recent uptrend is largely attributed to a wave of short position liquidations on cryptocurrency exchanges as transaction volume exceeded $120 billion in the past 24 hours. Moreover, most major altcoins exploded to fresh highs, benefiting from Bitcoin’s significant upside breakout. Is this the start of a bullish cycle for cryptocurrencies even though the dust from the war has not settled yet?
Massive crypto adoption from the banking sector boosts demand
Last week, many renowned financial institutions announced initiatives that promote the use and trading of cryptocurrencies. More specifically, the leading investment bank Goldman Sachs reshaped its homepage to feature cryptocurrencies, the metaverse, and digitalization as the latest and most pioneering market themes. This move attracted a lot of attention from investors and social media users, who pointed out that the bank has come a long way from its original assessment, which was that Bitcoin should not be considered an asset class.
In addition, last Thursday Israel’s largest bank, Leumi, announced that it will become the first Israeli bank to provide cryptocurrency trading to its clients. Considering that Israel does not have a regulatory framework for cryptocurrencies yet, this move indicates the willingness of major banks to accelerate the adoption of cryptos to avoid being left out of a swiftly developing market.
El Salvador president announces the issuance of the first Bitcoin bond
El Salvador is aiming to be the first country to issue a Bitcoin-backed bond to fund the construction of the first “Bitcoin City”. The main plan is to use geothermal power from volcanoes to power Bitcoin mining as well as the city’s infrastructure. This might prove a huge development for the crypto space as miners are being pressured by regulators to adopt more sustainable and environmentally-friendly power sources.
More and more businesses launch cryptocurrency features
South Korean tech behemoth LG Electronics announced in its latest annual general meeting on Thursday that it plans to expand its businesses into the cryptocurrency and blockchain sectors. More specifically, their objectives include the creation of a crypto exchange market and the development of blockchain-based software.
In other news, the non-profit organization Luna Foundation Guard (LFG) invested over $1.1 billion in Bitcoin to ensure the sustainability of Terra's algorithmic stablecoin (UST). Additionally, the firm has committed to accumulate $10 billion worth of Bitcoin for its project reserves, while the firm is claiming to have $3 billion of dry power to spend immediately but it is currently facing some technical issues.
Can Bitcoin’s upside breakout continue?
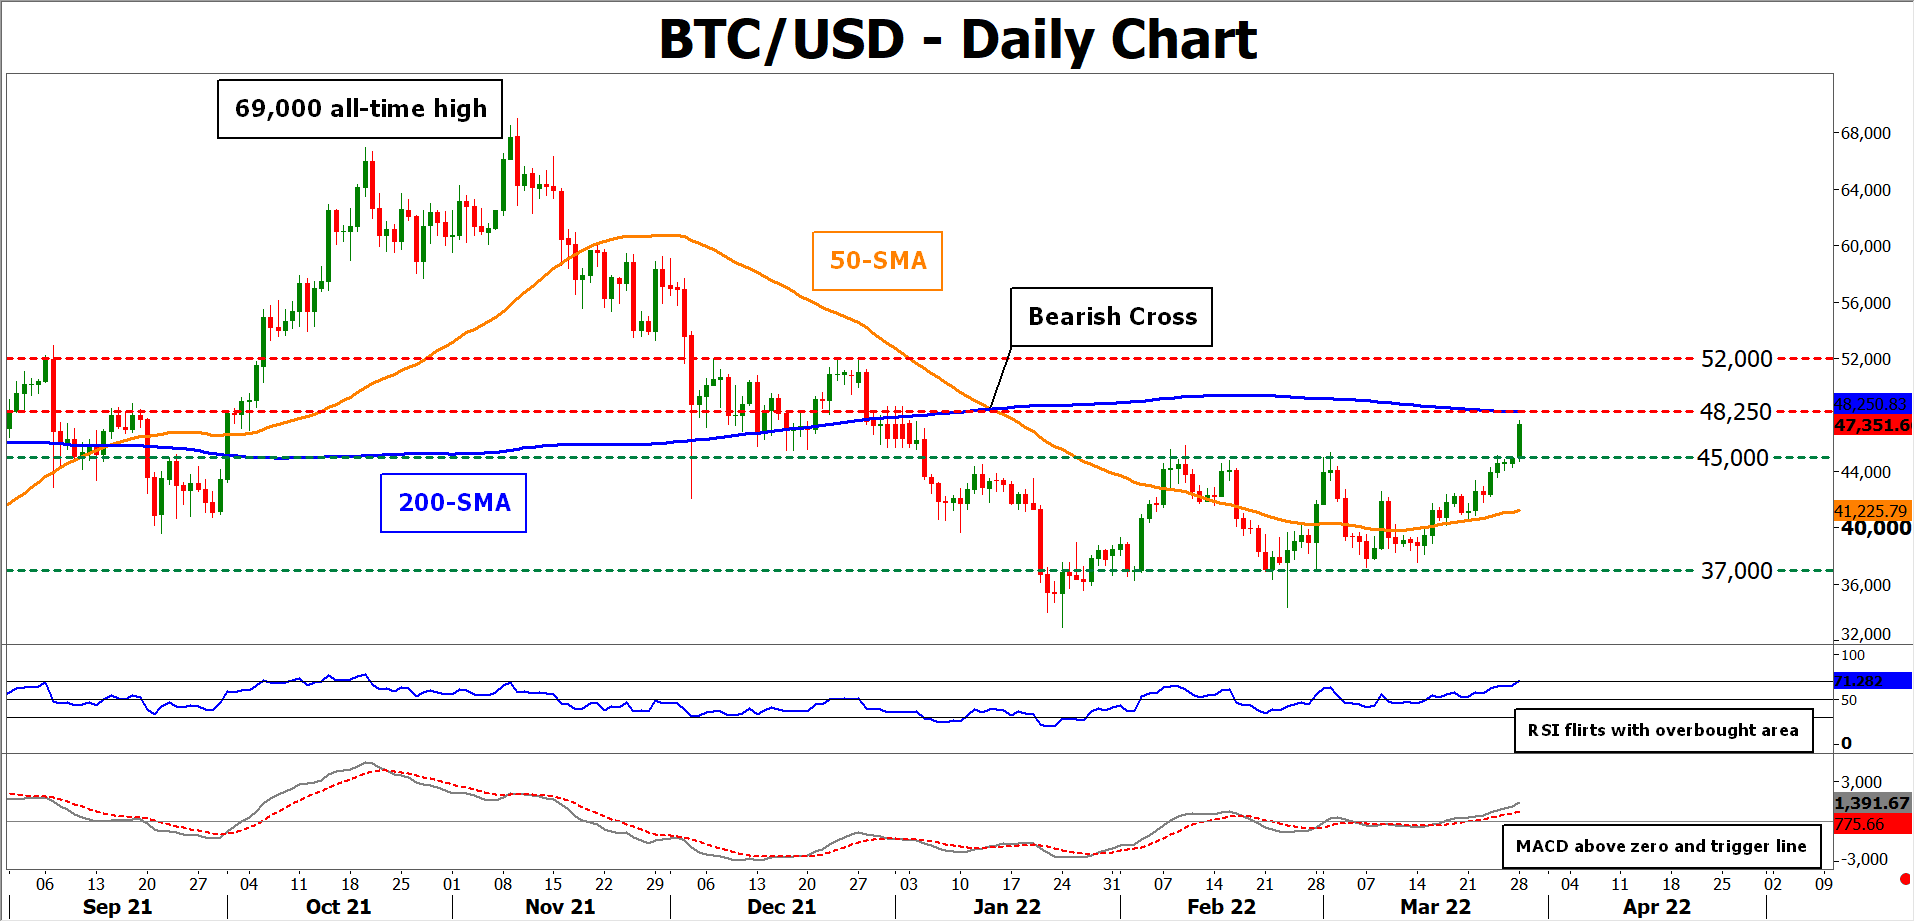
From a technical perspective, Bitcoin’s price profoundly sliced through the upper boundary of its recent sideways move. Should the bullish pressures persist, the price could encounter significant resistance at the $48,250 region, which overlaps with its 200-day simple moving average.
On the other hand, if investors who had entered the market in its recent bull phase liquidate their positions to limit their losses, the crucial $45,000 mark could now act as a supporting floor for the price.
How Will Gas Supply Recuse Affect Eurozone?
What is happening?
The Russian president's announcement that countries "unfriendly" to Moscow must pay for gas deliveries with rubles shows that he's willing to use energy as a weapon in the Ukraine war. It puts the West in a tight spot.
With his demand for payments in the Russian currency, Vladimir Putin has dealt a surprise blow to Western countries still using large volumes of Russian gas for their energy needs.
The Russian president stated the measure would apply to 48 countries deemed "hostile" and include the United States, the UK, and all members of the European Union.
Combined with an extremely growing inflation in Europe, this fact might press the euro to the lowest numbers since 2015.
What are the outcomes?
Europe is the number one continent depending on the Russian gas supply. Data from the European Union Agency for the Cooperation of Energy Regulators shows which countries' energy supply would be most in jeopardy in the case of a Russian gas freeze.
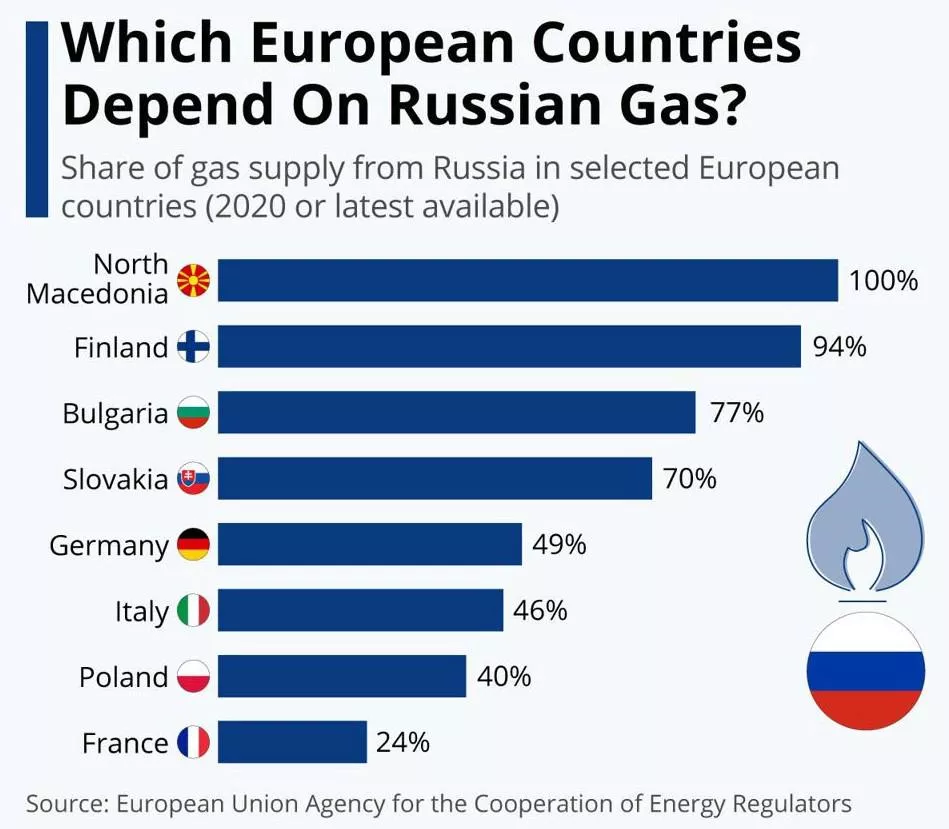
Among the continent's major economies Germany imports around half of its gas from Russia, while France only obtains a quarter of its overall supply. Italy would also be one of the most impacted major economies at a 46% reliance.
Some smaller countries in Europe rely exclusively on Russian gas, namely North Macedonia, Bosnia and Herzegovina, and Moldova. Dependence also exceeded 90% of the gas supply in Finland and Latvia.
As we can see, Russian holds the most significant part of the European gas market. That's why the European Union needs to find the right decision in this situation.
There are three possible outcomes:
- The Union accepts Vladimir's Putin offer and makes future gas payments in Russian rubles. In this case, the EUR will struggle due to falling demand. Moreover, payments for Russian gas purchases are usually so large that the amount of rubles needed cannot currently be secured on foreign exchange markets. Western buyers will most likely need to go via the Bank of Russia to make their payments, essentially undercutting sanctions against the Russian central bank.
- The second option for the European Union is to ease sanctions against Russia and find a compromise about natural resources payments. In this case, the energy crisis in Europe might come to an end. However, it is hard to imagine the Union taking such a step in the conditions of the military conflict on the territory of Ukraine.
- The worst possible case in this situation is to decline the offer. In this case, the energy crisis might cost a lot for the European nation. Inflation, which reached its highest levels, will increase rapidly further. Moreover, some important factories might stop producing goods, and as a result, food deficits might occur.
What about the US LNG?
US president Joe Biden called the European Union to refuse the Russian gas and replace it with US LNG (liquid natural gas). However, there are some issues with it.
- The most important thing is the gas receiving terminals. They are completely different for natural gas and LNG. LNG terminals are less productive. Unfortunately, Europe was not very concerned about constructing new LNG terminals, but at the end of 2021, it scheduled some projects for 2027-2030.
- American companies will undoubtedly sell their LNG to Europe (and now in much larger volumes), but at a spot price. The spot market determines the cost of LNG. In the case of Gazprom (natural gas), Europe buys gas under long-term contracts, which at the end of 2021 were 3-4 times cheaper than local spot prices. For this reason, Europe refused to make new agreements in January 2022. Based on this, we might conclude that the United States is going to sell LNG to Europe at high prices. That's why, the American tankers turned around four times and changed direction either to Europe or Asia, as prices were rapidly changing within two weeks. However, if, at the same time, China, Japan, or Korea offer more for an LNG cube, then Europe may be left without energy.
Conclusion
Based on all of the above, unfortunately, Europe has little chance to avoid an energy crisis so far. Rising inflation adds oil to flames. It’s necessary to tighten the monetary policy and reduce the balance sheet in the future. Nowadays, people are going on strike with the topic of rising prices for raw materials, fuel, and fertilizers. However, Gazprom is 100% fulfilling all its obligations under the contracts. What will happen if Gazprom turns off the pipeline for at least a month? A shutdown of factories, unemployment, the introduction of food cards may happen. Alternatively, the European Central Bank will have to print money and increase inflation to 20%-40%.
Technical analysts
EURUSD, monthly chart
Why do we love technical analysis? Because at moments of total uncertainty, it may tell us the only right way.
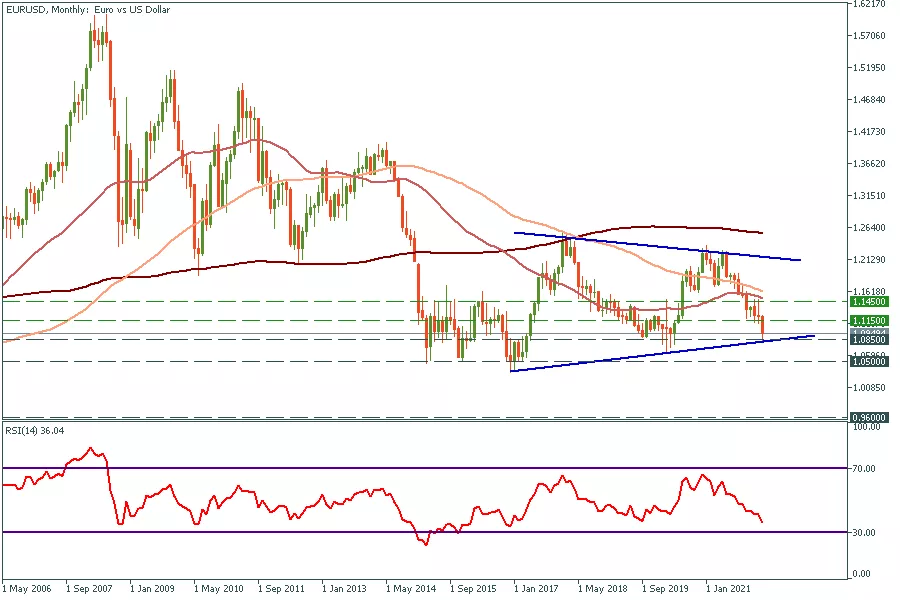
EURUSD is moving in the symmetrical triangle. At the moment, the price is consolidating above the lower border. The most important support level right now is 1.0800. If buyers manage to hold the pair above it, the price might reverse and increase to 1.1150 and even 1.1450.
On the other hand, a breakout of this support will signal a long bear market for EURUSD, and the pair will decline to 1.0500.
AUDUSD Wave Analysis
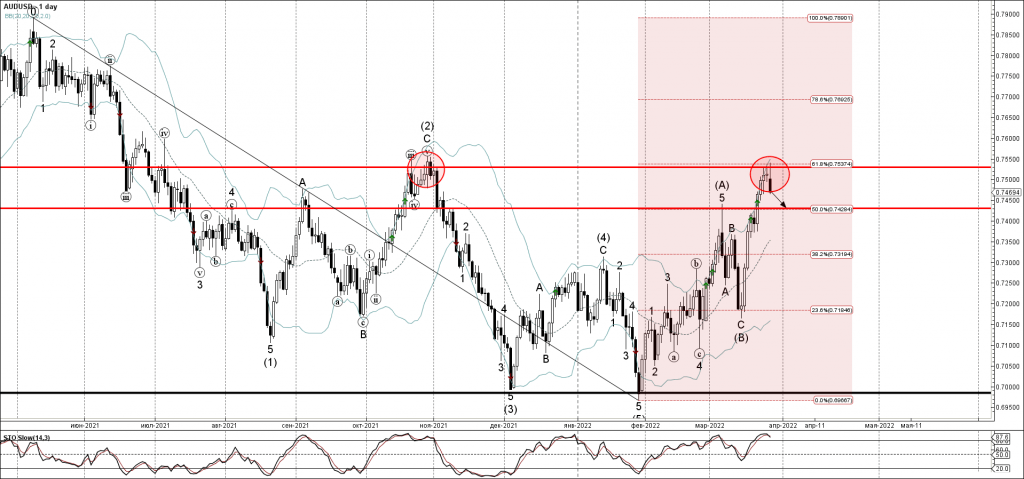
- AUDUSD reversed from resistance level 0.7530
- Likely to fall to support level 0.7430
AUDUSD currency pair recently reversed down from the pivotal resistance level 0.7530 (which has been reversing the price from last October), intersecting with the upper daily Bollinger Band.
The resistance zone near the resistance level 0.7530 was further strengthened by the 61.8% Fibonacci correction of the downward impulse from last year.
AUDUSD can be expected to fall further toward the next support level 0.7430 (top of the previous minor correction (A)).