Sample Category Title
Eco Data 3/29/22
[php_everywhere instance="1"]
Sunset Market Commentary
Markets
This morning, Asian bond markets were overwhelmed by a new wave of panic selling in the wake of Friday’s steep rise in US yields. In order to reinforce its commitment to decouple from broad policy normalization, the Bank of Japan under its Yield Curve Control framework made two offers to buy an unlimited amount of 10-y bonds to prevent the 10-y yield from exceeding the 25 bpn allowed deviation from the 0.0% target. The Bank will make similar buying offers over the next three days. Still 10-y Japanese yield stayed above the 0.25% level. Selling at longer maturities simply continued with the 30-y + 5.4 bps to regain the 1.0% barrier (1.026%), the highest level in more than six years. Sharply higher yields, including cycle peak levels, were also recorded in the likes of Australia (2-y 1.795%, + 21.5 bpn; 10-y, 2.90%, + 12.5 bpn). It even looked that US Treasuries would fall prey to another round of aggressive selling as markets are growing ever more convinced that bold CB action will be needed to arrest runaway inflation. US 2-y yields at some point gained another 14 bps. The 30/5-y sector even temporarily inverted, as investors feared that aggressive, frontloaded Fed action at some point inevitably will affect growth. However, selling in Asia marked some kind of ST exhaustion move. Pressure on bonds eased during the European morning session and this continued as US traders joined. Except for the 2-year (+ 3.5 bps), US bond yields even decline marginally (2-3 bps 10-y/30-y). German yields 2 & 5-year yields early in the session also touched new cycle peaks, the highest since 2014. The German 10-y yield briefly surpassed interim resistance 0.58%%. However, selling gradually faded, too. Yields currently vary between +1.6 bps (2-y) and minus 2.7 bps (30-y). Still, money markets take into account four 25 bps ECB rate hikes by this time next year. Despite the sharp swings even in the core markets, changes in peripheral spreads versus Germany remain negligeable, with Greece (7 bps) the exception to the rule. European equities weren’t unsettled by the sharp swings on bond markets, with the EuroStoxx gaining 1.50%. Is the strong dollar a help? US indices underperform (S&P unchanged). Some tentative easing was also visible in the oil market (brent $112 b/p). Also the likes of wheat, while still at elevated levels, are easing of the peak levels from earlier this month.
Bond market volatility and a widening interest rate support simply is too striking for USD bulls to ignore. The DXY TW index (99.31) is nearing the YTD top. Policy divergency caused USD/JPY to briefly touch to 125 barrier for the first time since August 2015. However, the reversal on the bond markets finally also provided some relief for the yen (USD/JPY currently 123.75). Gains of the dollar against the euro remain modest (1.0970). Sterling failed to extend Friday’s rebound against the euro. EUR/GBP already traded with an upward bias this morning. Later, BoE’s Bailey justified the change to a softer BoE language at this month’s policy meeting referring to a potential slowdown in growth and demand. EUR/GBP is changing hands in the 0.836 area.News Headlines
Russian oil exports plummeted more than 25% in the week from March 17 to March 23 to an average of 3.63m barrels in daily shipments, Bloomberg reported based on industry data. The steep drop comes amid explicit embargoes from a handful of countries including the US and UK. A lot of Russia’s traditional customers and refineries are also self-sanctioning. According to Russian Deputy Prime Minister Novak, the country is still able to sell Ural crude at sharp price discounts. Earlier this month, India scooped up several millions barrels of Russian oil at a price around 20% below global benchmark prices, the Wall Street Journal reported today.
The Czech government will sell the first local euro-denominated bond since August, the Finance Ministry’s issuance calendar for April 2022 showed. Its maturity is remarkably short (2y) given the government has shown preference for a long-term refinancing of this year’s €3.4bn euro-denominated redemptions (loans and bonds). The Ministry of Finance seeks to sell a limited 50 to 100mln euros. This compares to the CZK 19bn of domestic notes it intends to offer next month.
EURCHF Locates Footing at Mid-Bollinger; Bearish Risks Linger
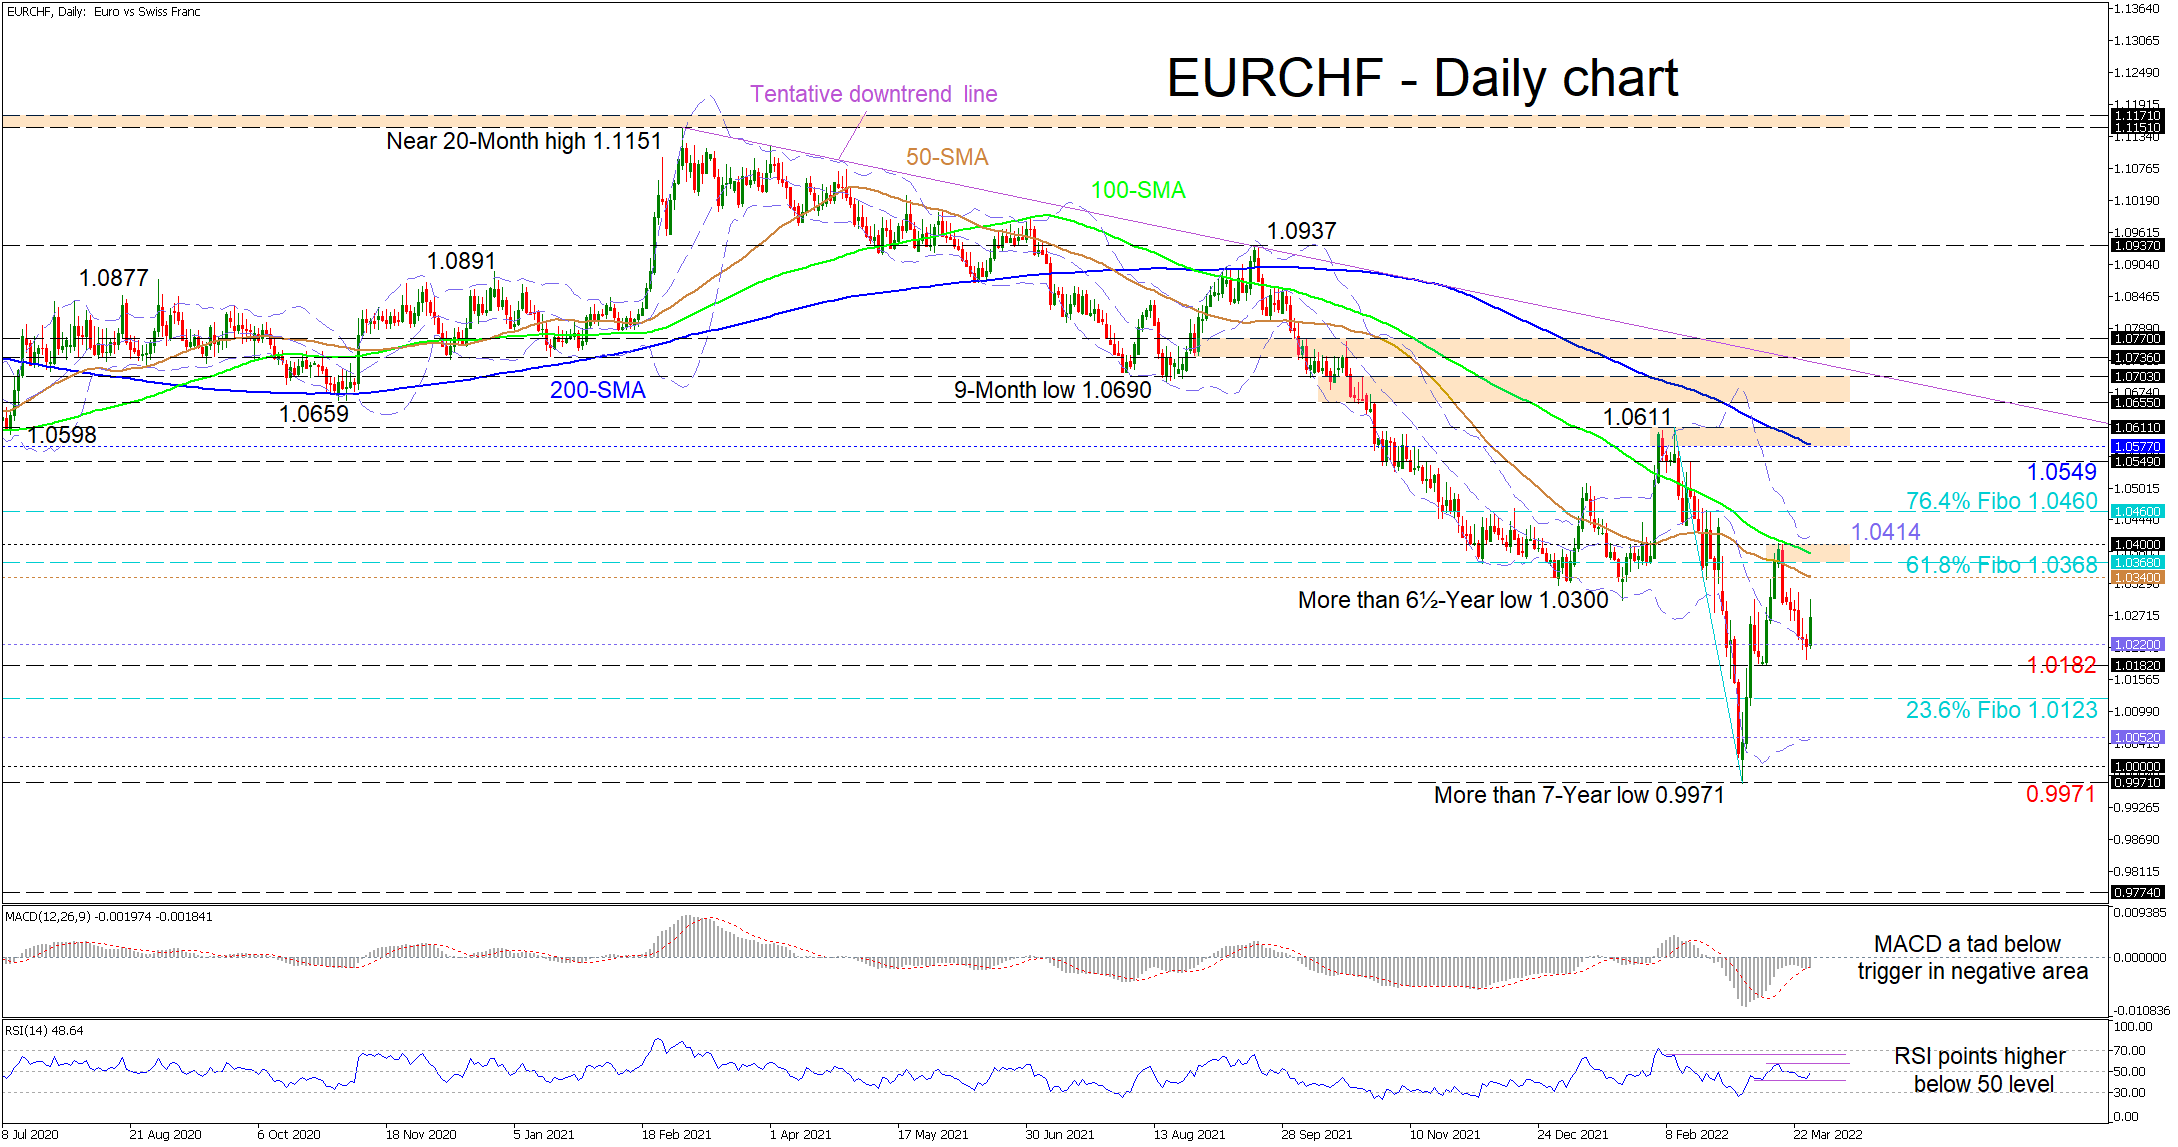
EURCHF forms a foothold off the mid-Bollinger band at 1.0220 after the rally from the more than 7-year low of 0.9971 was curbed by the 1.0400 handle, and the 100-day simple moving average (SMA). Nevertheless, the descending SMAs continue to sponsor the bearish outlook in the pair.
The short-term oscillators are transmitting conflicting signals in directional momentum. The MACD, in the negative region, is holding slightly underneath its red trigger line, while the improving RSI is about to test the 50 neutral threshold.
In the negative scenario, sellers could engage an initial support zone from the mid-Bollinger band at 1.0220 until the mid-March low of 1.0182. Diving past this obstacle, the 1.0123 level, which is the 23.6% Fibonacci retracement of the down leg from 1.0611 until the multi-year low of 0.9971, may try to deter the bears from steering the price towards the lower Bollinger band at 1.0052. Meanwhile, should the price eventually sink deeper, the support zone from the more than 7-year trough of 0.9971 until the 1.0000 handle could draw traders’ attention.
If the pair builds more positive traction off the mid-Bollinger band, resistance could originate at the 50-day SMA at 1.0340 prior to the resistance band between the 61.8% Fibo of 1.0368 and the 1.0400 barricade. Overrunning these barriers and the upper Bollinger band, which is marginally overhead at 1.0414, the bulls could meet the 76.4% Fibo at 1.0460. Should buying interest endure, the price may then confront the 1.0549 high before challenging the 1.0577-1.0611 resistance border, moulded by the 200-day SMA and the February high of 1.0611.
Summarizing, EURCHF’s fresh increase in positive forces has yet to dent the predominant bearish outlook in the pair. In order for upside momentum to gain an edge, the price would need to improve beyond the 1.0400 mark.
EURUSD is Going Down
The major currency pair continues falling. On Monday 28 March, EUR/USD is trading at 1.0951.
The currency market is still interested in the “greenback” as a “safe haven” asset – investors need to hedge risks amid both global geopolitical tensions and the US Fed’s policy.
Earlier, Fed Chairman Jerome Powell said that the benchmark interest rate might leap up 50 basis points if the regulator couldn’t handle inflation.
There will be six more Fed meetings this year and the rate might be raised after each of them.
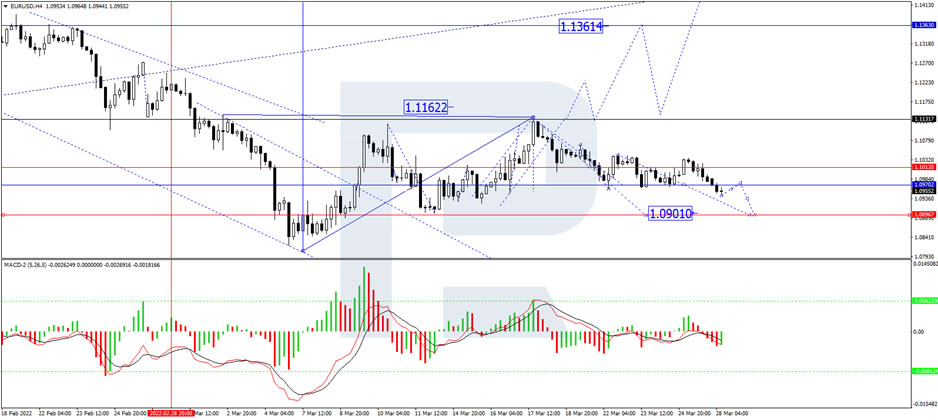
In the H4 chart, having formed a new consolidation range around 1.1010 and broken it to the downside, EUR/USD is expected to test 1.0970 and then complete the correction at 1.0901. Later, the market may form one more ascending wave the target at 1.1133. From the technical point of view, this scenario is confirmed by MACD Oscillator: its signal line is falling below 0 and may soon update the lows.
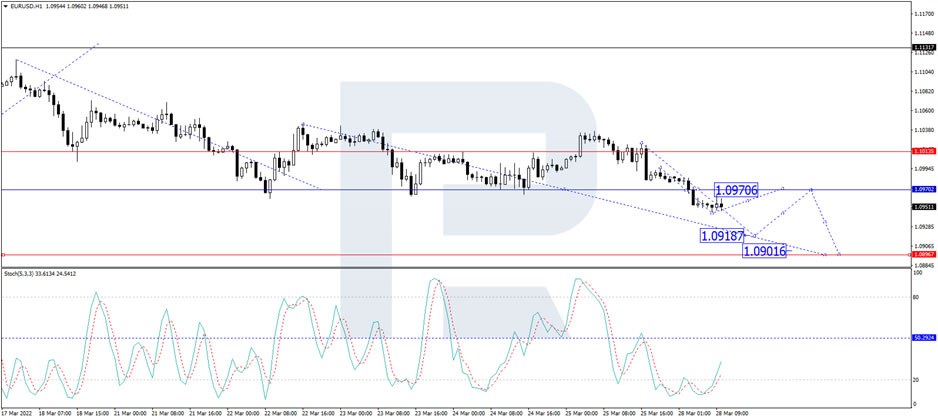
As we can see in the H1 chart, after breaking 1.0970 to the downside, EUR/USD is expected to test it from below and may later form a new ascending structure with the short-term target at 1.0919. After that, the instrument may grow to re-test 1.0970 from below and then resume trading downwards with the target at 1.0900. From the technical point of view, this idea is confirmed by the Stochastic Oscillator: after breaking 20 to the upside, its signal line may continue moving to reach 50. Later, the line may rebound from 50 and start a new decline towards 20.
Aussie Dips ahead of Retail Sales
Aussie slips below 0.75 line
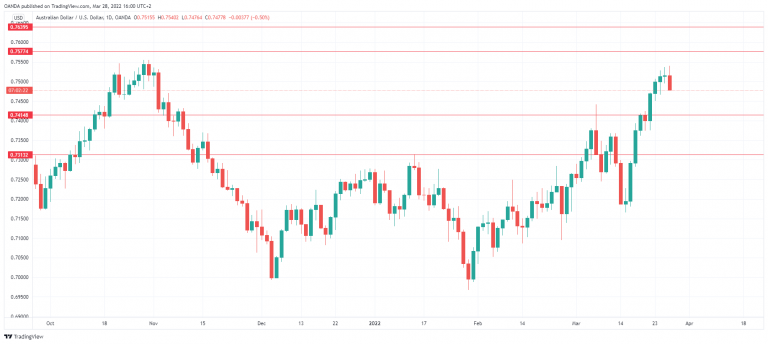
After a strong week, the Australian dollar has reversed directions and dropped below the 0.75 line on Monday. Investors will be keeping an eye on Australian retail sales, which will be released on Tuesday. The markets are expecting a gain of 1.0%, down from 1.8% in January.
The month of March has been kind to the Australian dollar, with sharp gains of 3.47%. The risk currency has not been affected by the tumultuous reaction in the markets to Russia’s invasion of Ukraine, although risk apprehension is certainly higher since the war began.
Investors are also uneasy over the situation in China, which continues to battle an upsurge in Covid cases. The government has imposed rolling lockdowns on Shanghai, which has a population of some 25 million. The property crisis has been overshadowed by the Ukraine crisis, but it hasn’t gone away. Since Evergrande’s default last year, Chinese property developers are finding themselves locked out of the global debt market, and the country’s third-largest developer missed two bond payments on Friday.
There is plenty of risk apprehension to go around, but the Aussie’s savior has been the resource-based economy of the Lucky Country, as the range of commodities that Australia exports have been in huge demand as prices continue to head higher.
Australia releases its annual budget on Tuesday, and the surge in commodities will allow the Morrison government to narrow its budget deficit and also give out some goodies, as it eyes a federal election later this year. The budget is expected to include help for homeowners and a temporary reduction in the tax on petrol.
AUD/USD Technical
- 0.7414 is the first line of support. Below, there is support at 0.7313
- There is resistance at 0.7577 and 0.7639
Dollar May be Giving Up Reserve Positions, But Not the Price
There has been a lot of talk lately about the decline of the US dollar’s reserve status. However, investors and traders should separate long-term trends from short-term market impulses.
Reserve fund managers often prefer to refrain from active selling so as not to cause unnecessary market turbulence, so all reserve trends are stretched out over decades.
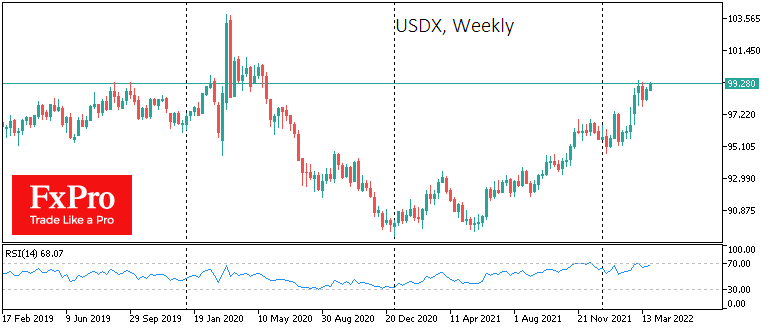
As long as there is no real threat to the existence of the dollar and the solvency of the US government, managers will avoid making active moves to sell dollar assets. And all the revolutionary changes, such as switching to national currencies, will only result in CBs buying fewer new dollars. But it has little effect on the exchange rate.
Right now, we are seeing the opposite picture, as the main competitors are under pressure.
Investors are getting rid of the Japanese yen as the Bank of Japan accelerates its currency printing to buy bonds out of the market to stem rising yields. The local government is overburdened with debt, and the economy is still stalling. The only market solution is a devaluation of the yen, which would make exports from Japan more competitive and boost domestic spending.
The single currency is suffering from a spike in energy prices and economic problems related to the war in Ukraine. Trading below 1.1000, the EURUSD pair is now where it was heading for the last six months before the pandemic.
The medium-term outlook for the dollar is largely influenced by the extent to which the Fed will be able to implement policy tightening. More accurately, how Fed policy compares with the policy of the Bank of Japan, the ECB, or another major central bank.
The Fed is clearly acting with greater amplitude, setting itself up for 7 rate hikes this year, which is far more than one would expect from Japan or the eurozone. Moreover, the US remains much further away from the war in Ukraine in business and trade terms than its biggest competitors, which means it can continue to benefit from capital inflows as a haven.
USD/JPY Mid-Day Outlook
Daily Pivots: (S1) 121.37; (P) 121.90; (R1) 122.63; More...
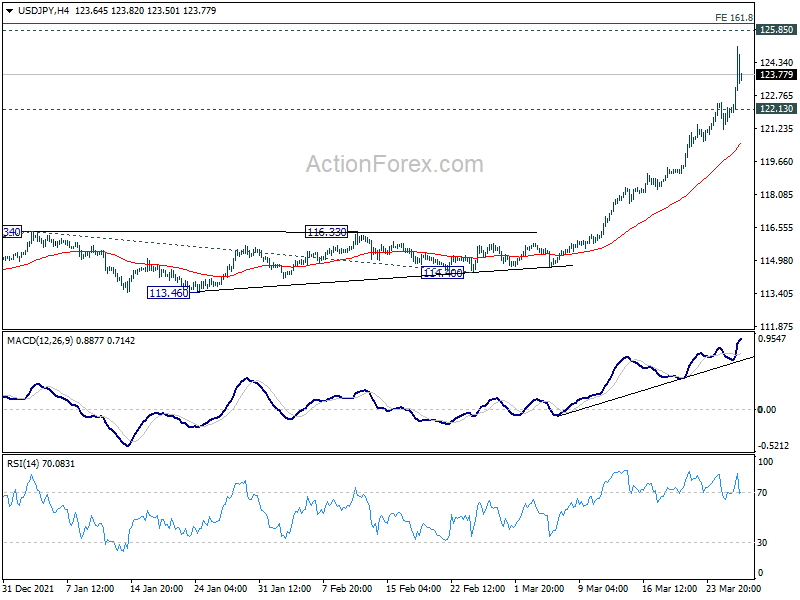
Intraday bias in USD/JPY stays on the upside at this point. Current up trend should target 161.8% projection of 109.11 to 116.34 from 114.40 at 126.09, which is close to 125.85 long term resistance. On the downside, below 122.13 minor support will turn intraday bias neutral and bring consolidations first, before staging another rally.
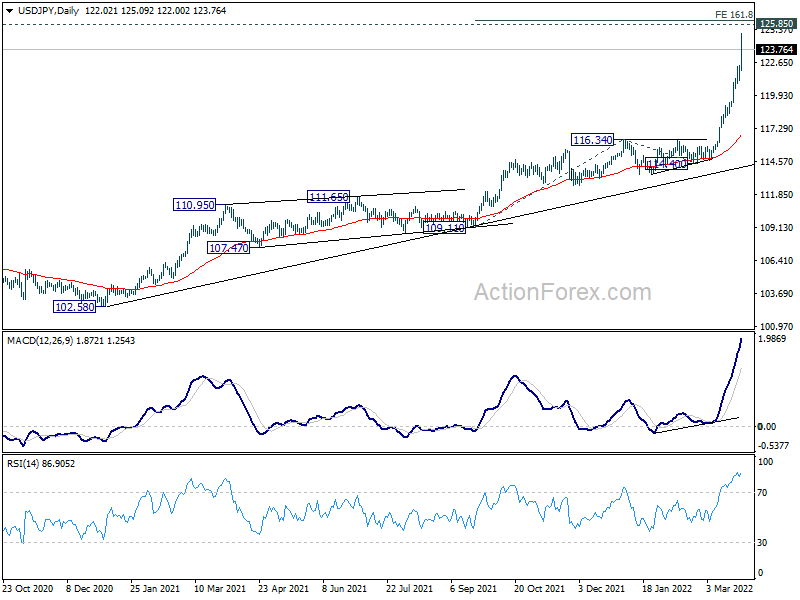
In the bigger picture, up trend from 98.97 (2016 low) in in progress for retesting 125.85 (2015 high). Sustained break there will confirm long term up trend resumption. Next target will be 61.8% projection of 75.56 (2011 low) to 125.85 (2015 high) from 98.97 at 130.04. This will now remain the favored case as long as 116.34 resistance turned support holds.
USD/CHF Mid-Day Outlook
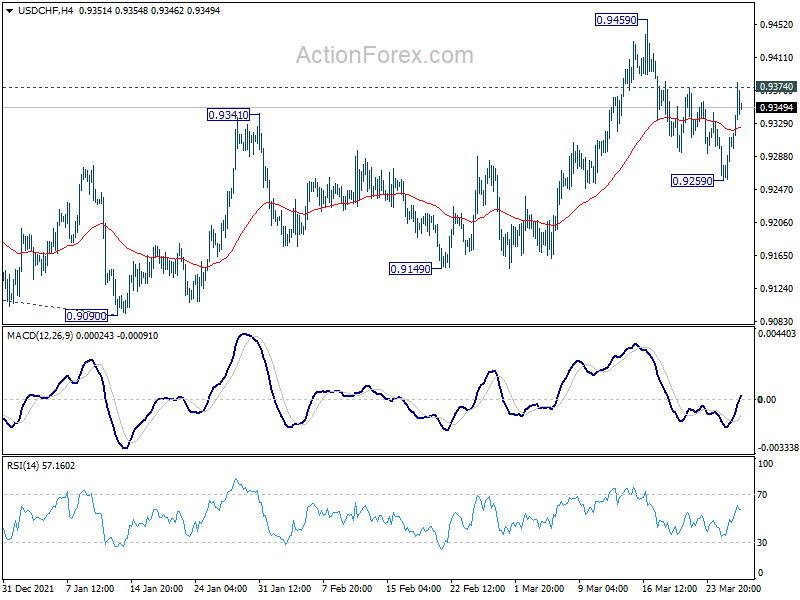
Daily Pivots: (S1) 0.9273; (P) 0.9294; (R1) 0.9327; More....
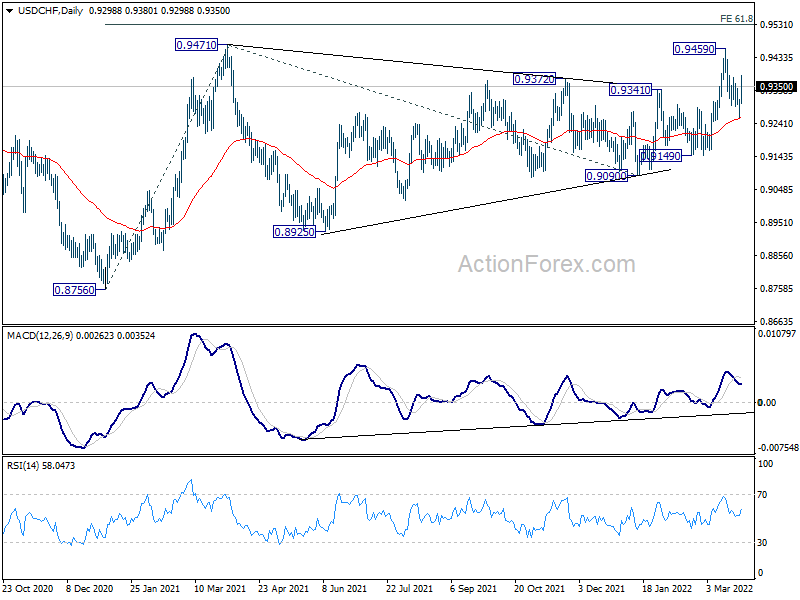
Intraday bias in USD/CHF remains neutral for the moment. On the upside, break of 0.9374 minor resistance will suggest that the pull back from 0.9459 has completed. Support from 55 day EMA will also retain near term bullishness. Intraday bias will be back on the upside for 0.9459 first. Break will resume the rise from 0.8756 to 61.8% projection of 0.8756 to 0.9471 from 0.9090 at 0.9532. However, sustained break of 55 day EMA (now at 0.9256) will target 0.9149 support.
In the bigger picture, medium term outlook will be neutral at best as long as 0.9471 resistance holds. Larger down trend could still extend through 0.8756 (2021 low). However, firm break of 0.9471 will argue that whole down trend form 1.0342 (2016 high), has completed with waves down to 0.8756. A medium term up trend should be set up to target 1.0237/0342 resistance zone.
EUR/USD Mid-Day Outlook
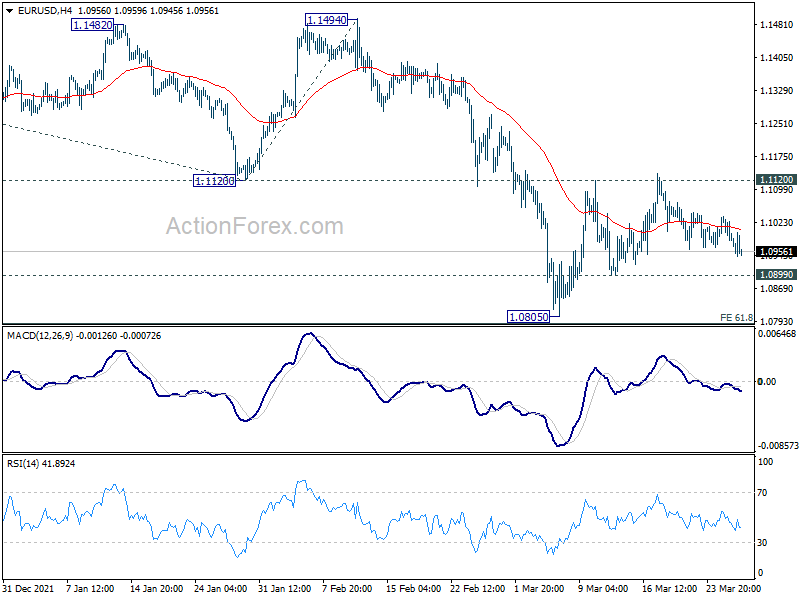
Daily Pivots: (S1) 1.0964; (P) 1.1001; (R1) 1.1021; More...
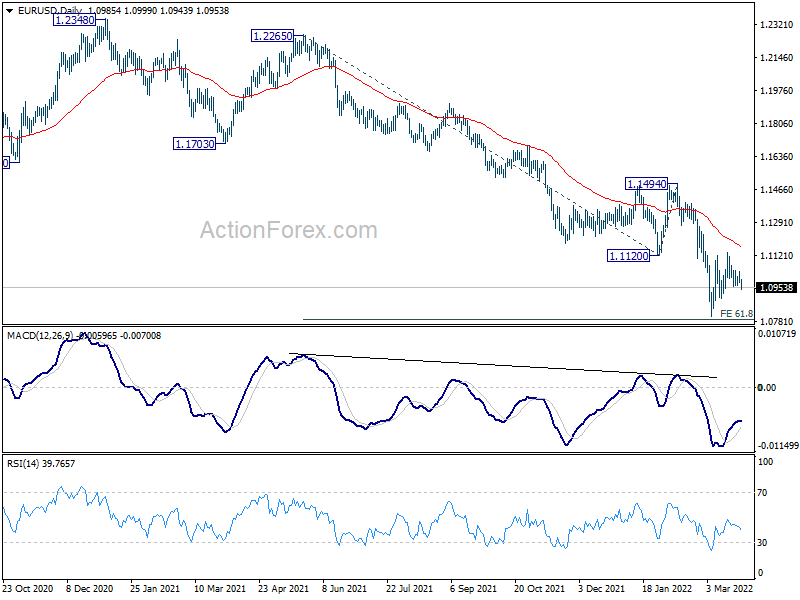
Intraday bias in EUR/USD remains neutral and outlook is unchanged. Further decline is still in favor with 1.1120 support turned resistance intact. On the downside, break of 1.0899 minor support will target 61.8% projection of 1.2265 to 1.1120 from 1.1494 at 1.0786. However, firm break of 1.1120 will confirm short term bottoming at 1.0805. Bias will be back on the upside for 55 day EMA (now at 1.1178) and above.
In the bigger picture, the decline from 1.2348 (2021 high) is expected to continue as long as 1.1494 resistance holds. Firm break of 1.0635 (2020 low) will raise the chance of long term down trend resumption and target a retest on 1.0339 (2017 low) next. Nevertheless, break of 1.1494 will maintain medium term neutral outlook, and extending term range trading first.
GBP/USD Mid-Day Outlook
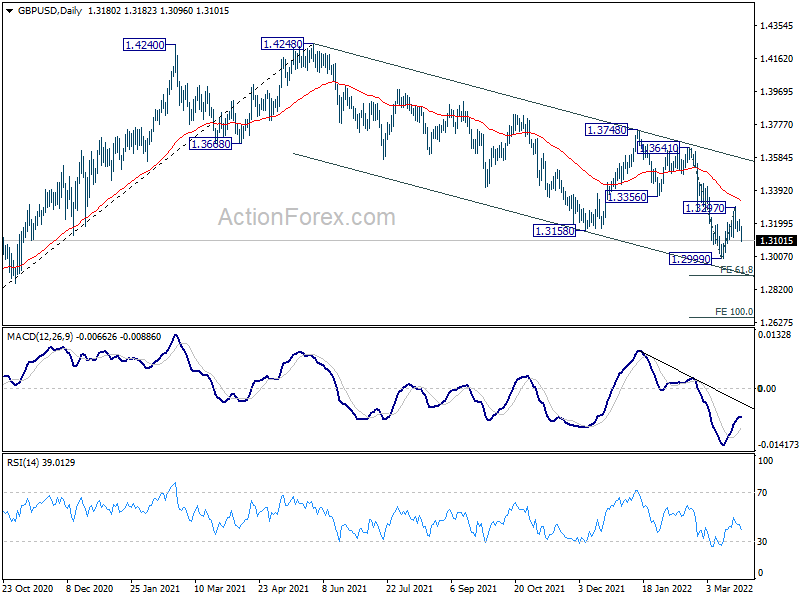
Daily Pivots: (S1) 1.3153; (P) 1.3189; (R1) 1.3219; More...
GBP/USD's break of 1.3119 minor support argues that corrective rebound from 1.2999 has completed at 1.3297 already. Failure to hit 55 day EMA keeps near term outlook bearish. Intraday bias is back on the downside for 1.2999 low first. Break will resume larger down trend from 1.4248. Next near term target is 61.8% projection of 1.3641 to 1.2999 from 1.3297 at 1.2900, and then 100% projection at 1.2655. For now, risk will stay on the downside as long as 1.3297 resistance holds, in case of recovery.
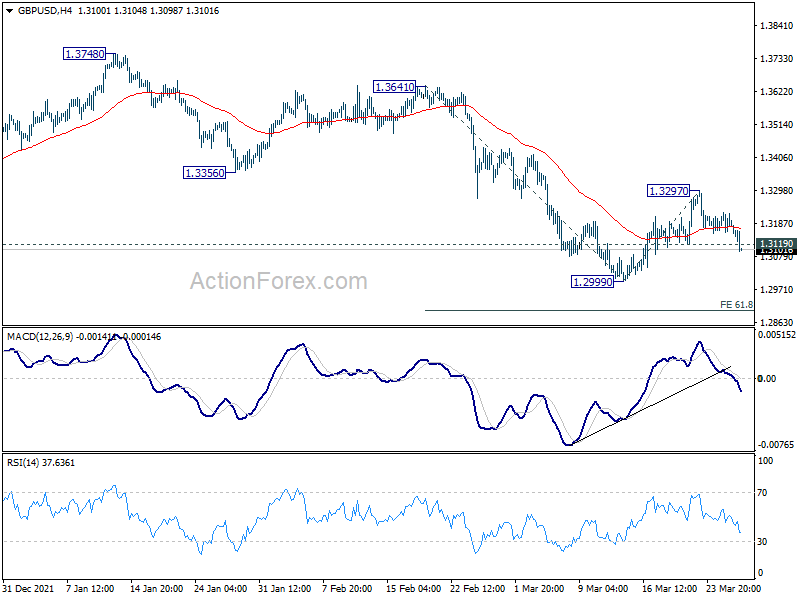
In the bigger picture, current development suggests that the up trend from 1.1409 (2020 low) has completed at 1.4248. Decline from 1.4248 could still be a corrective move, or it could be the start of a long term down trend. In either case, deeper decline would be seen back to 61.8% retracement of 2.1161 to 1.1409 at 1.2493. In any case, break of 1.3748 resistance is needed to indicate medium term bottoming, or outlook will stay bearish.