

Sample Category Title
USD/CAD Daily Outlook
Daily Pivots: (S1) 1.2444; (P) 1.2499; (R1) 1.2531; More...
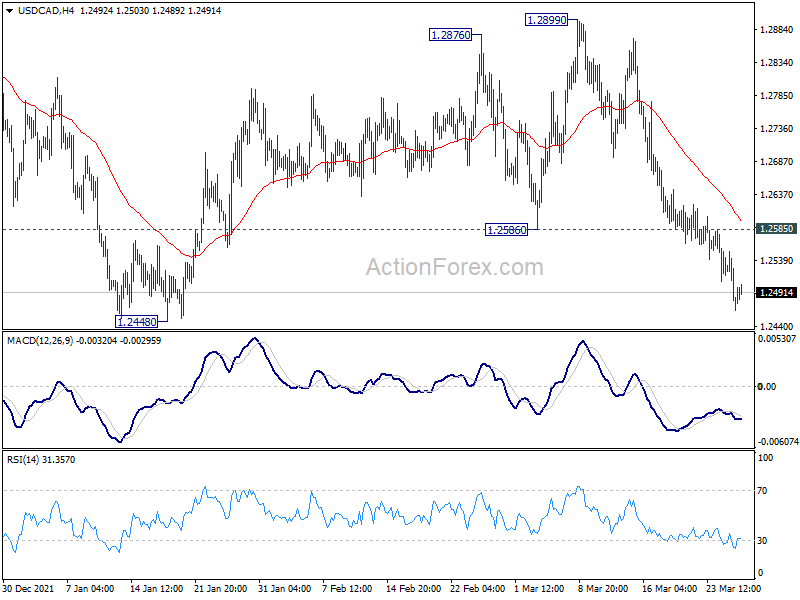
Intraday bias in USD/CAD remains on the downside for 1.2448 support. Sustained break there will argue that whole corrective pattern from 1.2005 has completed and bring retest of this low. On the upside, above 1.2585 minor resistance will turn intraday bias neutral and bring consolidations first, before staging another fall.
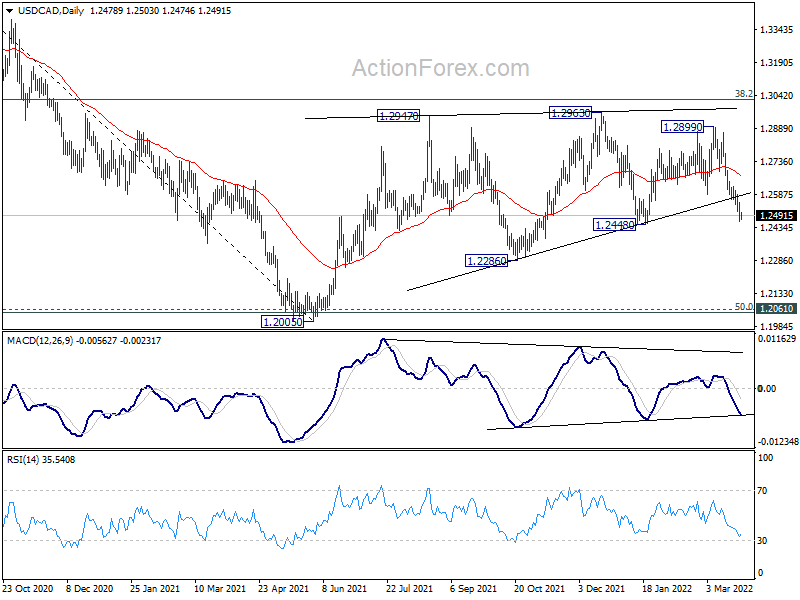
In the bigger picture, focus stays on 38.2% retracement of 1.4667 (2020 high) to 1.2005 (2021 low) at 1.3022. Sustained break there should confirm that the down trend from 1.4667 has completed after defending 1.2061 long term cluster support. Further rise would then be seen towards 61.8% retracement at 1.3650. However, rejection by 1.3022 will maintain medium term bearishness. Break of 1.2005 will resume the down trend from 1.4667 and that carries larger bearish implications too.
AUD/USD Daily Report
Daily Pivots: (S1) 0.7495; (P) 0.7516; (R1) 0.7537; More...
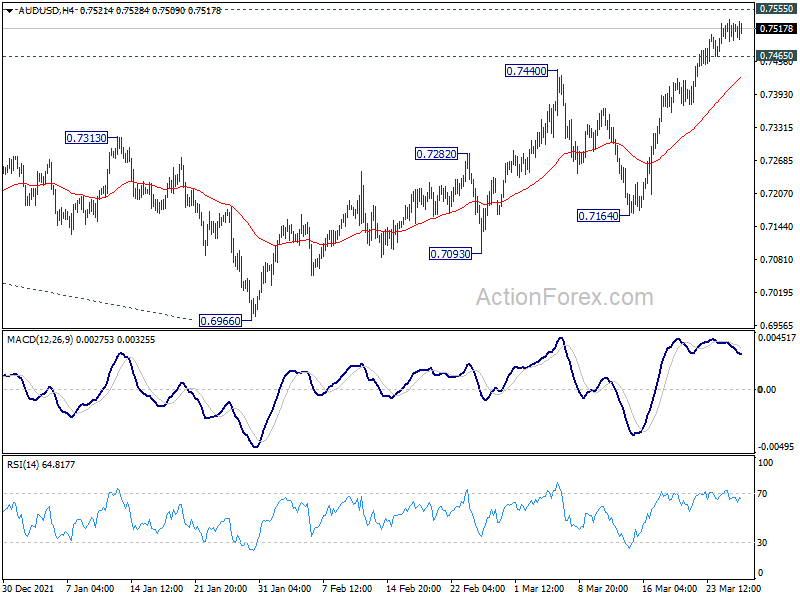
Despite loss of upside momentum as seen in 4 hour MACD, intraday bias in AUD/USD stays on the upside for 0.7555 resistance. Decisive break there should confirm that whole corrective decline from 0.8006 has completed at 0.6966. Further rise should then be seen back to retest 0.8005. On the downside, below 0.7465 minor support will turn intraday bias neutral and bring consolidations first.
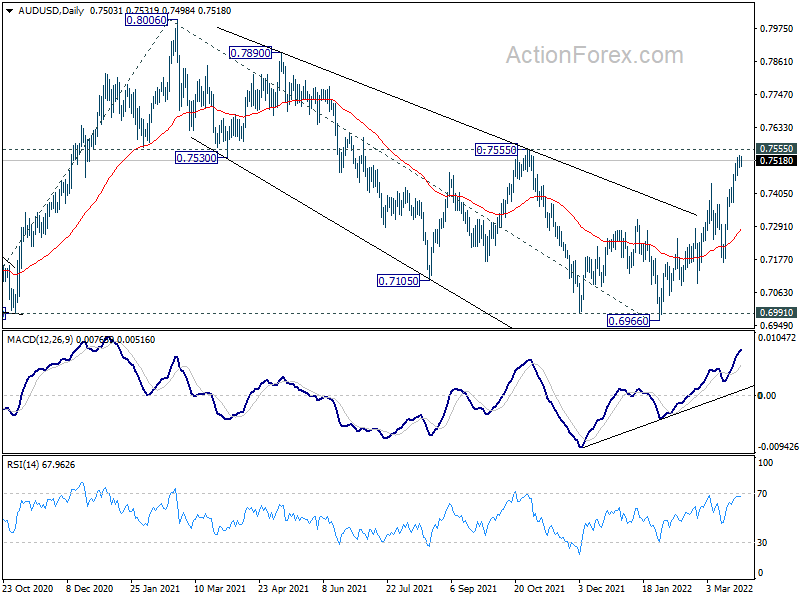
In the bigger picture, correction from 0.8006 could have completed at 0.6966, after drawing support from 0.6991. That is, up trend from 0.5506 (2020 low) might be ready to resume. Firm break of 0.8006 will target 61.8% projection of 0.5506 to 0.8006 from 0.6966 at 0.8511 next. This will remain the favored case as long as 0.7164 support holds.
EUR/USD Daily Outlook
Daily Pivots: (S1) 1.0964; (P) 1.1001; (R1) 1.1021; More...
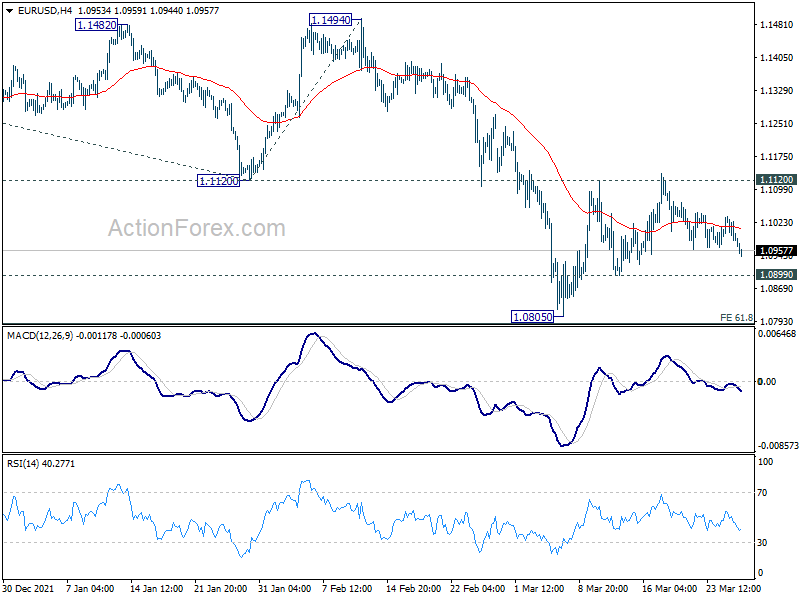
Intraday bias in EUR/USD remains neutral for the moment. Further decline is still in favor with 1.1120 support turned resistance intact. On the downside, break of 1.0899 minor support will target 61.8% projection of 1.2265 to 1.1120 from 1.1494 at 1.0786. However, firm break of 1.1120 will confirm short term bottoming at 1.0805. Bias will be back on the upside for 55 day EMA (now at 1.1178) and above.
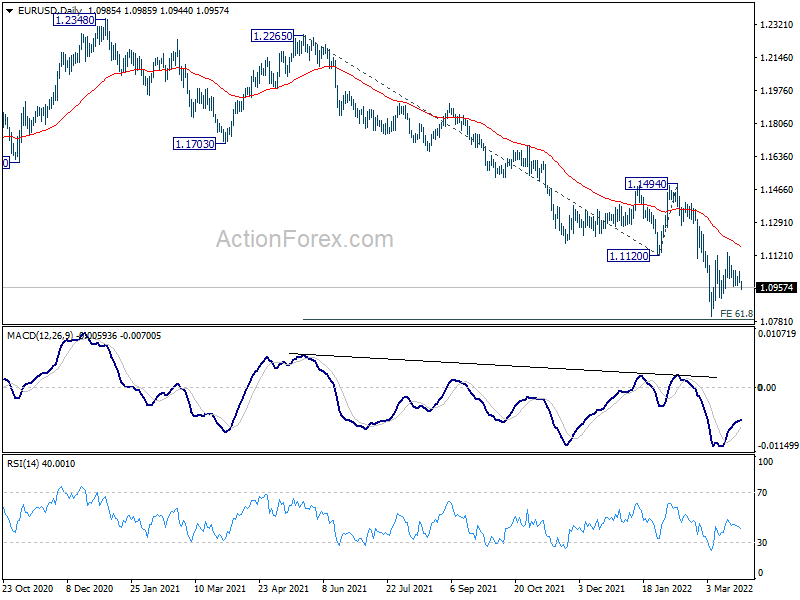
In the bigger picture, the decline from 1.2348 (2021 high) is expected to continue as long as 1.1494 resistance holds. Firm break of 1.0635 (2020 low) will raise the chance of long term down trend resumption and target a retest on 1.0339 (2017 low) next. Nevertheless, break of 1.1494 will maintain medium term neutral outlook, and extending term range trading first.
GBP/USD Daily Outlook
Daily Pivots: (S1) 1.3153; (P) 1.3189; (R1) 1.3219; More...
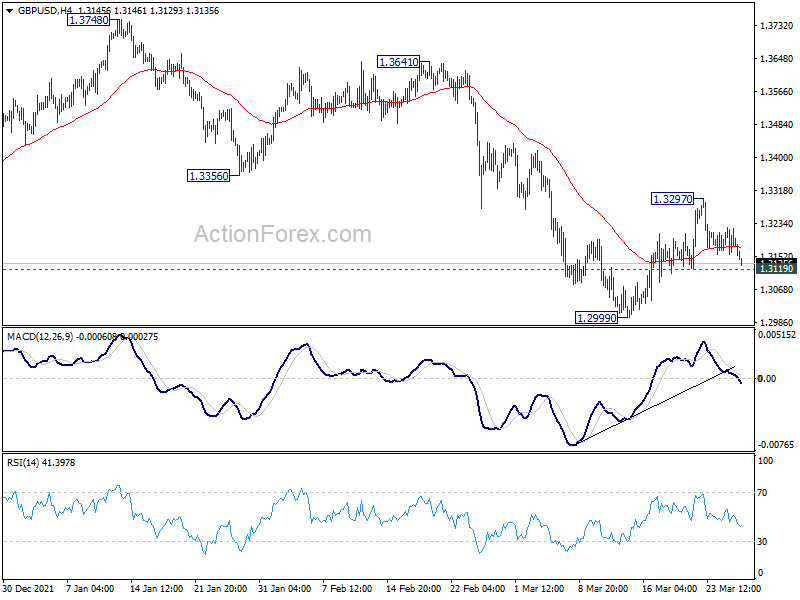
Intraday bias in GBP/USD remains neutral for the moment. On the upside, above 1.3297 will resume the rebound from 1.2999 to 55 day EMA (now at 1.3340). On the downside, below 1.3119 minor support will turn bias back to the downside for retesting 1.2999 low. Firm break there will resume larger down trend from 1.4248.
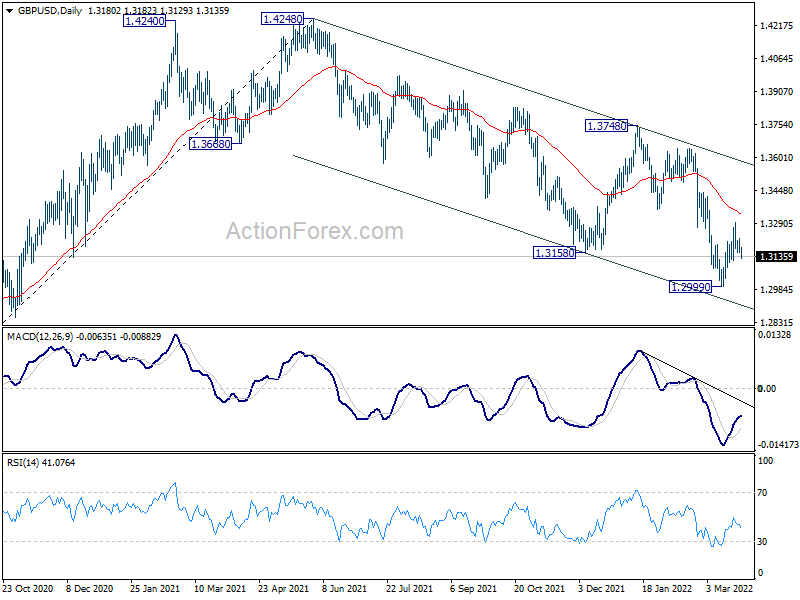
In the bigger picture, current development suggests that the up trend from 1.1409 (2020 low) has completed at 1.4248. Decline from 1.4248 could still be a corrective move, or it could be the start of a long term down trend. In either case, deeper decline would be seen back to 61.8% retracement of 2.1161 to 1.1409 at 1.2493. In any case, break of 1.3748 resistance is needed to indicate medium term bottoming, or outlook will stay bearish.
USD/CHF Daily Outlook
Daily Pivots: (S1) 0.9273; (P) 0.9294; (R1) 0.9327; More....
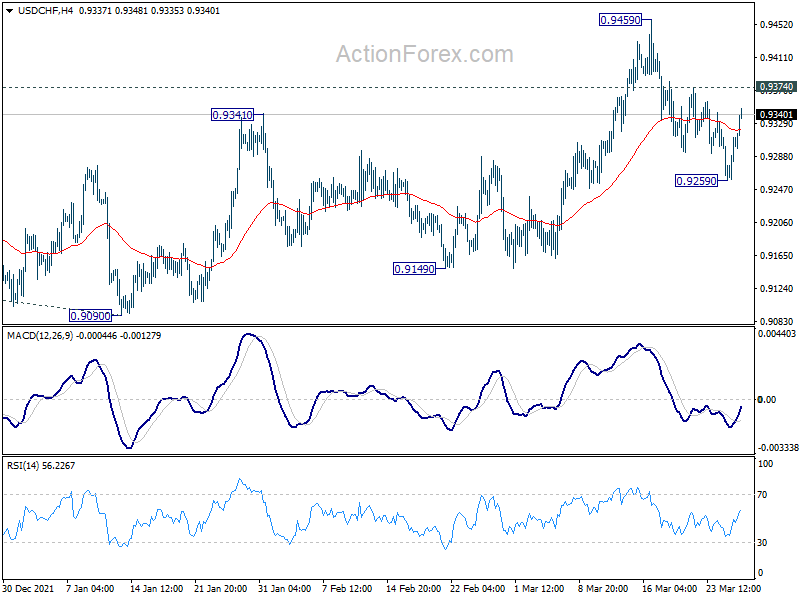
Intraday bias in USD/CHF remains neutral at this point. On the upside, break of 0.9374 minor resistance will suggest that the pull back from 0.9459 has completed. Support from 55 day EMA will also retain near term bullishness. Intraday bias will be back on the upside for 0.9459 first. Break will resume the rise from 0.8756 to 61.8% projection of 0.8756 to 0.9471 from 0.9090 at 0.9532. However, sustained break of 55 day EMA (now at 0.9256) will target 0.9149 support.
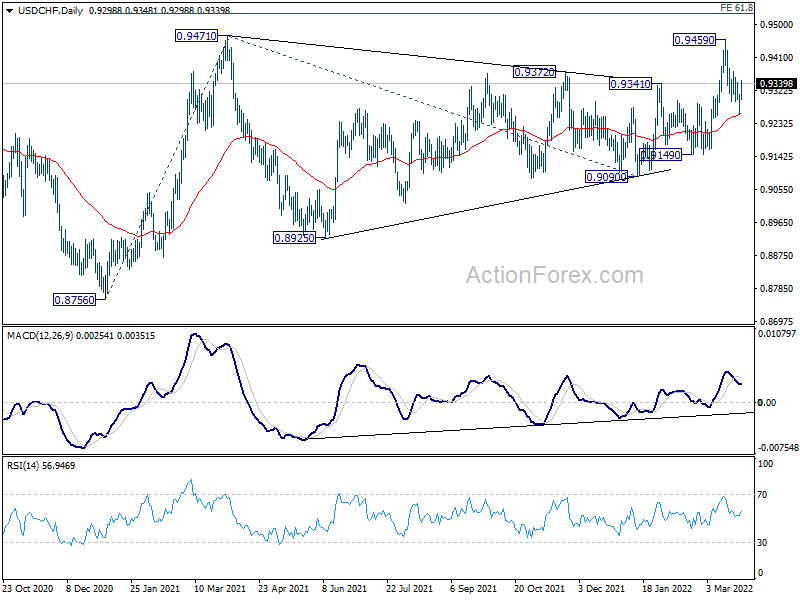
In the bigger picture, medium term outlook will be neutral at best as long as 0.9471 resistance holds. Larger down trend could still extend through 0.8756 (2021 low). However, firm break of 0.9471 will argue that whole down trend form 1.0342 (2016 high), has completed with waves down to 0.8756. A medium term up trend should be set up to target 1.0237/0342 resistance zone.
USD/JPY Daily Outlook
Daily Pivots: (S1) 121.37; (P) 121.90; (R1) 122.63; More...
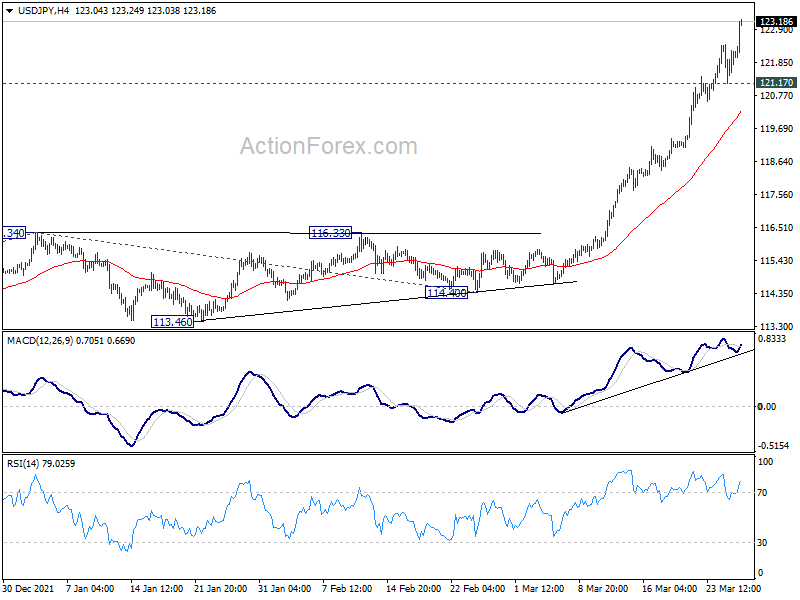
USD/JPY's rally continues today and intraday bias remains on the upside. Current up trend should target 161.8% projection of 109.11 to 116.34 from 114.40 at 126.09, which is close to 125.85 long term resistance. On the downside, below 121.17 minor support will turn intraday bias neutral and bring consolidations first, before staging another rally.
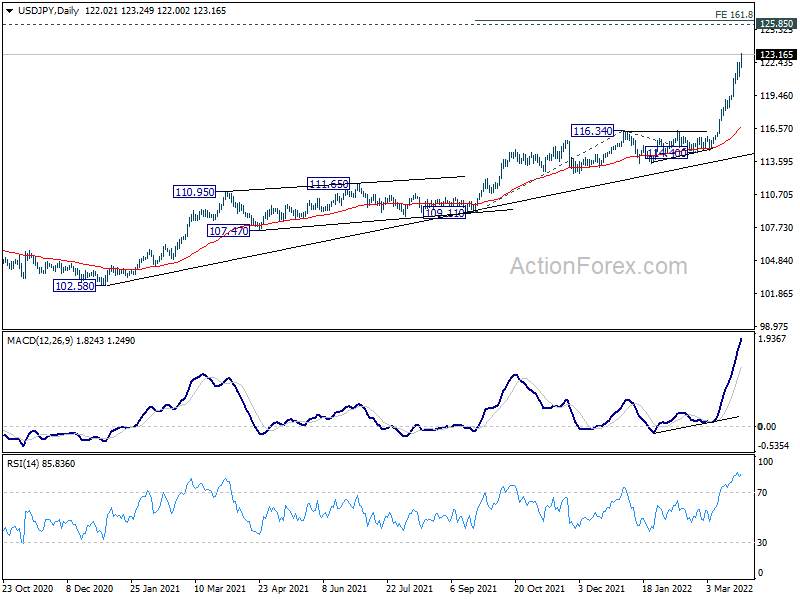
In the bigger picture, up trend from 98.97 (2016 low) in in progress for retesting 125.85 (2015 high). Sustained break there will confirm long term up trend resumption. Next target will be 61.8% projection of 75.56 (2011 low) to 125.85 (2015 high) from 98.97 at 130.04. This will now remain the favored case as long as 116.34 resistance turned support holds.
Yen Selloff Resumes, Euro Follows, Bitcoin Breakout
Yen's selloff resumes as another week starts on rising treasury yields while Asian stocks are mixed. European majors are also under some selling pressure, with Euro, Sterling and Swiss Franc steady among themselves. Meanwhile, Australian Dollar is performing well together with Dollar, trailed by Canadian and New Zealander. Gold dips notably on Dollar strength and oil price turns softer too. Bitcoin and ethereum ride on buying over the weekend and break through near term resistance.
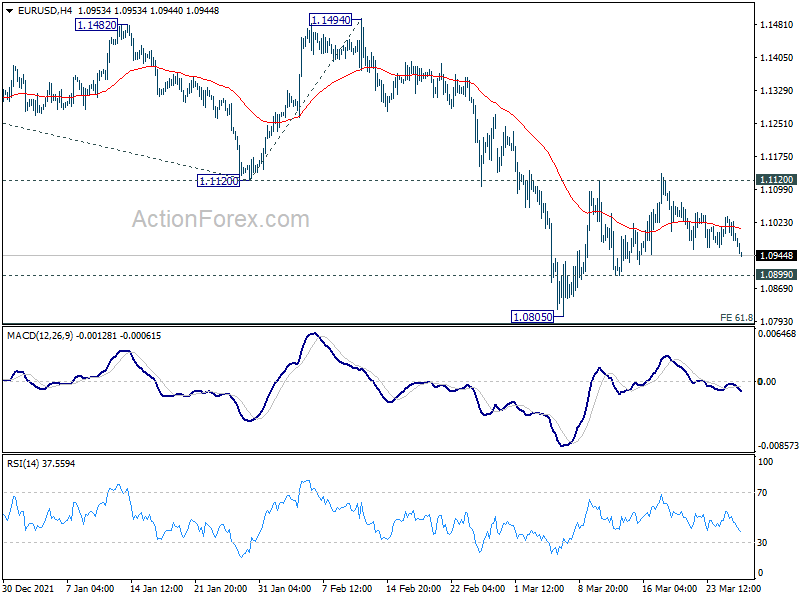
Technically, EUR/USD is extending near term pull back and it's heading back towards 1.0899 minor support. Break there should confirm completion of rebound from 1.0805 and bring retest of this low. Also, this should confirm rejection by 1.1120 support turned resistance, and thus, should set the stage for larger down trend resumption. To solidify Euro's weakness, EUR/CHF should also break through 1.0184 support to extend the fall from 1.0400 to retest 0.9970 low.
In Asia, at the time of writing, Nikkei is down -0.58%. Hong Kong HSI is up 1.11%. China Shanghai SSE is down -0.07%. Singapore Strait Times is up 0.37%. Japan 10-year JGB yield is up 0.146 at 0.255.
Australian NAB quarterly business confidence dropped to 14, still optimistic growth picture
Australia NAB Quarterly business confidence dropped from 19 to 14 in Q1. Current business conditions dropped from 14 to 9. Business conditions for the next three months dropped from 29 to 21. Business conditions for the next 12 months dropped from 36 to 34. trading conditions dropped from 19 to 12. Profitability conditions dropped from 13 to 7. Employment conditions dropped from 9 to 8. Capex plans for the next 12 months dropped from 34 to 33.
"Overall, the survey continues to paint an optimistic picture on growth – including the potential for a pickup in business investment. This comes despite global events and still some disruption from the virus. That said, the challenges for both business and policy makers remain clear with price pressures continuing to build."
AUD/NZD extending rally, AUD/CAD to follow
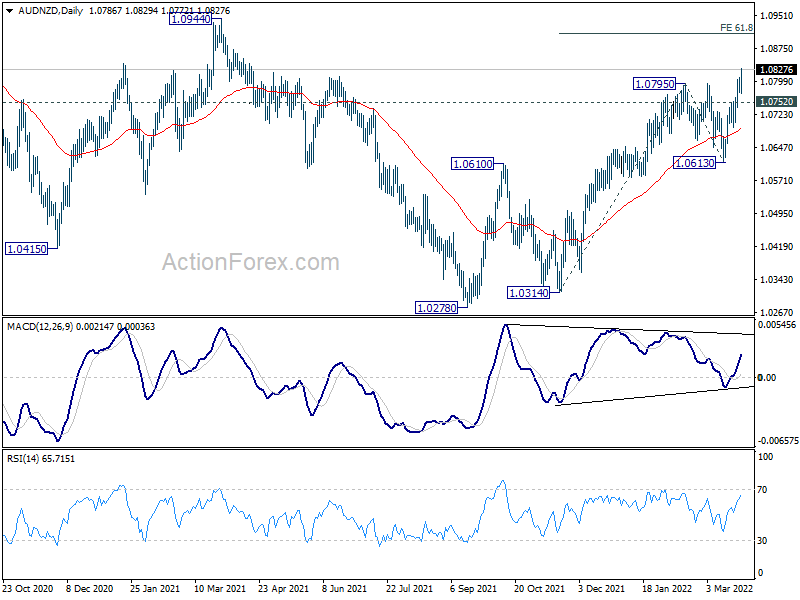
Aussie is outperforming other commodity currencies in the past two weeks. AUD/NZD's rally extends today to as high as 1.0825 so far. The break of 1.0795 resistance confirms resumption of whole rise from 1.0278. Near term outlook will stay bullish as long as 1.0752 support holds, next target is 61.8% projection of 1.0314 to 1.0795 from 1.0613 at 1.0910.
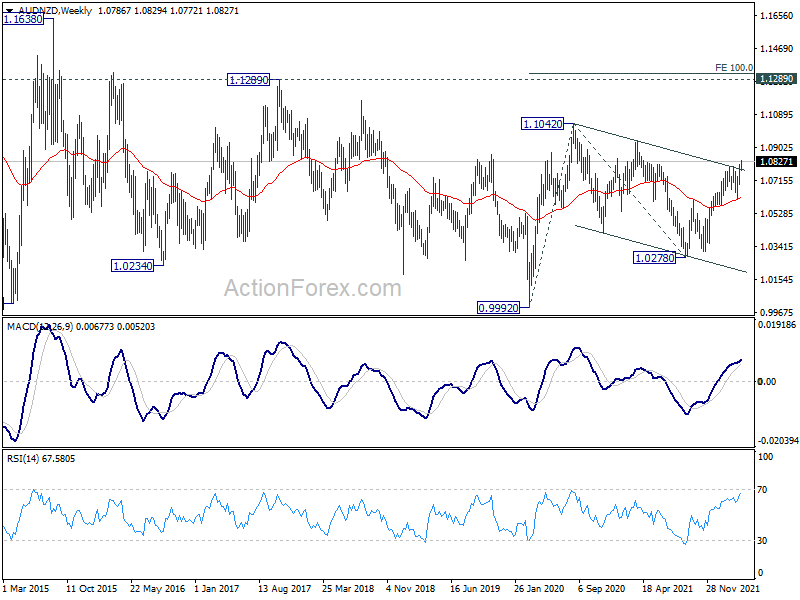
More importantly, the strong support from 55 week EMA suggests some underlying medium term bullishness. The break of channel resistance from 1.1042 also argues that the correction from there has completed with three waves down to 1.0278. Rise from 0.9992 (2020 low) is likely resuming through 1.1042 towards 1.1289 long term resistance.
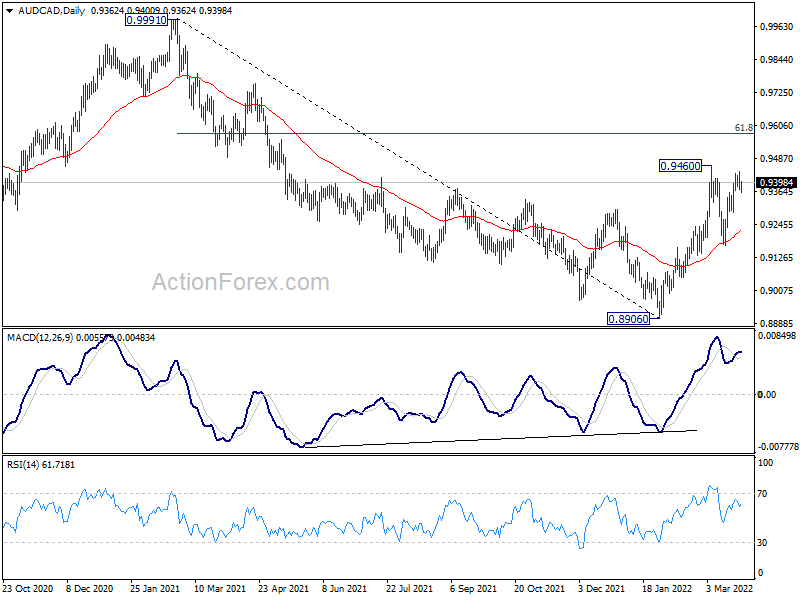
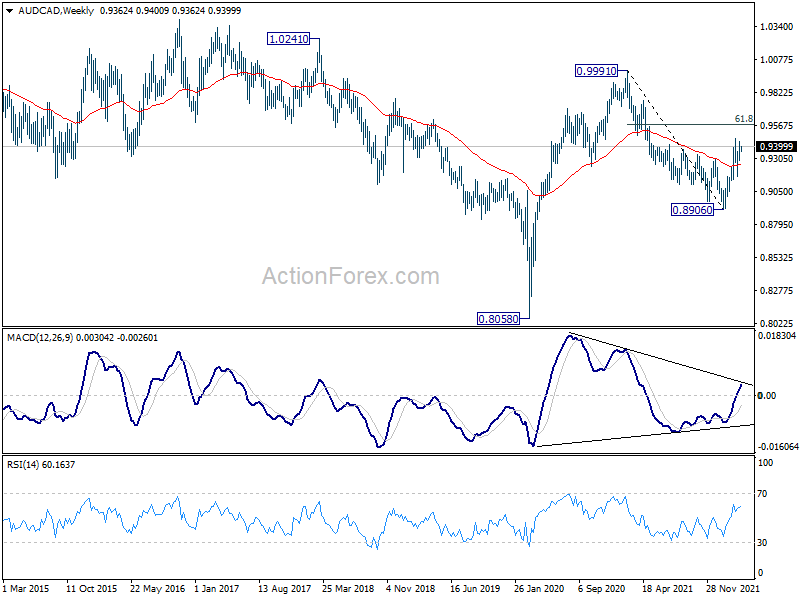
Meanwhile, AUD/CAD is still capped below 0.9460 short term top for now. But the strong support from 55 day EMA gives upside breakout a favor. Break of 0.9460 will resume the rebound from 0.8960 to 61.8% retracement of 0.9991 to 0.8906 at 0.9577. Sustained break there will further affirm the case that correction from 0.9991 has completed at 0.8906. Also, in this case, the larger rise from 0.8058 (2020 low) should be ready to resume through 0.9991 at a later stage.
Bitcoin surges and 50k handle is key
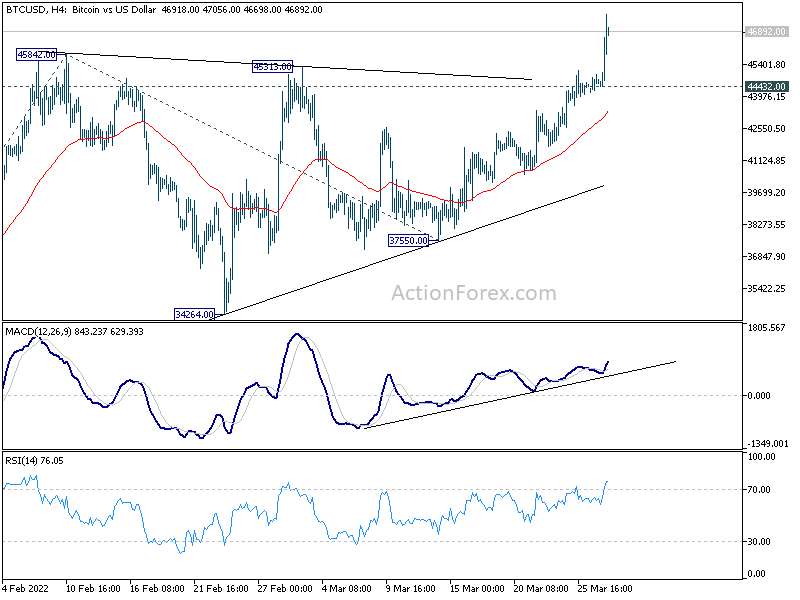
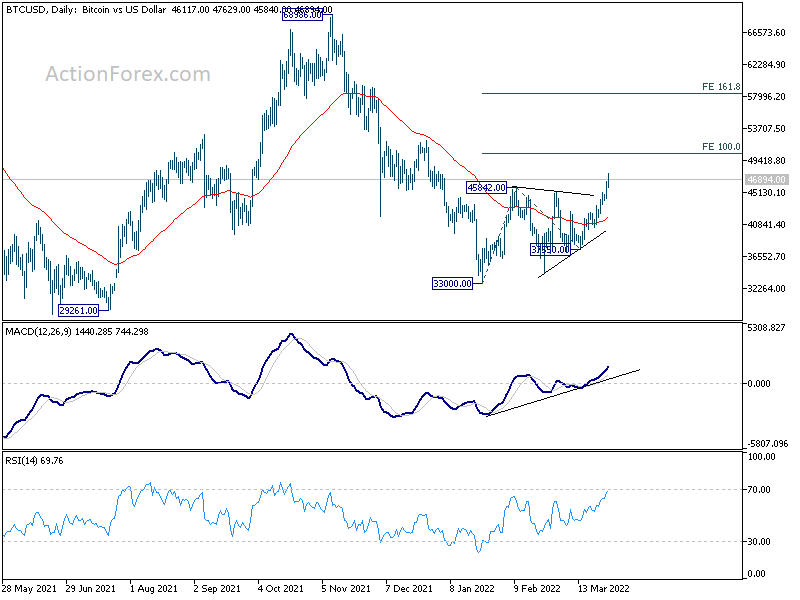
Bitcoin surged over the weekend and broke through 45842 near term resistance. The development confirms resumption of whole rebound from 33000. Near term outlook will stay bullish as long as 44432 support holds. Next target is 100% projection of 33000 to 45842 from 37550 at 50392.
For now it's too early to conclude the trend in bitcoin is reversing. Rejection by 50392 will argue that rebound from 33000 is merely a correction, and bring down trend resumption through this low at a later stage. But sustained break of 50392 could trigger upside acceleration and solidify trend reversal. So, the level around 50k handle is key.
US NFP, ISM and PCE inflation to highlight the week
US economic data will take center stage this week, with non-farm payroll, ISM manufacturing and PCE inflation featured. Most importantly, markets will look into wages growth to solidify the bet on a 50bps rate hike by Fed in May. Elsewhere, Eurozone CPI flash, Japan Tankan survey, Canada monthly GDP and China PMIs will catch most attention.
Here are some highlights for the week:
- Monday: US goods trade balance, wholesale inventories.
- Tuesday: BoJ summary of opinions, Japan unemployment rate; Australia retail sales; Germany Gfk consumer sentiment, import prices; UK mortgage approvals, M4 money supply; US house price index, consumer confidence.
- Wednesday: New Zealand building permits, ANZ business confidence; Japan retail sales; Germany CPI flash; Swiss KOF economic barometer; US ADP employment, Q4 GDP final.
- Thursday: Japan industrial production, housing starts; Australia building approvals; China PMIs; Germany retail sales, unemployment; UK GDP final; Swiss retail sales; France consumer spending; Eurozone unemployment rate; Canada GDP; US personal income and spending, jobless claims, Chicago PMI; Canada GDP.
- Friday: Australia AiG manufacturing; Japan Tankan survey, PMI manufacturing final; China Caixin PMI manufacturing; Swiss CPI, PMI manufacturing; Eurozone PMI manufacturing final, CPI flash;UK PMI manufacturing final; US non-farm payrolls, ISM manufacturing, construction spending; Canada PMI manufacturing.
USD/JPY Daily Outlook
Daily Pivots: (S1) 121.37; (P) 121.90; (R1) 122.63; More...
USD/JPY's rally continues today and intraday bias remains on the upside. Current up trend should target 161.8% projection of 109.11 to 116.34 from 114.40 at 126.09, which is close to 125.85 long term resistance. On the downside, below 121.17 minor support will turn intraday bias neutral and bring consolidations first, before staging another rally.
In the bigger picture, up trend from 98.97 (2016 low) in in progress for retesting 125.85 (2015 high). Sustained break there will confirm long term up trend resumption. Next target will be 61.8% projection of 75.56 (2011 low) to 125.85 (2015 high) from 98.97 at 130.04. This will now remain the favored case as long as 116.34 resistance turned support holds.
Economic Indicators Update
| GMT | Ccy | Events | Actual | Forecast | Previous | Revised |
|---|---|---|---|---|---|---|
| 12:30 | USD | Goods Trade Balance (USD) Feb P | -106.0B | -107.6B | ||
| 12:30 | USD | Wholesale Inventories Feb P | 1.30% | 0.80% |
Technical Outlook and Review
DXY:
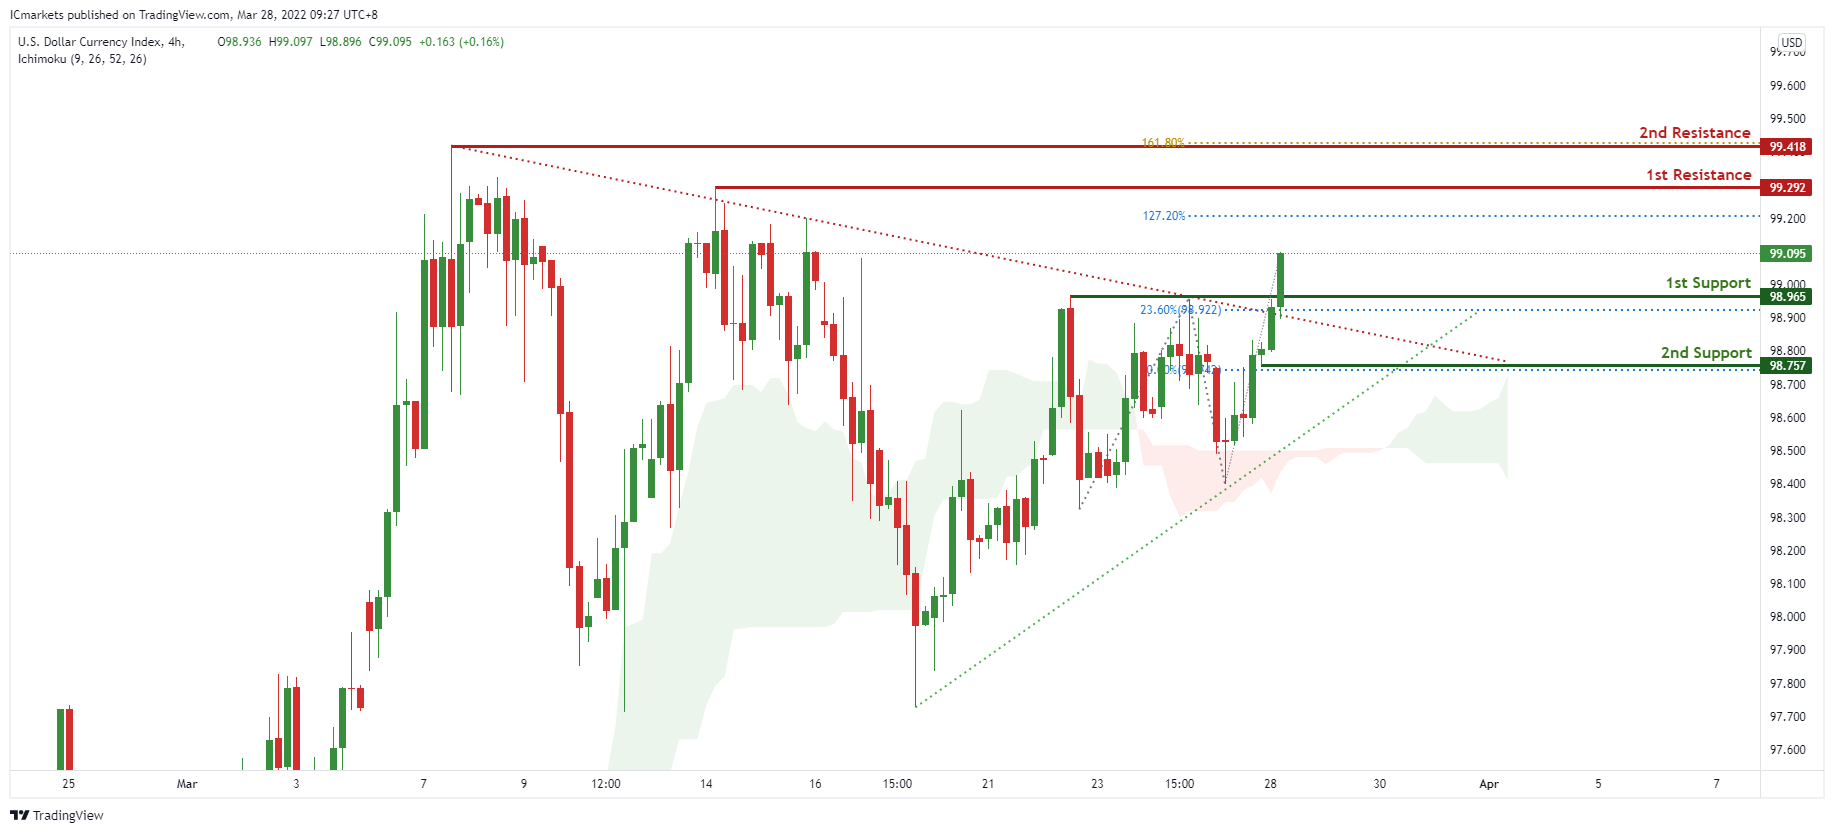
On the H4 timeframe, prices are consolidating in a triangle pattern. We see the potential for a bounce from our 1st support at 98.965 in line with 23.6% Fibonacci retracement towards our 1st resistance at 99.292 in line with 127.2% Fibonacci projection. Prices are trading above our ichimoku cloud support, further supporting our bullish bias.
Areas of consideration:
- H4 time frame, 1st resistance at 99.292
- H4 time frame, 1st support at 98.965
XAU/USD (GOLD):
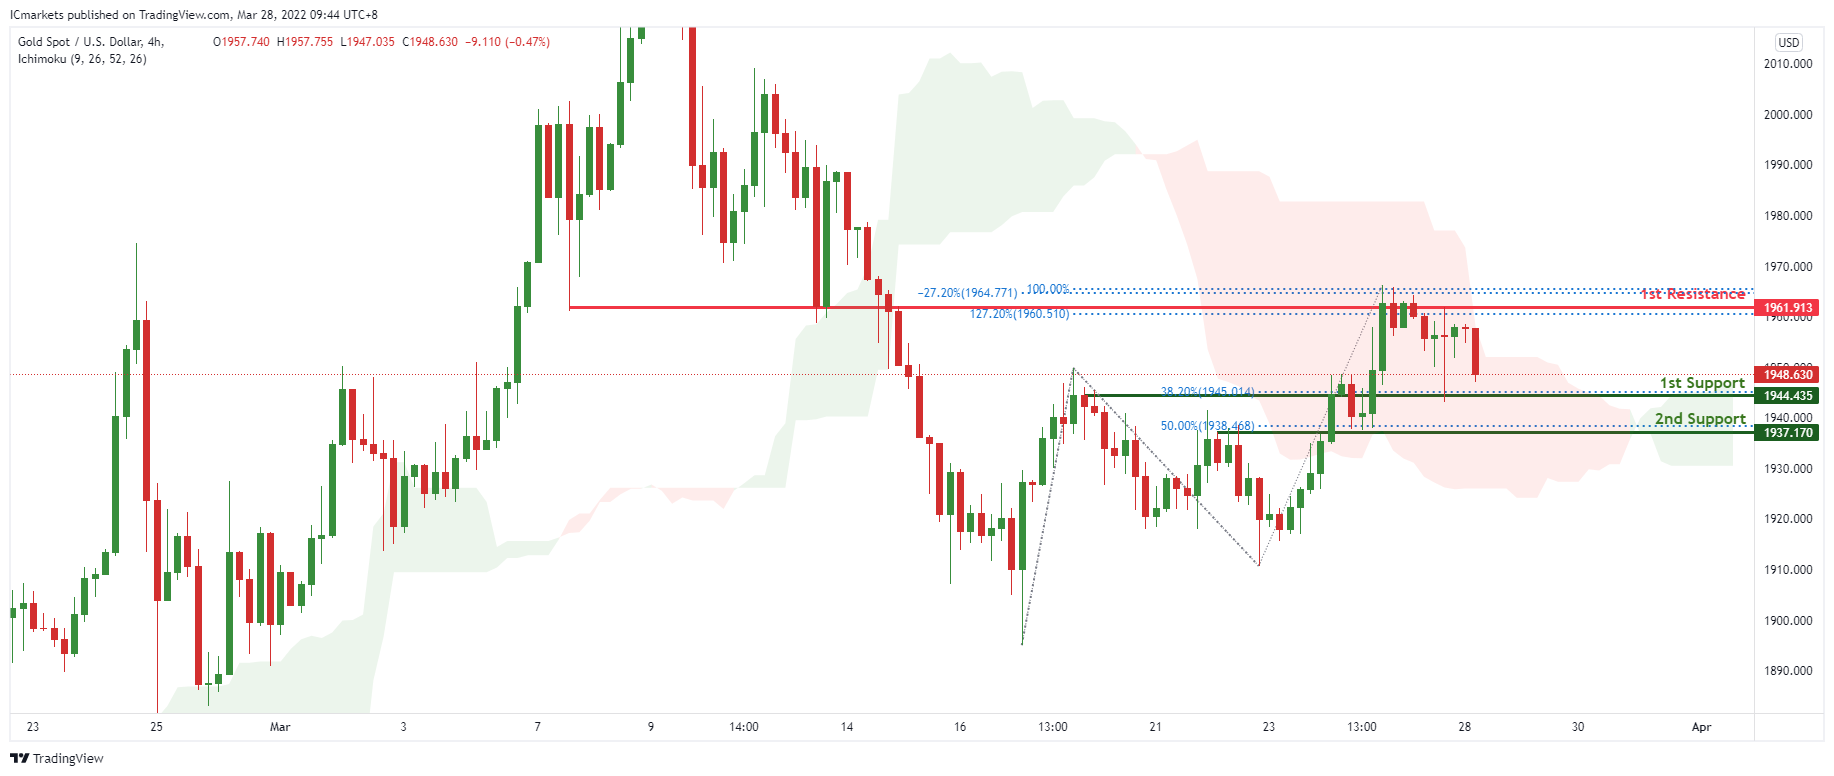
On the H4, prices are on bearish momentum and approaching a key pivot. We see the potential for a dip from our 1st resistance at 1961.913 which is an area of Fibonacci confluences towards our 1st support at 1944.435 in line with 38.2% Fibonacci Retracement and also graphical overlap. Prices are trading below our ichimoku clouds, further supporting our bearish bias.
Areas of consideration:
- 4h 1st support at 1944.435
- 4h 1st resistance at 1961.913
GBP/USD:
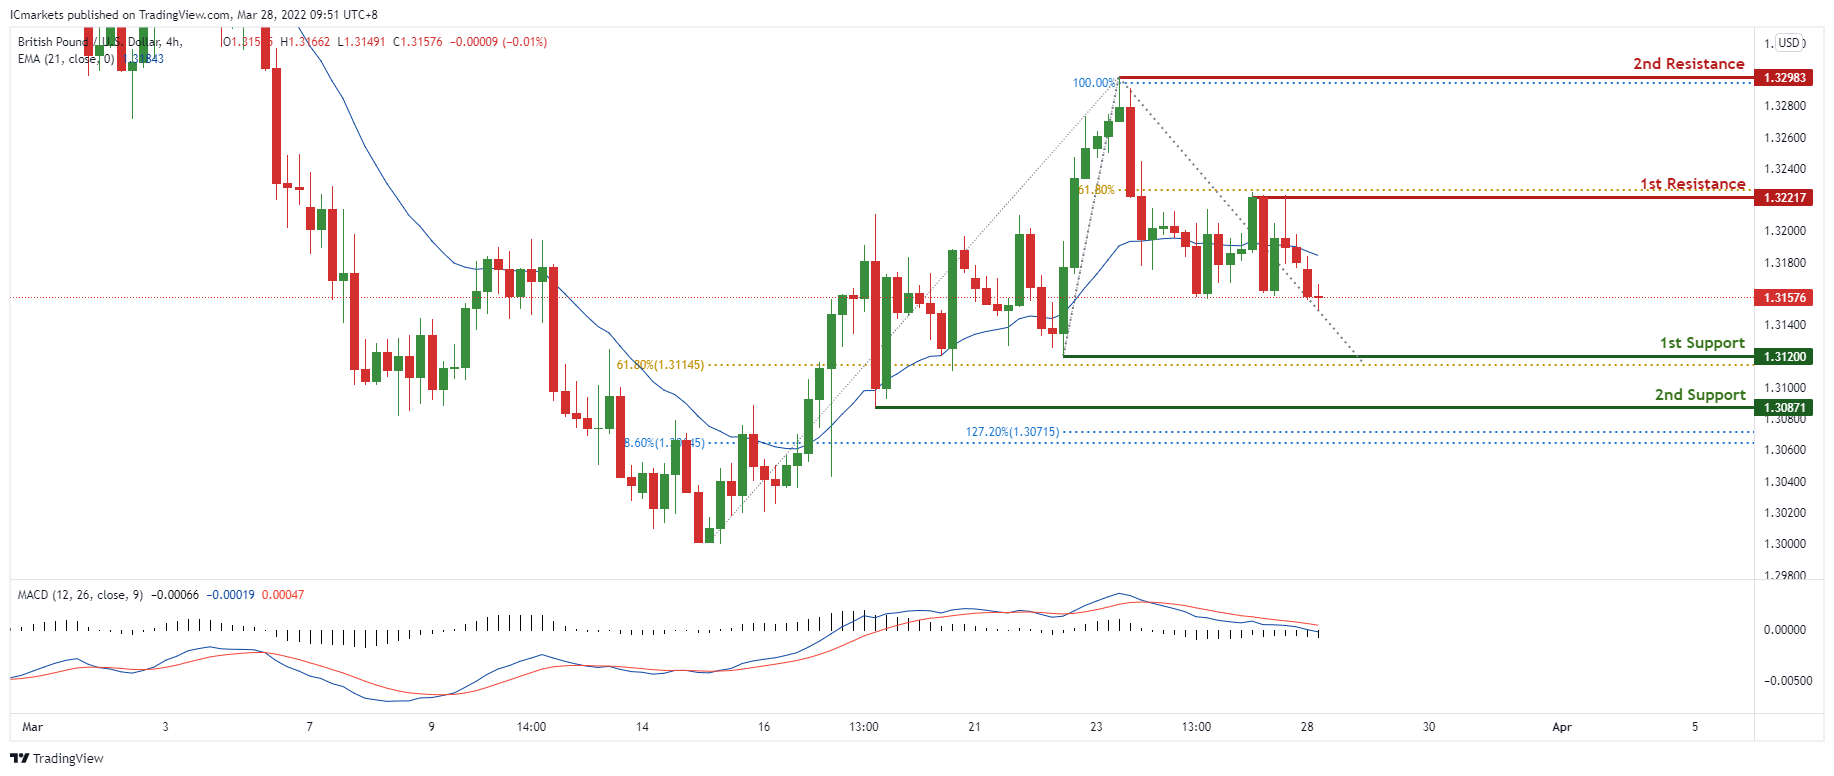
On the H4, prices are on bearish momentum. We see the potential for a dip from our 1st resistance at 1.32217 which is a graphical swing high and in line with 61.8% Fibonacci Projection towards our 1st support at 1.312 in line with 61.8% Fibonacci Projection. MacD and our MA is supporting our bearish bias. Alternatively, breaking the 1st resistance will call for a further bullish continuation towards our 2nd resistance at 1.32983 which was a graphical swing high and in line with 100% Fibonacci Projection.
Areas of consideration:
- H4 1st resistance at 1.32217
- H4 1st support at 1.312
USD/CHF:
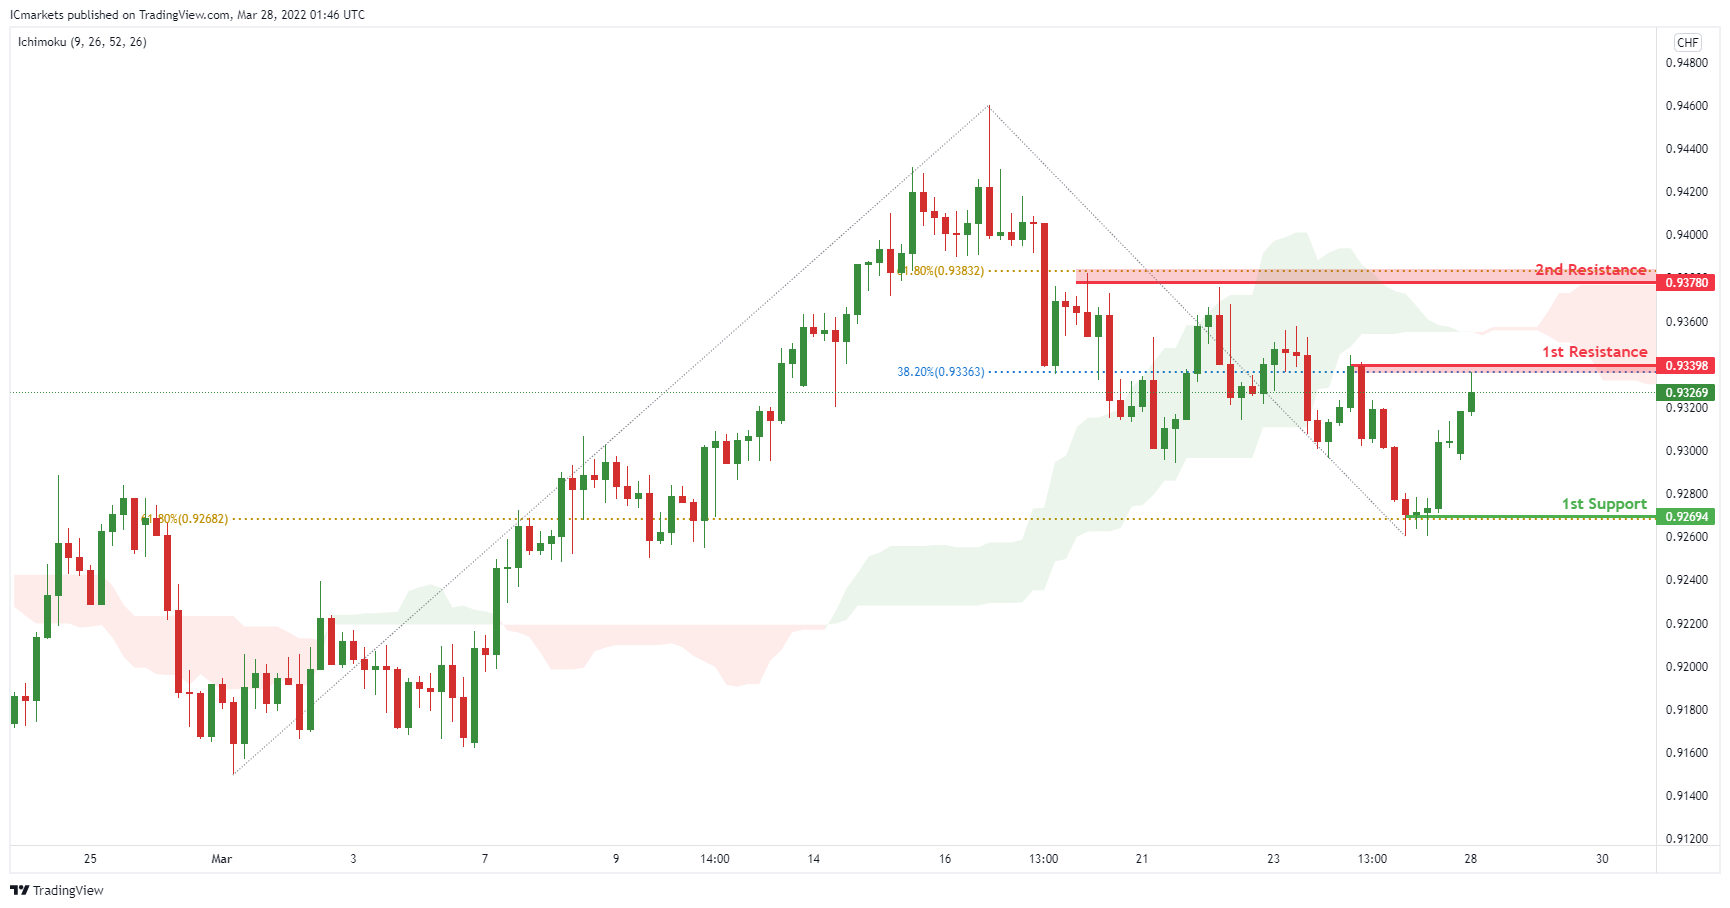
On the H4, with price moving below our ichimoku cloud, we have a bias that price will drop from 1st resistance at 0.93398 in line with the horizontal pullback resistance and 38.2% Fibonacci retracement to 1st support at 0.92694 in line with the pullback support and 61.8% Fibonacci retracement .Alternatively, price may break 1st resistance and head for 2nd resistance at 0.93780 in line with the 61.8% Fibonacci retracement.
Areas of consideration
- 1st support level at 0.92694
- 1st resistance level at 0.93398
EUR/USD :
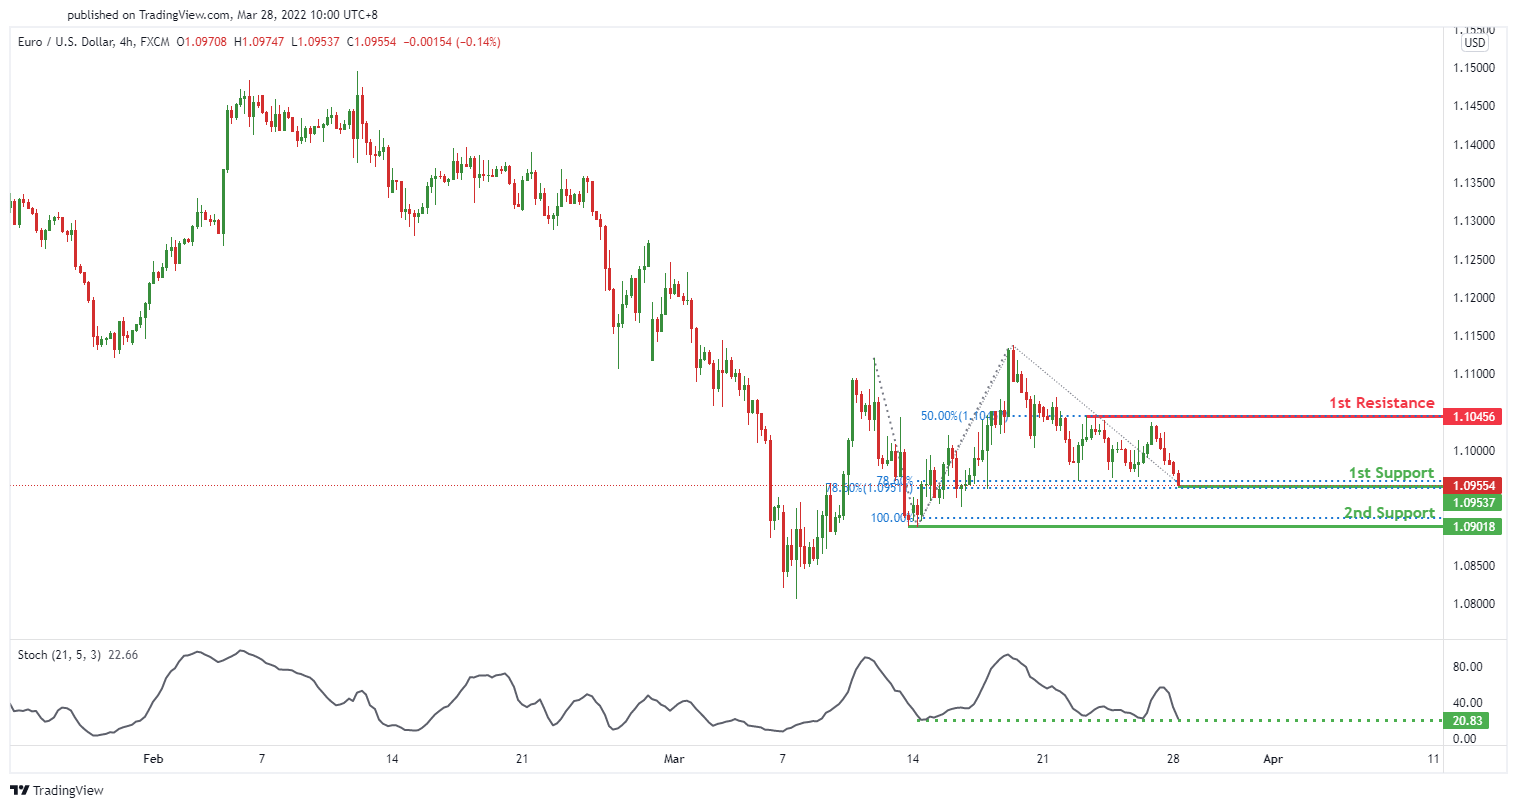
On the H4 timeframe, we see the potential for a bullish bounce from our 1st support at 1.09554 in line with 78.6% Fibonacci projection and 78.6% Fibonacci retracement towards our 1st resistance at 1.10456 in line with 50% Fibonacci retracement. Our bullish bias is supported by the stochastic indicator where price is at support level.
Areas of consideration :
- H4 1st resistance at 1.11360
- H4 1st support at 1.09800
USD/JPY:
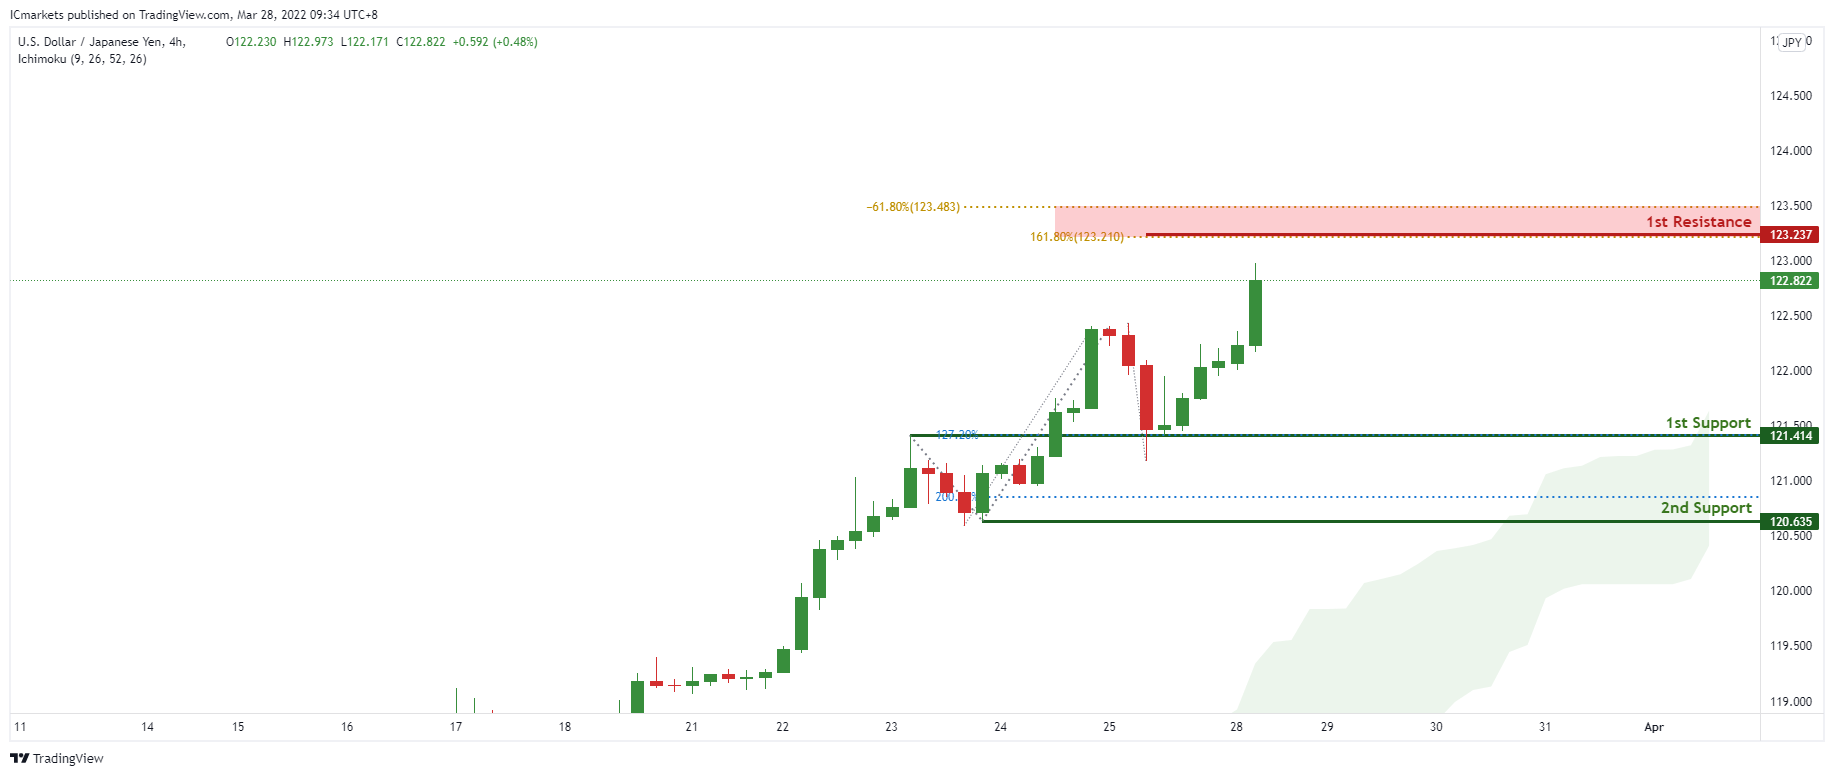
On the H4 timeframe, prices are on bullish momentum. We see the potential for further bullish continuation from our 1st support at 121.414 in line with 127.2% Fibonacci extension towards our 1st resistance at 123.237 which is an area of Fibonacci confluences. Prices are trading above our ichimoku clouds, further supporting our bias.
Areas of consideration:
- H4 time frame, 1st resistance at 123.237
- H4 time frame, 1st support at 121.414
AUD/USD:
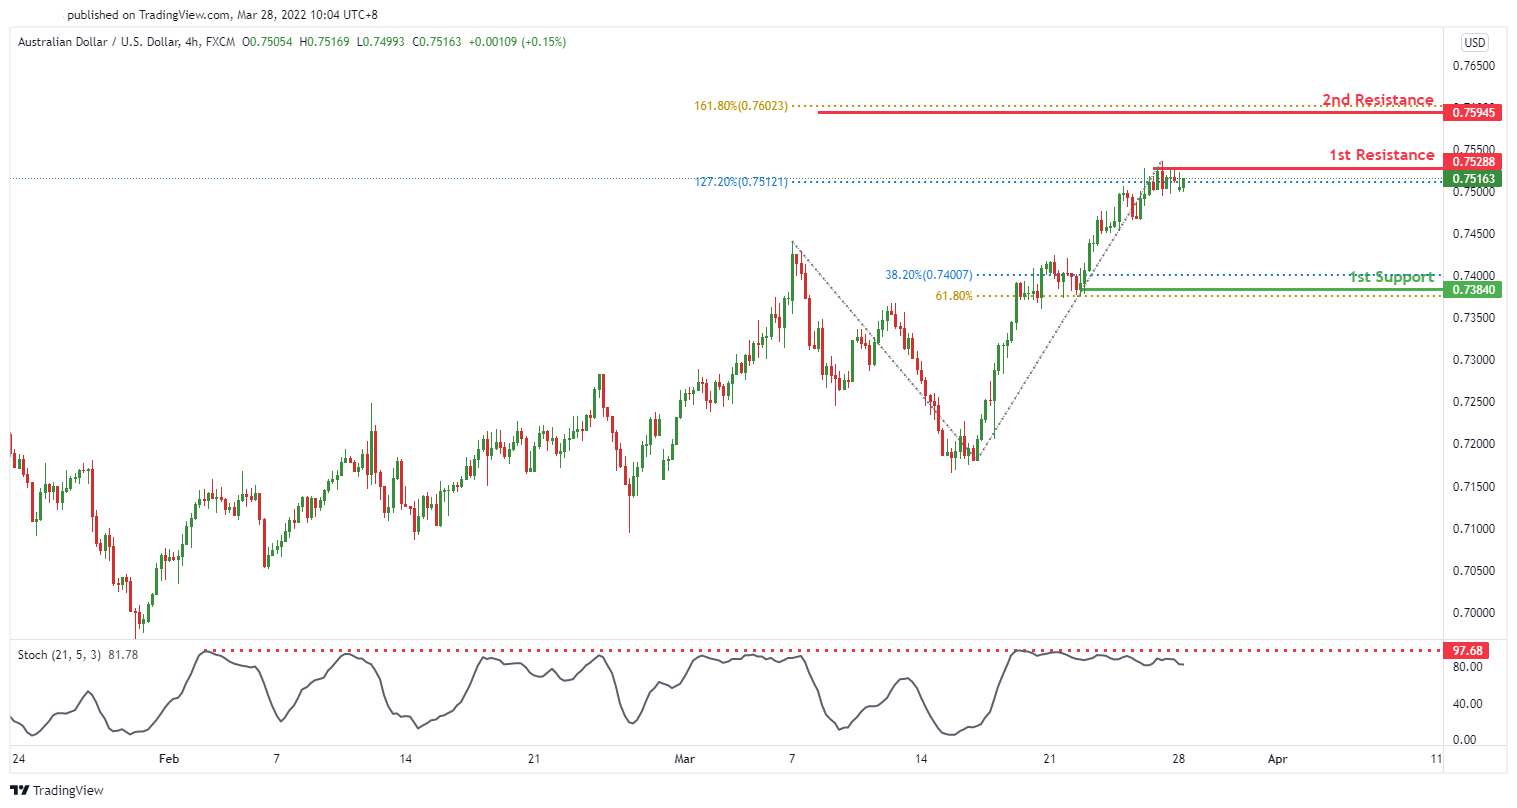
On the H4 timeframe, we see the potential for a bearish dip from our 1st resistance at 0.75288 in line with 127.2% Fibonacci extension towards our 1st support at 0.73840 in line with 38.2% Fibonacci retracement and 61.8% Fibonacci projection. Our bearish bias is supported by the stochastic indicator where it is at resistance level.
Areas of consideration
- H4 1st resistance at 0.75288
- H4 1st support at 0.73840
NZD/USD:
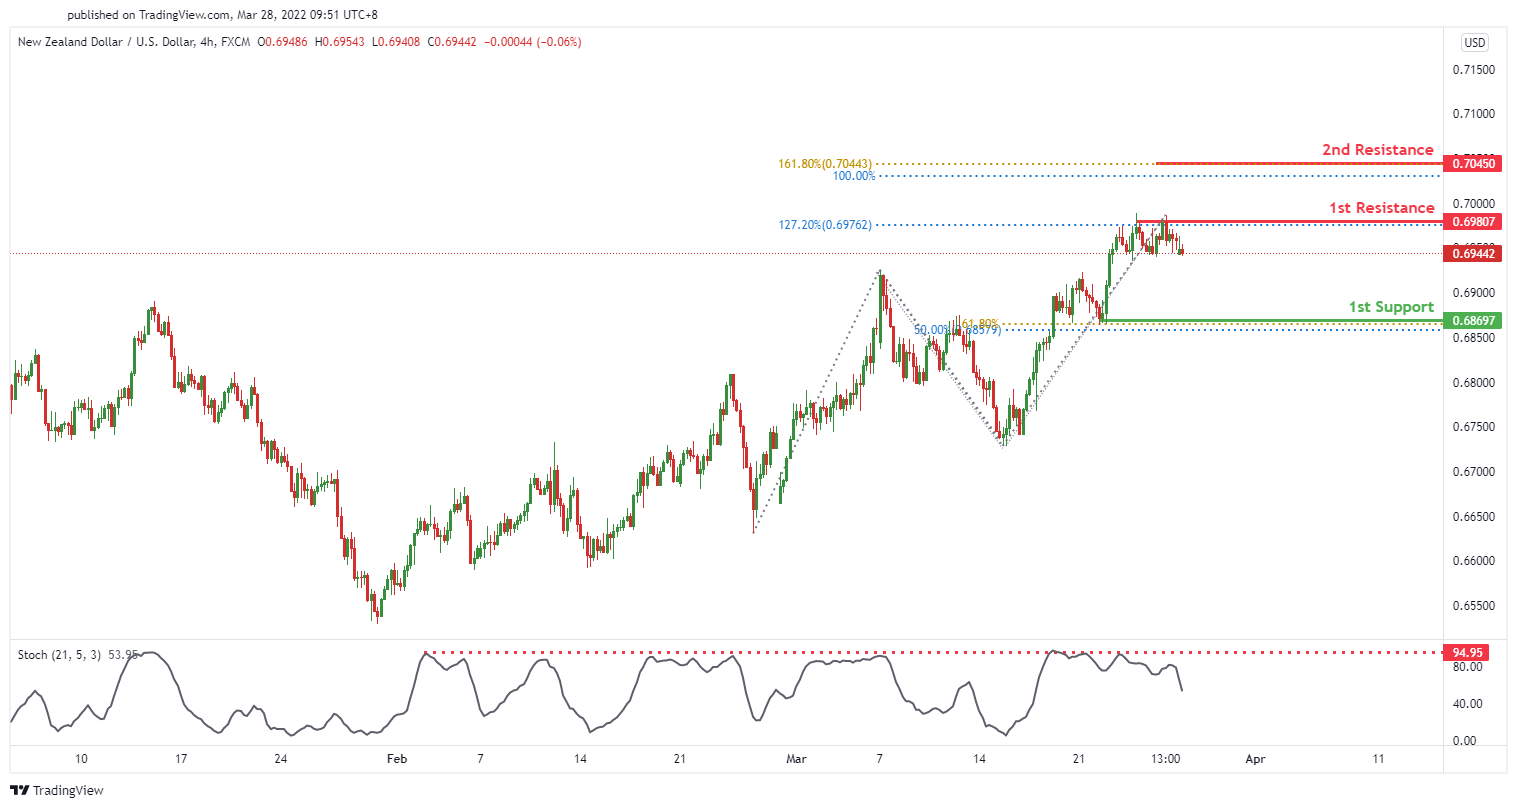
On the H4 timeframe, we see the potential for a bearish dip from our 1st resistance at 0.69807 in line with 127.2% Fibonacci extension towards our 1st support at 0.68697 in line with 61.8% Fibonacci projection and 50% Fibonacci retracement. Our bearish bias is supported by the stochastic indicator where it is at resistance level.
Areas of consideration :
- H4 1st resistance at 0.69807
- H4 1st support at 0.68697
USD/CAD:
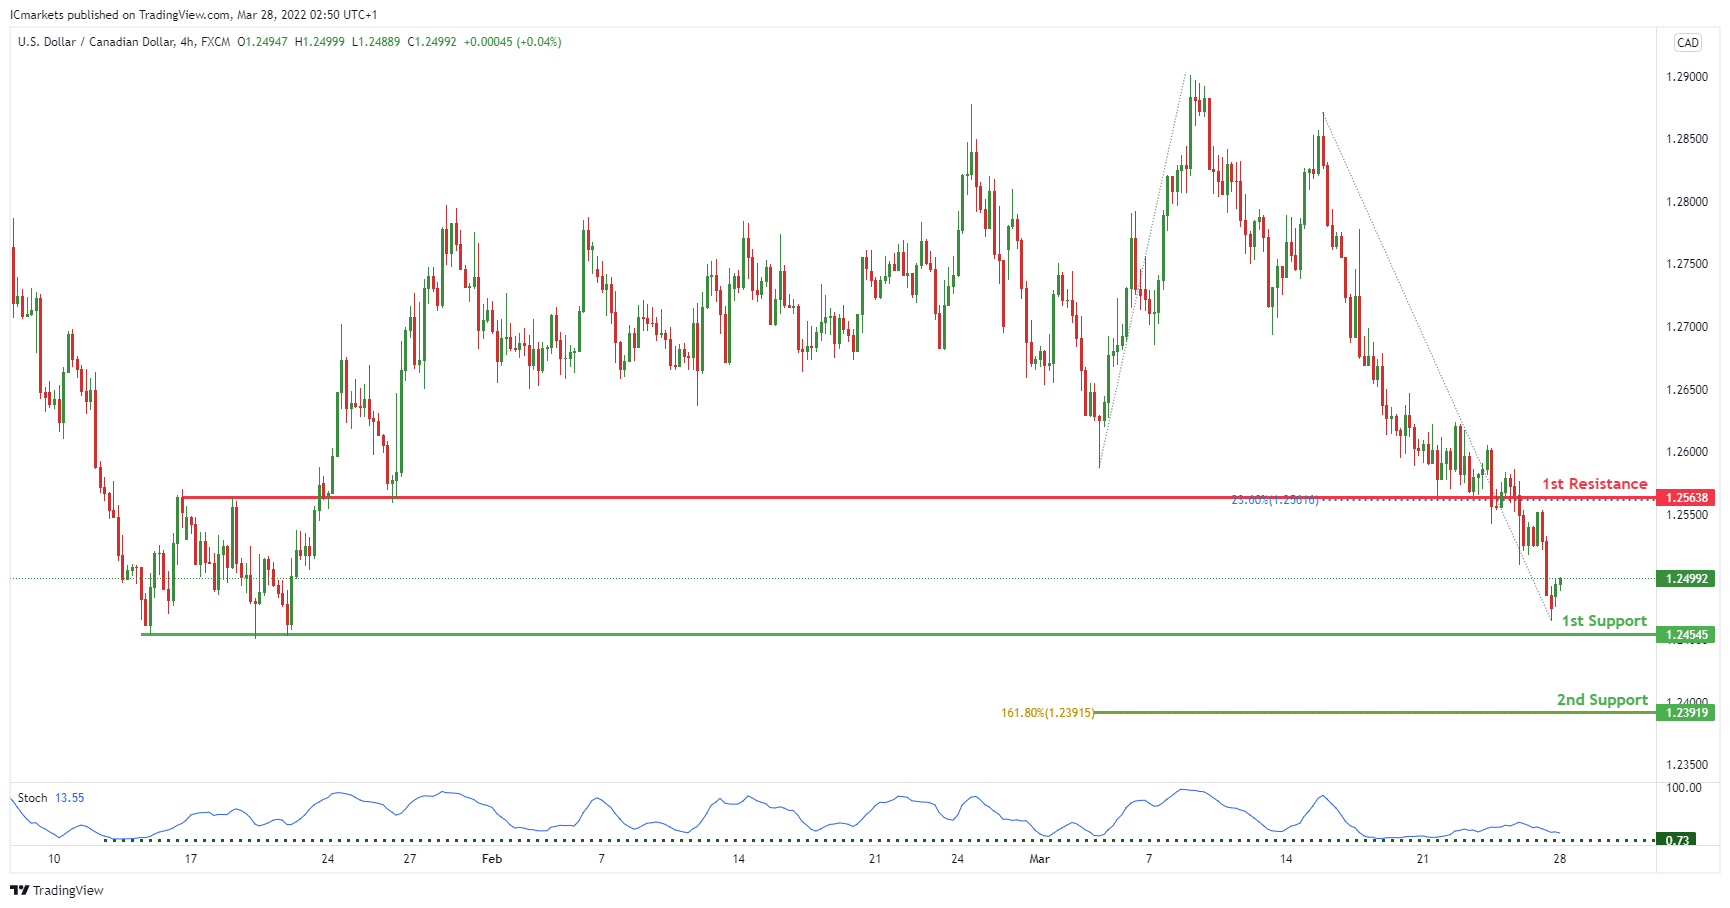
On the H4, with price expected to reverse off the stochastics indicator, we have a bias that price will rise to our 1st resistance at 1.25638 in line with the 23.6% Fibonacci retracement and the horizontal overlap resistance from our 1st support at 1.24545 in line with the horizontal swing low support. Alternatively, price may break 1st support structure and head for 2nd support at 1.23919 in line with the 161.8% Fibonacci extension.
Areas of consideration:
- H4 time frame, 1st support at 1.24545
- H4 time frame, 1st resistance at 1.25638
OIL:
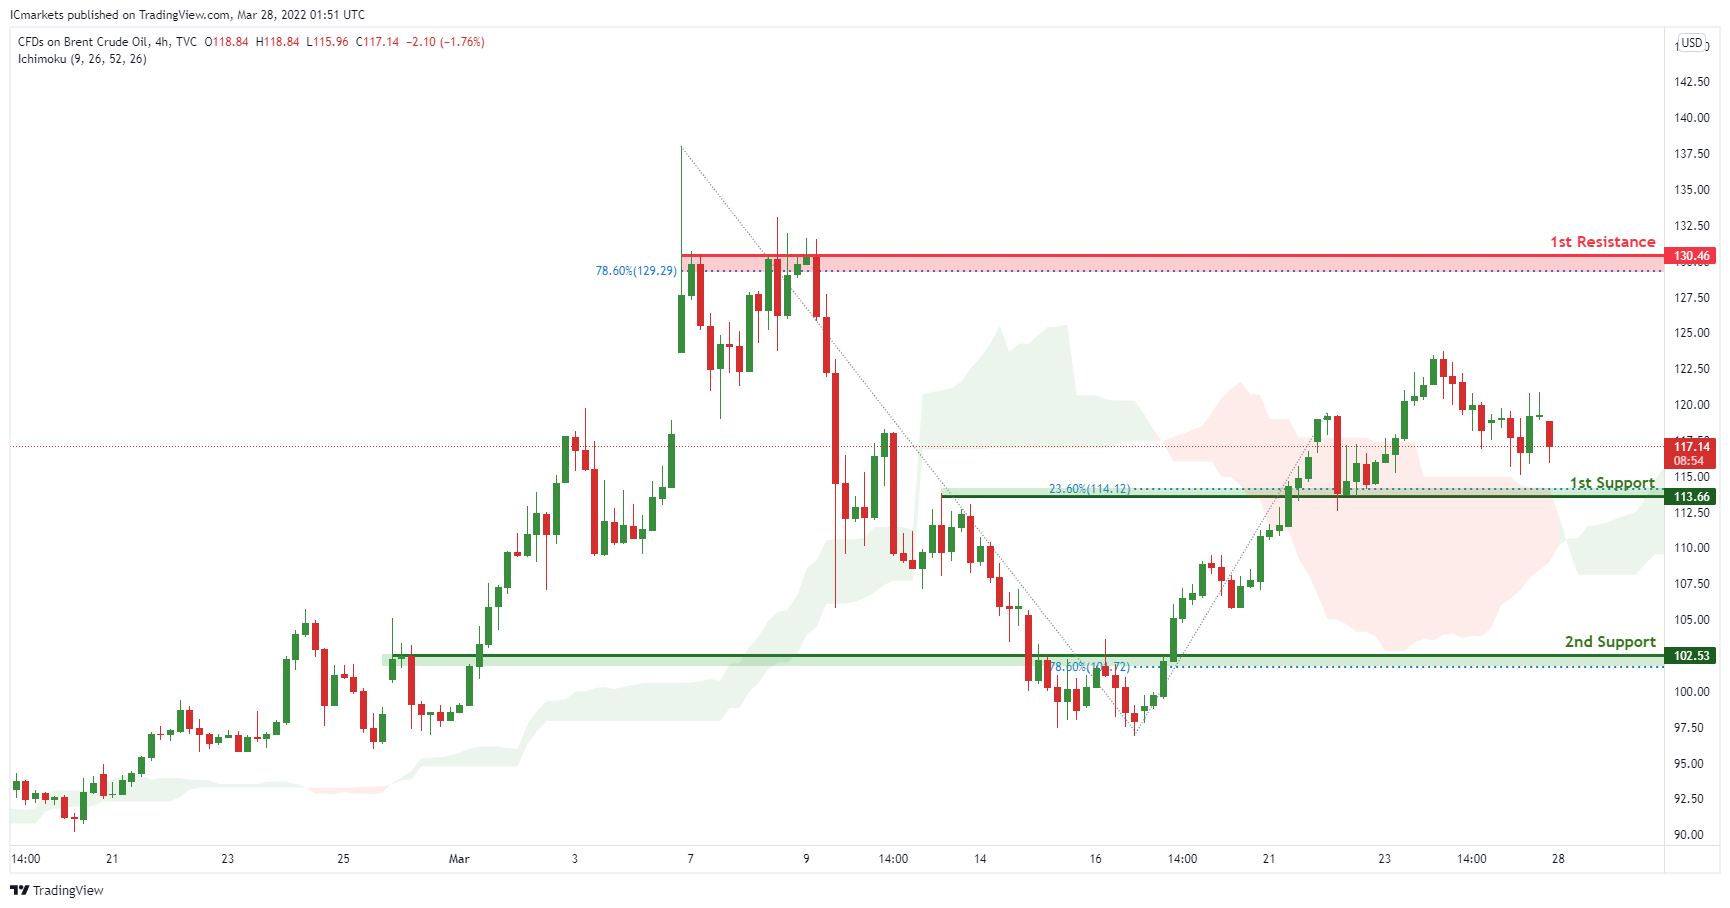
On the H4, with price moving above the ichimoku cloud, we have a bias that price will rise to our 1st resistance at 130.46 in line with the 78.6% Fibonacci retracement from our 1st support at 113.66 in line with the horizontal overlap support and 23.6% Fibonacci retracement. Alternatively, price may break 1st support structure and head for 2nd support at 102.53 in line with the horizontaL overlap support and 78.6% Fibonacci retracement.
Areas of consideration:
- H4 time frame, 1st resistance of 130.46
- H4 time frame, 1st support of 113.66
Dow Jones Industrial Average:
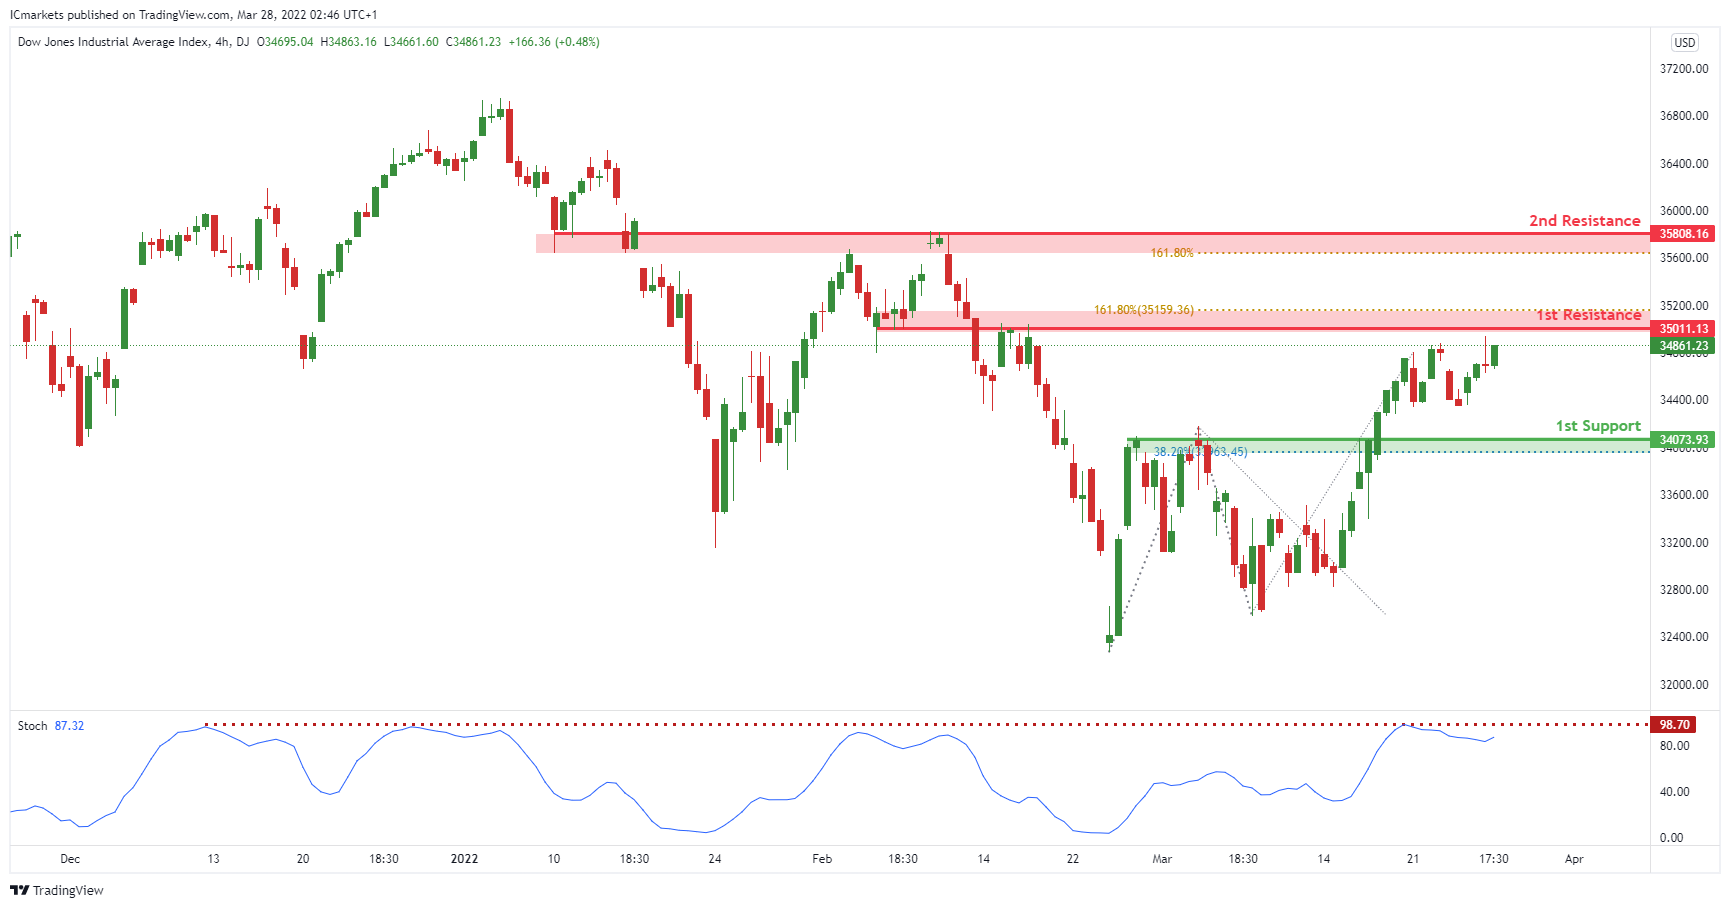
On the H4, with price expected to reverse off the stochastics level, we have a bias that price will drop from 1st resistance at 35011 in line with the horizontal overlap resistance and 161.8% Fibonacci extension to 1st support at 34073 in line with the pullback support .Alternatively, price may break 1st resistance and head for 2nd resistance at 35808 in line with the 161.8% Fibonacci extension.
Areas of consideration :
- H4 1st support at 34073
- H4 1st resistance at 35011
Bitcoin surges and 50k handle is key
Bitcoin surged over the weekend and broke through 45842 near term resistance. The development confirms resumption of whole rebound from 33000. Near term outlook will stay bullish as long as 44432 support holds. Next target is 100% projection of 33000 to 45842 from 37550 at 50392.
For now it's too early to conclude the trend in bitcoin is reversing. Rejection by 50392 will argue that rebound from 33000 is merely a correction, and bring down trend resumption through this low at a later stage. But sustained break of 50392 could trigger upside acceleration and solidify trend reversal. So, the level around 50k handle is key.
AUD/NZD extending rally, AUD/CAD to follow
Aussie is outperforming other commodity currencies in the past two weeks. AUD/NZD's rally extends today to as high as 1.0825 so far. The break of 1.0795 resistance confirms resumption of whole rise from 1.0278. Near term outlook will stay bullish as long as 1.0752 support holds, next target is 61.8% projection of 1.0314 to 1.0795 from 1.0613 at 1.0910.
More importantly, the strong support from 55 week EMA suggests some underlying medium term bullishness. The break of channel resistance from 1.1042 also argues that the correction from there has completed with three waves down to 1.0278. Rise from 0.9992 (2020 low) is likely resuming through 1.1042 towards 1.1289 long term resistance.
Meanwhile, AUD/CAD is still capped below 0.9460 short term top for now. But the strong support from 55 day EMA gives upside breakout a favor. Break of 0.9460 will resume the rebound from 0.8960 to 61.8% retracement of 0.9991 to 0.8906 at 0.9577. Sustained break there will further affirm the case that correction from 0.9991 has completed at 0.8906. Also, in this case, the larger rise from 0.8058 (2020 low) should be ready to resume through 0.9991 at a later stage.