Sample Category Title
Japanese Yen Rebounds
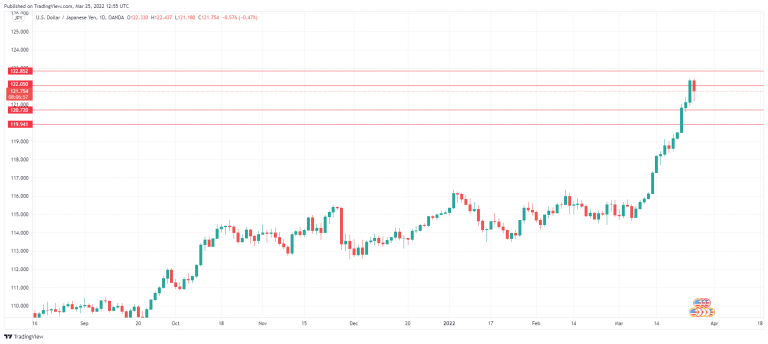
The Japanese yen has managed to stem the bleeding today, as USD/JPY is trading at 121.66, down 0.54%. USD/JPY climbed almost 1% on Thursday, breaking above the 122 line for the first time since December 2015.
Yen pummelled by rate differential
March has been miserable for the Japanese yen, which is down a staggering 5.83% this month. The yen has been walloped by the US/Japan rate differential, which continues to widen. US Treasury yields have been on an upswing, with the 10-year yield rising to 2.38% on Thursday. Higher yields have been weighing on the yen while also giving some support to the US dollar. If the uptrend continues, USD/JPY could push above the 123 line and keep moving north.
The yen received some strong backup on Friday, as BoJ Governor Kuroda and Minister of Finance Suzuki both made statements in parliament aimed at shoring up the yen, which has been on a dreadful slide. Suzuki said that “Exchange-rate stability is important, and sharp volatility is undesirable,” while Kuroda stated that it was important that currency rates remain stable. The comments had their desired effect, as the yen clawed back some gains today, but I would expect these gains to be temporary, as the yen will be under strong downward pressure from a hawkish Fed and a dovish BoJ, which is a one-two punch to the guts that will likely lead to a resumption of the yen’s decline.
Governor Kuroda talked about stability in the exchange rate, but also stated that “There’s no change now to my view a weak yen is generally positive for Japan’s economy”. Perhaps Kuroda doesn’t mind a weak yen, as long as the currency doesn’t fall into a disorderly decline. If I’m an investor, and the head of the central bank is saying he likes a weak yen, that kind of comment doesn’t fill me with an iota of confidence that the yen will rebound from its massive slide.
USD/JPY Technical
- 122.04 is a weak resistance line. Above, there is resistance at 1.2286
- There is support at 120.72 and 119.94
War in Ukraine Leads to German Business Climate Collapse
According to fresh Ifo estimates, business sentiment in Germany fell in March to its lowest level since January 2021. The business climate index fell from 98.5 to 90.8 following a collapse in business expectations amid war in Ukraine and the associated surge in energy and several other commodity prices.
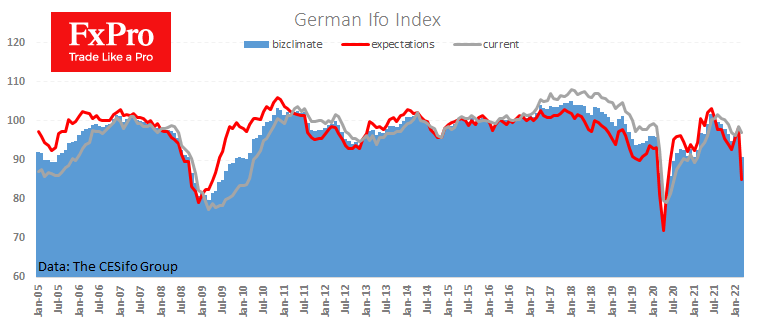
The drop in economic expectations was comparable to what we saw exactly two years ago at the start of the pandemic. New sentiment data may prove to be the first indication of the depth of the economic losses in the next quarter or two from ongoing events. They could wipe out as much as 1% of GDP in the outgoing quarter and another 2% in the next.
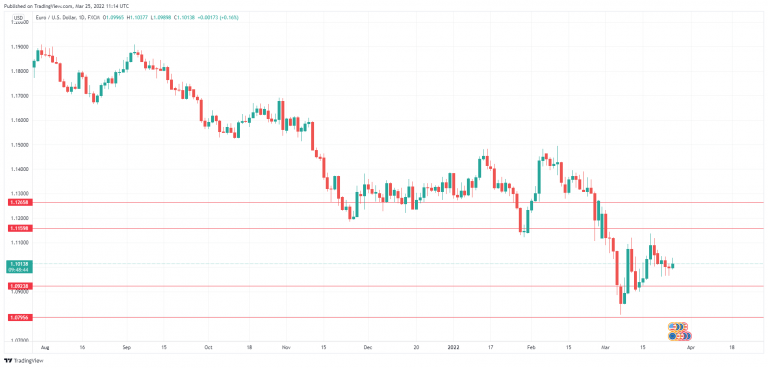
However, the current scenario is already priced in the financial markets. The Eurozone stock indices, which often outperform the economic cycle, are now more than 15% above their lows of March 7th. The same can be said for the euro, which is firmly based around USD 1.10, which has been stable for the last three months against the pound and strengthened by more than 8% against the Japanese yen.
Bitcoin Aims to Reach 45K
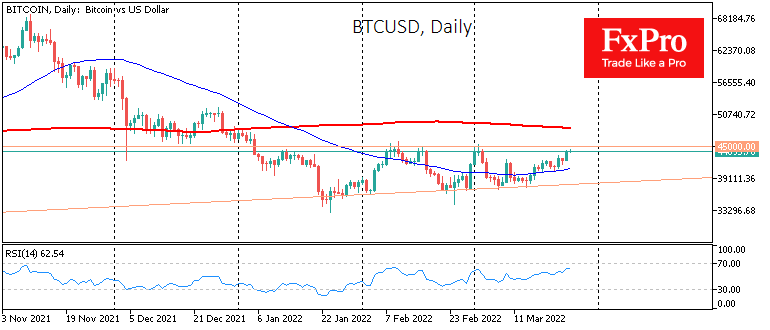
Bitcoin is trading above $44.1K on Friday, gaining 2.4% over the past day and 8.2% over the week. Yesterday, the first cryptocurrency was in demand during the Asian and American sessions.
The current values of BTC are consolidating in the area of 2-month extremes. In contrast to the previous test of these levels, this time, we see a smooth rise in the rate, indicating that the bulls still have some momentum.
Also over the past 24 hours, Ethereum has gained 2.4%, while other leading altcoins from the top ten have strengthened from 0.5% (XRP) to 7.4% (Solana). The exception is Terra, which is shedding 1.8%, correcting part of its gains in the first half of the week.
According to CoinMarketCap, the total crypto market capitalization increased by 2.3% to $2 trillion. The Bitcoin Dominance Index rose 0.1 percentage points to 41.8%. The Fear and Greed Cryptocurrency Index added another 7 points to 47 and ended up in the neutral territory.
Cardano leads the last week in terms of growth among top coins (+39%) as Coinbase added the possibility of staking cryptocurrency with a current estimated annual return of 3.75% per annum.
Credit Suisse reported that Bitcoin doesn’t pose a threat to the banking sector as an alternative to fiat money and banking services.
The CEO of BlackRock, one of the world’s largest investment companies, noted that military actions in Ukraine and sanctions against Russia will increase the popularity of cryptocurrencies and accelerate their adoption.
Despite the rally in global stocks over the past two weeks, financial conditions in the debt markets continue to deteriorate due to rising interest rates and inflation. Largely because of this, El Salvador has postponed the issuance of bitcoin bonds in anticipation of more favourable conditions. Since very active steps to raise key rates are expected in the next year and a half, and Bitcoin is far from the highs, it is unlikely that such bonds will be issued soon.
The Bank of England intends to tighten supervision of cryptocurrencies due to the financial risks that their adoption carries. However, the Central Bank urged commercial banks to exercise maximum caution when dealing with these extremely volatile assets.
Russian Oil and Gas Divestment Forms a Steady Upward Price Trend
Oil and gas remain hot topics in the markets. Although these energy prices have corrected from their recent highs, the uptrend promised to be with us if there are no signs of de-escalation in Ukraine. Moreover, high energy prices are turning into a new reality that could stay with us for years to come.
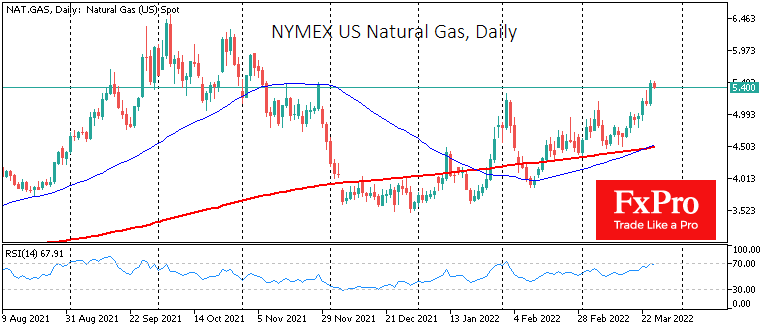
While most news headlines focus on spot gas price developments in Europe, an upward trend has also emerged in the US. This trend has intensified over the past ten days amid discussions about cutting gas supplies from Russia.
Biden urged Europe to increase its US liquefied natural gas purchases, even though supplies were already double the previous year’s level. Putin’s demand to be paid for Russian gas in roubles makes these purchases as uncomfortable as possible. Such a move would accelerate Europe’s rejection of Russian energy, proving to voters in the region that they cannot rely on Russian power.
The demand for alternative gas from the US and the Middle East is growing. And this demand promises to be a long-term trend. Even in the event of a military de-escalation in the coming weeks, attitudes towards Russia in Europe and the US will be tainted for years, and European countries will continue their economically unprofitable reliance on gas from Russia.
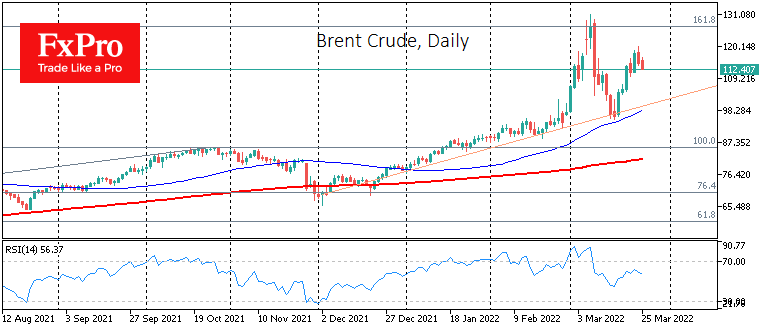
The US has all but tapped its spare capacity to produce and supply gas to Europe. It will take time to expand, so competition among buyers is now gaining momentum.
Much of the same applies to Russian oil, which is exported at 4 million BPD and, with political will, could be fully substituted in less than a year. OPEC is not showing the necessary will and is in no hurry to take Russia’s share of the global oil trade.
While oil and gas consumers in Europe and some Asian countries are cutting back as much as possible on purchases from Russia, energy prices on global markets continue to rise. At the same time, the discount for spot prices for Russian oil and gas remains exceptionally high.
Reducing Russia’s 30% share of Europe’s gas supply is painful and long-term. Finding a new balance could take several quarters or even years, during which energy prices will remain above long-term average levels or occasionally spike.
German Business Climate Dives, Euro Shrugs
German Ifo Index slides
The week wrapped up on a sour note out of Germany, as the Ifo Business Climate Index fell sharply in March. The headline reading came in at 90.8, down from 98.5 in February. The decline was glaringly apparent in the expectations component, which plunged from 99.2 to 85.1 points.
Germany had been enjoying a robust rebound recently, but the crisis in Ukraine has dramatically changed for the worse the economic outlook for the economy. Energy and commodity prices have been soaring and stagflation remains a scary scenario for central banks everywhere, including the ECB. The war will only exacerbate supply chain disruptions, which started in the emergence from the dark days of Covid. With the Russians bogged down in their military campaign,
The German economy is highly dependent on Russian energy imports, and the export-reliant economy is vulnerable to energy disruptions and a potential downturn in global demand.
Germany could report a contraction in growth in the first quarter, which would mean that technically the country is in recession since Q4 showed negative growth. If Germany continues to post weak numbers, it will weigh on the eurozone growth and on the euro.
In the US, unemployment claims fell to 187 thousand, its lowest level since 1969. The numbers point to a robust labor market, as companies continue to struggle to find enough workers to fill openings. Federal Reserve Chair Powell and other Fed officials continue to convey a hawkish tone, as the Fed seeks to reassure the markets that it is bent on wrestling down inflationary pressures, which have hit 40-year highs.
EUR/USD Technical
- 1.0923 is the first line of support, followed by 1.0794
- There is weak resistance at 1.1030, followed by 1.1159
Pound Dips as Retail Sales Contract
The British pound is slightly lower on Friday after disappointing numbers from retail sales and consumer confidence.
UK retail sales, consumer confidence fall
Consumers held tighter to their pocketbooks in February, as retail sales declined. The headline figure showed a decline of 0.3% MoM, after a gain of 1.9% in January. This missed the estimate of 0.6%. Core retail sales fell by a sharper 0.7%, missing the forecast of 0.5% and down from 1.7% in January.
The GfK consumer confidence index fell to -31 in March, down from -26 previously. The index weakened for a fourth straight month. GfK attributed the dismal numbers to the surging rise in the cost of living, rising Covid cases and the war in Ukraine, adding, “There is an unmistakable sense of crisis in our numbers”.
Inflation has been hitting consumers hard, with CPI climbing to 6.2% in February, a 30-year high. This has forced consumers to cut back on spending and has dampened confidence, which was reflected in the February releases. The numbers will add to the pressure on the Bank of England to continue to raise rates, but the BoE finds itself in a dilemma – the rate tightening cycle will have to continue to wrestle inflation lower, but the war in Ukraine and rising energy prices could slow the economy later this year, and aggressive tightening could choke off economic growth.
In the US, there was positive news on Thursday, as unemployment claims fell to 187 thousand, its lowest level since 1969. The numbers point to a robust labor market, as companies continue to struggle to find enough workers to fill openings. Federal Reserve Chair Powell and other Fed officials continue to convey a hawkish tone, as the Fed seeks to reassure the markets that it is bent on wrestling down inflation, which has become the Fed’s Public Enemy Number One.
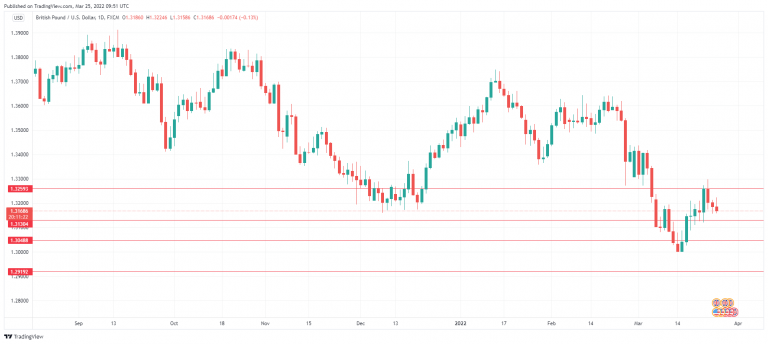
GBP/USD Technical
- GBP/USD faces resistance at 1.3259 and 1.3341
- There is support at 1.3130 and 1.3048
GOLD ($XAUUSD) Buying The Dips After Elliott Wave Zig Zag
Hello fellow traders. In this technical blog we’re going to take a quick look at the Elliott Wave charts of GOLD, published in members area of the website. As our members know, we’ve been favoring the long side in the commodity. Recently GOLD ( $XAUUSD ) made a pull back that has had a form of Elliott Wave Zig Zag pattern. We expected GOLD to find buyers at the extreme zone from the 03/08 peak. In the further text we are going to explain the Elliott Wave Pattern and trading strategy.
Before we take a look at the real market example, let’s explain Elliott Wave Zigzag.
Elliott Wave Zigzag is the most popular corrective pattern in Elliott Wave theory . It’s made of 3 swings which have 5-3-5 inner structure. Inner swings are labeled as A,B,C where A =5 waves, B=3 waves and C=5 waves. That means A and C can be either impulsive waves or diagonals. (Leading Diagonal in case of wave A or Ending in case of wave C) . Waves A and C must meet all conditions of being 5 wave structure, such as: having RSI divergency between wave subdivisions, ideal Fibonacci extensions and ideal retracements.
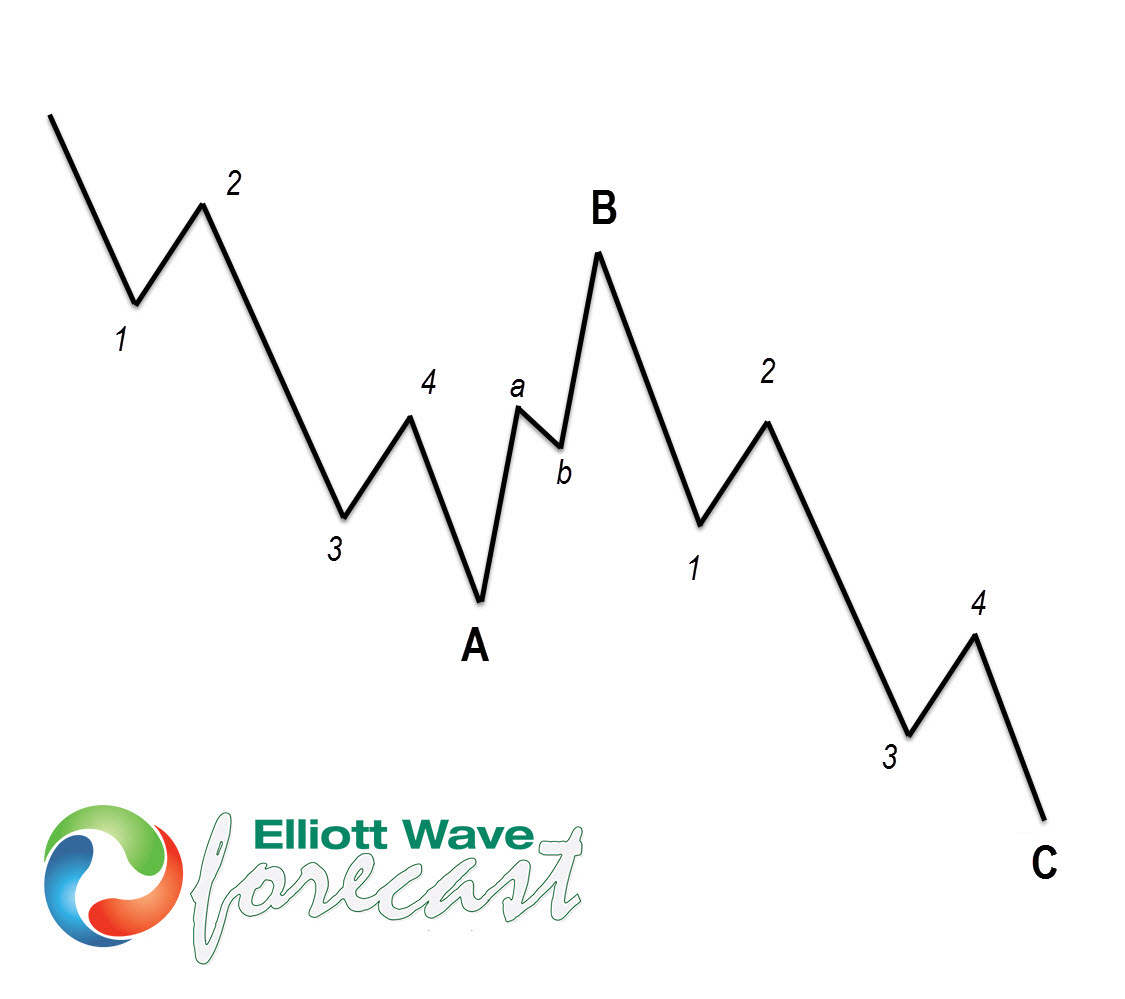
At the chart below we can see what Elliott Wave Zig Zag pattern looks like in real market.
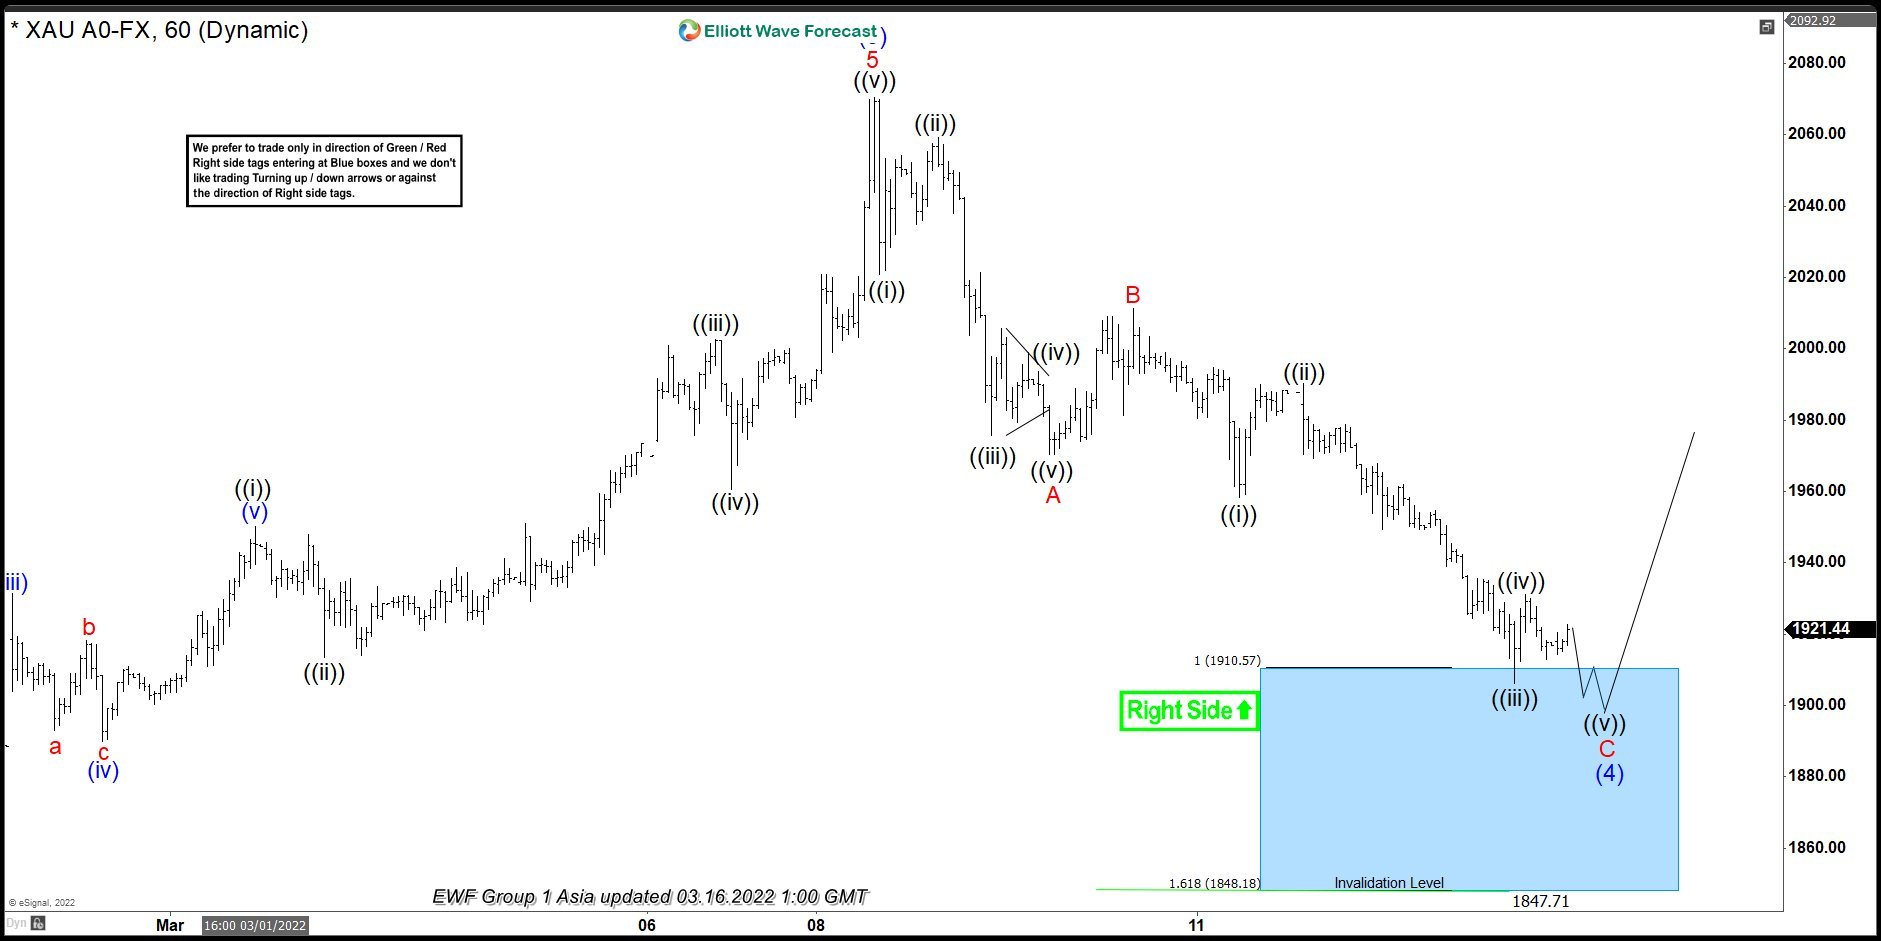
GOLD H1 Elliott Wave Analysis 03.16.2022
GOLD is correcting the cycle from the 1779.3 low. Recovery has reached the extremes from the peak at 1910.57, however pull back doesn’t look completed yet. We assume pull back is unfolding as Elliott Wave Zig Zag Pattern. That means both A and C leg has to have a form of 5 waves structure. We can count clear 5 waves down in A red leg. On other hand C red still missing another low to have clear 5 waves form. Consequently we are calling for another marginal push lower within blue box. Anyway, we don’t recommend selling. We favor the long side from the marked blue box zone :1910.5-1848.1. As the main trend is bullish we expect buyers to appear at the blue box for 3 waves bounce at least. Once bounce reaches 50 Fibs against the B red high, we will make long position risk free ( put SL at BE) and take partial profits. Invalidation for the trade would be break below 1.618 fibs extension: 1848.1
As our members know Blue Boxes are no enemy areas , giving us 85% chance to get a pull back.
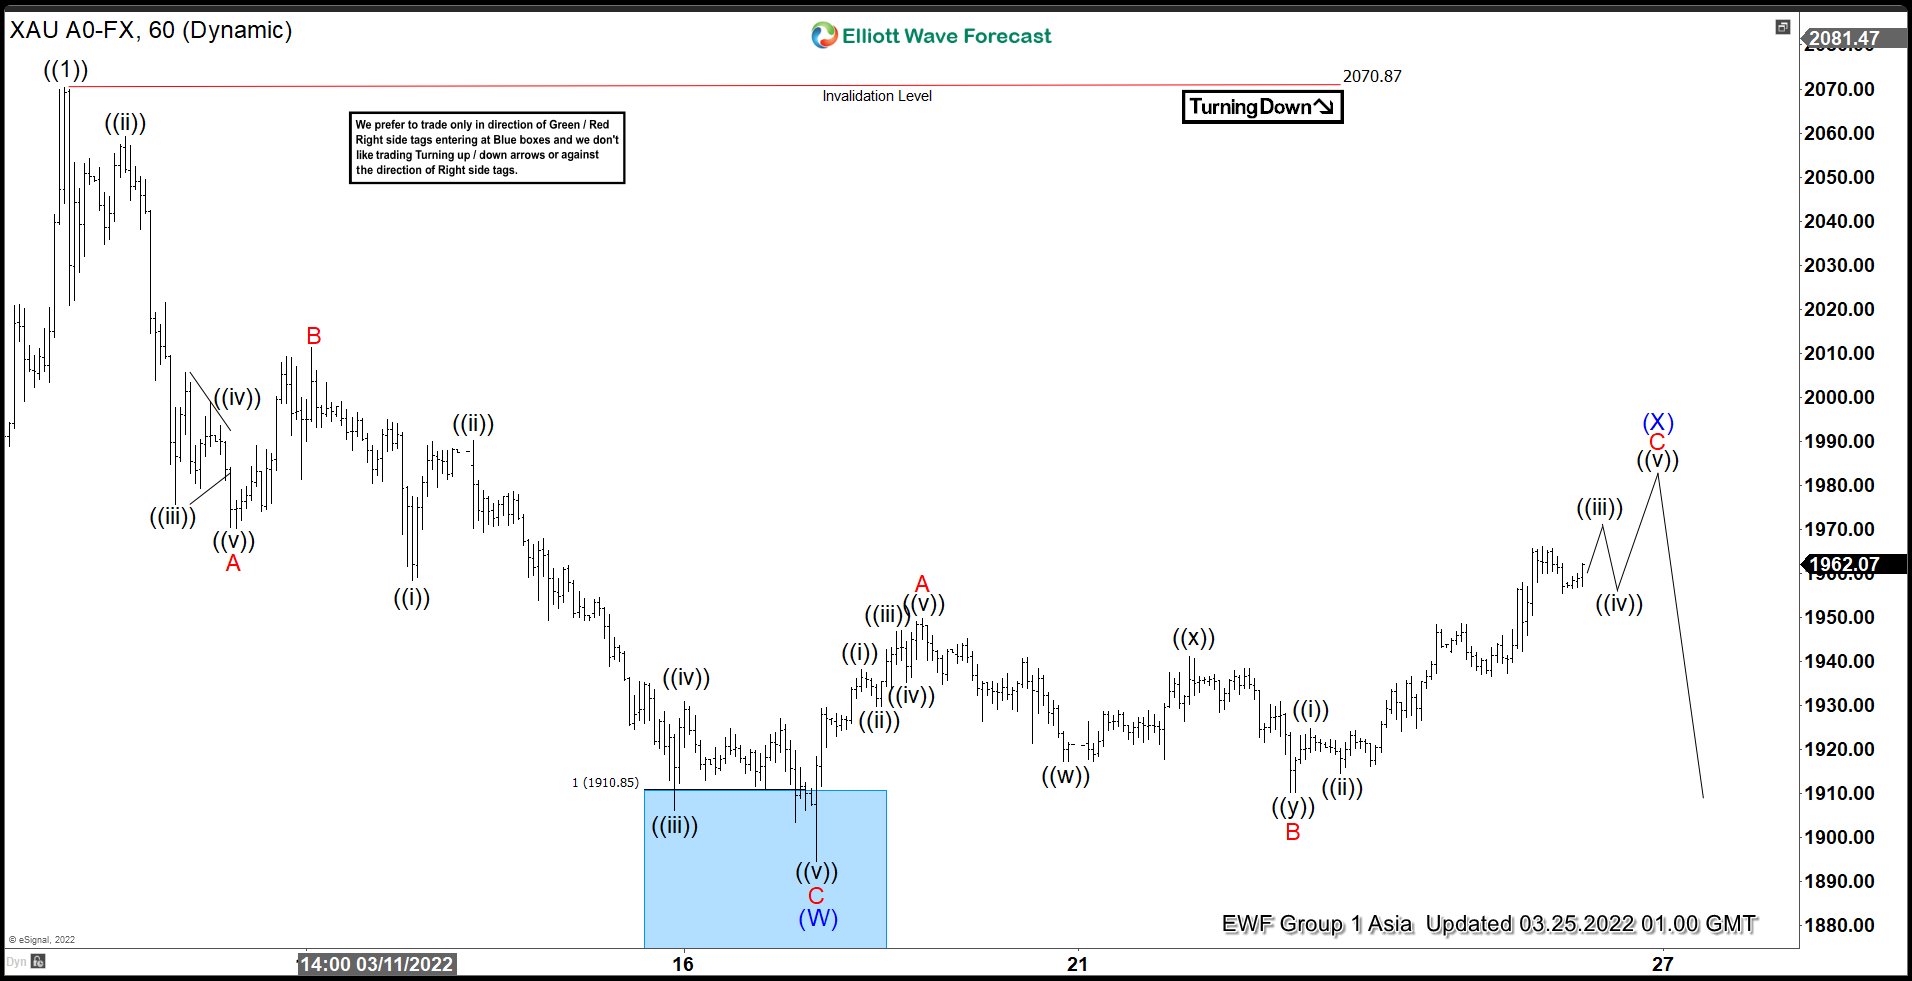
GOLD H1 Elliott Wave Analysis 03.25.2022
The commodity made another wave down within blue box area, complete clear 5 waves in C red leg and found buyers as we expected. We got nice reaction from the blue box, which reached and exceeded 50 fibs against the B connector, so any long trades from the blue box should be risk free at this stage+ partial profit taken. Current view suggests we still can get another leg down within cycle from the peak. (X) blue recovery can complete at 1965.69-1999.65 area. However, don’t recommend selling the commodity against the main bullish trend. Alternatively if 2070.87 pivot gives up, it will denied current view and we will call pull back completed. Right side is the long side and GOLD remains buy in the dips.
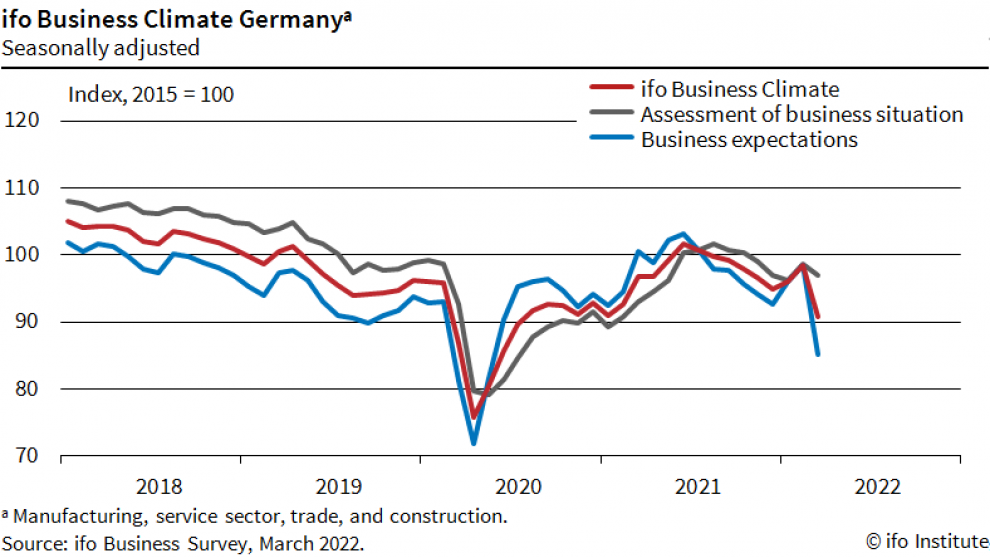
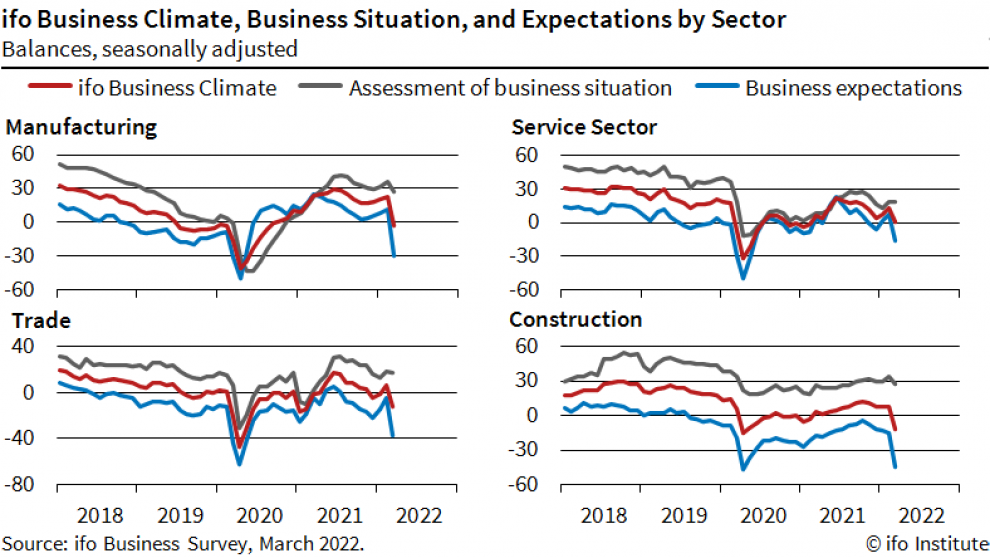
Germany Ifo business climate dropped to 90.8, record collapse in expectations
Germany Ifo Business Climate dropped from 98.5 to 90.8 in March, below expectation of 94.5. Current Situation index dropped from 98.6 to 97.0, below expectation of 97.3. Expectations index dropped from 98.4 to 85.1, well below expectation of 97.2, and a record collapse.
By sector, manufacturing dived from 23.1 to -3.3. Services dropped from 13.6 to 0.7. Trade dropped from 6.6 to -12.0. Construction dropped from 8.0 to -12.2.
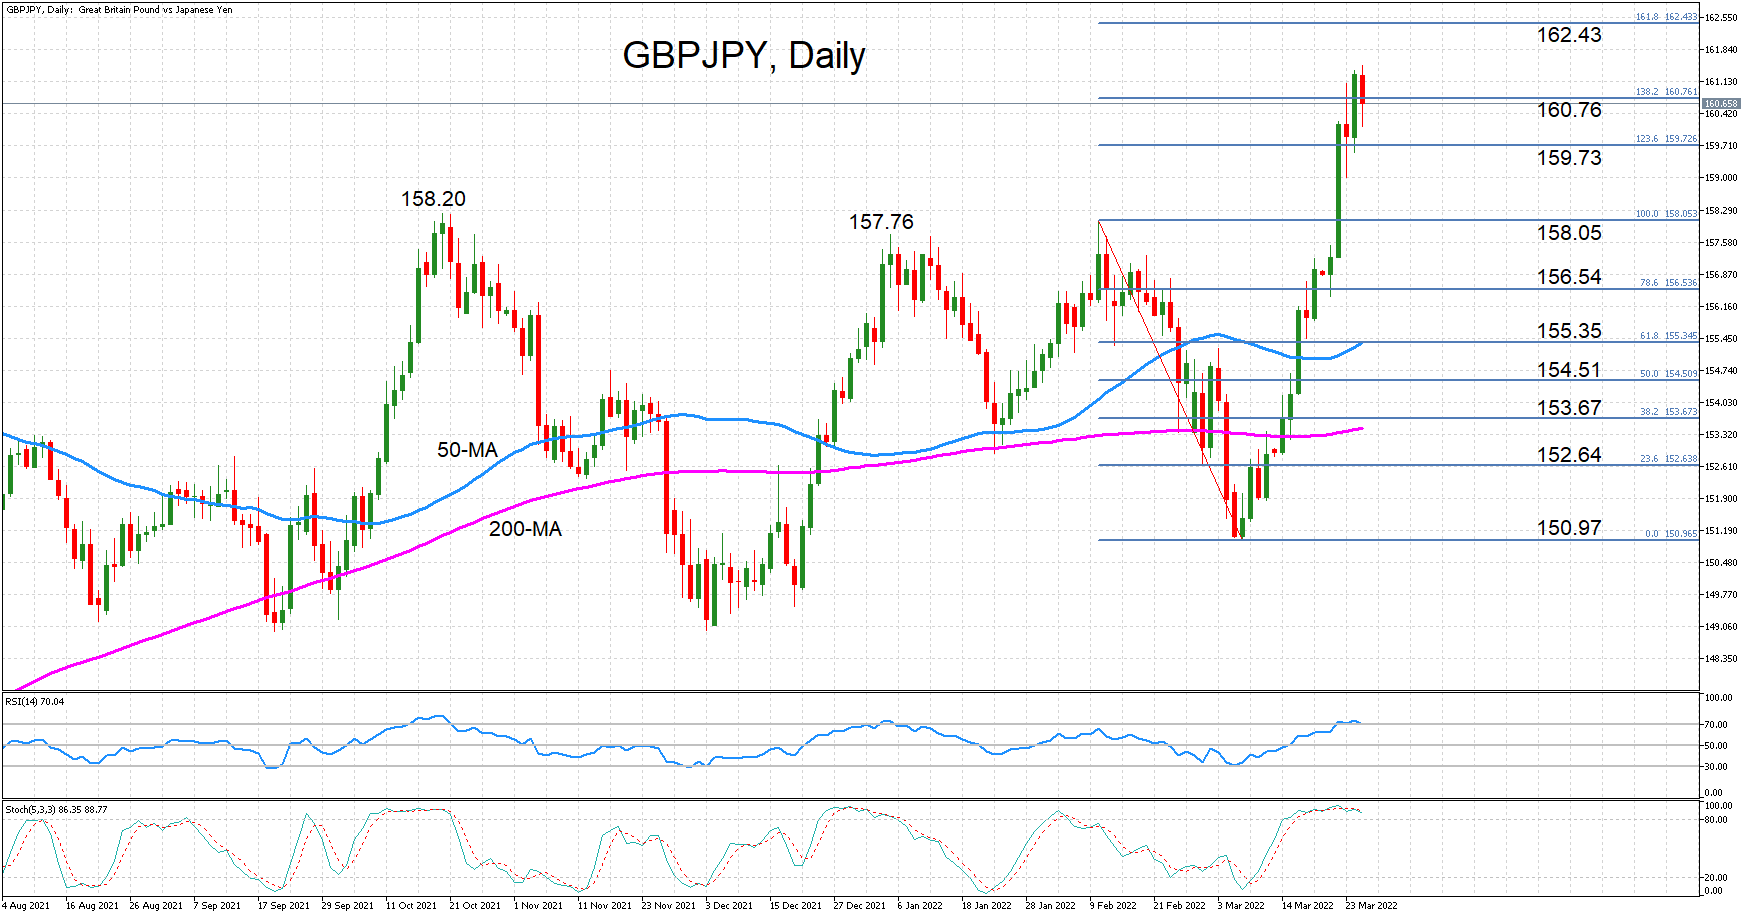
GBPJPY Eases from 6-Year High; Rally May be Losing Steam
GBPJPY reached a fresh six-year high of 161.48 earlier today but the price has now pulled back to around 160.75. The pair has risen sharply from the two-month trough of 150.97 plumbed on March 8. However, the momentum indicators suggest the latest upswing is cooling.
Both the RSI and the stochastic oscillator have entered overbought territory, warning that a near-term correction is due. The stochastics have been holding above 80 for more than a week now, while the RSI, which only crossed above 70 a few days ago, is pointing down. Nevertheless, the indicators have held in their respective overbought zones for longer durations in the past so a big downwards reversal may not be a foregone conclusion.
The price is currently trying to establish a foothold at the 138.2% Fibonacci extension of the February-March downleg at 160.76. Should it fail to do, so, the 123.6% Fibonacci of 159.73 is the next line of defence that could prevent a steeper correction. Otherwise, the pair would probably slip back towards the February peak of 158.05, restoring the neutral longer-term trend. Even lower, the 61.8% Fibonacci retracement of 155.35, where the 50-day moving average is also converging, is the next critical support that needs to be watched as slipping below this area would intensify the downside risks.
However, if today’s slide proves to be a temporary blip, GBPJPY could turn its sights to the 161.8% Fibonacci extension of 162.43. Breaking above this level would bring the 165.0 handle into scope. Moreover, the medium-term picture would start to look more convincingly bullish.
To sum up, the positive short-term bias is in danger of fading and turning negative, while in the broader outlook, the rally has some way to go still before a clear bullish structure is formed.
Daily Technical Analysis
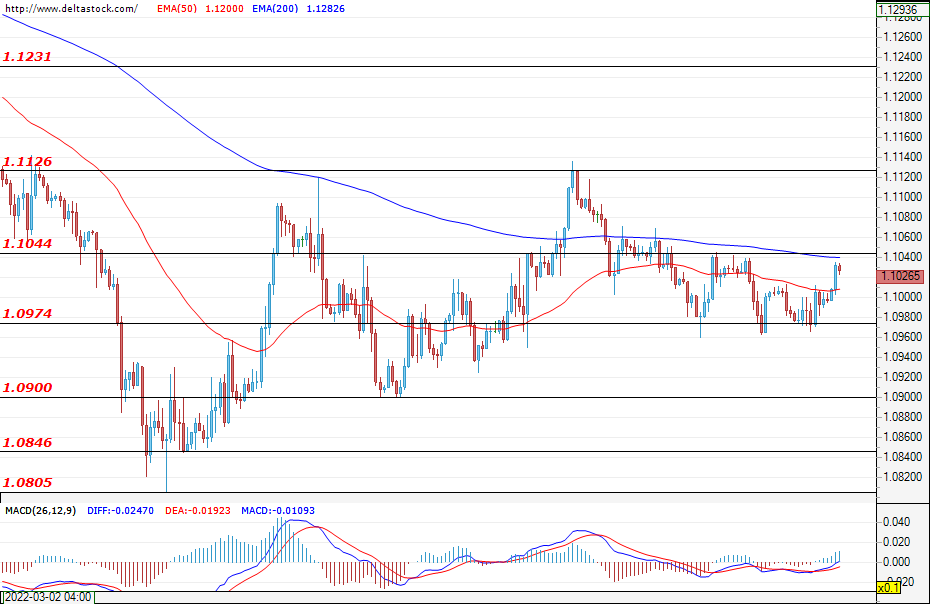
EUR/USD
During the last session the movement of the currency pair remained in a narrow range. Support at 1.0974 was tested three times, but the price failed to stay below it. The downward movement is probably not over because at the upper border of the range - the resistance at 1.1048 - was not even reached. However, it's possible to break through and test the next target - the resistance at 1.1127. This may be a signal that the bulls are back on the market.
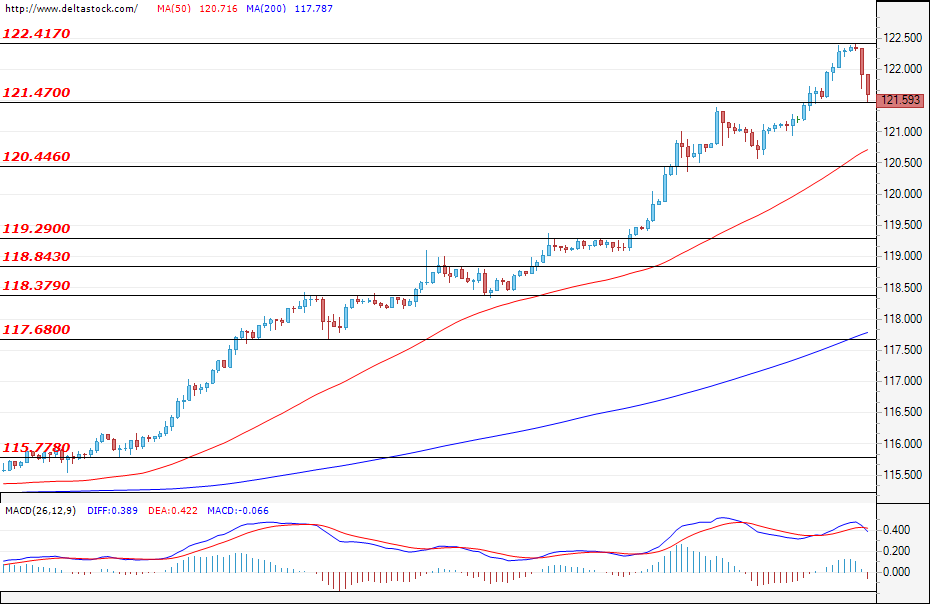
USD/JPY
The Japanese yen continues to lose ground against the US dollar. The market has clear trend characteristics. The corrections are minimal and not very long and the resistances are easily overcome. Important resistance levels would be 122.42 and 123.76 available at a longer time frame. On the downside, the main support is the level at 120.44. Even if it is successfully overcome, the return of the bears is unlikely. Sentiment remains positive for the US dollar.
GBP/USD
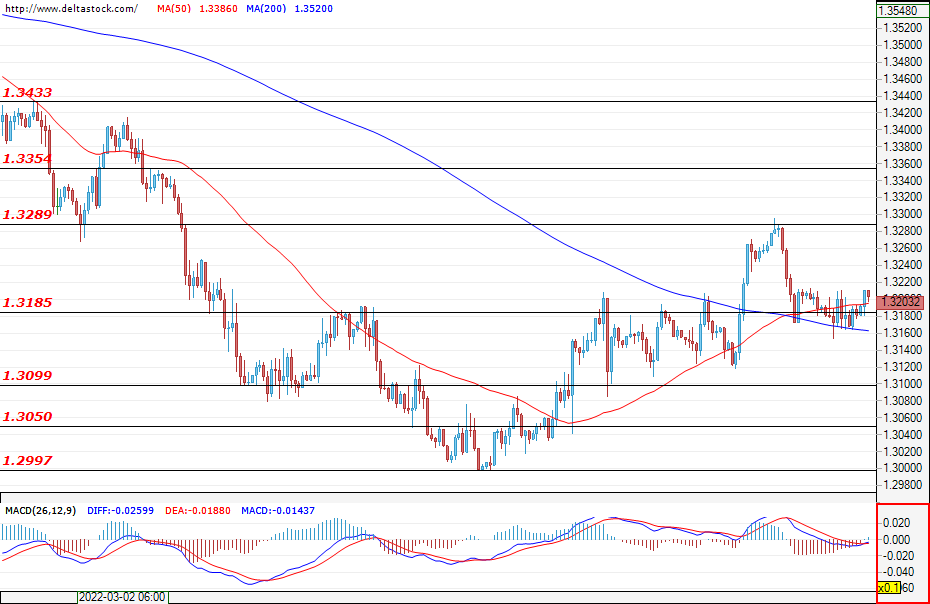
Trading in the past session was quiet and the price of the currency pair has so far managed to consolidate above the support at 1.3185. A signal that buyers could return to the market for a longer period would be a new test and overcoming the resistance at 1.3289. If this does not happen and the important supports at 1.3050 and 1.2997 are overcome, it is likely that the pound will move into a downward trend.
EUGERMANY40
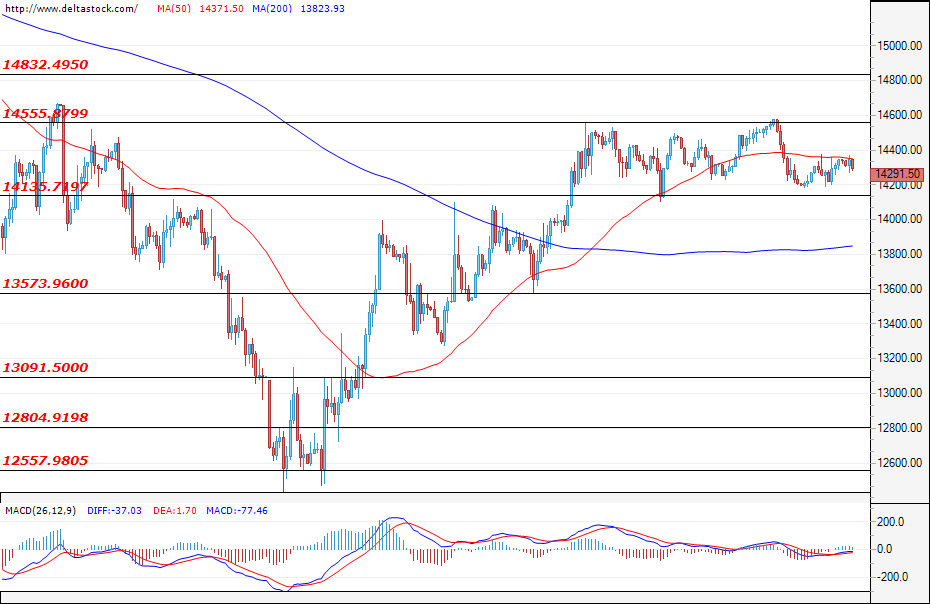
During the last session, the German index failed to test the resistance at 14555, but still remained above the support at 14135. If we have in mind the precarious situation in Ukraine and in case the bulls fail to break the resistance at 14555, the bears may again prevail. If this happens and they overcome the support at 14135, we can witness new sales to the next major level at 13573.
US30
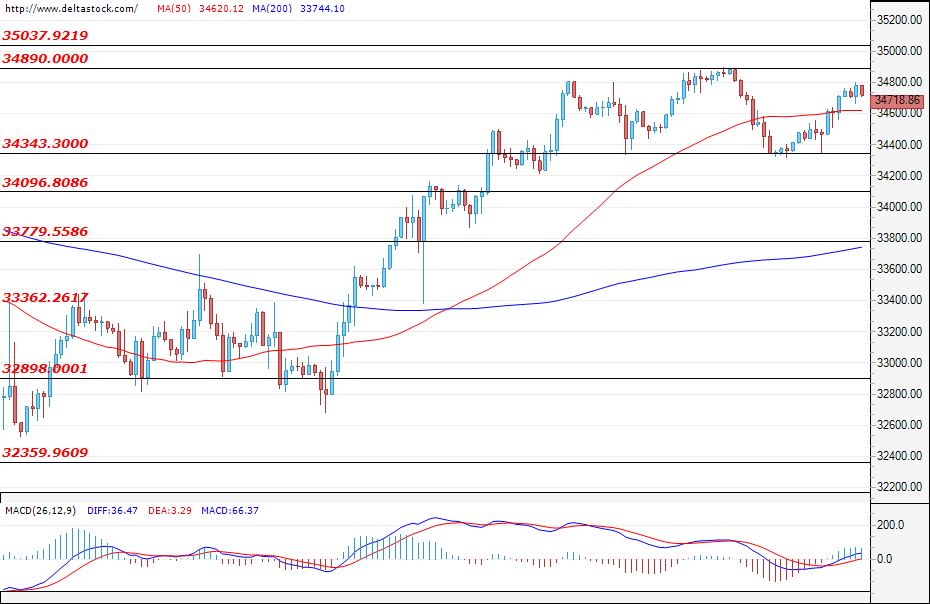
The last session was successful for the American Blue Chip Index. It managed to stop its decline and focus on the important resistance at 34890. At the time of writing, the price is 34690, but if the price turns to the support level at 34360 and if overcome, it is possible that the bears will return to the market.