Sample Category Title
UK retail sales dropped -0.3% mom in Feb, ex-fuel sales down -0.7% mom
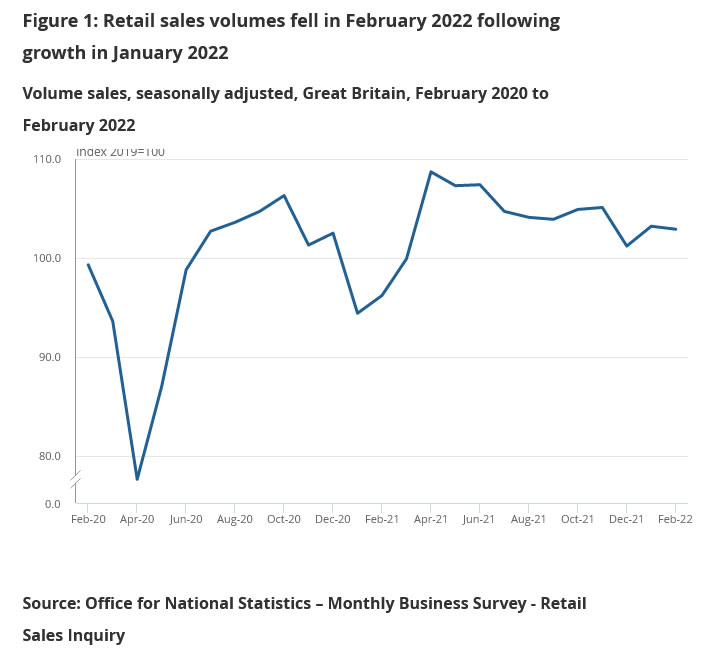
UK retail sales volume dropped -0.3% mom in February, much worse than expectation of 1.0% mom rise. On a 12-month basis, sales rose 7.0% yoy, below expectation of 7.8% yoy. Also, sales volume was 3.7% above pre-pandemic level in February 2020.
Ex-fuel sales volume dropped -0.7% mom, below expectation of 0.5% mom. On a 12-month basis, sales rose 4.6% yoy, below expectation of 5.0% yoy. Ex-fuel sales volume was 4.0% above pre-pandemic level in February 2020.
Auto fuel sales volume rose 3.6% mom, above pre-pandemic level (by 0.9%) for the first time, on lifting of restrictions and increased travel.
EUR/USD Daily Outlook
Daily Pivots: (S1) 1.0971; (P) 1.0993; (R1) 1.1019; More...
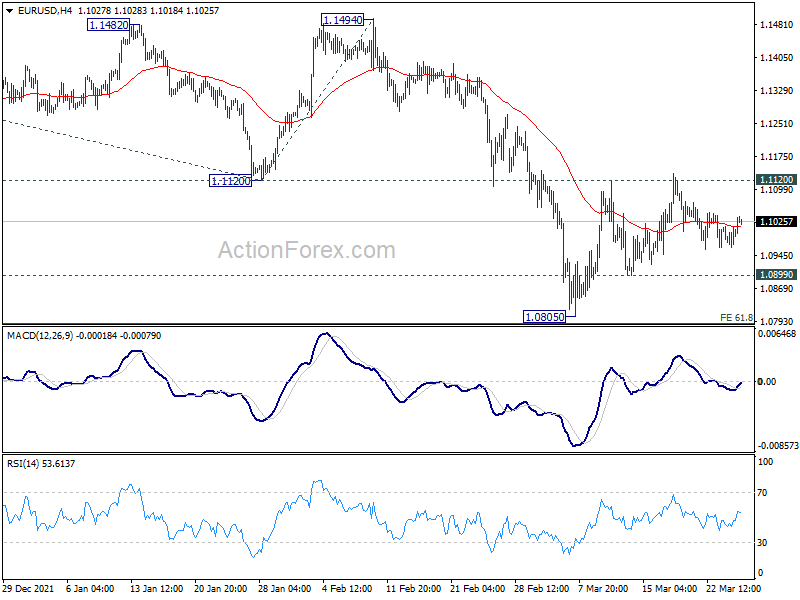
Intraday bias in EUR/USD stays neutral as range trading continues. On the downside, below 1.0899 minor support will turn bias back to the downside for 61.8% projection of 1.2265 to 1.1120 from 1.1494 at 1.0786. However, firm break of 1.1120 will confirm short term bottoming at 1.0805. Bias will be back on the upside for 55 day EMA (now at 1.1173) and above.
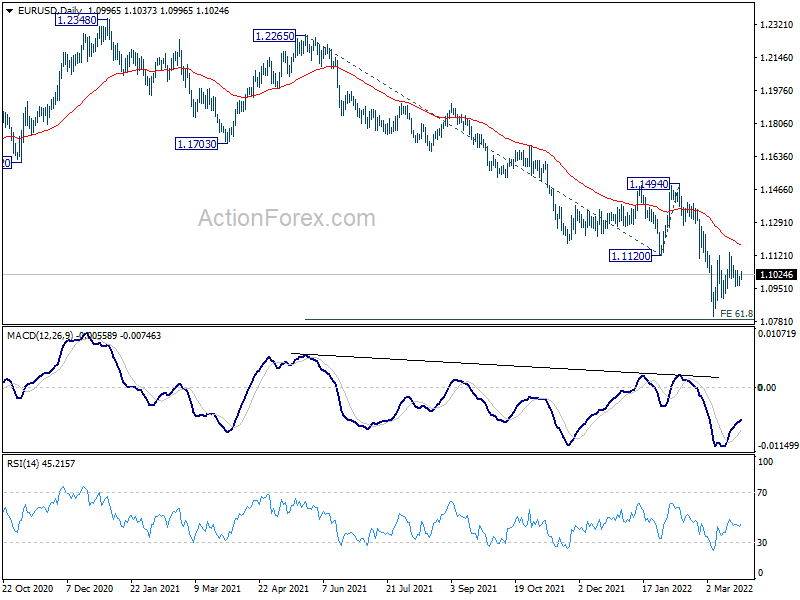
In the bigger picture, the decline from 1.2348 (2021 high) is expected to continue as long as 1.1494 resistance holds. Firm break of 1.0635 (2020 low) will raise the chance of long term down trend resumption and target a retest on 1.0339 (2017 low) next. Nevertheless, break of 1.1494 will maintain medium term neutral outlook, and extending term range trading first.
GBP/USD Daily Outlook
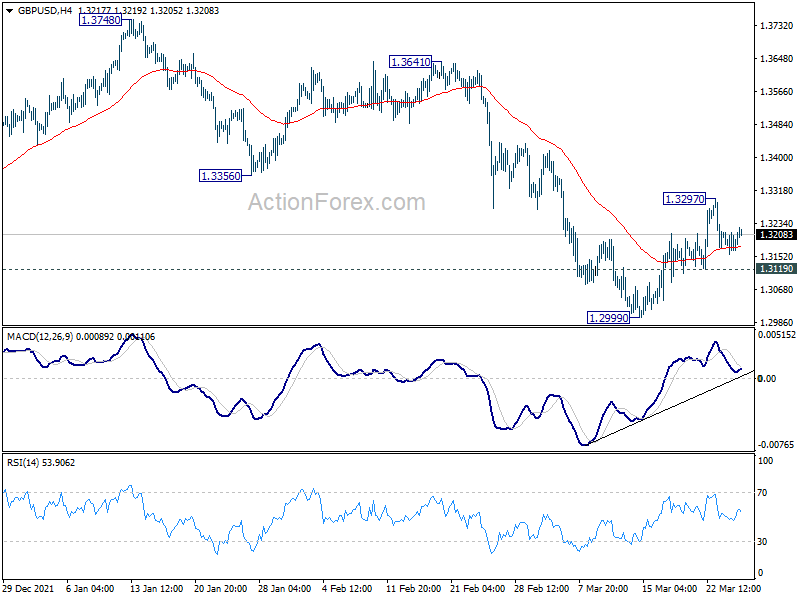
Daily Pivots: (S1) 1.3158; (P) 1.3186; (R1) 1.3215; More...
Intraday bias in GBP/USD remains neutral as range trading continues. On the downside, break of 1.3119 minor support will turn bias back to the downside for retesting 1.2999. Firm break there will resume larger down trend from 1.4248. On the upside, above 1.3297 will resume the rebound to 55 day EMA (now at 1.3341). Sustained break there will target medium term channel resistance (now at 1.3590).
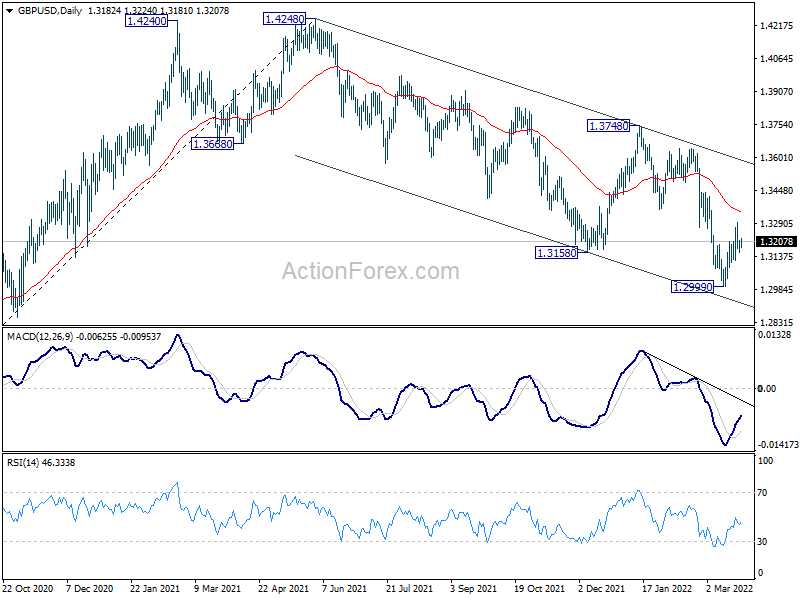
In the bigger picture, current development suggests that the up trend from 1.1409 (2020 low) has completed at 1.4248. Decline from 1.4248 could still be a corrective move, or it could be the start of a long term down trend. In either case, deeper decline would be seen back to 61.8% retracement of 2.1161 to 1.1409 at 1.2493. In any case, break of 1.3748 resistance is needed to indicate medium term bottoming, or outlook will stay bearish.
USD/CHF Daily Outlook
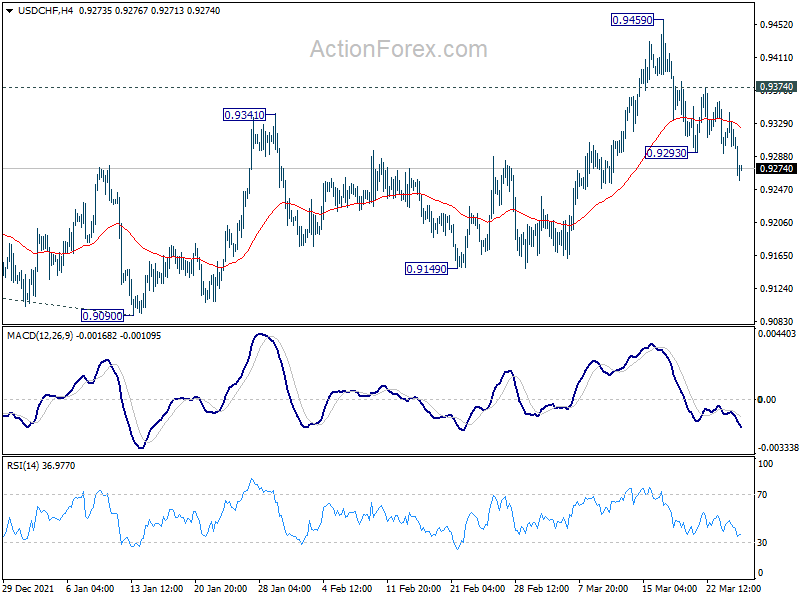
Daily Pivots: (S1) 0.9283; (P) 0.9314; (R1) 0.9333; More....
USD/CHF's fall from 0.9459 resumes by breaking 0.9293. Intraday bias is back on the downside. Sustained break of 55 day EMA (0.9255) will target 0.9149 structural support. On the upside, break of 0.9374 minor resistance will flip bias back to the upside for 0.9459 resistance instead.
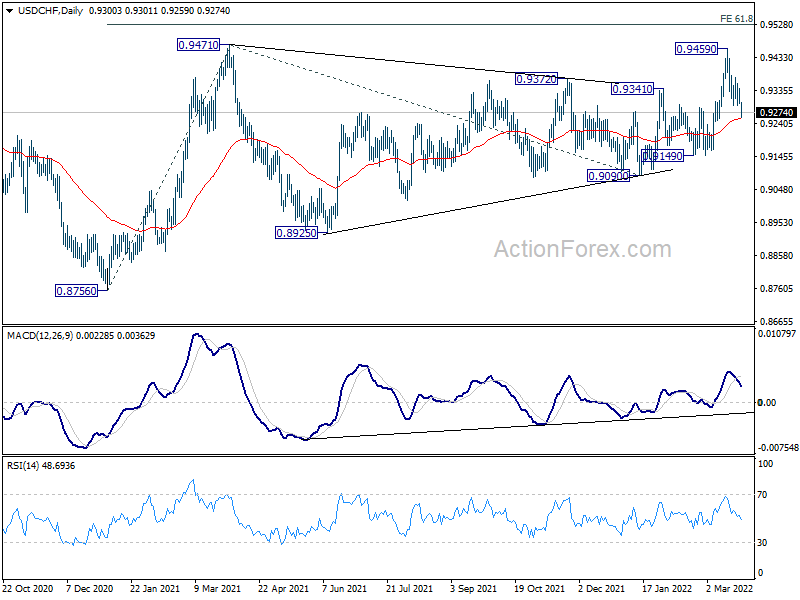
In the bigger picture, medium term outlook will be neutral at best as long as 0.9471 resistance holds. Larger down trend could still extend through 0.8756 (2021 low). However, firm break of 0.9471 will argue that whole down trend form 1.0342 (2016 high), has completed with waves down to 0.8756. A medium term up trend should be set up to target 1.0237/0342 resistance zone.
USD/JPY Daily Outlook
Daily Pivots: (S1) 121.41; (P) 121.91; (R1) 122.86; More...
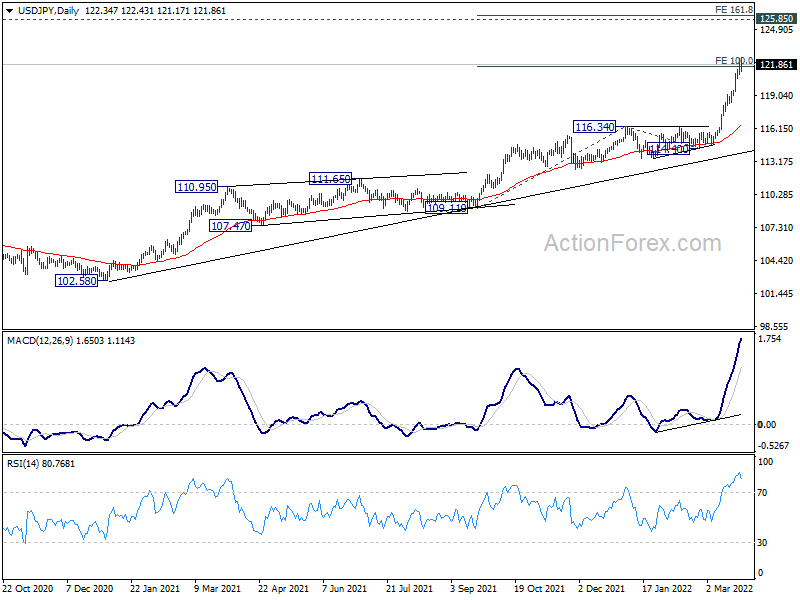
Intraday bias in USD/JPY remains on the upside in spite of current retreat. Sustained trading above 100% projection of 109.11 to 116.34 from 114.40 at 121.63, will pave the way to 125.85 long term resistance. On the downside, however, below 120.58 minor support will turn intraday bias neutral and bring consolidations first, before staging another rally.
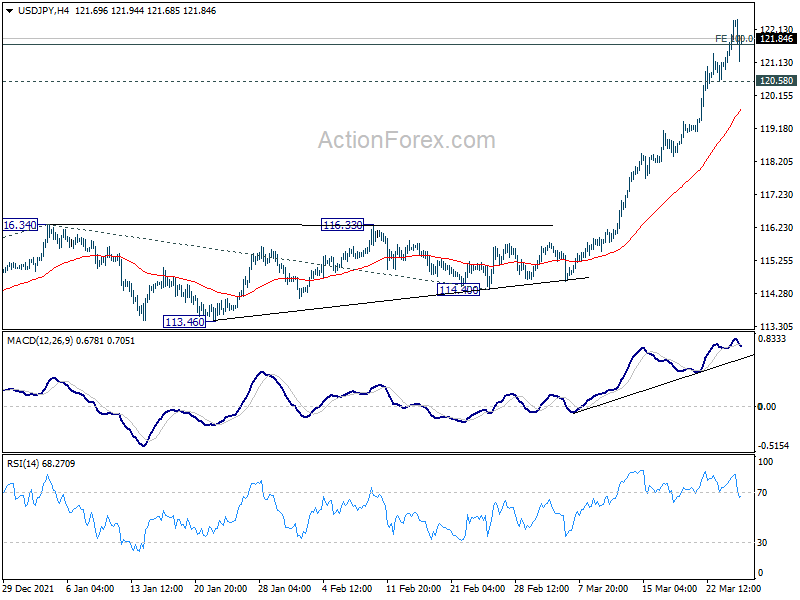
In the bigger picture, the break of 118.65 resistance (2016 high) suggest that up trend from 98.97 (2016 low) is resuming, with rise from 101.18 (2020 low) as the third leg. Medium term outlook will remain bullish as long as 113.46 low. Next target is 125.85 (2015 high).
USD/CAD Daily Outlook
Daily Pivots: (S1) 1.2495; (P) 1.2541; (R1) 1.2571; More...
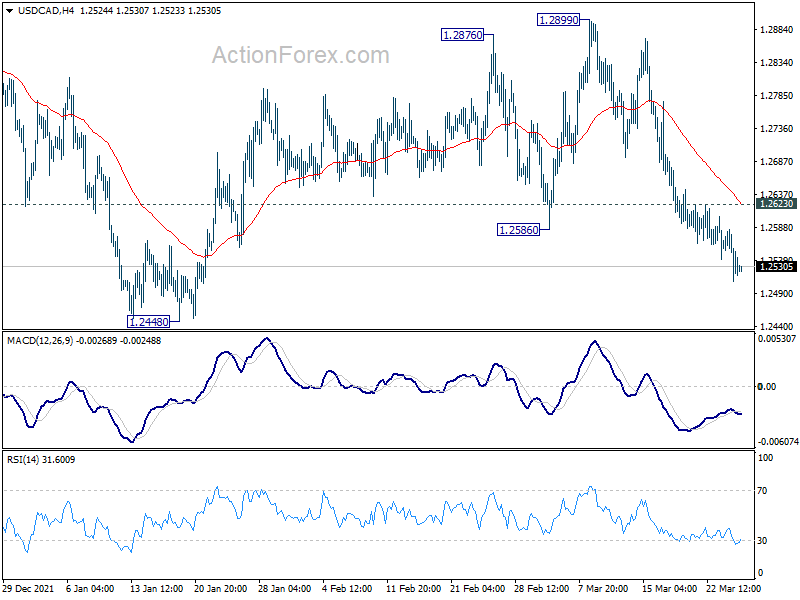
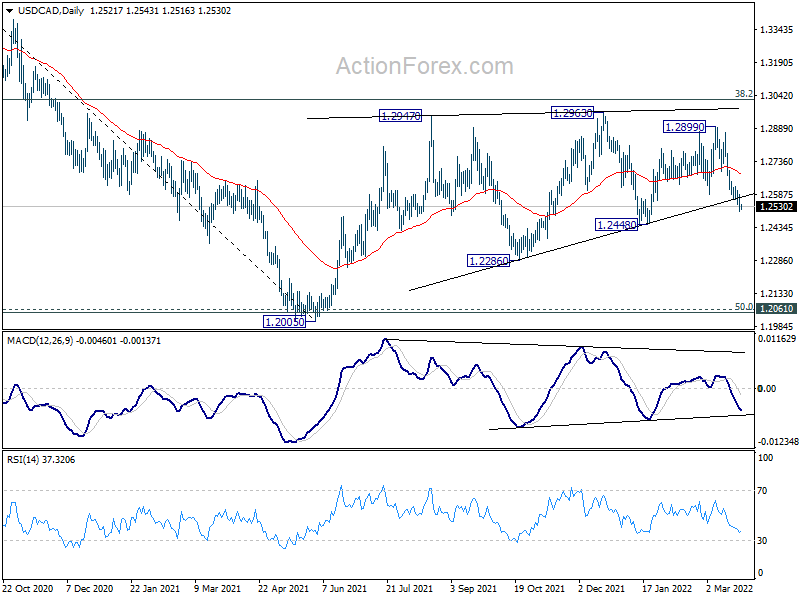
USD/CAD is picking up downside momentum again and intraday bias stays on the downside for 1.2448 support first. Firm break there will argue that whole corrective pattern from 1.2005 has completed and bring retest of this low. On the upside, however, break of 1.2623 minor resistance will mix up the outlook again and turn intraday bias neutral first.
In the bigger picture, focus stays on 38.2% retracement of 1.4667 (2020 high) to 1.2005 (2021 low) at 1.3022. Sustained break there should confirm that the down trend from 1.4667 has completed after defending 1.2061 long term cluster support. Further rise would then be seen towards 61.8% retracement at 1.3650. However, rejection by 1.3022 will maintain medium term bearishness. Break of 1.2005 will resume the down trend from 1.4667 and that carries larger bearish implications too.
AUD/USD Daily Report
Daily Pivots: (S1) 0.7477; (P) 0.7503; (R1) 0.7538; More...
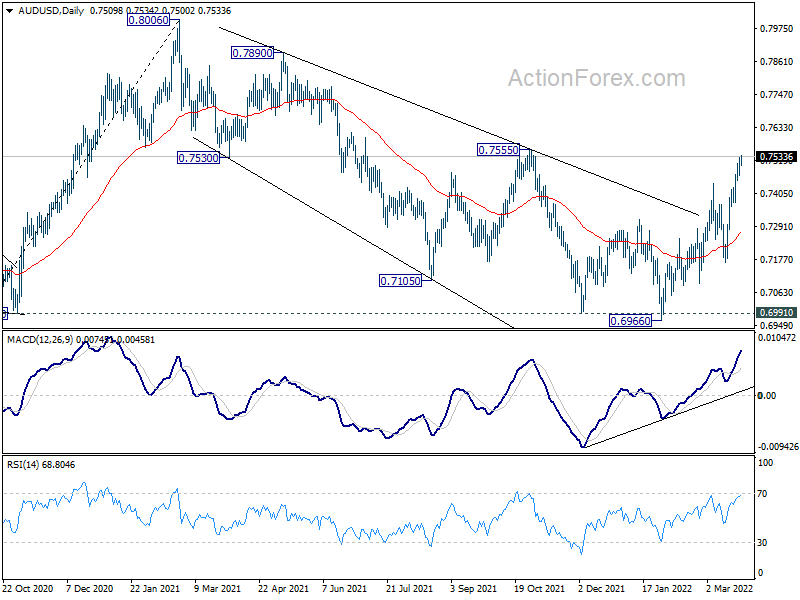
AUD/USD's rally resumed after brief retreat and intraday bias is back on the upside for 0.7555 resistance. Decisive break there should confirm that whole corrective decline from 0.8006 has completed at 0.6966. Further raise should then be seen back to retest 0.8005. On the downside, below 0.7465 minor support will turn intraday bias neutral again.
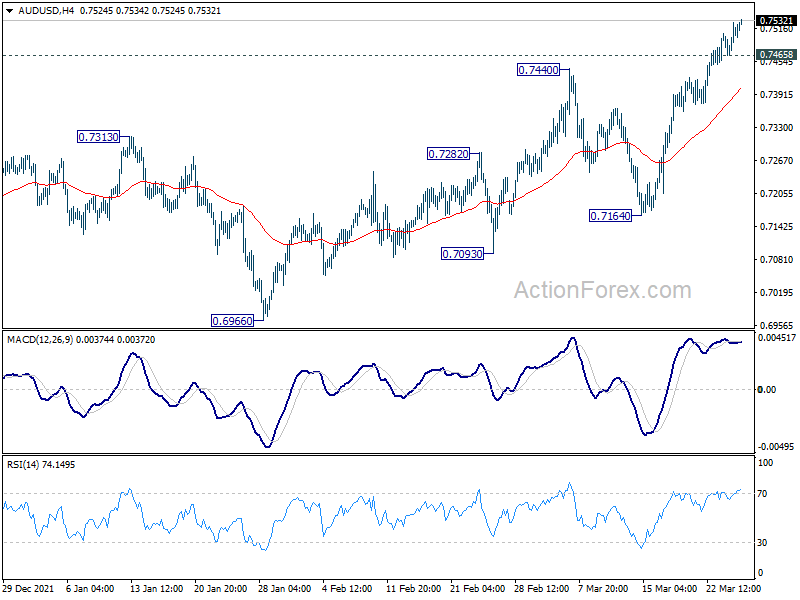
In the bigger picture, strong rebound from 0.6991 key structural support retains medium term bullishness. That is, whole up trend from 0.5506 is still in progress for another rise through 0.8006 at a later stage. However, sustained break of 0.6991 will argue that the whole up trend from 0.5506 might be finished at 0.8006, after rejection by 0.8135 long term resistance. Deeper decline would then be seen back to 61.8% retracement of 0.5506 to 0.8006 at 0.6461.
Dollar Turning Softer in Mixed Markets, Gold Extends Rebound
Overall markets are mixed in Asia today. While stocks in Hong Kong are suffering renewed selling, Japan and Singapore are steady. Gold is lifted by general weakness in Dollar. Yen's selling looks more and more exhausted even though it's still the worst performing one for the week, followed by Euro and the greenback. On the other hand, commodity currencies are staying firm as led by Aussie. Sterling is mixed and would look into retail sales data for some inspiration.
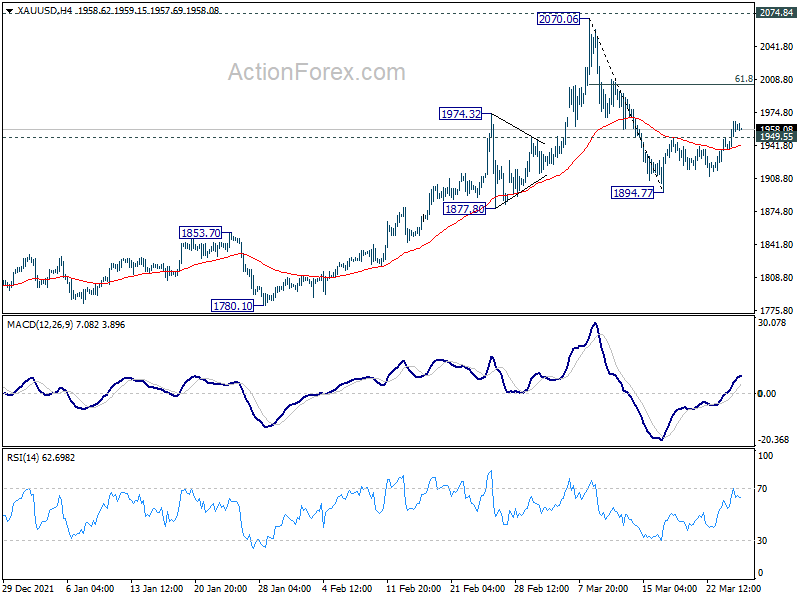
Technically, Gold's rebound form 1894.77 resumed by breaking though 1949.55 minor resistance. Further rise should be seen back to 61.8% retracement of 2070.06 to 1894.77 at 2003.09, which is close to 2000 handle. It's still early to conclude the pattern from 2070.06 has completed. Thus, price actions would remain choppy and directionless from a larger point of view. Nevertheless, the development could be an indication of some weakness in Dollar. Focus would turn to see if EUR/USD could break through 1.1120 with some conviction to confirm.
In Asia, Nikkei closed up 0.09%. Hong Kong HSI is down -2.32%. China Shanghai SSE is down -0.87%. Singapore Strait Times is up 0.43%. Japan 10-year JGB yield is up 0.0069 at 0.247, pressing 0.25 handle. Overnight, DOW rose 1.02%. S&P 500 rose 1.43%. NASDAQ rose 1.93%. 10-year yield rose 0.02 to 2.341.
Fed Evans comfortable with 25 bps hike, open to 50bps
Chicago Fed President Charles Evans said yesterday he's "comfortable" with a 25bps hike and "open" to a 50bps move.
"We want to be careful, we want to be humble and nimble, and get to neutral before too long — maybe 50 helps, I'm open to that," he said in a Q&A session after a speech. "I would be comfortable with each meeting increasing by a quarter point."
"This is a signal of more general pressure from aggregate demand on today's impinged supply," he said in the speech. "If monetary policy did not respond to these broader pressures, we would see higher inflation become embedded in inflation expectations, and we would have even harder work to do to rein it in."
"Policymakers need to be cautious, humble, and nimble as we navigate the course ahead," Evans said. "Monetary policy is not on a preset course" but will be decided at each Fed meeting.
ECB Schnabel leaves the door ajar on asset purchases
ECB Executive Board member Isabel Schnabel said yesterday that it had "left the door ajar" for more asset purchases if the impact of Russia invasion of Ukraine turn out to be much worse.
"If we now fall into a deep recession due to the Ukraine crisis, we'll have to rethink that," she said. "Otherwise, we'll end the bond purchases in the third quarter and as soon as we've done that we can raise rates at any time depending on how inflation develops."
Separately, Governing Council member Mario Centeno emphasized "normalization of the ECB's monetary policy will be carried out gradually and proportionally at the end of this year".
BoJ Kuroda: Weak yen is generally positive for Japan's economy
BoJ Governor Haruhiko Kuroda told the parliament, "there's no change now to my view a weak yen is generally positive for Japan's economy."
He also reiterated the view that "cost-push inflation that is not accompanied by wage hikes will hurt Japan's economy." And as such, "it won't lead to sustained achievement of our price target. That's why the BOJ will continue to maintain powerful monetary easing."
Released from Japan, Tokyo CPI core rose from 0.5% yoy to 0.8% yoy in March, above expectation of 0.7% yoy. Corporate service price index rose 1.1% yoy in February, below expectation of 1.2% yoy.
UK Gfk consumer confidence dropped to -31, a wall of worry is confronting
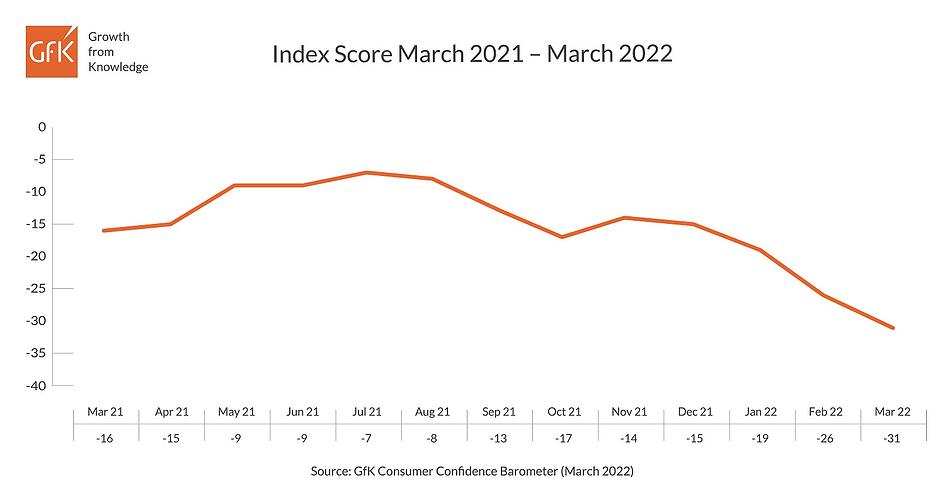
UK Gfk Consumer Confidence Index dropped from -26 to -31 in March. That's the lowest level since November 2020. Personal Financial Situation over last 12 months dropped from -11 to -13. Personal Financial Situation over next 12 months dropped from -14 to -18. General Economic Situation over last 12 months dropped slightly from -50 to -51. Genera Economic Situation over next 12 months dropped from -43 to -49.
Joe Staton, Client Strategy Director GfK, says: "A wall of worry is confronting consumers this month and there is an unmistakable sense of crisis in our numbers. Consumers across the UK are experiencing the impact of soaring living costs with 30-year-high levels of inflation, record-high fuel and food prices, a recent interest-rate hike and the prospect of more increases to come, and higher taxation too – all against a background of stagnant pay rises that cannot compensate for the financial duress. This is the fourth month in a row that UK consumer confidence has dropped."
Looking ahead
UK retail sales, Germany Ifo business climate and Eurozone M3 money supply will be released in European session. US will release pending home sales later in the day.
AUD/USD Daily Report
Daily Pivots: (S1) 0.7477; (P) 0.7503; (R1) 0.7538; More...
AUD/USD's rally resumed after brief retreat and intraday bias is back on the upside for 0.7555 resistance. Decisive break there should confirm that whole corrective decline from 0.8006 has completed at 0.6966. Further raise should then be seen back to retest 0.8005. On the downside, below 0.7465 minor support will turn intraday bias neutral again.
In the bigger picture, strong rebound from 0.6991 key structural support retains medium term bullishness. That is, whole up trend from 0.5506 is still in progress for another rise through 0.8006 at a later stage. However, sustained break of 0.6991 will argue that the whole up trend from 0.5506 might be finished at 0.8006, after rejection by 0.8135 long term resistance. Deeper decline would then be seen back to 61.8% retracement of 0.5506 to 0.8006 at 0.6461.
Economic Indicators Update
| GMT | Ccy | Events | Actual | Forecast | Previous | Revised |
|---|---|---|---|---|---|---|
| 23:30 | JPY | Tokyo CPI Core Y/Y Mar | 0.80% | 0.70% | 0.50% | |
| 23:30 | JPY | Corporate Service Price Index Y/Y Feb | 1.10% | 1.20% | 1.20% | |
| 00:01 | GBP | GfK Consumer Confidence Mar | -31 | -30 | -26 | |
| 07:00 | GBP | Retail Sales M/M Feb | 1.00% | 1.90% | ||
| 05:30 | GBP | Retail Sales Y/Y Feb | 3.90% | 9.10% | ||
| 07:00 | GBP | Retail Sales ex-Fuel M/M Feb | 1.30% | 1.70% | ||
| 05:30 | GBP | Retail Sales ex-Fuel Y/Y Feb | 5.00% | 7.20% | ||
| 09:00 | EUR | Germany IFO Business Climate Mar | 94.5 | 98.9 | ||
| 09:00 | EUR | Germany IFO Expectations Mar | 97.2 | 99.2 | ||
| 09:00 | EUR | Germany IFO Current Assessment Mar | 97.4 | 98.6 | ||
| 09:00 | EUR | Eurozone M3 Money Supply Y/Y Feb | 6.30% | 6.40% | ||
| 14:00 | USD | Pending Home Sales M/M Feb | 1.40% | -5.70% | ||
| 14:00 | USD | Michigan Consumer Sentiment Index Mar F | 59.7 | 59.7 |
Technical Outlook and Review
DXY:
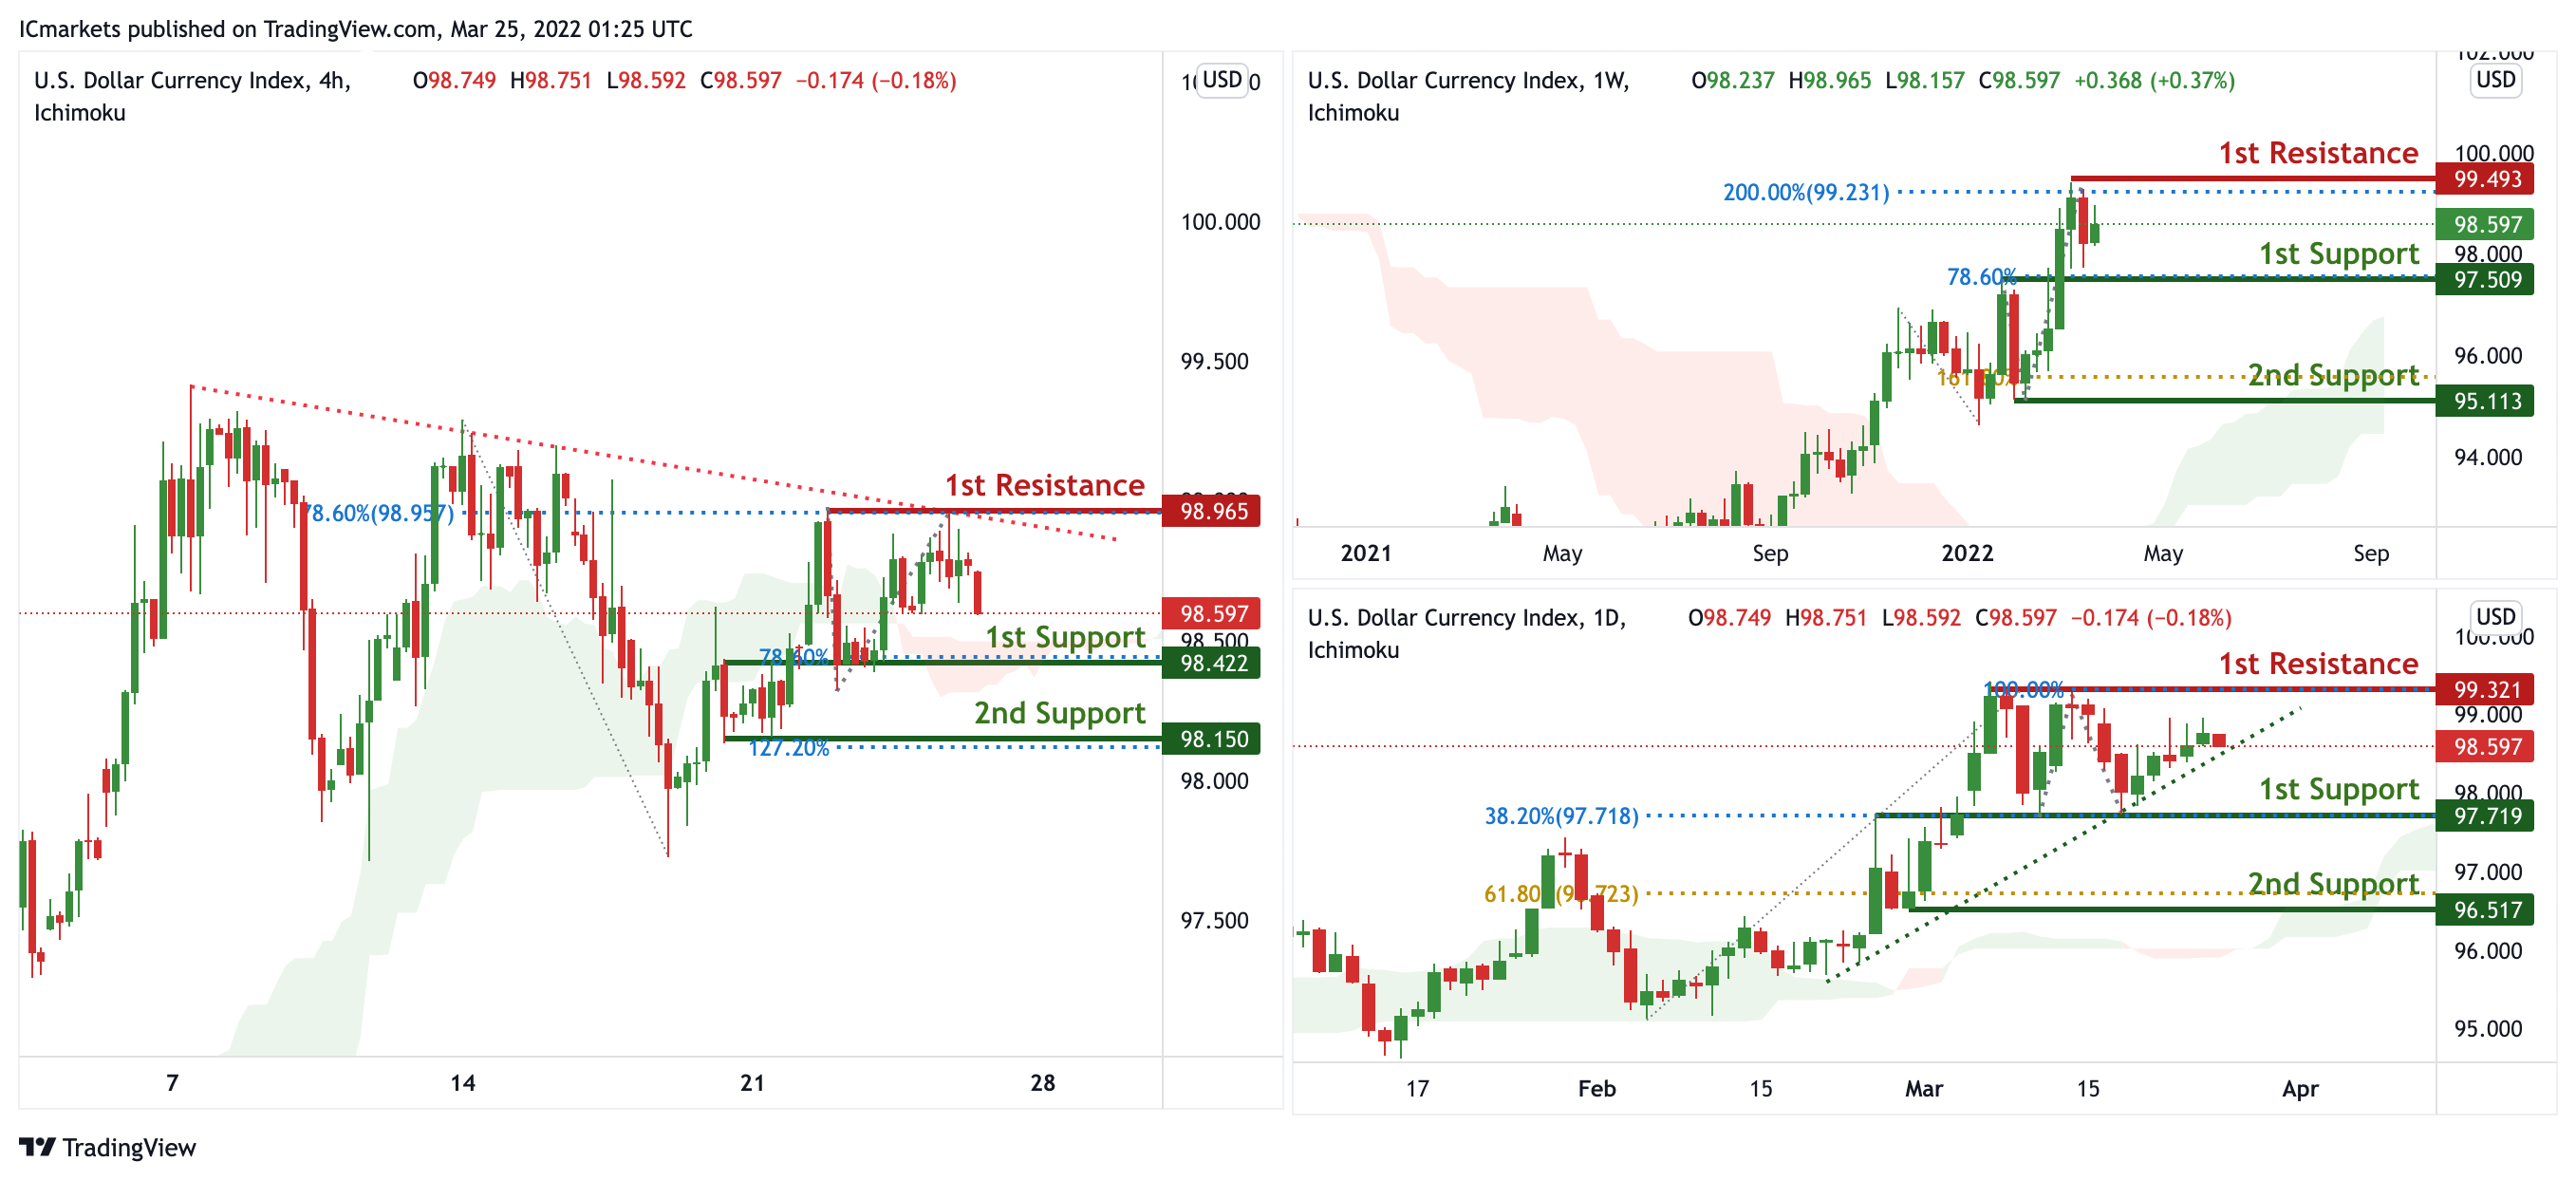
On the weekly, prices are on bullish momentum. We see the potential for further bullish continuation from our 1st support at 97.509 in line with 78.6% Fibonacci retracement towards our 1st resistance at 99.493 in line with 200% Fibonacci Projection. Prices are trading above our ichimoku cloud support, further supporting our bullish bias. On the daily, prices are on bullish momentum and abiding by our ascending trendline support. We see the potential for bullish continuation from our 1st support at 97.719 in line with 38.2% Fibonacci retracement towards our 1st resistance at 99.321 in line with 100% Fibonacci Projection. Prices are trading above our ichimoku cloud support, further supporting our bullish bias. On the H4 timeframe, prices are abiding by a descending trendline resistance. We see the potential for a dip from our 1st resistance at 98.665 in line with 78.6% Fibonacci retracement towards our 1st support at 98.422 in line with 78.6% Fibonacci projection. Prices are trading below our ichimoku cloud resistance, further supporting our bearish bias.
Areas of consideration:
- H4 time frame, 1st resistance at 98.422
- H4 time frame, 1st support at 98.623
XAU/USD (GOLD):
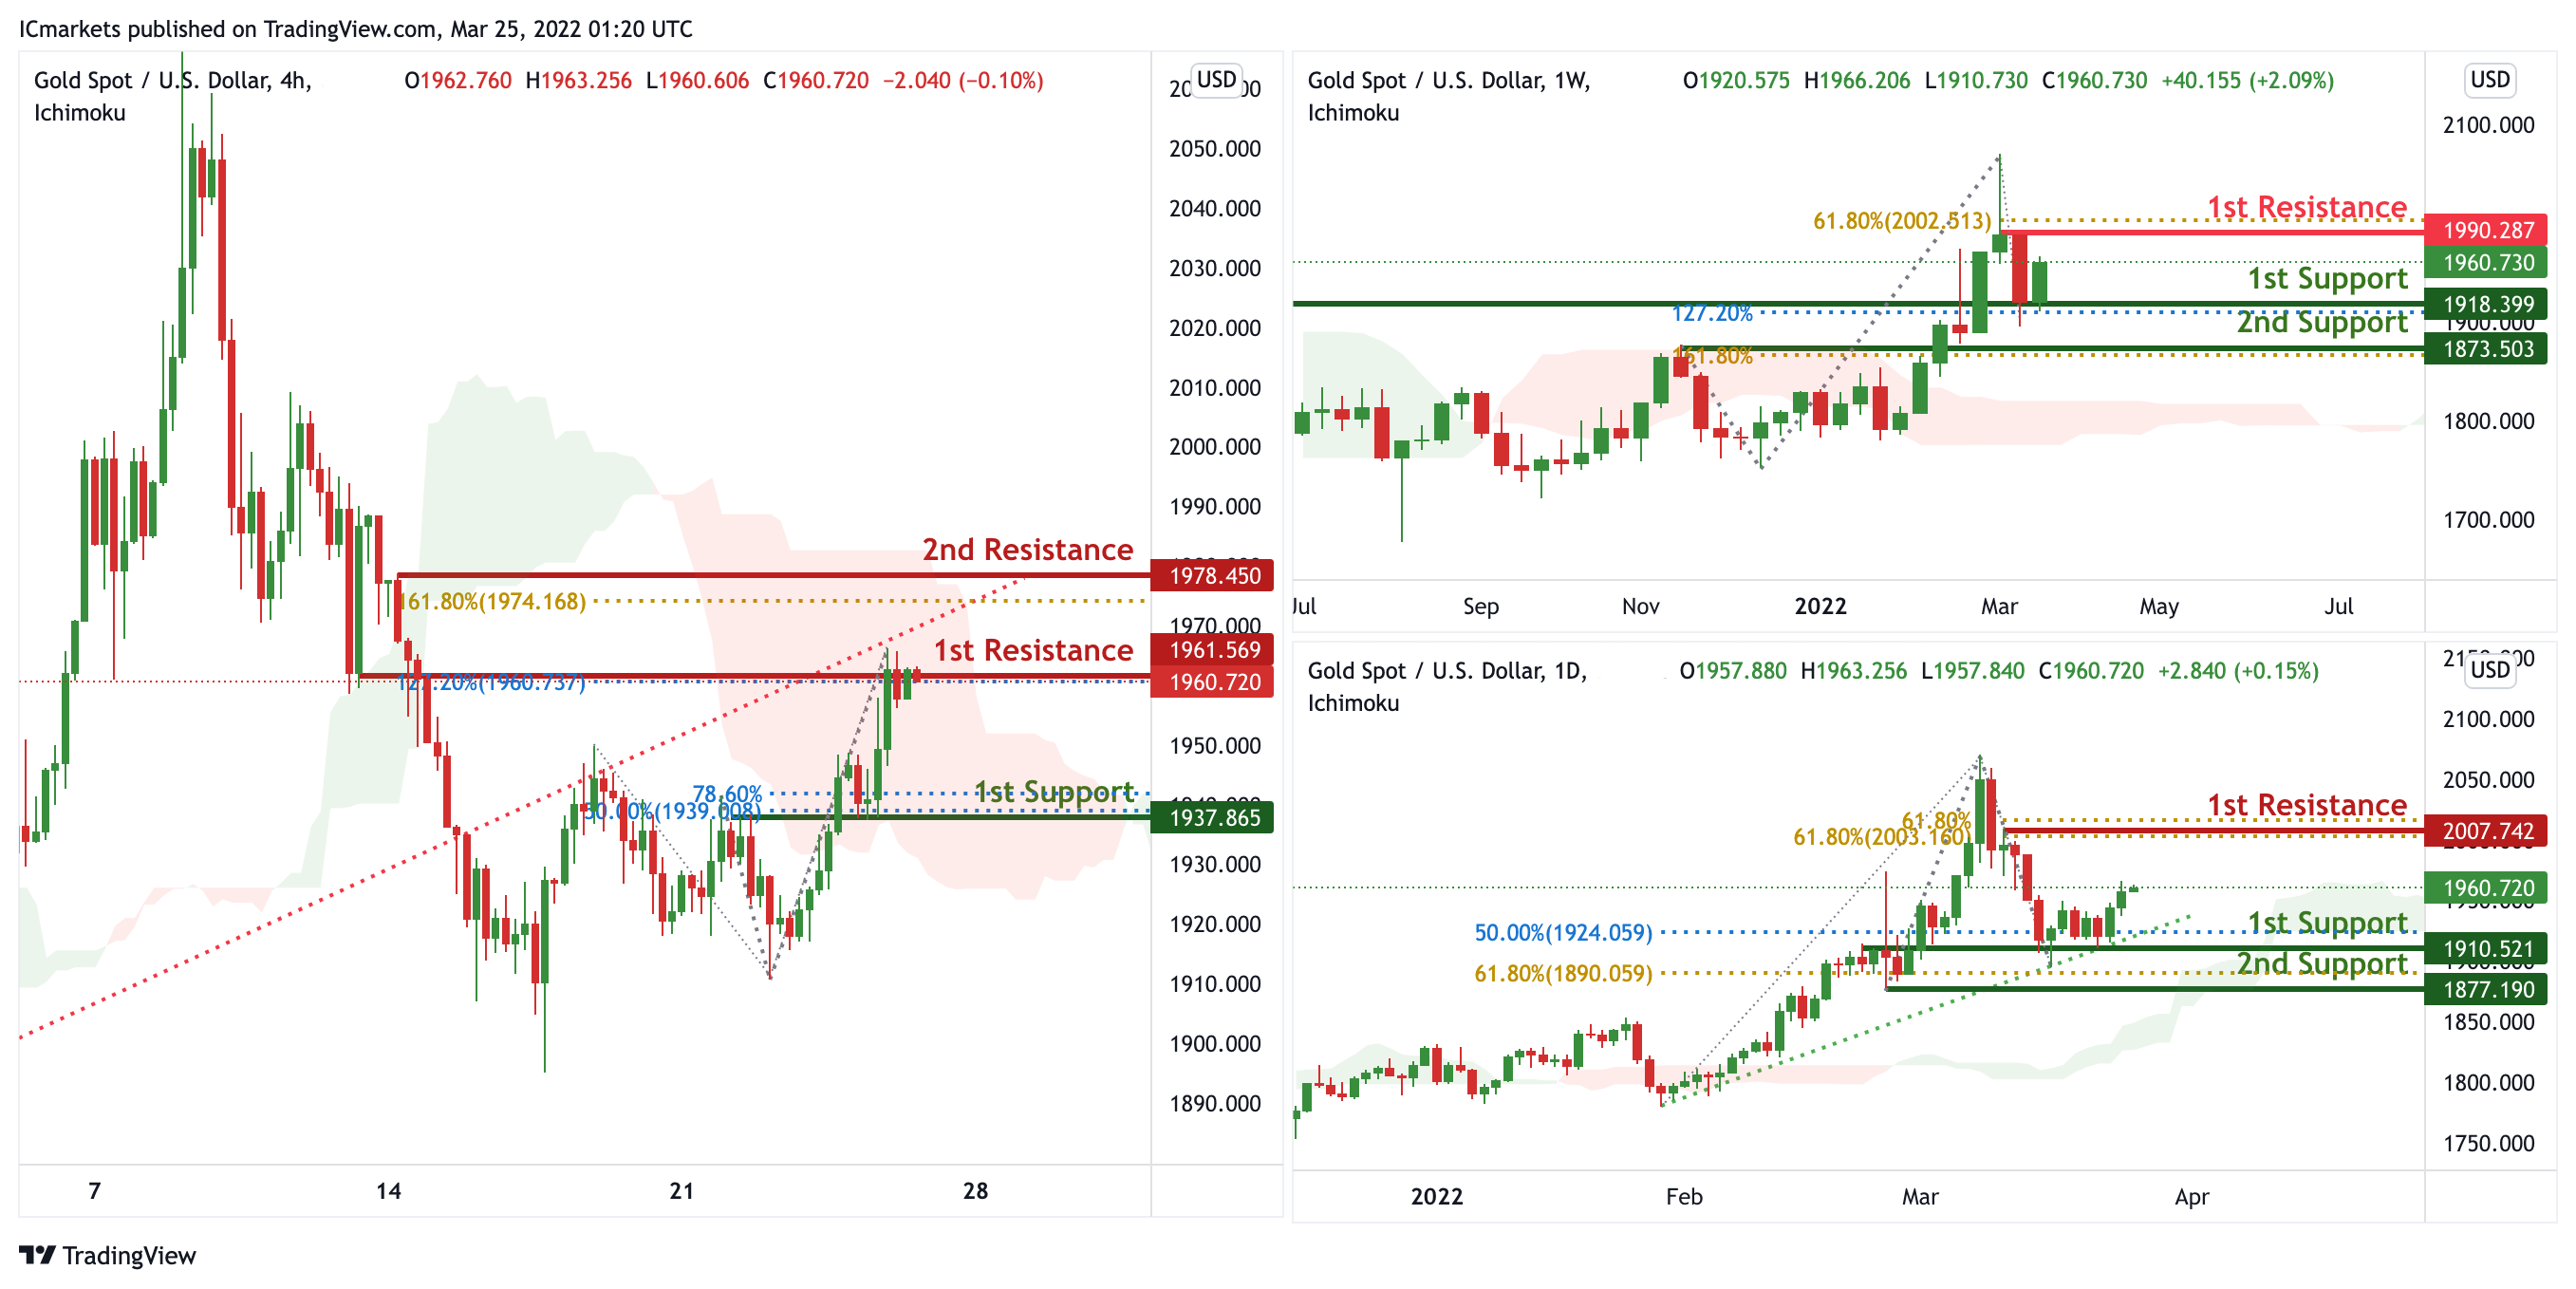
On the weekly, prices are on bullish momentum. We see the potential for a bounce from our 1st support at 1918.399 in line with 127.2% FIbonacci extension towards our 1st resistance at 1990.287 in line with 61.8% FIbonacci retracement. Prices are trading above our ichimoku clouds, further supporting our bullish bias. On the daily, prices are on bullish momentum and abiding by our ascending trendline support. We see the potential for bullish continuation from our 1st support at 1910.521 in line with 50% Fibonacci retracement towards our 1st resistance at 2007.742 in line with 61.8% Fibonacci retracement and 61.8% Fibonacci Projection. Prices are trading above our ichimoku cloud support, further supporting our bullish bias. On the H4, prices are on bearish momentum and approaching a key pivot. We see the potential for a dip from our 1st resistance at 1949.865 which is an area of Fibonacci confluences towards our 1st support at 1940.587 in line with 23.6% Fibonacci Retracementand also graphical overlap. Prices are trading below our ichimoku clouds, further supporting our bearish bias.
Areas of consideration:
- 4h 1st support at 1940.587
- 4h 1st resistance at 1949.865
GBP/USD:
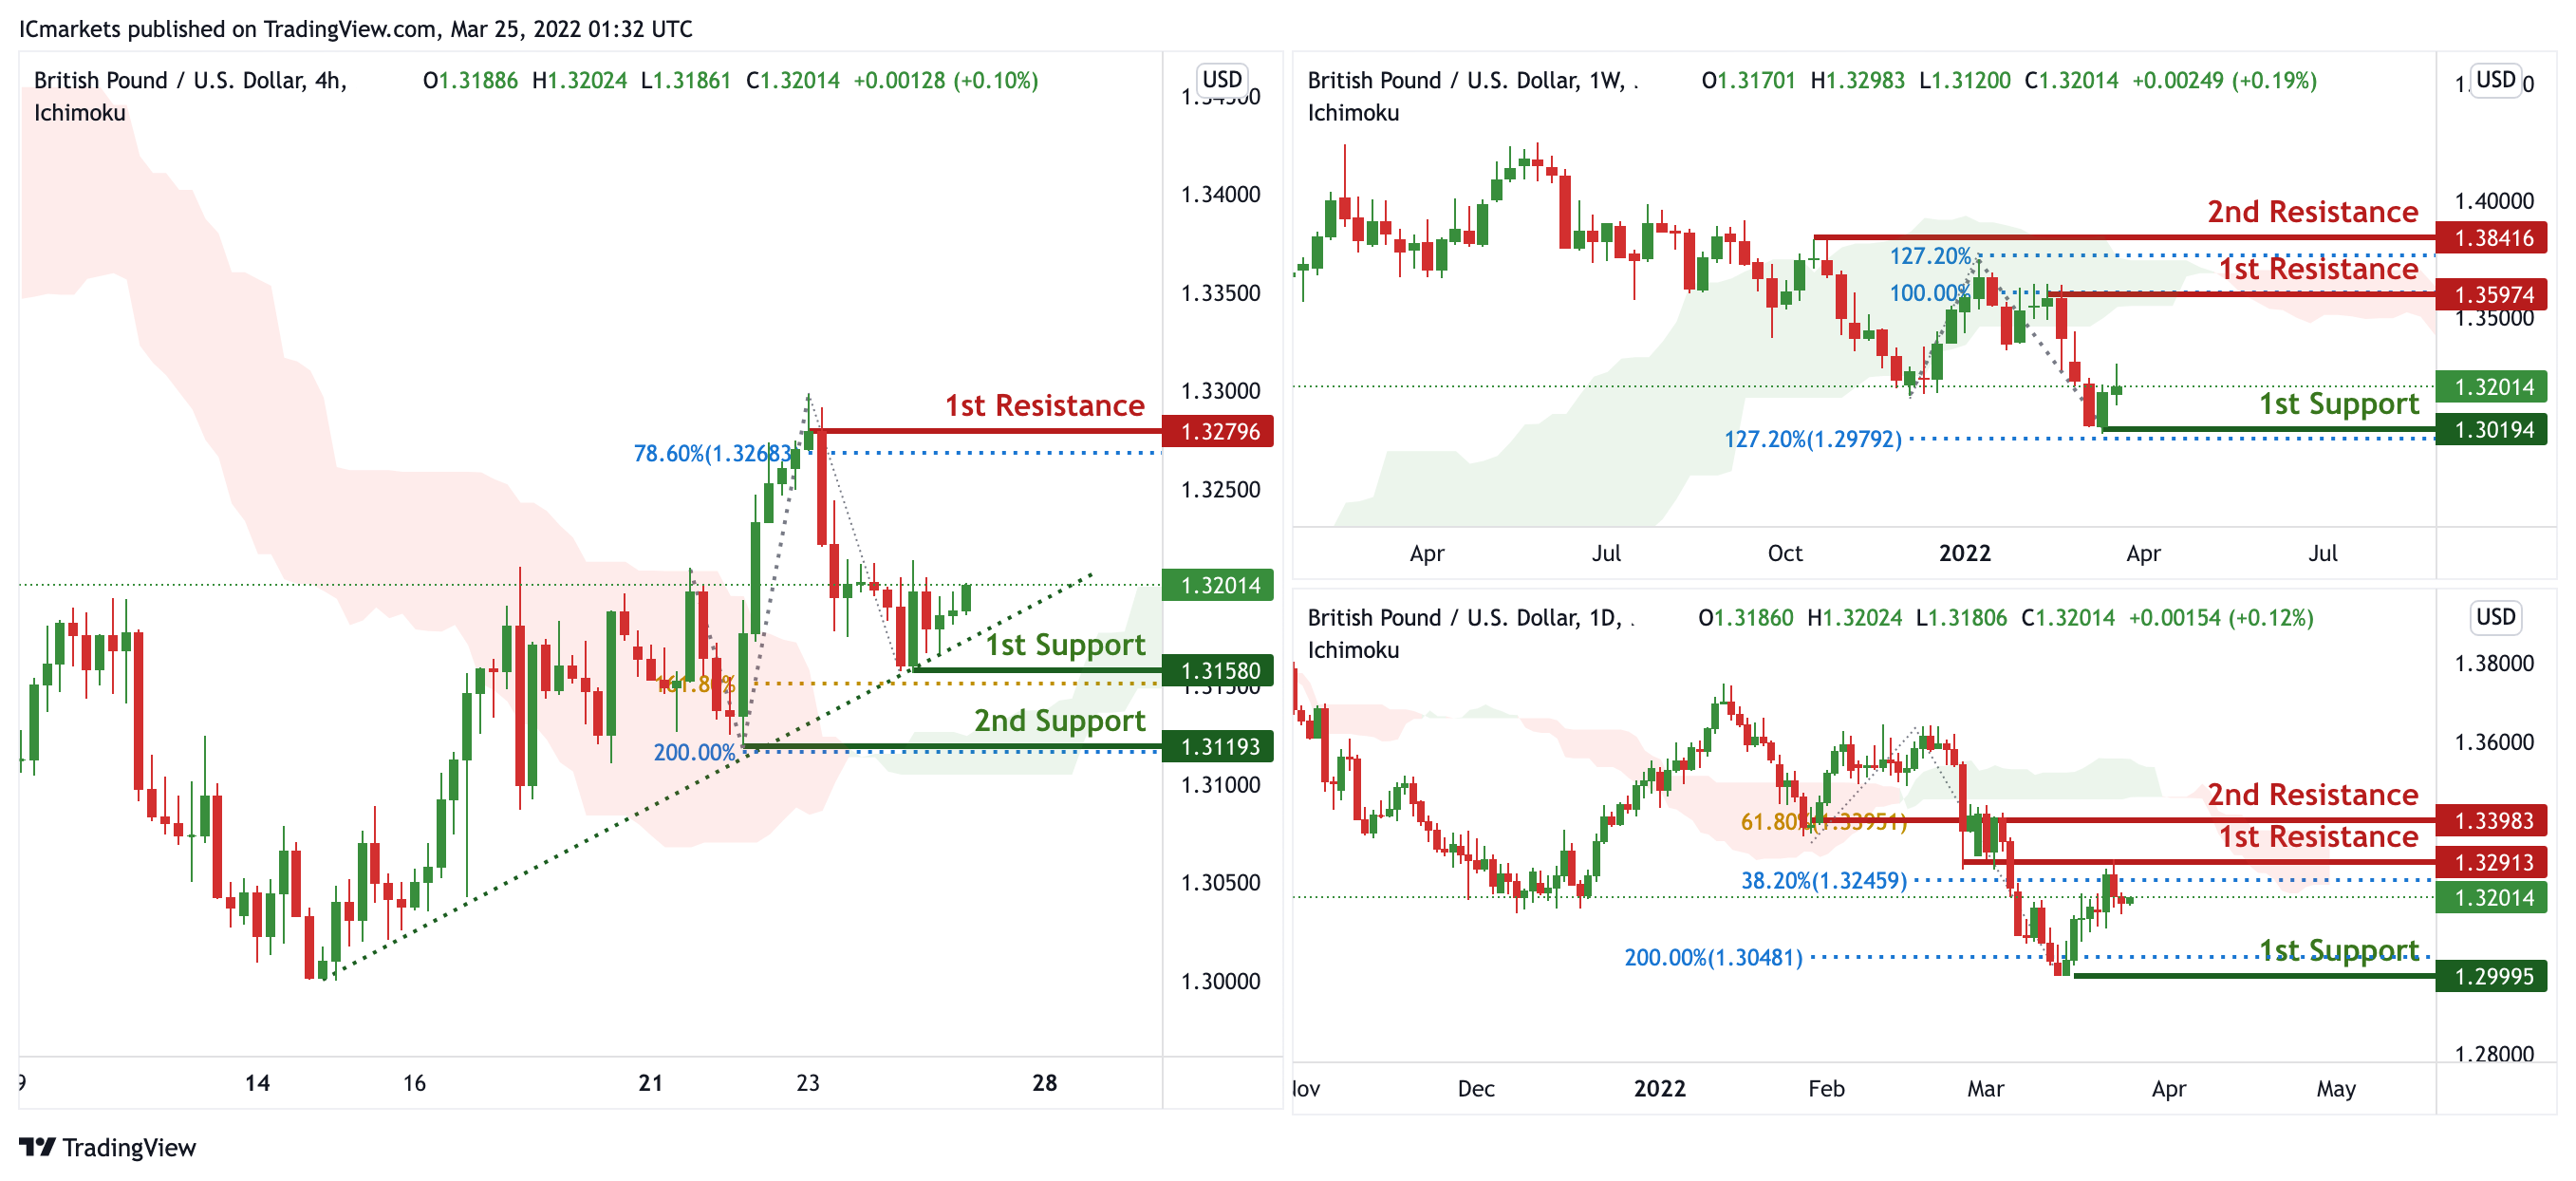
On the weekly, prices are at a swing low. We see the potential for a short bounce from our 1st support at 1.30194 in line with 127.2% Fibonacci extension towards our 1st resistance at 1.35974 in line with 100% Fibonacci Projection. On the daily, prices are on bearish momentum. We see the potential for a short from our 1st resistance at 1.32913 in line with 38.2% Fibonacci retracement towards our 1st support at 1.29995 in line with 200% Fibonacci Projection. Prices are trading below our ichimoku cloud resistance, further supporting our bearish bias. On the H4, prices are on bullish momentum and abiding by our ascending trendline support. We see the potential for a bounce from our 1st support at 1.31580 which is a graphical swing low and in line with 161.8% Fibonacci Projection towards our 1st resistance at 1.32796 which is a graphical swing high and in line with 78.6% Fibonacci Projection. Prices are trading above our ichimoku clouds, further supporting our bullish bias. Alternatively, breaking the 1st support will call for a bearish dip towards our 2nd support at 1.31193 which was a graphical swing low and in line with 200% Fibonacci Projection.
Areas of consideration:
- H4 1st resistance at 1.32796
- H4 1st support at 1.31580
USD/CHF:
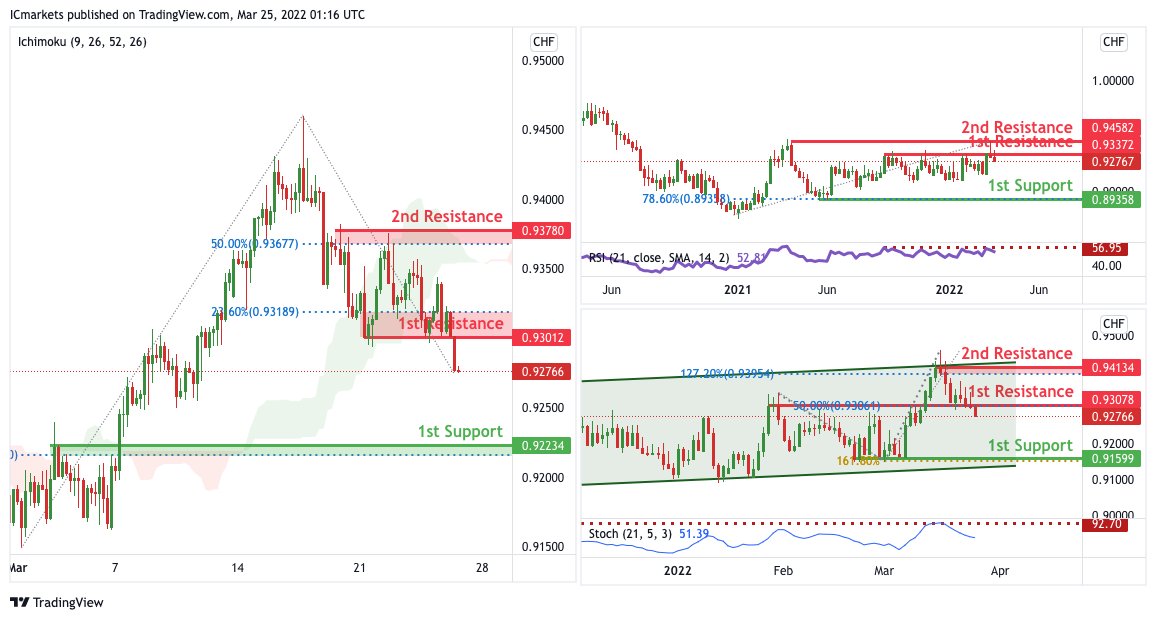
On the Weekly, with price expected to reverse off our RSI indicator, we have a bias that price will drop from 1st resistance to our 1st support .Alternatively, price may break 1st resistance and head for 2nd resistance.
On the Daily, with price expected to reverse off our stochastics indicator, we have a bias that price will drop from 1st resistance to our 1st support .Alternatively, price may break 1st resistance and head for 2nd resistance.
On the H4, with price moving below our ichimoku cloud, we have a bias that price will drop from 1st resistance at 0.93012 in line with the horizontal pullback resistance and 23.6% Fibonacci retracement to 1st support at 0.92234 in line with the pullback support and 78.6% Fibonacci retracement .Alternatively, price may break 1st resistance and head for 2nd resistance at 0.93780 in line with the 50% Fibonacci retracement.
Areas of consideration
- 1st support level 0.92234
- 1st resistance 0.93012
EUR/USD :
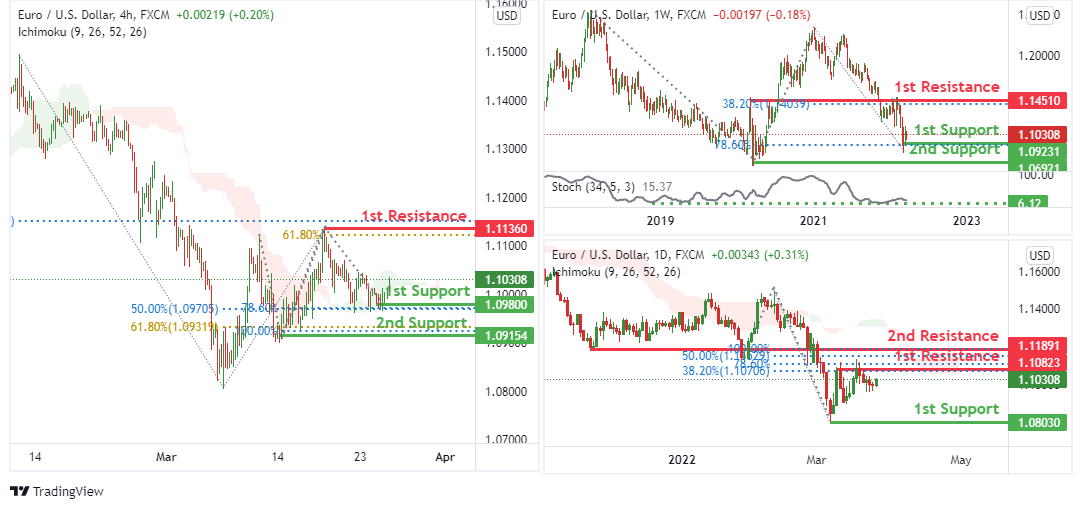
On the weekly, we see the potential for a bullish bounce from our 1st support at 1.09231 in line with 78.6% Fibonacci projection towards our 1st resistance at 1.14510 in line with 38.2% Fibonacci retracement. Our bullish bias is supported by the stochastic indicator where it is at support level. On the daily, we see the potential for a bearish dip from our 1st resistance at 1.10823 in line with 78.6% Fibonacci projection and 38.2% Fibonacci retracement towards our 1st support at 1.08030 in line with a graphical swing low support. Our bearish bias is supported by price trading below the ichimoku cloud indicator. On the H4 timeframe, we see the potential for a bullish bounce from our 1st support at 1.09800 in line with 78.6% Fibonacci projection and 50% Fibonacci retracement towards our 1st resistance at 1.11360 in line with 61.8% Fibonacci projection. Our bearish bias is supported by price trading below the ichimoku cloud indicator.
Areas of consideration :
- H4 1st resistance at 1.11360
- H4 1st support at 1.09800
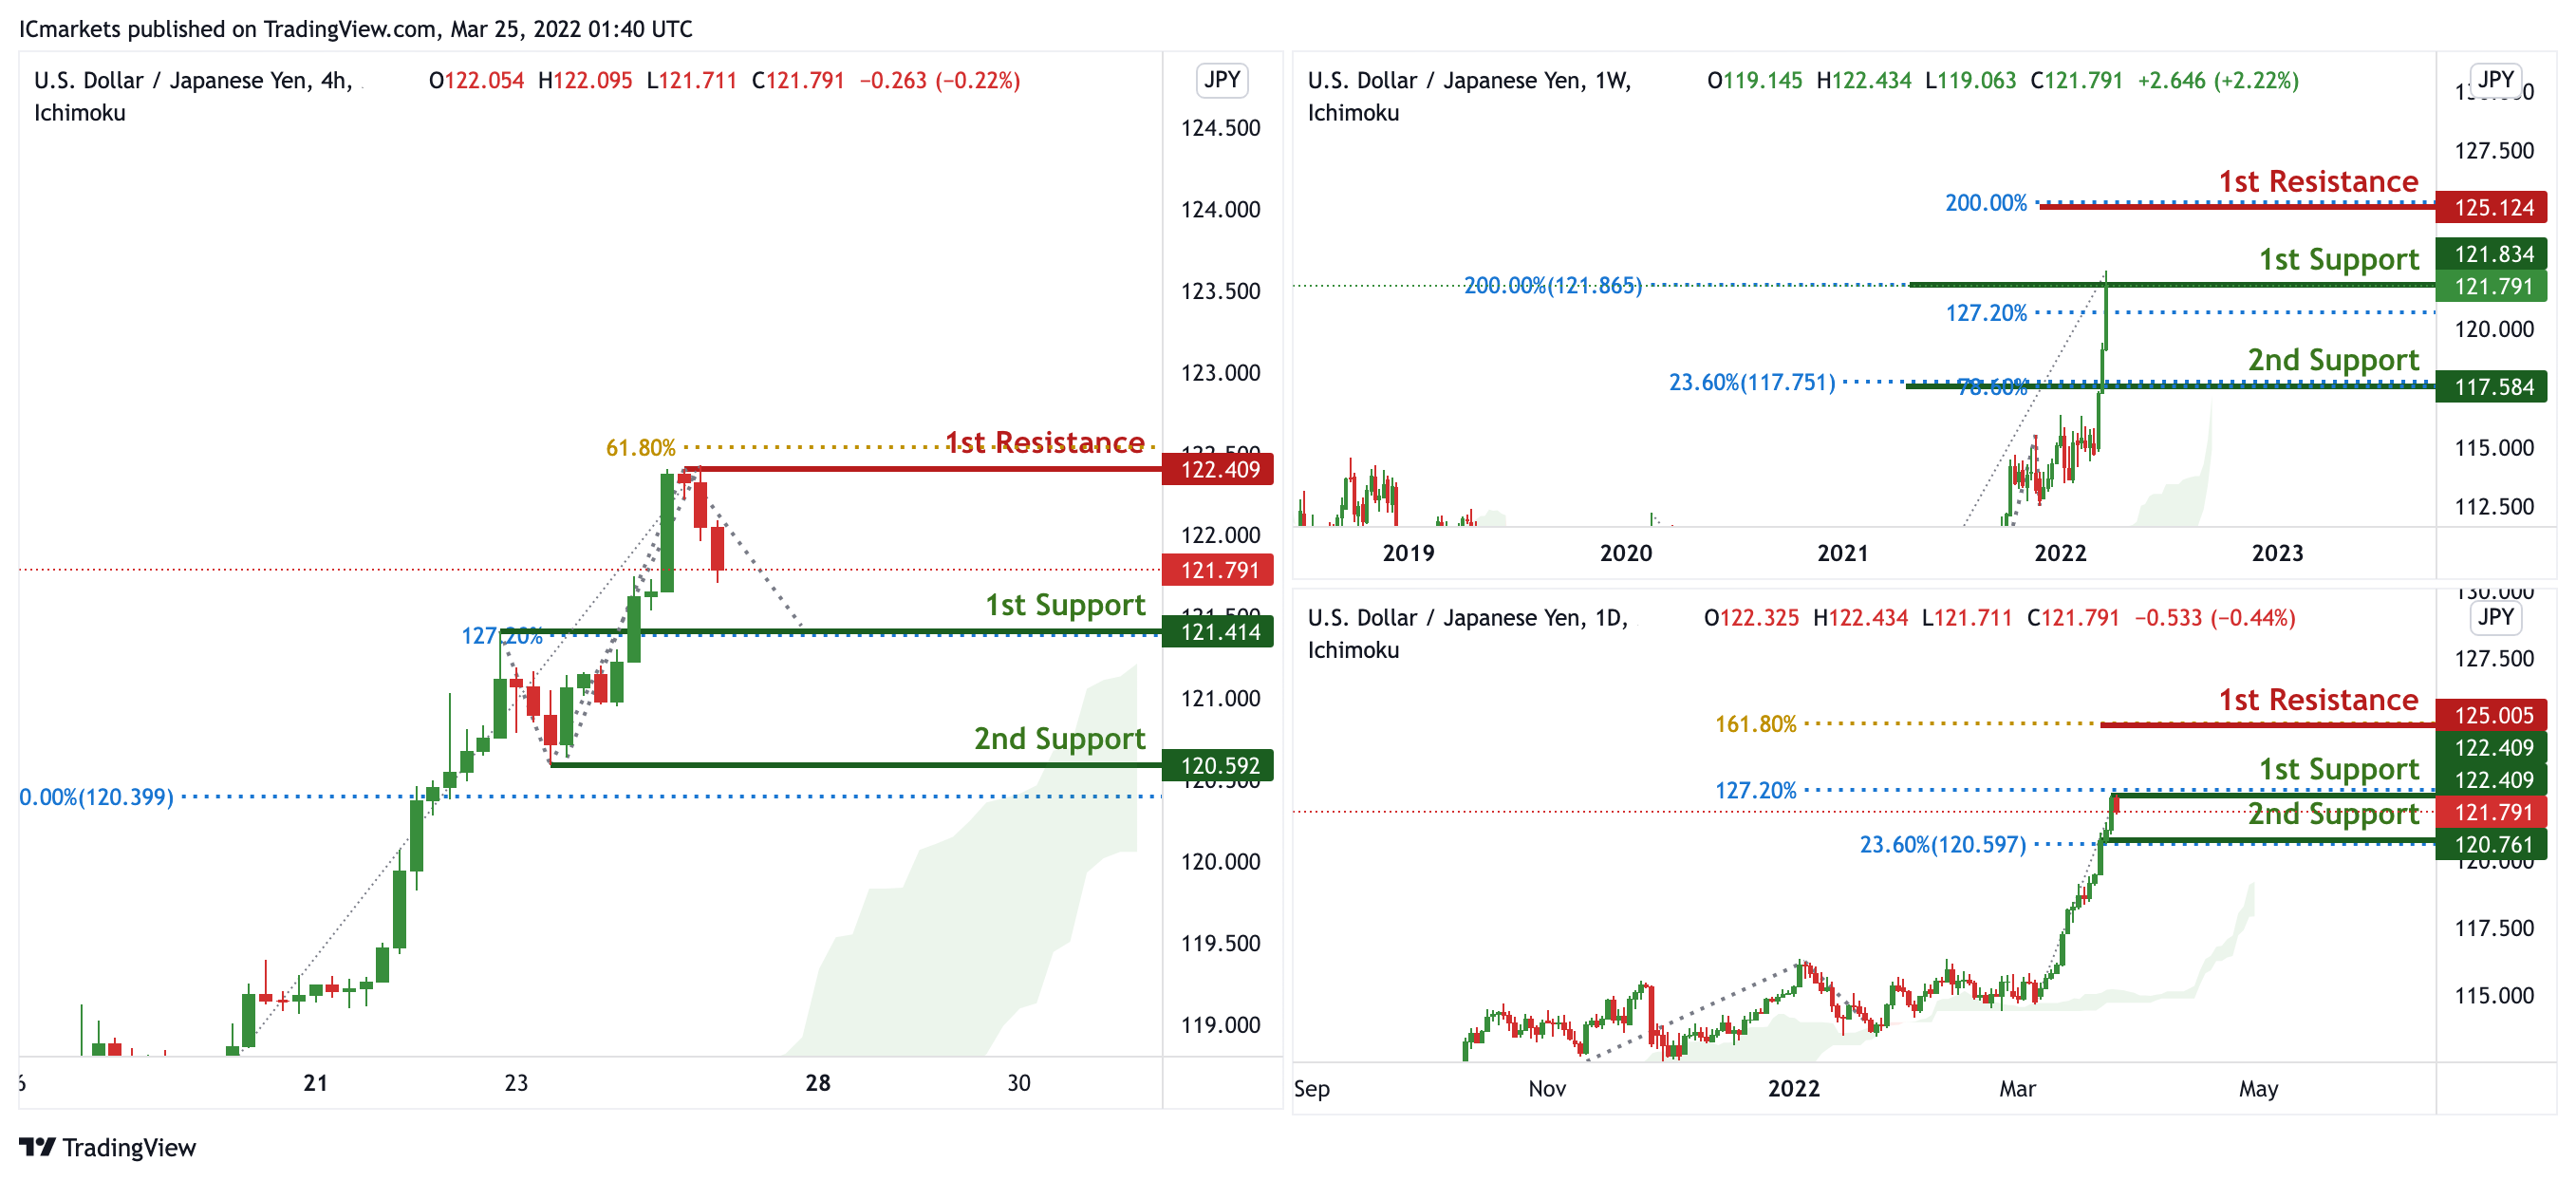
USD/JPY:
On the H4 timeframe, prices have approached pivot and swing high. We see the potential for further bullish continuation from our 1st support at 121.834 in line with 127.2% Fibonacci extension and 200% Fibonacci projection towards our 1st resistance at 125.125 in line with 200% Fibonacci Projection. Prices are trading above our ichimoku cloud support, further supporting our bullish bias. On the H4 timeframe, prices have approached pivot and swing high. We see the potential for a short pullback from our 1st support at 122.409 in line with 127.2% Fibonacci extension towards our 1st support at 120.761 in line with 23.6% Fibonacci retracement. On the H4 timeframe, prices have approached pivot and swing high. We see the potential for a short pullback from our 1st resistance at 122.409 in line with 61.8% Fibonacci Projection towards our 1st support at 121.414 in line with 127.2% Fibonacci Retracement. Divergence is spotted on RSI, further supporting our bearish bias.
Areas of consideration:
- H4 time frame, 1st resistance at 122.409
- H4 time frame, 1st support at 121.414
AUD/USD:
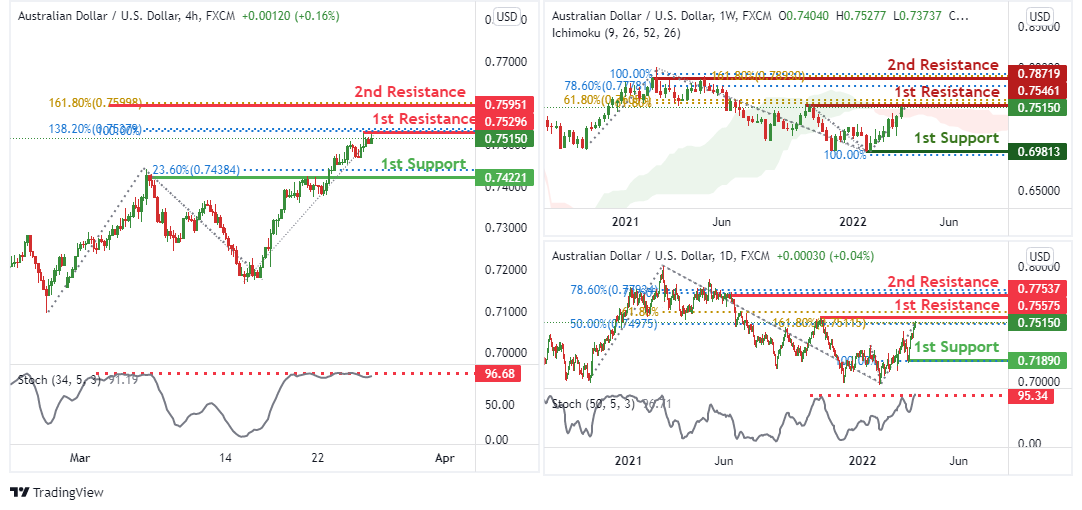
On the weekly, we see the potential for a bearish reversal from our 1st resistance at 0.75461 in line with 61.8% Fibonacci retracement and 61.8% Fibonacci projection towards our 1st support at 0.69813 in line with 100% Fibonacci projection. Price is trading below the ichimoku cloud indicator, further supporting our bearish bias. On the daily, we see the potential for a bearish reversal from our 1st resistance at 0.75575 in line with 61.8% Fibonacci projection, 161.8% Fibonacci extension and 50% Fibonacci retracement towards our 1st support at 0.71890 in line with 100% Fibonacci projection. Our bearish bias is supported by the stochastic indicator where it is at resistance level. On the H4 timeframe, we see the potential for a bearish reversal from our 1st resistance at 0.75296 in line with 100% Fibonacci projection and 138.2% Fibonacci extension towards our 1st support at 0.74221 in line with 23.6% Fibonacci retracement. Our bearish bias is supported by the stochastic indicator where it is at resistance level.
Areas of consideration
- H4 1st resistance at 0.75296
- H4 1st support at 0.74221
NZD/USD:
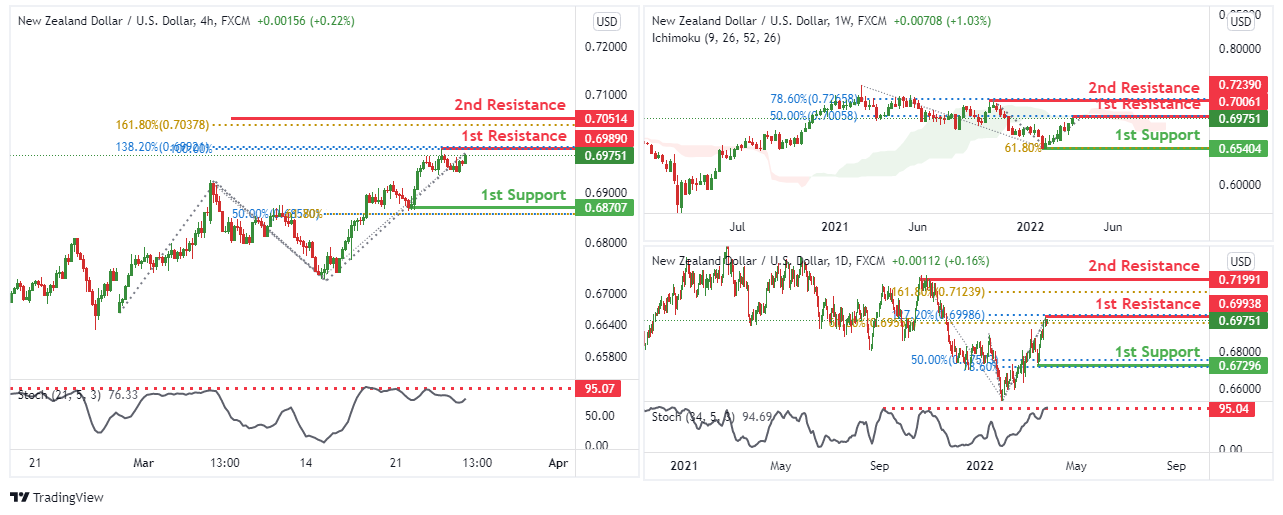
On the weekly, we see the potential for a bearish reversal from our 1st resistance at 0.70061 in line with 50% Fibonacci retracement towards our 1st support at 0.65404 in line with 61.8% Fibonacci projection. Price is trading below the ichimoku cloud indicator, further supporting our bearish bias. On the daily, we see the potential for a bearish reversal from our 1st resistance at 0.69938 in line with 61.8% Fibonacci retracement and 127.2% Fibonacci extension towards our 1st support at 0.67296 in line with 78.6% Fibonacci projection and 50% Fibonacci retracement. Our bearish bias is supported by the stochastic indicator where it is at resistance level. On the H4 timeframe, we see the potential for a bearish reversal from our 1st resistance at 0.69890 in line with 100% Fibonacci projection and 138.2% Fibonacci extension towards our 1st support at 0.68707 in line with 61.8% Fibonacci projection and 50% Fibonacci retracement. Our bearish bias is supported by the stochastic indicator where it is at resistance level.
Areas of consideration :
- H4 1st resistance at 0.69890
- H4 1st support at 0.68707
USD/CAD:
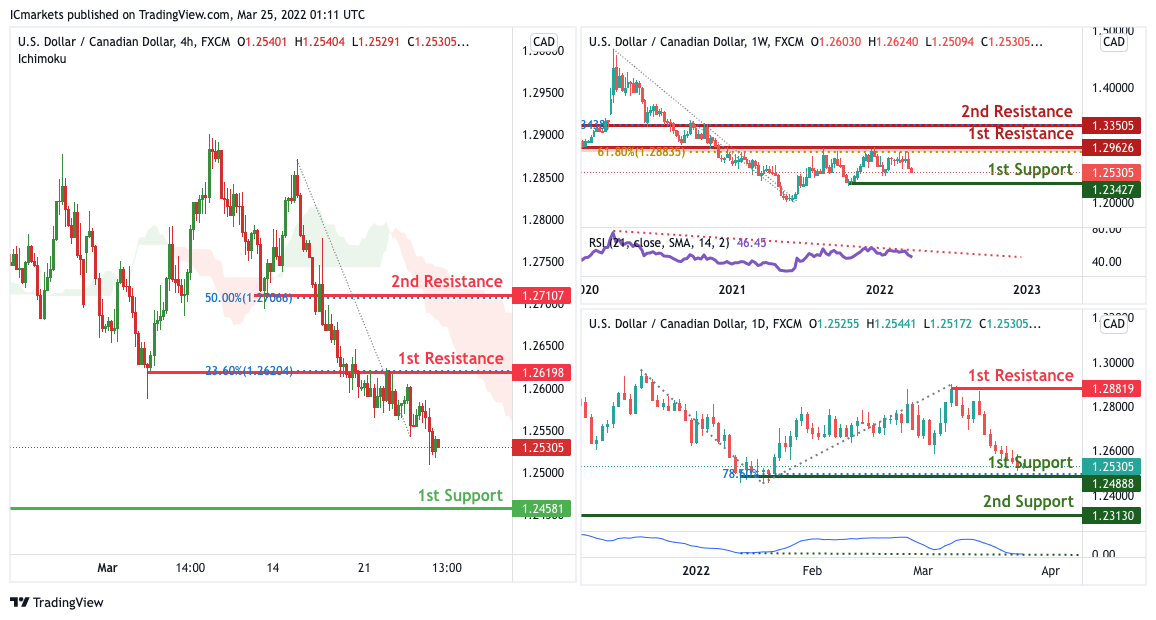
On the Weekly, with price expected to reverse off our RSI indicator, we have a bias that price will drop from 1st resistance to our 1st support .Alternatively, price may break 1st resistance and head for 2nd resistance.
On the Daily, with price moving expected to bounce off the stochastics indicator, we have a bias that price will rise to our 1st resistance from our 1st support. Alternatively, price may break 1st support structure and head for 2nd support.
On the H4, with price moving below our ichimoku cloud, we have a bias that price will drop from 1st resistance at 1.26198 in line with the horizontal pullback resistance and 23.6% Fibonacci retracement to 1st support at 1.24581 in line with the swing low support .Alternatively, price may break 1st resistance and head for 2nd resistance at 1.27107 in line with the horizontal pullback resistance and 50% Fibonacci retracement.
Areas of consideration:
- H4 time frame, 1st support at 1.24581
- H4 time frame, 1st resistance at 1.26198
OIL:
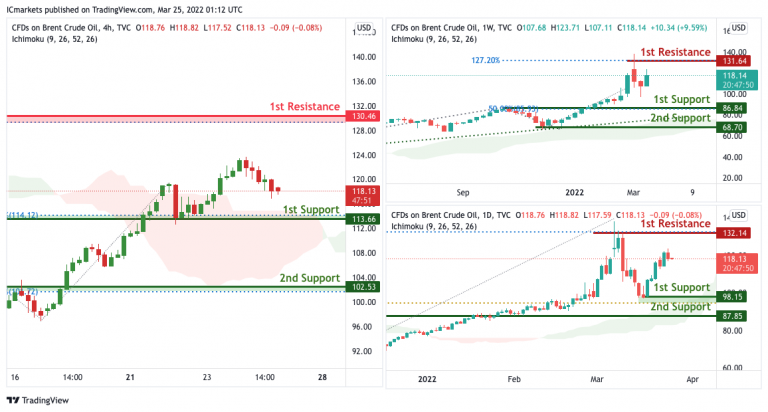
On the weekly, with price moving above the ichimoku cloud, we have a bias that price will rise to our 1st resistance from our 1st support. Alternatively, price may break 1st support structure and head for 2nd support.
On the Daily, with price moving above the ichimoku cloud, we have a bias that price will rise to our 1st resistance from our 1st support. Alternatively, price may break 1st support structure and head for 2nd support.
On the H4, with price moving above the ichimoku cloud, we have a bias that price will rise to our 1st resistance at 130.46 in line with the 78.6% Fibonacci retracement from our 1st support at 113.66 in line with the horizontal overlap support and 23.6% Fibonacci retracement. Alternatively, price may break 1st support structure and head for 2nd support at 102.53 in line with the horizontaL overlap support and 78.6% Fibonacci retracement.
Areas of consideration:
- H4 time frame, 1st resistance of 130.46
- H4 time frame, 1st support of 113.66
Dow Jones Industrial Average:
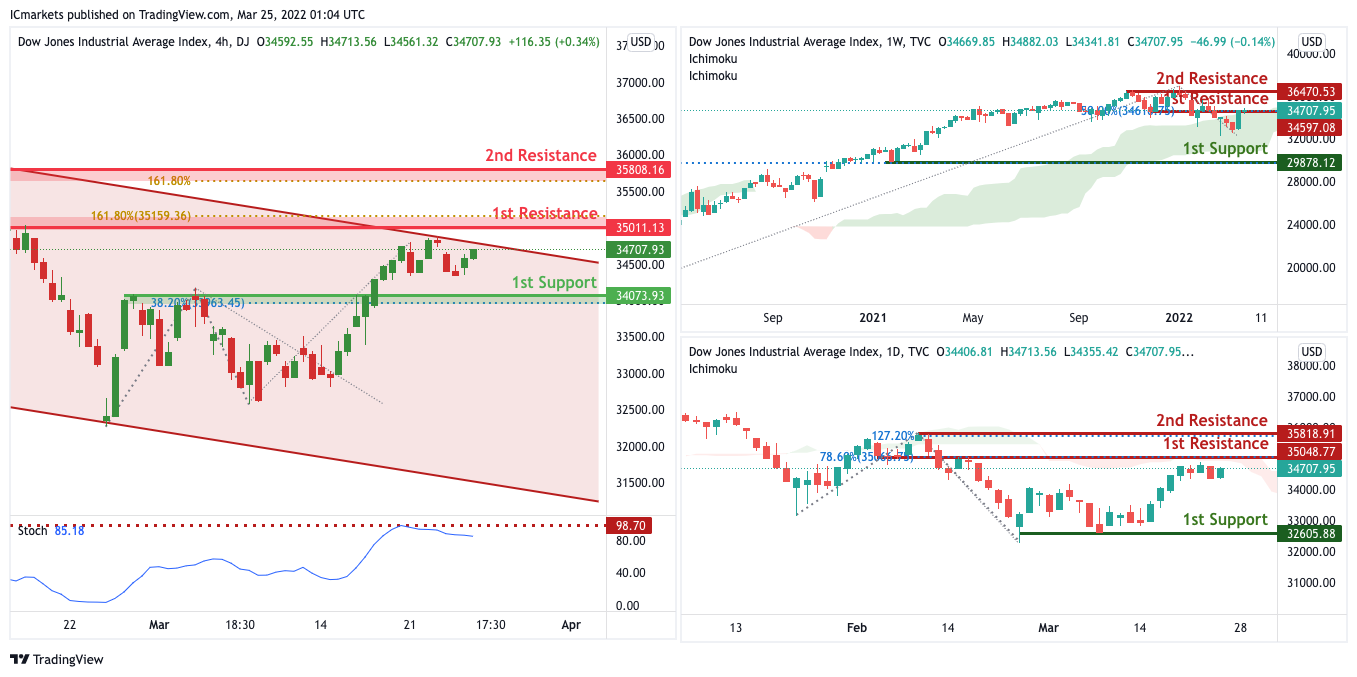
On the Weekly, with price expected to reverse off the resistance of the ichimoku indicator, we have a bias that price will drop from 1st resistance to our 1st support .Alternatively, price may break 1st resistance and head for 2nd resistance.
On the Daily, with price expected to reverse off the resistance of the ichimoku indicator, we have a bias that price will drop from 1st resistance to our 1st support .Alternatively, price may break 1st resistance and head for 2nd resistance.
On the H4, with price expected to reverse off the stochastics level, we have a bias that price will drop from 1st resistance at 35011 in line with the horizontal overlap resistance and 161.8% Fibonacci extension to 1st support at 34073 in line with the pullback support .Alternatively, price may break 1st resistance and head for 2nd resistance at 35808 in line with the 161.8% Fibonacci extension.
Areas of consideration :
- H4 1st support at 34073
- H4 1st resistance at 35011
UK Gfk consumer confidence dropped to -31, a wall of worry is confronting
UK Gfk Consumer Confidence Index dropped from -26 to -31 in March. That's the lowest level since November 2020. Personal Financial Situation over last 12 months dropped from -11 to -13. Personal Financial Situation over next 12 months dropped from -14 to -18. General Economic Situation over last 12 months dropped slightly from -50 to -51. Genera Economic Situation over next 12 months dropped from -43 to -49.
Joe Staton, Client Strategy Director GfK, says: "A wall of worry is confronting consumers this month and there is an unmistakable sense of crisis in our numbers. Consumers across the UK are experiencing the impact of soaring living costs with 30-year-high levels of inflation, record-high fuel and food prices, a recent interest-rate hike and the prospect of more increases to come, and higher taxation too – all against a background of stagnant pay rises that cannot compensate for the financial duress. This is the fourth month in a row that UK consumer confidence has dropped."