Sample Category Title
BTC Trying to Gain a Foothold Above $43K
Bitcoin is trading above $43K on Thursday morning, gaining 2.5% over the past 24 hours. For the last ten days, we have seen a systematic increase in prices, although with a very modest amplitude by the standards of the crypto market.
Ethereum adds 3.4%, while other leading altcoins from the top ten add in the range from 1% (XRP) to 12% (Dogecoin).
According to CoinMarketCap, the total capitalization of the crypto market grew by 2.8% over the day, to $1.96 trillion. The Bitcoin Dominance Index lost another 0.2% to 41.7%.
The crypto-currency index of fear and greed has grown by 9 points over the past day, to 40. This is still a zone of fear, but already close to neutral territory.
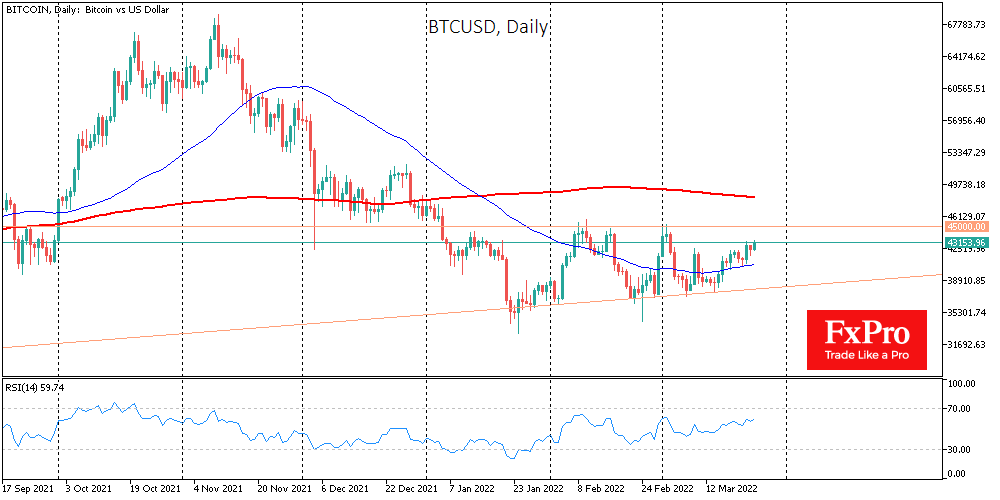
Bitcoin retreated from the resistance at $43K on Tuesday, but on Thursday it is again making attempts to gain a foothold above this mark. The last rollback in this case could be nothing more than a tactical retreat of the bulls in order to develop growth with renewed vigor. However, confidence in the formation of a strong bullish momentum will come only after BTCUSD fixes above 45 thousand, from where we saw reversals in February and early March.
Moderate but steady optimism around bitcoin is the best breeding ground for altcoin buyers. It is clearly seen that their dynamics are now better than that of the first cryptocurrency. If this trend continues for a couple more days, the effect of a feedback loop may work, when the outstripping growth of altcoins will pull Bitcoin up.
Bank of America predicts that regulation of the cryptocurrency market will increase confidence and increase its capitalization by 15 times, up to $30 trillion.
The former head of one of the divisions of Bank of America, David Woo, believes that bitcoin will face economic and geopolitical pressure after the launch of the state digital currency (CBDC) of the United States. China has already acted in a similar way, which has come closest to the introduction of the digital yuan.
Thailand will ban the usage of cryptocurrencies as a means of payment from April 1st. They declared that such payments have a negative impact on the financial system and reduce the effectiveness of the state’s monetary policy.
Falling Japanese Yen as Canary of a Changing World Order
The collapse of the Japanese yen continues, and so far, there are no signs of a trend reversal. The rise in the Yen is often linked to capital flight from risky assets, and the weakening is a sign of increased demand for risky assets. But that explanation hardly fits with what is happening now. We likely see the start of a significant reassessment by the markets of Japan’s position in the financial system. In a worst-case scenario, this may turn into a debt crisis in the Land of the Rising Sun and be an even bigger disaster for financial markets than the eurozone debt crisis of a decade ago.
The starting point for the weakening of the Yen was at the start of February. At that time, equities were in demand as a haven for capital to maintain the purchasing power of investments.
The flow into equities was interrupted by the war in Ukraine but accelerated in the last couple of weeks on signs that these events have hyped up the processes that were taking place before. And these processes are now most visible in the dynamics of the Japanese yen against those currencies where the central bank can respond adequately to inflation.
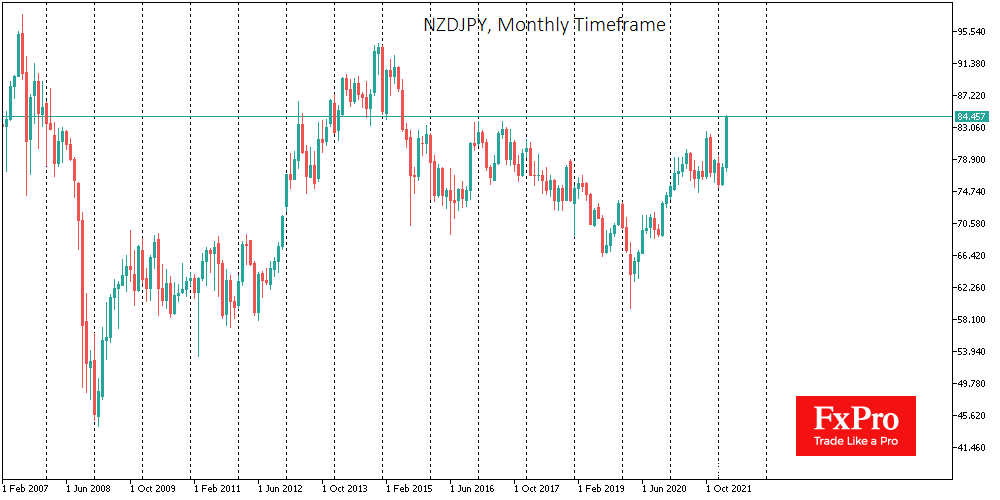
Since the start of February, the USDJPY has risen by 6.5%, and almost all this increase has taken place since March 7th, taking the pair back to levels last seen at the end of 2015. A much more impressive rally is taking place in the Aussie and Kiwi against the Yen. Since the start of February, they have soared by more than 12%. So far this month, the strengthening is the largest in 11 years for AUDJPY and in more than 12 years for NZDJPY.
The interest rate differential game, which was so beloved by traders in Japan before the global financial crisis, has found a second life. Australia and New Zealand have the economic potential to raise interest rates, as they are experiencing a surge in exports due to the boom in their export prices.
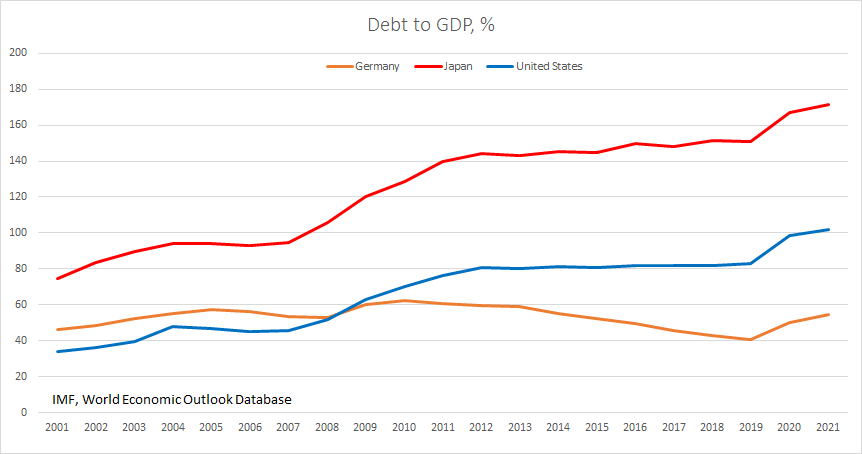
However, the situation in Japan looks considerably more alarming, as Japan’s debt-to-GDP ratio has risen by 77 percentage points to 170% since the financial crisis. Permanent QE from the Bank of Japan has kept government debt costs down but doesn’t solve the problem.
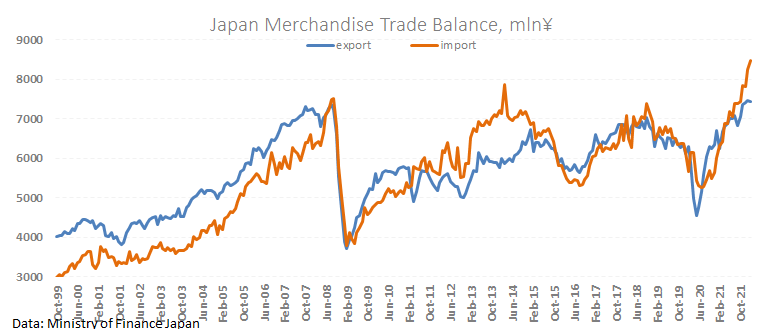
In the last decade, Japan has turned into a net commodity importer due to its growing dependence on energy and metals and increasing competition from China and Korea. The exchange rate should act as a natural mechanism to stabilise trade in this situation.
But this adjustment is difficult for debt-laden Japan because selling currency would de facto mean selling bonds denominated in that currency. Under these circumstances, the Bank of Japan either must openly accept that it will finance the government (i.e., increase purchases despite inflation) or soften QE. The first option risks triggering a historic revaluation of the Yen. The second option would deal a blow to the economy and finances by raising questions about whether Japan can service its debt.
GBPCAD Bearish Pressures Calm above 1.65 Handle
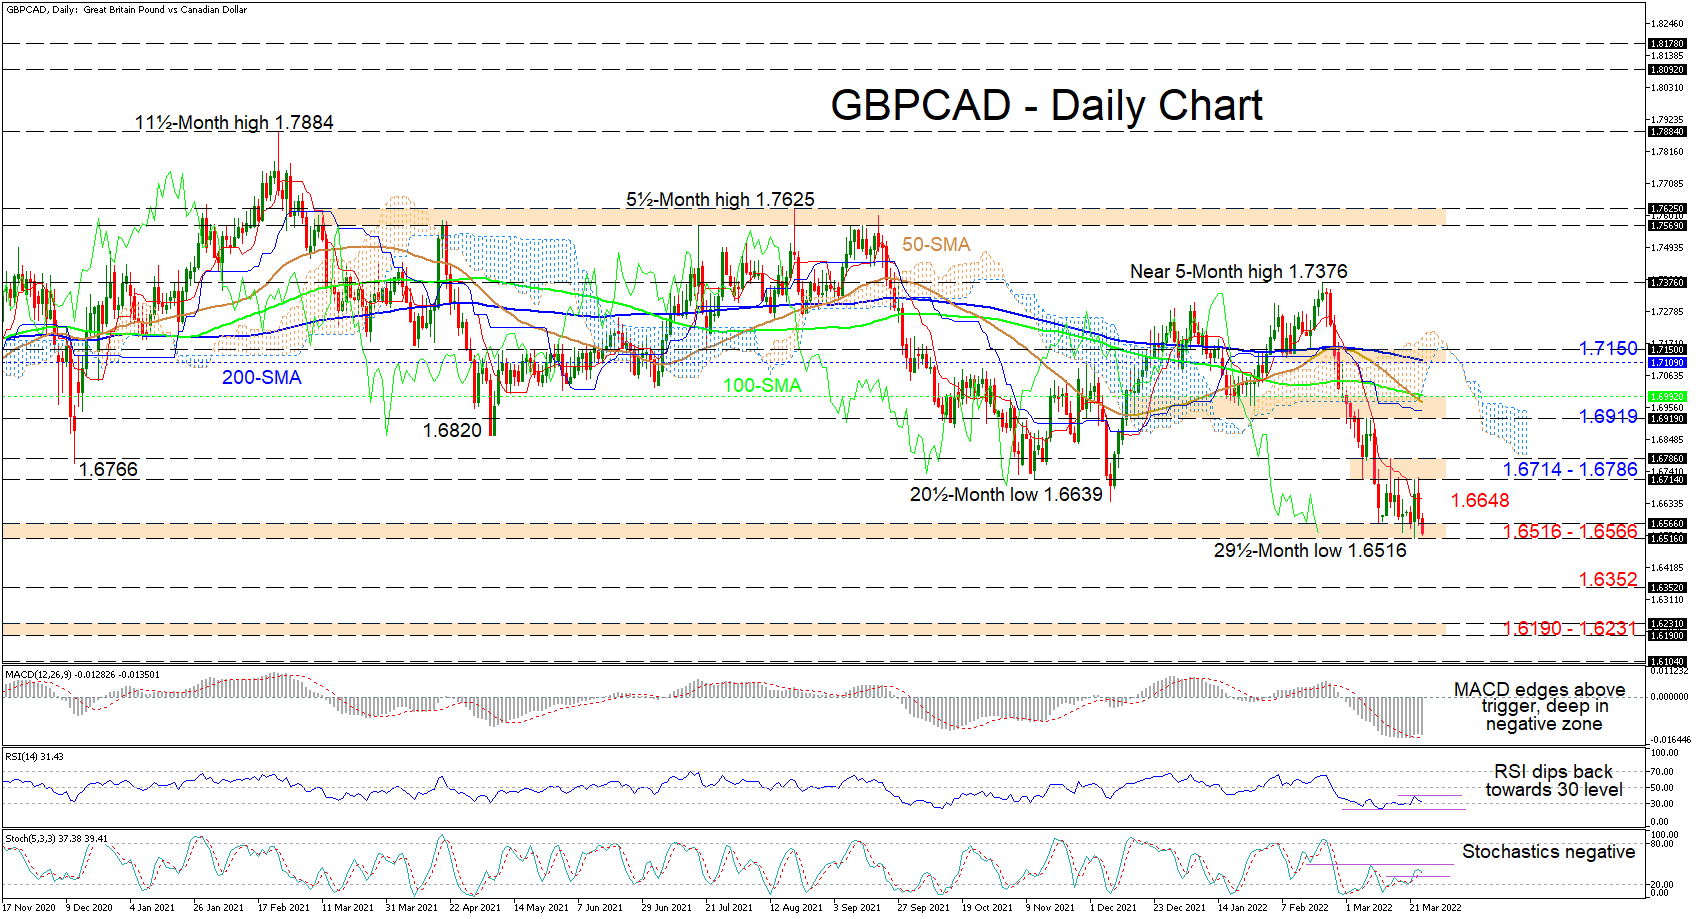
GBPCAD has touched a 29½-month low of 1.6516, subsequently shaping the 1.6516-1.6566 support border that encapsulates the March 2020 trough of the collapse from the 1.8045 high. The tempo of the pair’s descent from the recent 1.7376 high softened in the vicinity of the March 2020 bottom of 1.6536. Nonetheless, the simple moving averages (SMAs) continue to highlight downside risks.
The Ichimoku lines indicate a pause in bearish forces, while the short-term oscillators signal a pickup in negative momentum. The MACD is above its red trigger line but looks set to fall back beneath it, while the RSI is retesting the 30 oversold level. The negatively charged stochastic oscillator is hinting that downside price action may intensify.
If sellers drive the price underneath the critical 1.6516-1.6566 support, the broader bearish picture could significantly strengthen with the price sinking towards the 1.6352 barrier. Should the descent endure, the price may then target the 1.6190-1.6231 support barricade, linked to the troughs from September 2019.
On the other hand, if buyers find a foothold within the 1.6516-1.6566 support region, initial upside constraints could arise from the red Tenkan-sen line at 1.6648 ahead of the 1.6714-1.6786 resistance border. Gaining additional ground, the bulls could navigate towards the reinforced 1.6919-1.6992 resistance zone, which involves the 50- and 100-day SMAs as well as the blue Kijun-sen line. From here, the 1.7109-1.7150 resistance band could be the next obstacle impeding advances from accelerating beyond the 1.7376 high.
Summarizing, GBPCAD is exhibiting a bearish bias below the SMAs and the near five-month high of 1.7376.
Recovery Losing Momentum
It's been a relatively slow start to trading in equity markets as we approach the end of the week, with stocks losing the momentum that's driven the strong recovery in recent weeks.
The recovery has arguably been overdone considering the invasion of Ukraine is ongoing and commodity prices are at sky-high levels and still prone to surges. But the fact that Ukraine and Russia remain in negotiations seems to be enough to keep investors on board.
The threat of very high inflation and rapid rate hikes isn't proving much of a deterrent either which is interesting after more than a decade of ultra-low rates in both cases. Again, this may change as we see more evidence of the economic consequences and as central banks both raise rates and reduce their balance sheets but for now, markets are holding up.
MOEX manipulated higher as trading resumes
Russian stocks restarted trading on Thursday and it's safe to say this is no longer a normal functioning market. Trading ceased on stocks for almost a month after they plunged in response to Western sanctions against Russia for its illegal invasion of Ukraine.
Authorities are going to great lengths to manipulate the market and prevent another devastating plunge and their efforts are working, for now. The MOEX rallied more than 4% in shortened trade thanks to a combination of heavy government buying and bans on short-selling and foreign sales. There is nothing normal, functional, or sustainable about the Russian market right now, they're simply buying time.
Oil stabilises as OPEC expresses concerns
Even oil prices are a little flat after spiking higher on Wednesday in response to apparent storm damage on the Caspian Pipeline Consortium (CPC) that will affect around a million barrels per day from Kazakhstan for up to a couple of months. Coming at a time when the market is already extremely tight, it could ensure prices remain higher and vulnerable to further increases.
OPEC has reportedly expressed its unease to the EU regarding a proposed ban on Russian oil. In much the same way that Western leaders have had their requests for additional oil production overlooked in recent months as prices have surged, I can't help but think OPEC's concerns will fall on deaf ears. I guess we'll soon see just how strong the OPEC+ alliance is.
Gold higher amid commodity surge
Gold is creeping higher again, adding to yesterday's gains which came in risk-averse trade. The yellow metal remains well supported against the backdrop of high inflation and commodity price surges, not to mention waves of risk-aversion in these highly uncertain times.
It ran into some resistance around $1,960 earlier in the session before pulling back to trade around $1,950. It's given back a lot of the gains secured earlier this month as traders sought the shelter of a reliable safe haven and inflation hedge amid the Ukraine invasion and sky-rocketing commodity prices. But it's seen firm support around $1,900 even as risk appetite has improved. Upside may be slow as a result of this but equally, I expect this support to remain firm in the absence of significant progress in ceasefire talks.
Bitcoin sights set on $45,500
Bitcoin has been quietly creeping higher in recent weeks and was relatively unaffected by yesterday's bout of risk aversion. It held above $40,000 during the pullback earlier this week and is holding onto gains once more as it eyes the next big test around $45,500. It's failed here repeatedly before but further improvements in risk appetite in the markets may see it over the line.
Fed Evans comfortable with 25 bps hike, open to 50bps
Chicago Fed President Charles Evans said he's "comfortable" with a 25bps hike and "open" to a 50bps move.
"We want to be careful, we want to be humble and nimble, and get to neutral before too long -- maybe 50 helps, I'm open to that," he said in a Q&A session after a speech. "I would be comfortable with each meeting increasing by a quarter point."
"This is a signal of more general pressure from aggregate demand on today's impinged supply," he said in the speech. "If monetary policy did not respond to these broader pressures, we would see higher inflation become embedded in inflation expectations, and we would have even harder work to do to rein it in."
"Policymakers need to be cautious, humble, and nimble as we navigate the course ahead," Evans said. "Monetary policy is not on a preset course" but will be decided at each Fed meeting.
Fed Kashkari: There’s a danger to overdoing rate hikes
Minneapolis Fed President Neel Kashkari said he has penciled in seven 25bps rate hike this year as "we need to adjust" monetary policy. "The data just keeps coming in in that direction, and we just have to respond," referring to skyrocketing inflation.
However, he warned that "there's a danger to overdoing it". Supply bottlenecks could be fixed faster than expected, or labors could return in big numbers. He added, "we're going to get information".
Nikkei 225 Wave Analysis
- Nikkei 225 broke resistance level 27870.00
- Likely to rise to resistance level 28765.00
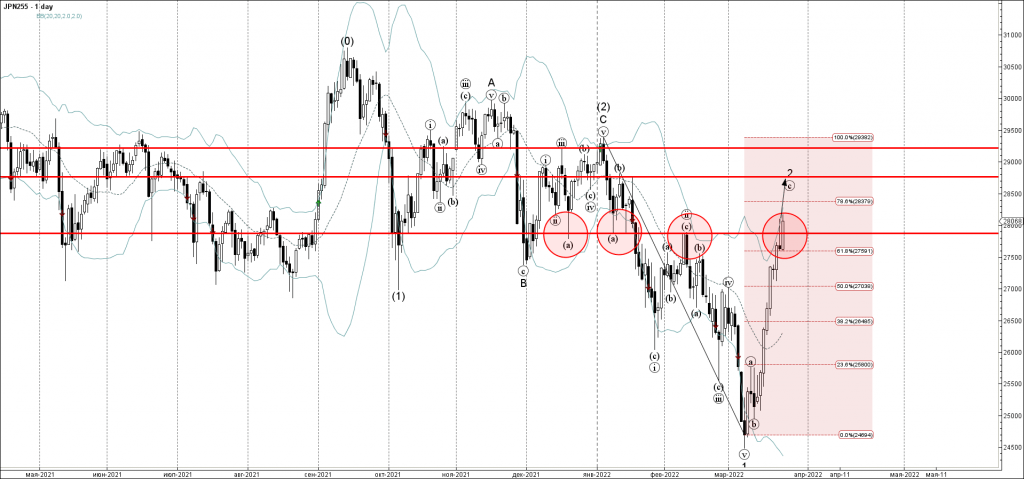
Nikkei 225 index recently broke through the resistance level 27870.00 (which has been reversing the price from the middle of December).
The breakout of the resistance level 27870.00 was preceded by the breakout of the 61.8% Fibonacci correction of the downward impulse 1 from January.
Nikkei 225 index can be expected to rise further toward the next resistance level 28765 (target for the completion of the active ABC correction 2).
EUR/USD Mid-Day Outlook
Daily Pivots: (S1) 1.0979; (P) 1.1013; (R1) 1.1064; More...
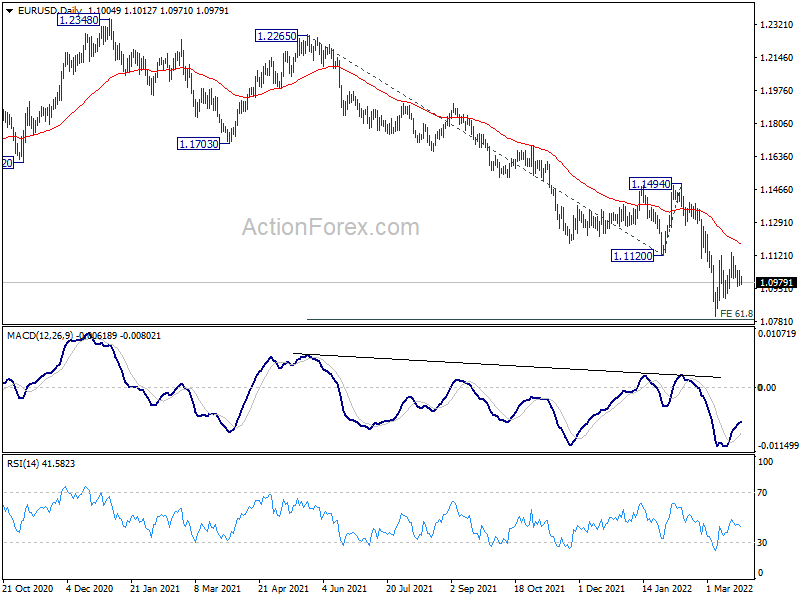
Intraday bias in EUR/USD stays neutral for the moment. On the downside, below 1.0899 minor support will turn bias back to the downside for 61.8% projection of 1.2265 to 1.1120 from 1.1494 at 1.0786. However, firm break of 1.1120 will confirm short term bottoming at 1.0805. Bias will be back on the upside for 55 day EMA (now at 1.1178) and above.
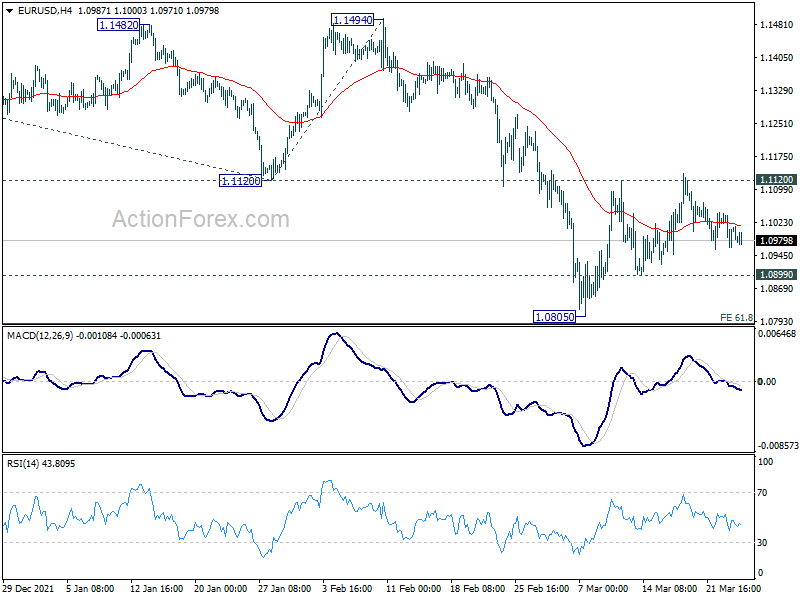
In the bigger picture, the decline from 1.2348 (2021 high) is expected to continue as long as 1.1494 resistance holds. Firm break of 1.0635 (2020 low) will raise the chance of long term down trend resumption and target a retest on 1.0339 (2017 low) next. Nevertheless, break of 1.1494 will maintain medium term neutral outlook, and extending term range trading first.
GBP/USD Mid-Day Outlook
Daily Pivots: (S1) 1.3154; (P) 1.3227; (R1) 1.3278; More...
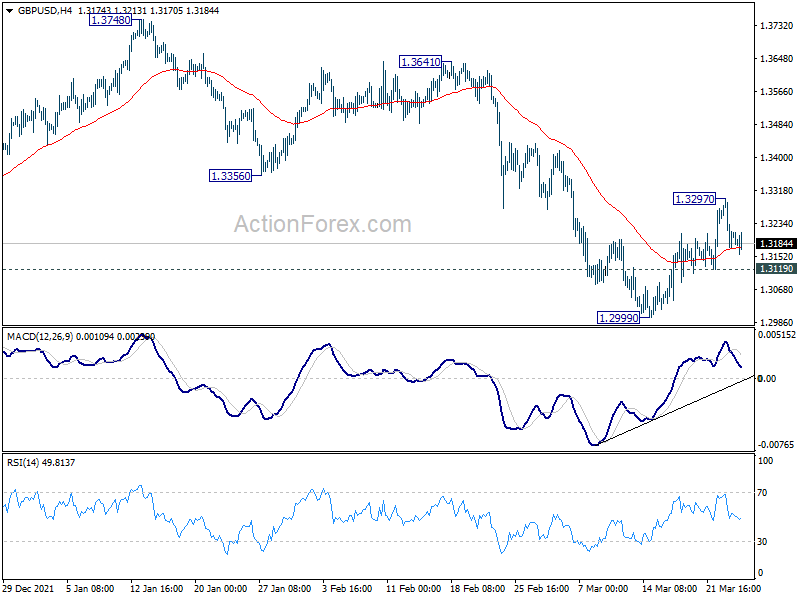
Intraday bias in GBP/USD remains neutral as range trading continues. On the downside, break of 1.3119 minor support will turn bias back to the downside for retesting 1.2999. Firm break there will resume larger down trend from 1.4248. On the upside, above 1.3297 will resume the rebound to 55 day EMA (now at 1.3347). Sustained break there will target medium term channel resistance (now at 1.3590).
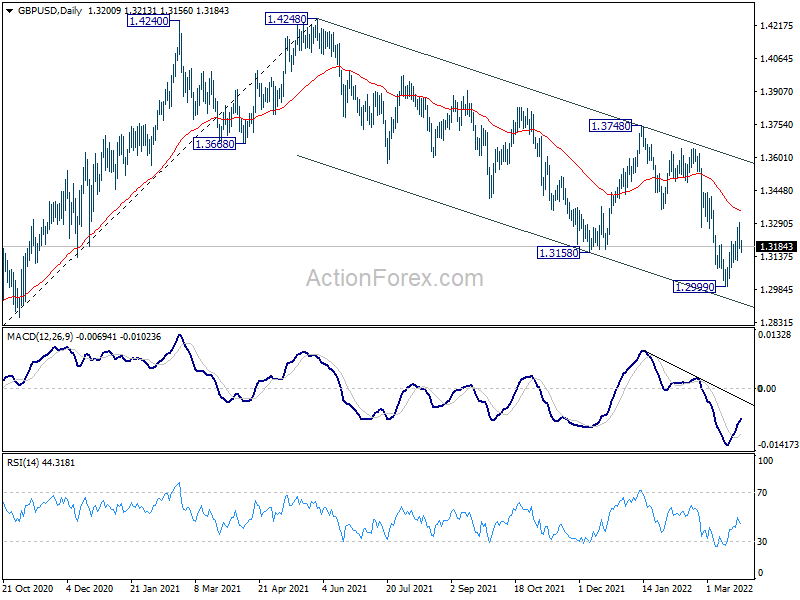
In the bigger picture, current development suggests that the up trend from 1.1409 (2020 low) has completed at 1.4248. Decline from 1.4248 could still be a corrective move, or it could be the start of a long term down trend. In either case, deeper decline would be seen back to 61.8% retracement of 2.1161 to 1.1409 at 1.2493. In any case, break of 1.3748 resistance is needed to indicate medium term bottoming, or outlook will stay bearish.
USD/CHF Mid-Day Outlook
Daily Pivots: (S1) 0.9287; (P) 0.9322; (R1) 0.9343; More....
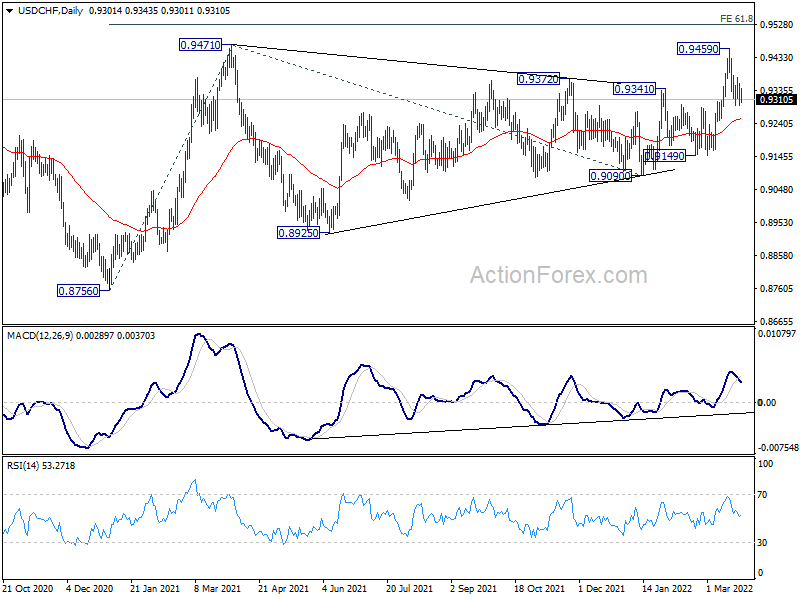
Outlook in USD/CHF remains unchanged and intraday bias remains neutral. On the downside, below 0.9293 will extend the pull back from 0.9459 to 55 day EMA (now at 0.9255). On the upside, above 0.9381 minor resistance will flip bias back to the upside. Firm break of 0.9471 will resume the rise from 0.8756 to 61.8% projection of 0.8756 to 0.9471 from 0.9090 at 0.9532.
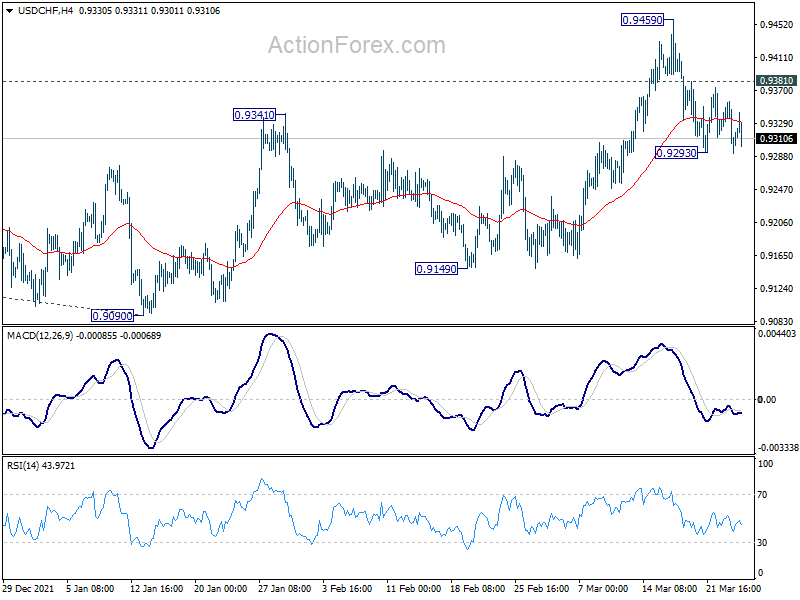
In the bigger picture, medium term outlook will be neutral at best as long as 0.9471 resistance holds. Larger down trend could still extend through 0.8756 (2021 low). However, firm break of 0.9471 will argue that whole down trend form 1.0342 (2016 high), has completed with waves down to 0.8756. A medium term up trend should be set up to target 1.0237/0342 resistance zone.