Sample Category Title
Investors Again Scaling Up Normalization/Tightening Bets
Markets
US stock markets again failed to cling to opening gains, ending up to 2% lower for Nasdaq. The S&P 500 follows the two other major indices in painting a technical “death cross” on the charts (200d moving average < 50d moving average), suggesting more downside. The tech giant Nasdaq now entered bear market territory as the index is now more than 20% below the all-time high in November 2021.
The (US) stock sell-off again went hand-in-hand with sales in US Treasuries. This correlation suggests that runaway inflation and global (monetary) policy normalization are firmly back in the driver’s seat as market theme. At the height of the Russian invasion, global core bonds briefly played their role as safe haven asset.
In the wake of last week’s ECB meeting and going into this week’s Fed and BoE gatherings, investors are again scaling up their normalization/tightening bets. US yields added 11.3 bps (2-yr) to 15 bps (7-yr) with the belly of the curve underperforming the wings. US yields reached multi-year highs at the 2-to-10 sector of the curve.
The German yield curve bear steepened with yields adding 6.5 bps (2-yr) to 12.3 bps (30-yr) higher. The German 10-yr yield set a new recovery high at 0.37%. Next technical resistance stands at 0.58%. Peripheral yield spreads remarkably kept stable.
The single currency slightly had the upper hand over the dollar and sterling. EUR/USD and EUR/GBP ended the day slightly firmer at respectively 1.0940 and 0.8415. Moves continue this morning. USD/JPY extends it’s race to the top with the pair closing above 118 for the first time since early 2017. Next high profile resistance at 118.66 is nearby. It’s the final big hurdle ahead of the 2015 top at 125.86. JPY is the stand-out loser in the normalization race, after being hit by the commodity rally at the height of the Russian war in Ukraine. EUR/CHF extends its rebound higher after briefly touching parity last week. EUR/CHF trades back above 1.03. CEE currencies enjoyed a huge relief rally.
Chinese assets remain in freefall this morning. Apart from new strict lockdowns and tougher regulation, they react disappointed as the PBOC refrained from easing monetary policy further (see below). The damage again remains confined to China.
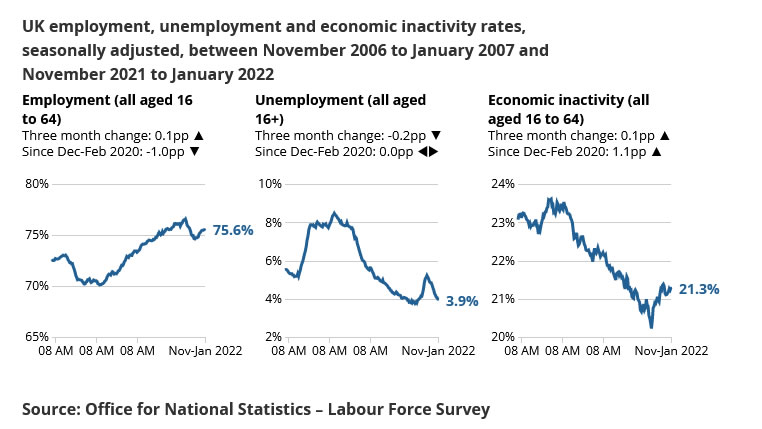
Today’s eco calendar contains US PPI data, empire manufacturing survey and EMU production figures. They won’t alter reigning trading dynamics ahead of the Fed meeting. UK labour market data printed strong this morning. Wage growth accelerated further with February payrolls suggesting renewed vigour for the labour market after some stabilization around the turn of the year. The unemployment rate slid further to 3.9% in the Nov-Jan period, the lowest since January 2020. The data strengthen the case for another BoE rate hike later this week.
News Headlines
The February Chinese economic update came in better than expected as government support started kicking in. Industrial production rose 7.5% vs 4% expected in the first two months of the year compared to the same period in 2021. Retail sales grew 6.7% YtD, beating the 3% consensus. Property investments defied expectations of a 7% decline to be up 3.7% and fixed assets investments jumped 12.2%. The strength of this month’s data may have been the reason for the PBOC to surprise markets and to not cut rates on the 1-yr lending facility this morning (2.85%). But downside risks loom large, ranging from the regulatory crackdown over the reintroduction of lockdowns to fall-out of the war (commodity prices). The data also highlight the ongoing housing market cooldown as residential property sales slump more than 22% YtD, adding to the economic risks. The Chinese yuan extends a recent losing streak to trade at the weakest level since the start of the year at USD/CNY 6.38.The EU agreed on a fourth package of sanctions against Russia after several days of heavy debating. Measures include banning the sale to Russia of luxury goods worth more than €300 and of luxury cars, boats and planes of more than €50 000, Bloomberg reported based on a draft. Purchases of many Russian steel and iron (finished) products will also be banned as well as new investments in Russian energy projects. There are exemptions included. For example, the new package does not target transactions needed for purchasing or transporting Russian fossil fuels nor are titanium, aluminum, copper, nickel, palladium and iron ore subject to the restrictions.
UK payrolled employees rose 275k in Feb, unemployment rate dropped to 3.9% in Jan
UK number of payrolled employees rose 275k in February. Comparing with prepandemic level in February 2020, number of payrolled employees was up 662k. Claimant count dropped -48.1k, versus expectation of 20.3k rise.
In the three months to January, unemployment rate dropped from 4.1% to 3.9% in the three months to January, better than expectation of 4.0%.
Average earnings including bonus rose 4.8% 3moy in January, above expectation of 4.6%. Average earnings excluding bonus rose 3.8% 3moy, also above expectation of 3.7%.
USDCAD Reacting Higher From The Blue Box Area
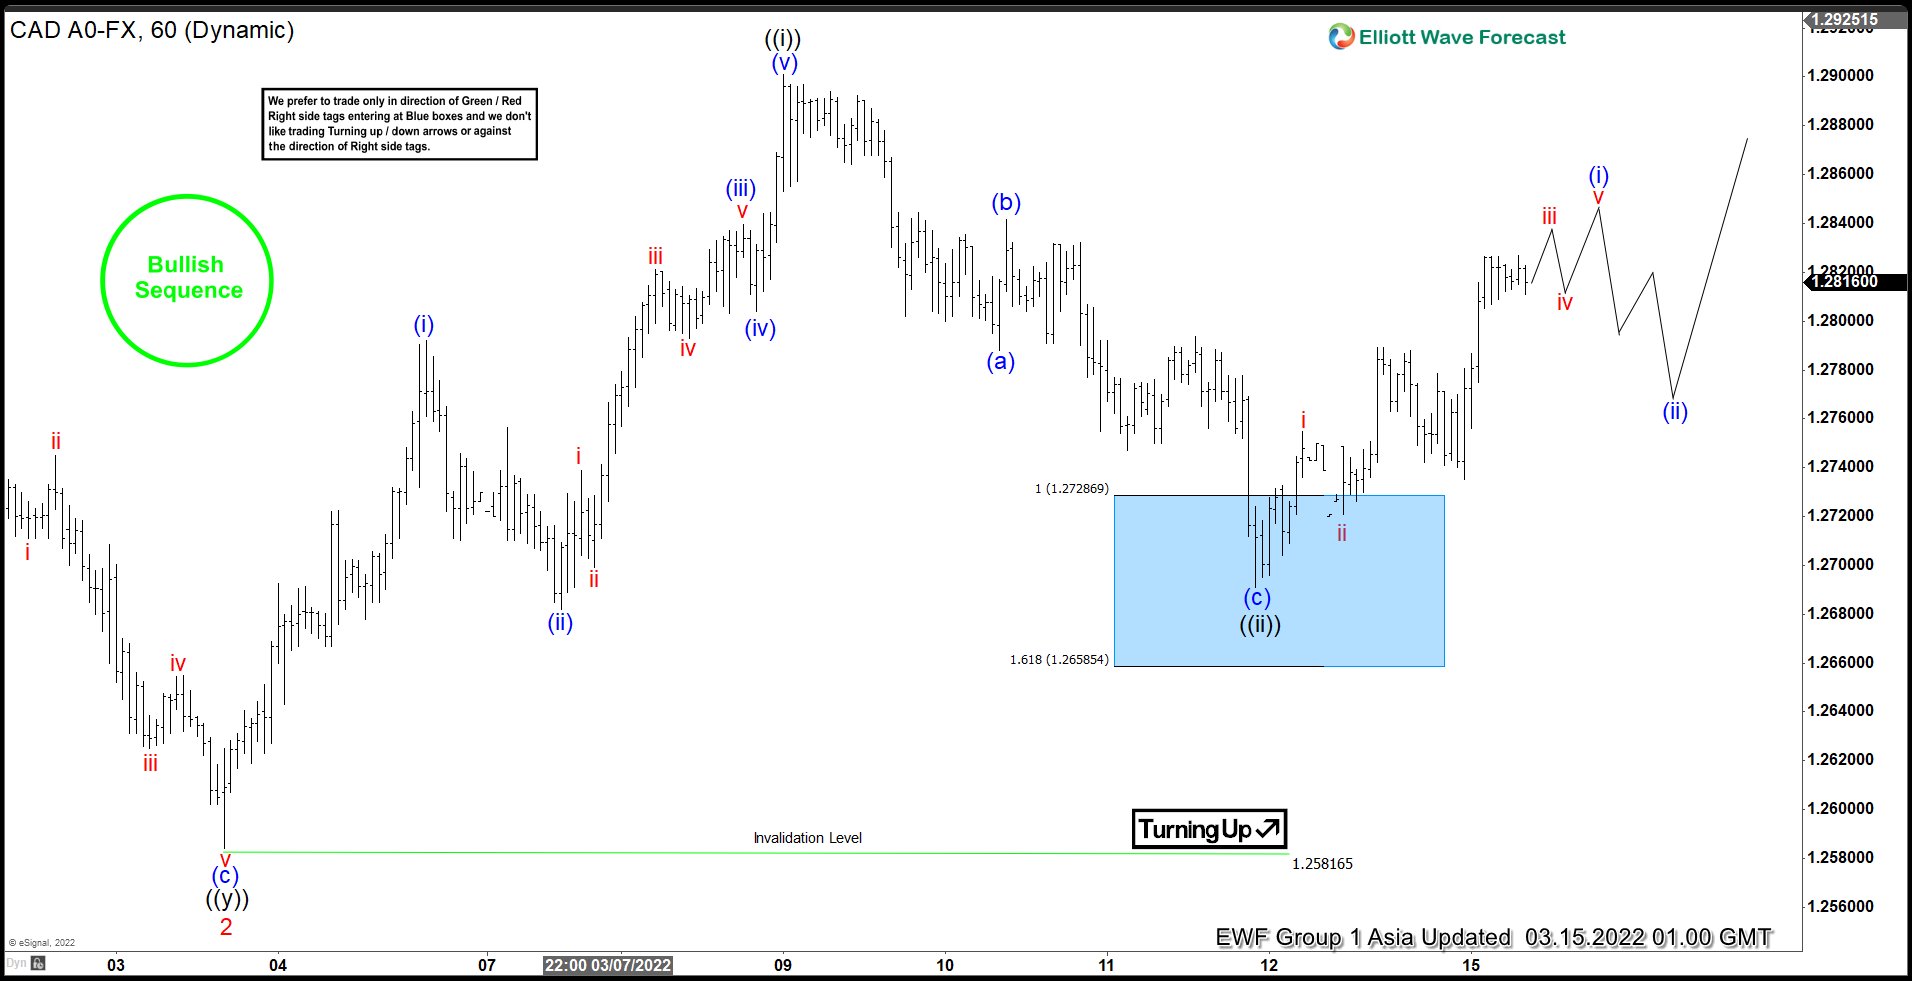
In this technical blog, we will look at the past performance of the 1-hour Elliott Wave Charts of USDCAD. In which, the rally from 03 March 2022 low unfolded as an impulse sequence and showed a higher high sequence with a bullish sequence stamp. Therefore, we knew that the structure in USDCAD is incomplete to the upside & should see more upside to complete the impulse sequence. So, we advised members not to sell the pair & buy the dips in 3, 7, or 11 swings at the blue box areas. We will explain the structure & forecast below:
USDCAD 1 Hour Elliott Wave Chart
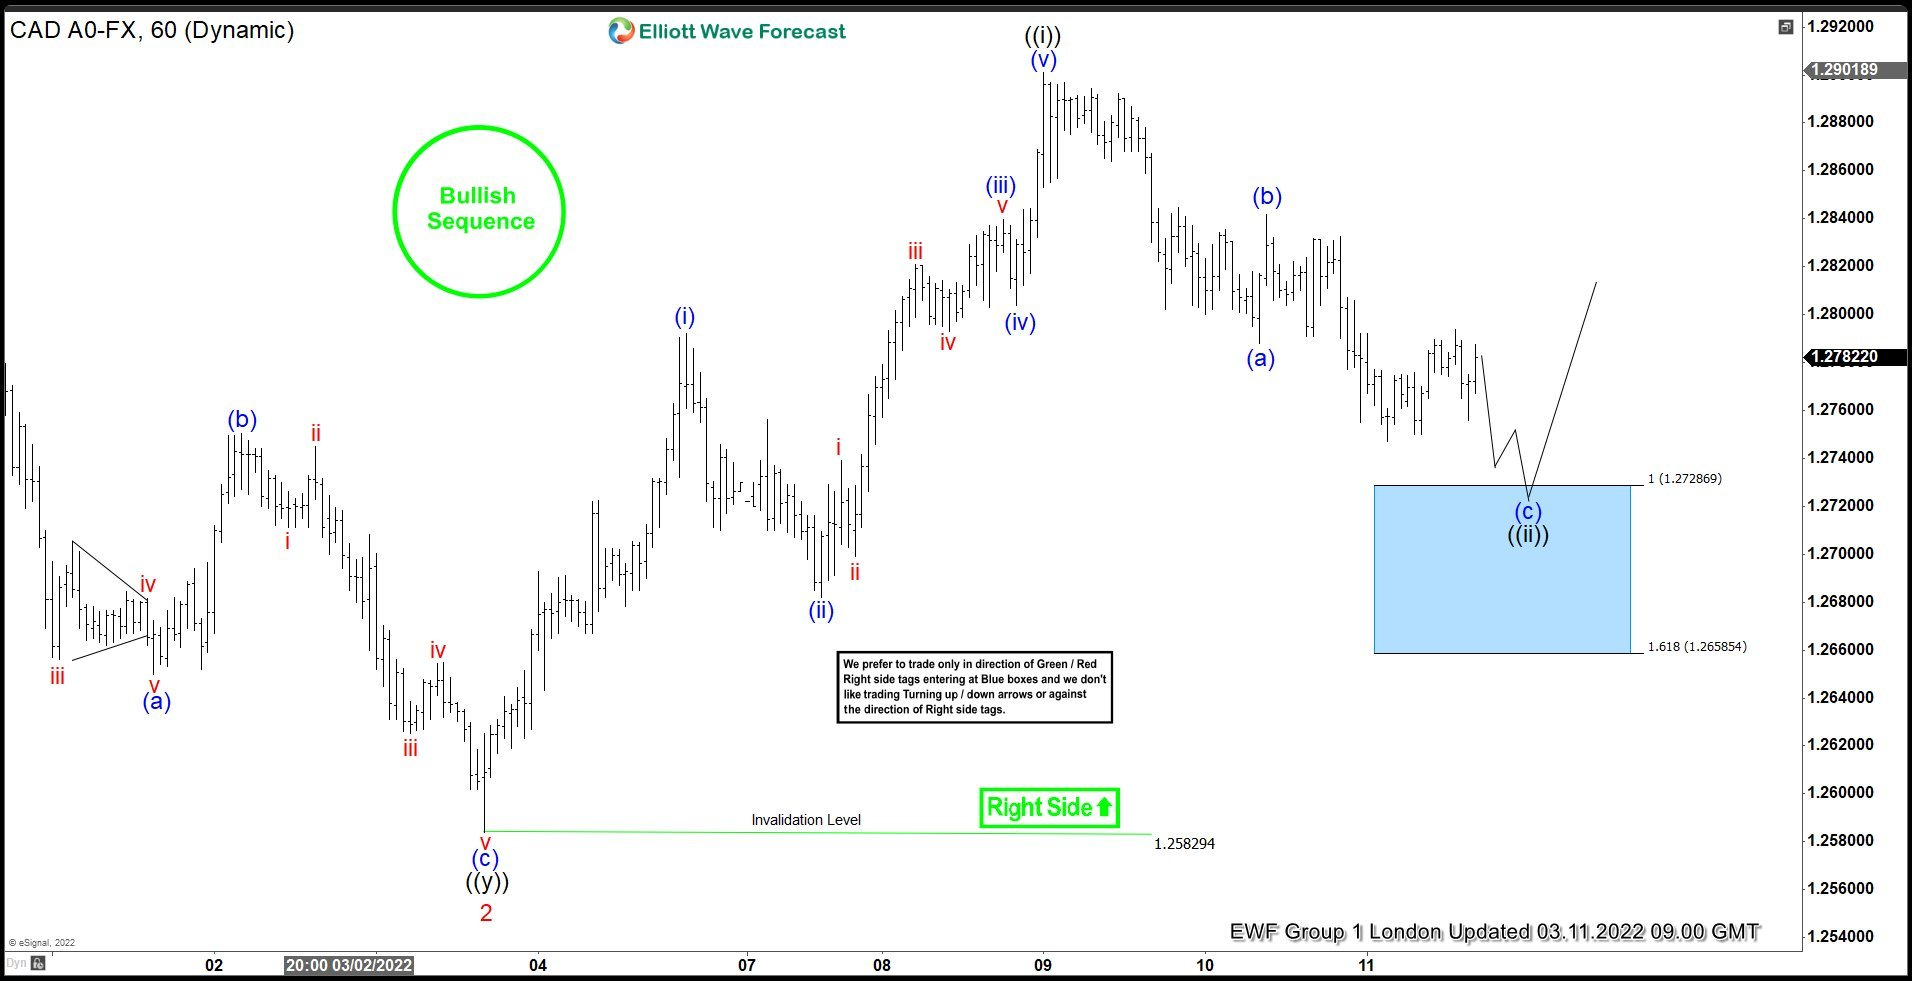
Here’s 1hr Elliott wave Chart from the 3/111/2022 London update. In which, the rally to $1.2901 high ended 5 waves from 3/03/2022 low in wave ((i)) & made a pullback in wave ((ii)). The internals of that pullback unfolded as Elliott wave zigzag correction where wave (a) ended at $1.2788 low. Then a bounce to $1.2841 high ended wave (b) & started the next leg lower in wave (c) towards $1.2728- $1.2658 blue box area. From there, buyers were expected to appear looking for new highs ideally or for a 3 wave bounce minimum.
USDCAD Latest 1 Hour Elliott Wave Chart
Decline in Oil Prices is Good, But Not Enough
Rapid decline in oil prices came as a relief to the European stock markets yesterday, yet the lack of diplomatic progress on the Ukrainian war and China’s fresh lockdown to stop the omicron contagion weigh on investors sentiment.
Apple shares dived more than 2.50% on Monday, on news that supplier Foxconn had to stop activity in Shenzhen for at least a week. Amazon and Google lost between 2.5-3%, pulling Nasdaq index into the correction territory.
The S&P 500, on the other hand, stepped into a death cross formation as the 50-DMA sank below the 200-DMA.
Activity in European futures hint at a negative start this morning, although crude oil is down by more than 4.5% at the time of writing.
Hedge funds have reportedly massively cut their bullish oil bets last week, after seeing that the US and UK oil ban failed to push the prices above the $130pb mark - which came as a warning that the recent oil rally was perhaps overstretched.
The crude price plunge below the $100pb came as a relief in the middle of a sea of bad news, but it will certainly not prevent the German ZEW sentiment index from freefalling from 48 to 10 in March.
What’s next?
The downside correction in oil prices is sure a relief when it comes to the inflation expectations, but the new lockdown measures will continue worsening the supply chain crisis and add on the inflation worries. The US producer price data is about to confirm an advance to 10% level in February, as the FOMC starts its two-day meeting today and is expected to raise the interest rates by 25bp for the first time since the beginning of the pandemic. But it will certainly not be the last as the market activity hints at 6 to 7 other rate hikes for the next twelve months in the US.
The US yields are back on track for fresh post-pandemic highs, after we saw a rush to the US papers due to the Ukrainian war over the past couple of weeks. The 2-year yield is back above 1.85% and the 10-year yield is back above the 2% mark.
Gold, on the other hand, gives back the recent gains as the rising US yields increase the opportunity cost of holding the non-interest-bearing gold. Yet successive failures to find a diplomatic solution in the Ukrainian war could overcome the rising US yields and throw a floor under the decline of the price of an ounce near the $1900 mark.
GER 40 Attempts to Rebound
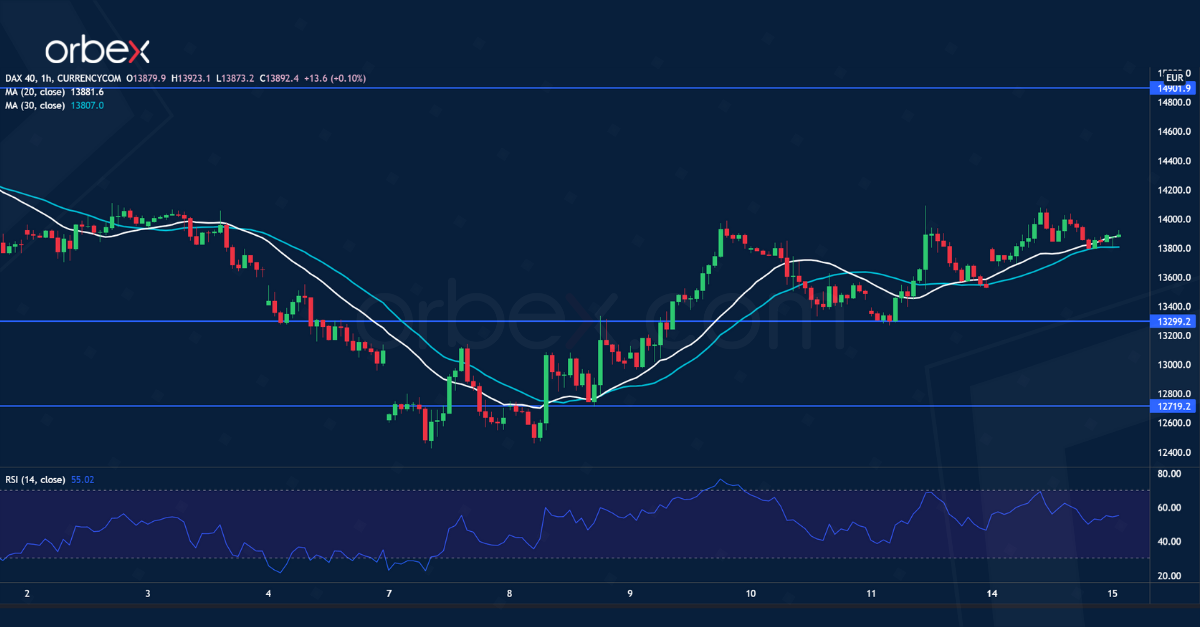
The Dax 40 edges higher as Russia and Ukraine hold a fourth round of talks. The index bounced off the demand zone (12500) from the daily chart, a sign that price action could be stabilizing.
The supply zone around the psychological level of 14000 sits next to the 20-day moving average, making it an important hurdle. A tentative breakout may have prompted sellers to cover.
14900 would be the target if the rebound gains momentum. On the downside, 13300 is fresh support, and 12720 is the second line of defense.
AUD/USD Lacks Support
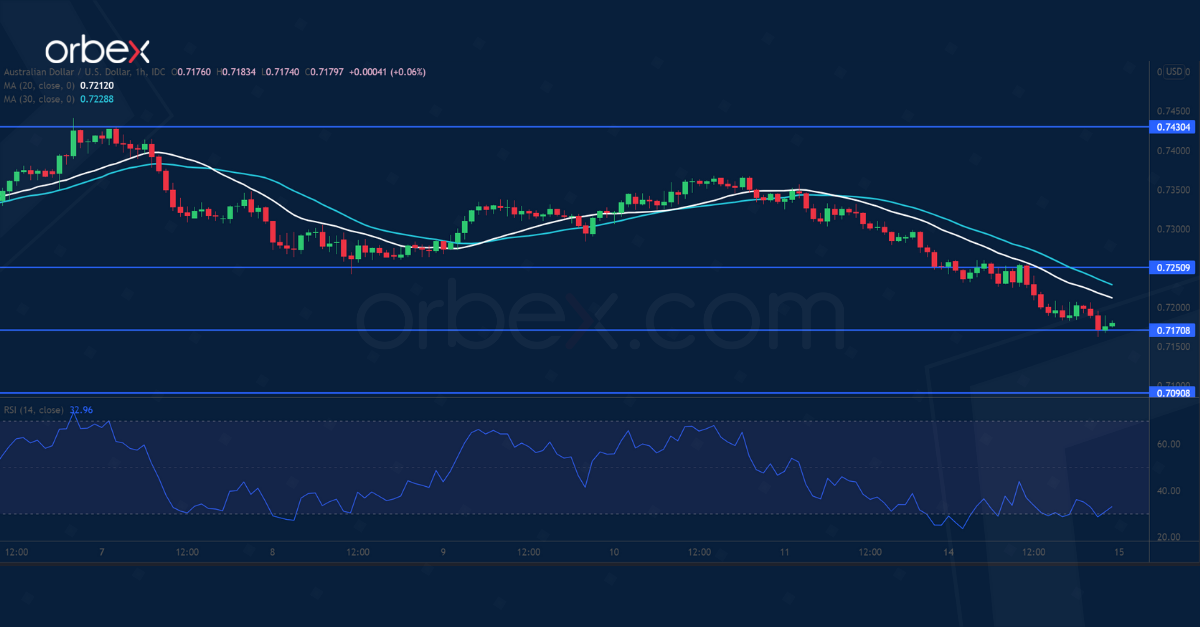
The Australian dollar slipped after dovish RBA minutes. The pair continues to pull back from its recent top at 0.7430.
A drop below the demand zone at 0.7250 further puts the bulls on the defensive. The former support has turned into a resistance level. 0.7170 at the origin of a previous breakout is key support.
An oversold RSI may raise buyers’ interest in this congestion area. A deeper correction could invalidate the recent rebound and send the Aussie to the daily support at 0.7090.
EUR/USD Struggles to Rebound
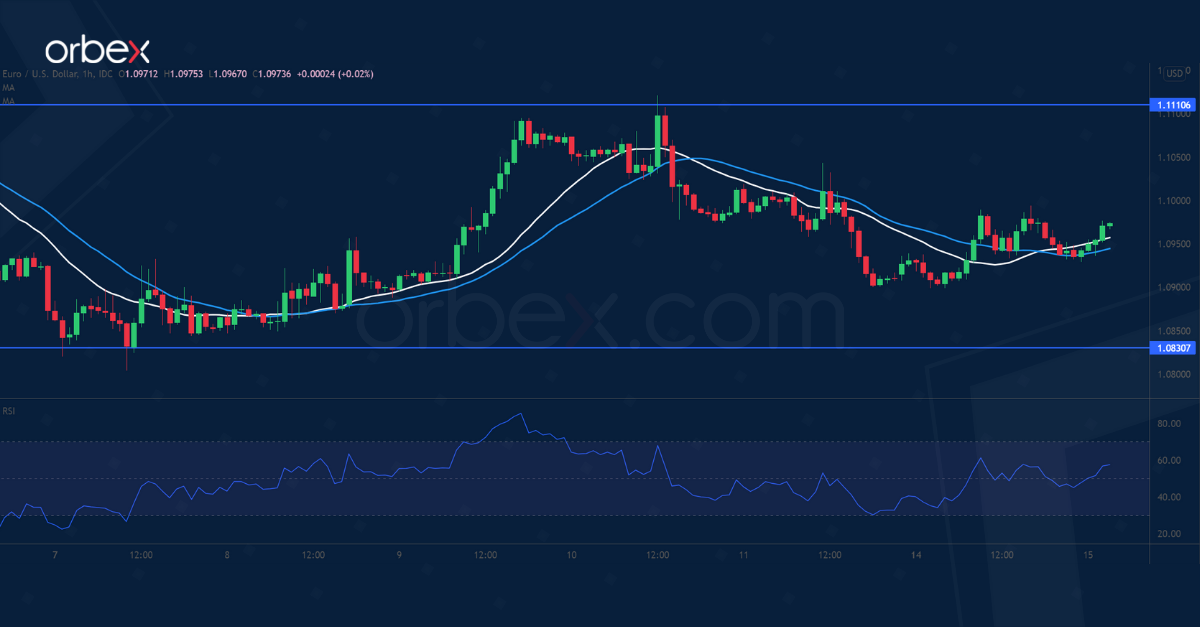
The US dollar bounces across the board as the Fed may possibly raise interest rates on Wednesday. The pair found support near May 2020’s lows around 1.0800.
The RSI’s oversold condition on the daily chart prompted the bears to take some chips off the table, alleviating the pressure. 1.1110 is a fresh resistance and its breach could lift offers to 1.1270.
In fact, this could turn sentiment around in the short term. Failing that, a break below 1.0830 could trigger a new round of sell-off towards March 2020’s lows near 1.0650.
EUR/USD Daily Outlook
Daily Pivots: (S1) 1.0896; (P) 1.0945; (R1) 1.0989; More...
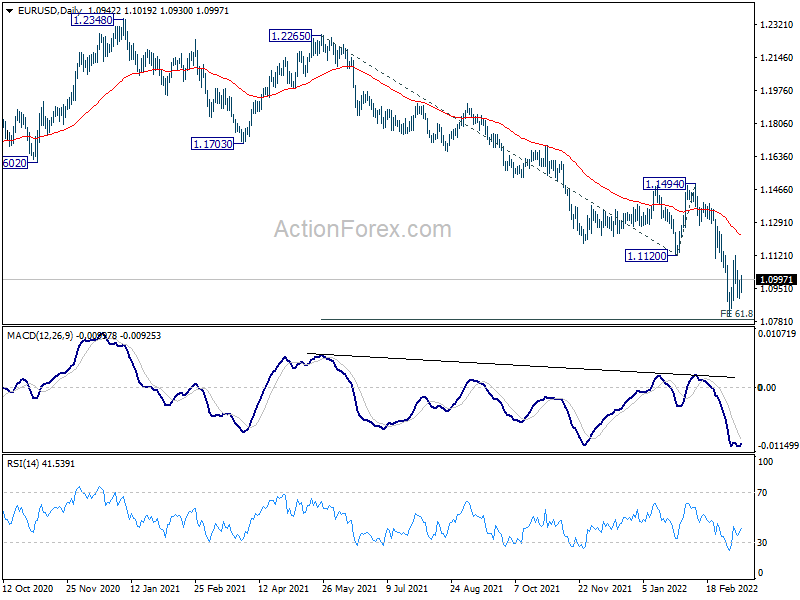
Outlook in EUR/USD remains unchanged as range trading continues. Intraday bias stays neutral first. As long as 1.1120 support turned resistance holds, larger down trend from 1.1494 is still expected to continue. On the downside, firm break of 61.8% projection of 1.2265 to 1.1120 from 1.1494 at 1.0786 will pave they way to 100% projection at 1.0349 next. However, strong break of 1.1120 will confirm short term bottoming, at least, and bring stronger rebound back towards 1.1494 structural resistance instead.
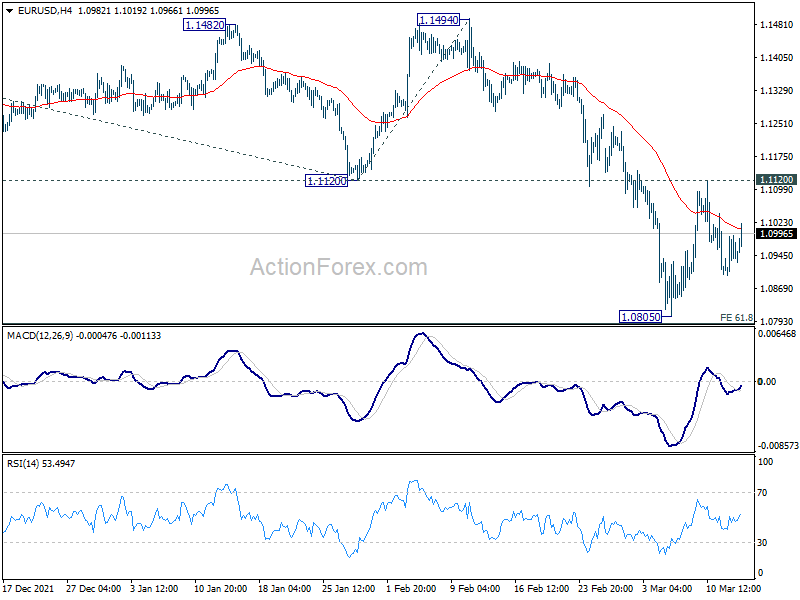
In the bigger picture, the decline from 1.2348 (2021 high) is expected to continue as long as 1.1494 resistance holds. Firm break of 1.0635 (2020 low) will raise the chance of long term down trend resumption and target a retest on 1.0339 (2017 low) next. Nevertheless, break of 1.1494 will maintain medium term neutral outlook, and extend range trading first.
GBP/USD Daily Outlook
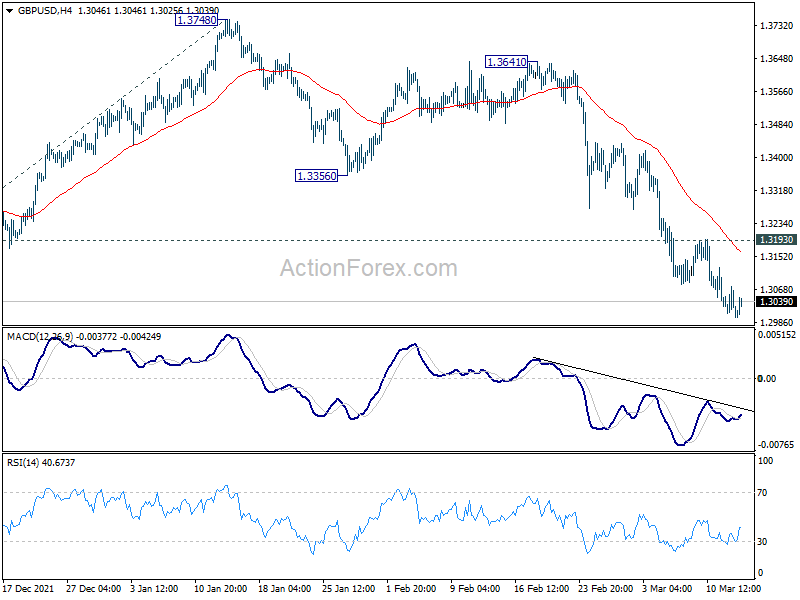
Daily Pivots: (S1) 1.2975; (P) 1.3027; (R1) 1.3053; More...
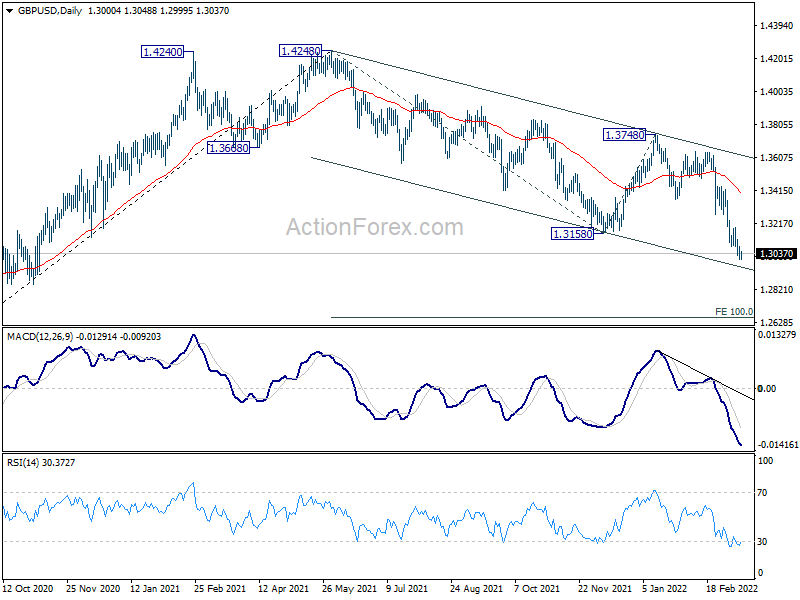
Intraday bias in GBP/US remains on the downside at this point. Current down trend from 1.4248 should target 100% projection of 1.4248 to 1.3158 from 1.3748 at 1.2658 next. On the upside, break of 1.3193 resistance is needed to indicate short term bottoming. Otherwise, outlook will stay bearish in case of recovery.
In the bigger picture, current development suggests that the up trend from 1.1409 (2020 low) has completed at 1.4248. Decline from 1.4248 could still be a corrective move, or it could be the start of a long term down trend. In either case, deeper decline would be seen back to 61.8% retracement of 2.1161 to 1.1409 at 1.2493. In any case, break of 1.3748 resistance is needed to indicate medium term bottoming, or outlook will stay bearish.
USD/CHF Daily Outlook
Daily Pivots: (S1) 0.9343; (P) 0.9365; (R1) 0.9409; More....
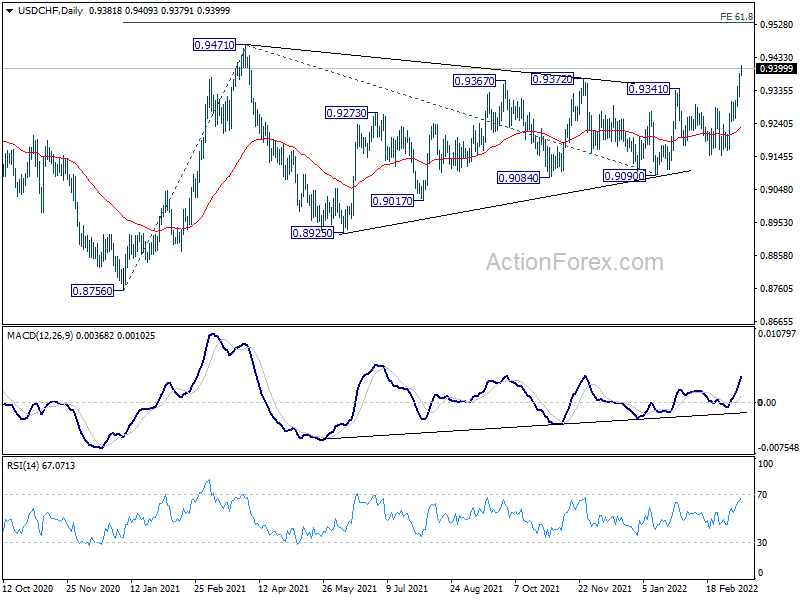
USD/CHF's rally is still in progress and intraday bias remains on the upside. Further rise should be see to 0.9471 resistance first. Break there will resume whole rally from 0.8756 to 61.8% projection of 0.8756 to 0.9471 from 0.9090 at 0.9532. On the downside, break of 0.9318 minor support will turn intraday bias neutral first.
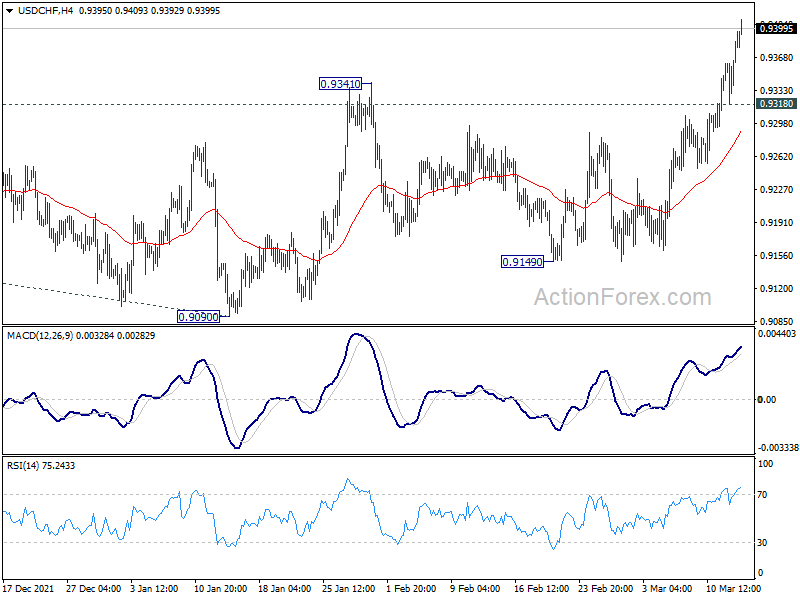
In the bigger picture, medium term outlook will be neutral at best as long as 0.9471 resistance holds. Larger down trend could still extend through 0.8756 (2021 low). However, firm break of 0.9471 will argue that whole down trend form 1.0342 (2016 high), has completed with waves down to 0.8756. A medium term up trend should be set up to target 1.0237/0342 resistance zone.