

Sample Category Title
EUR/GBP Daily Outlook
Daily Pivots: (S1) 0.8304; (P) 0.8343; (R1) 0.8376; More...
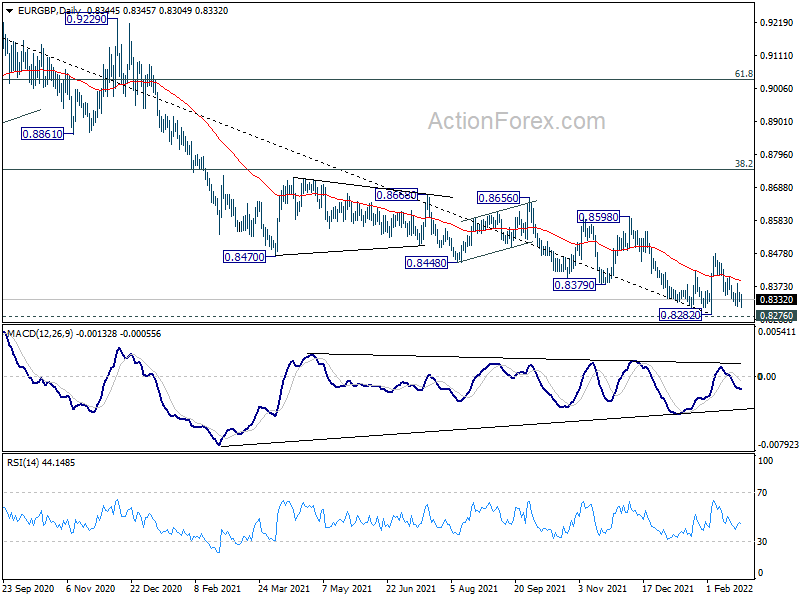
Intraday bias in EUR/GBP is back on the downside as fall from 0.8476 resumes. Deeper decline could be seen to 0.8282 low. Sustained break of 0.8276 key long term support will carry larger bearish implication. On the upside, above 0.8381 minor resistance will turn bias back to the upside for 0.8476 resistance. Break there will resume the rebound from 0.8282.
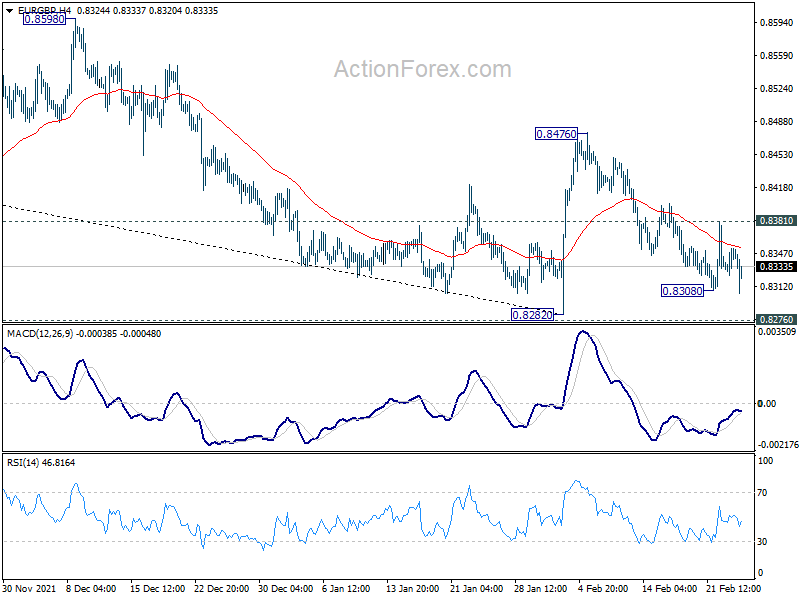
In the bigger picture, price actions from 0.9499 (2020 high) are still seen a corrective pattern that should be contained by 0.8276 long term support (2019 low). Sustained trading above 38.2% retracement of 0.9499 to 0.8282 at 0.8747 will affirm this bullish case. However, sustained break of 0.8276 will argue that the long term trend has reversed. Deeper decline would be seen to 61.8% retracement of 0.6935 to 0.9499 at 0.7917.
EUR/AUD Daily Outlook
Daily Pivots: (S1) 1.5574; (P) 1.5636; (R1) 1.5691; More...
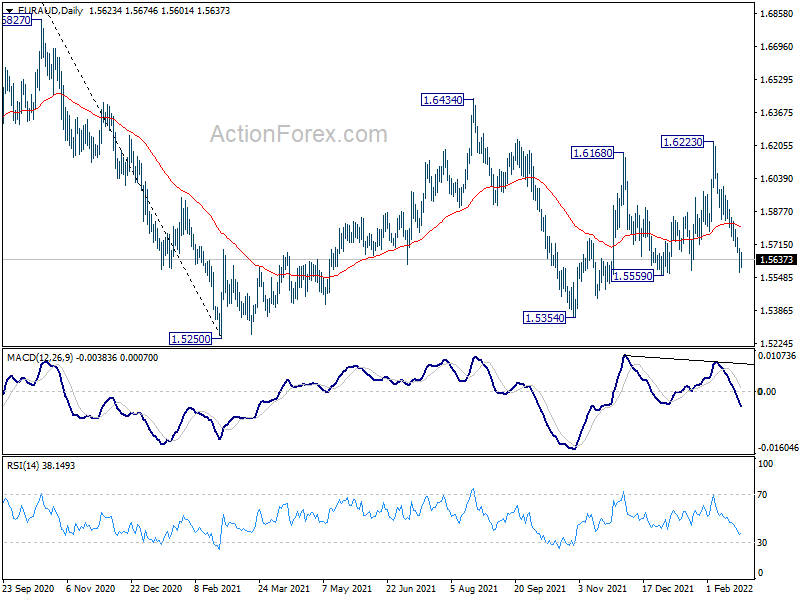
EUR/AUD's fall from 1.6223 is still in progress and intraday bias stays on the downside. Break of 1.5559 support should indicate that corrective rise from 1.5354 has completed in form of a three wave pattern. Further decline would then be seen back to 1.5250/5354 support zone. On the upside, above 1.5837 minor resistance will turn intraday bias neutral first.
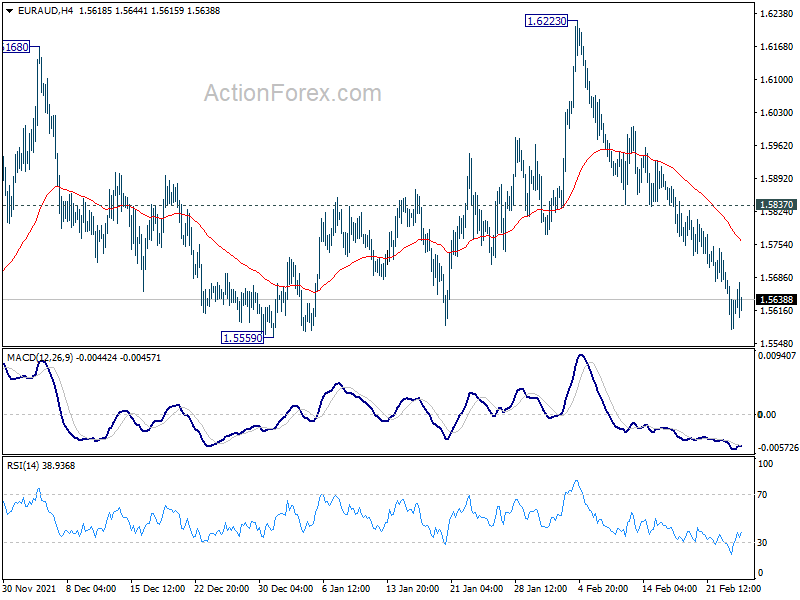
In the bigger picture, price actions from 1.5250 low are seen as a corrective pattern. Further extension could be seen and another rise cannot be ruled out. But strong resistance should be seen at 38.2% retracement of 1.9799 to 1.5250 at 1.6988. Larger down trend from 1.9799 is in favor to extend through 1.5250 at a later stage.
EUR/CHF Daily Outlook
Daily Pivots: (S1) 1.0351; (P) 1.0405; (R1) 1.0435; More....
EUR/CHF's fall from 1.0610 resumes after brief recovery and hits as low as 1.0288 so far. The breach of 1.0298 low argues that larger down trend from 1.1149 is resuming too. Intraday bias is back on the downside. Sustained trading below 1.0298 will target 61.8% projection of 1.0936 to 1.0298 from 1.0610 at 1.0216. For now, risk will stay on the downside as long as 1.0459 resistance holds, in case of recovery.
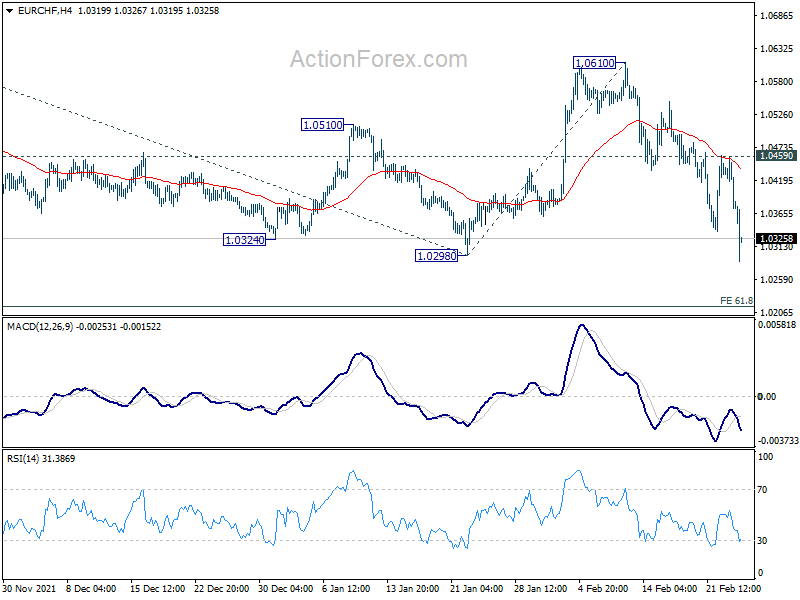
In the bigger picture, long term down trend from 1.2004 (2018 high) is still in progress. Next target is 61.8% projection of 1.2004 to 1.0505 to 1.1149 at 1.0223. Sustained break there will target 100% projection at 0.9650. In any case, break of 1.0610 resistance is needed to be the first sign of bottoming. Otherwise, outlook will remain bearish.
Global Markets Sink as Russia Invades Ukraine, Euro Under Heavy Selling
Global markets sink as Russia finally launches invasion of Ukraine. Risk averse sentiment dominates, pushing gold and oil higher, while stocks and cryptocurrencies tumble. In the currency markets, Yen and Swiss Franc surge sharply on safe-haven flows, together with Dollar. On the other hand, Euro is under heavy selling pressure together with commodity currencies.
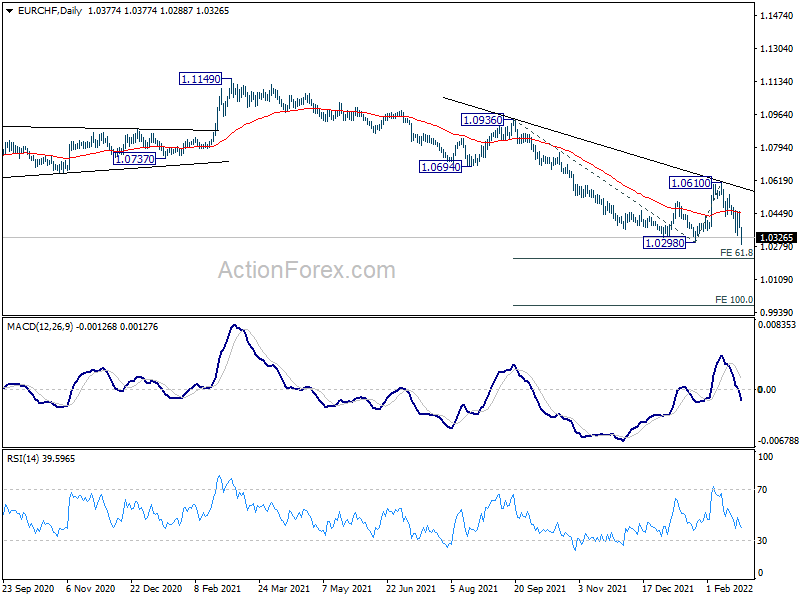
Technically, EUR/USD finally breaks through 1.1265 minor support, confirming rejection by 1.1482 resistance. Deeper decline should be seen through 1.1120 to resume larger down trend from 1.2348. EUR/CHF's break of 1.0298 support also suggests resumption of down trend from 1.1149. To solidify the Euro's bearishness, we'd like to see EUR/JPY taking out 128.23 support with some conviction.
In Asia, at the time of writing, Nikkei is down -2.05%. Hong Kong HSI is down -3.27%. China Shanghai SSE is down -1.52%. Singapore Strait Times is down -3.10%. Japan 10-year JGB yield is down -0.0043 at 0.194. Overnight, DOW dropped -1.38%. S&P 500 dropped -1.84%. NASDAQ dropped -2.57%. 10-year yield rose 0.029 to 1.977.
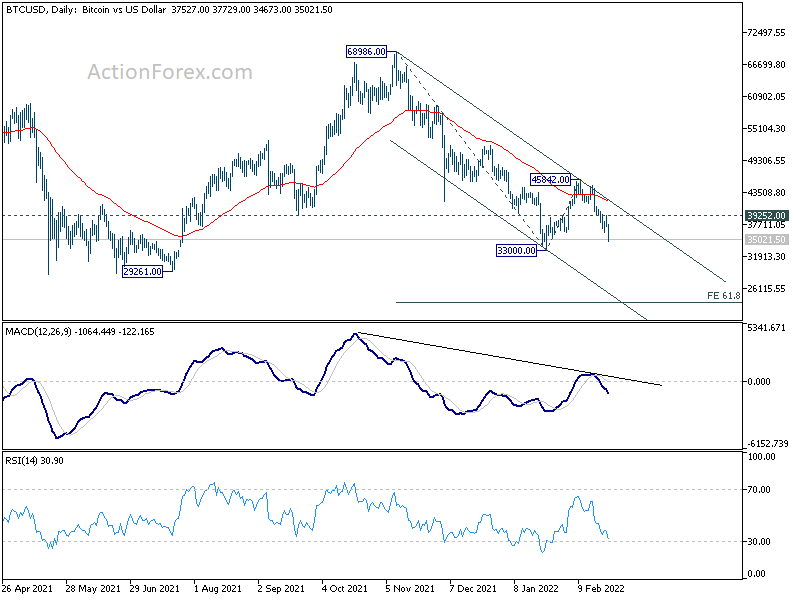
Bitcoin ready to break through 33k low to resume down trend
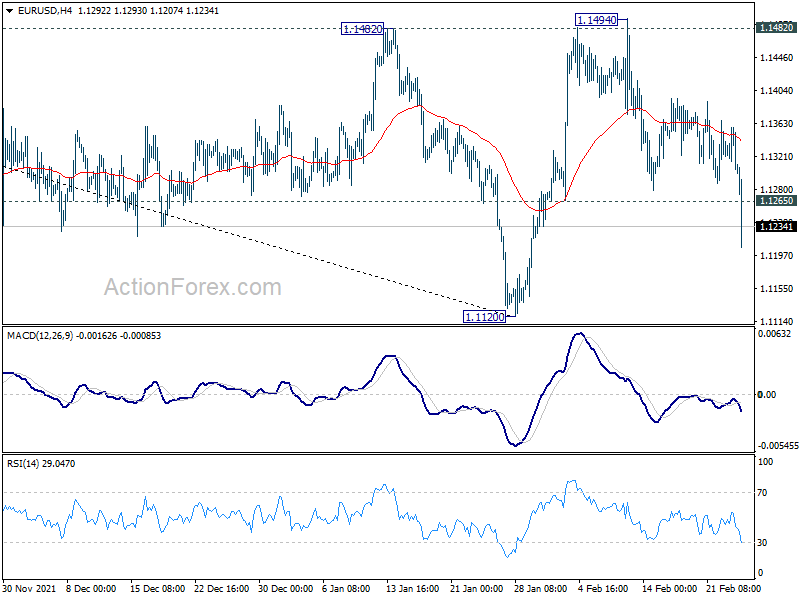
Bitcoin's steep decline today affirms that case that corrective rebound from 33000 has completed at 45842, after failing to sustain above 55 day EMA. The development also argues that down trend from 68986 is ready to resume. Further decline is now expected as long as 39252 resistance holds.
First target will be 33000 low. Decisive break there will confirm this bearish case. It's a bit early to say whether the downside momentum warrants a firm break of 30k handle. But, we'd tentatively put 61.8% projection of 68986 to 33000 from 45852 at 23602 as the next target. Let's see.
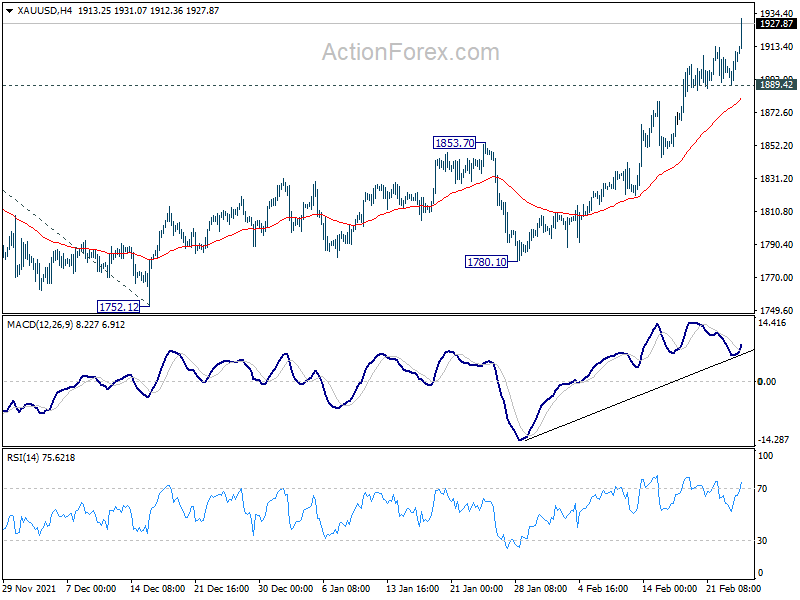
Gold resumes rally, targets 1946 next
Gold's rally resumed after brief consolidation and hits as high as 1931.07 so far. In any case, outlook will stay bullish as long as 1889.42 support holds. Next target is 100% projection of 1682.60 to 1877.05 from 1752.12 at 1946.57. Sustained break there, as well as the channel resistance, could prompt some strong upside acceleration ahead.
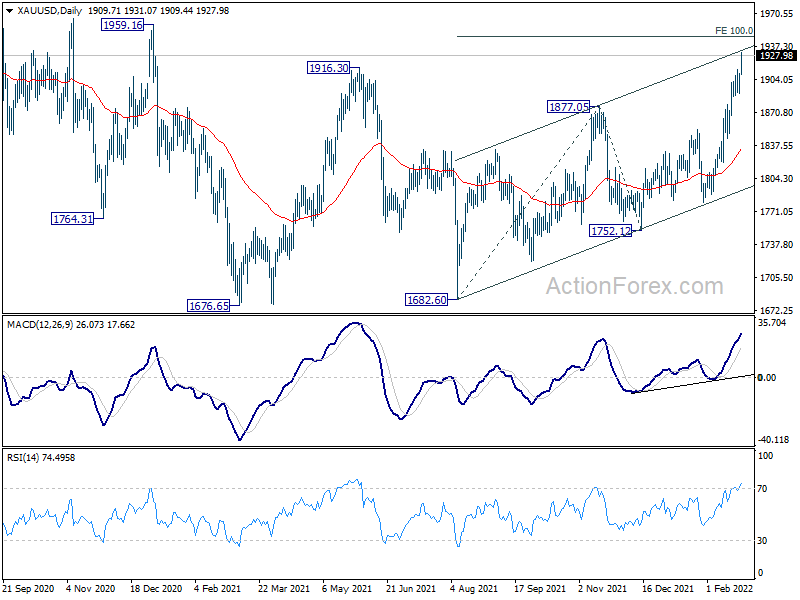
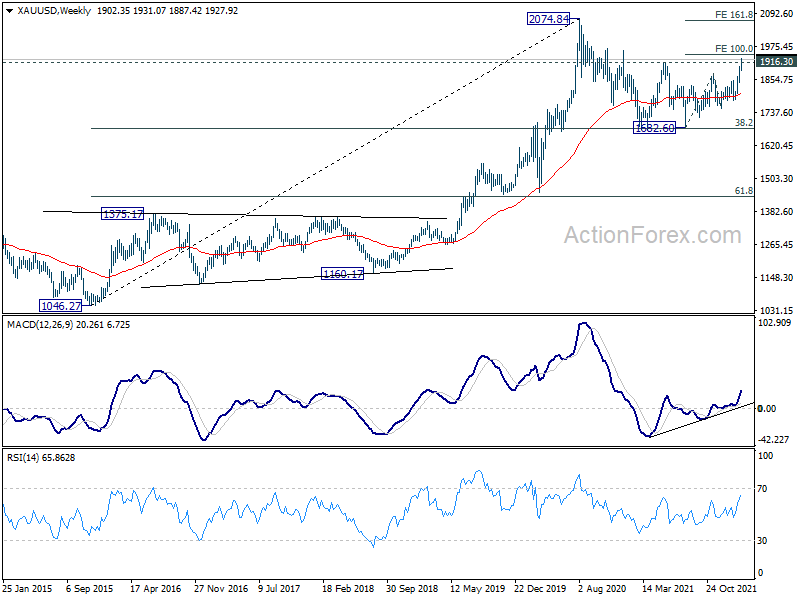
It should also be noted again that sustained break of 1916.30 should confirm that whole correction from 2074.84 (2020 high) has completed at 1682.60, after defending 38.2% retracement of 1046.27 to 2074.84. Further decisive break of 1946.57 would quickly shot Gold up to 161.8% projection at 2066.74, which is close to 2074.84 high.
ECB Lane hints at earlier end to asset purchases
ECB Chief Economist Philip Lane said in an interview, "if inflation rates are moving towards our target in the medium term, which is now looking more likely – instead of being well below two per cent as before the pandemic – we will adjust monetary policy".
That's because, "we would then, for example, no longer need to make asset purchases to stabilise inflation at our target over the medium term."
"It was different in December, when surveys still showed the expectation that we would need to maintain asset purchases until the middle of next year, but the timeline may be shorter than what people expected then," he added.
Lane also reiterated the "sequencing" of policy normalization. That is, "our net assets purchases will first be scaled down, then ended. Then, the key policy rates will only increase above their current levels if the conditions consistent with our medium-term inflation target are met. So before we talk about potential rate decisions, we need to end net asset purchases. And we need to prepare the market for the eventual end of these purchases.
BoJ Kuroda: No immediate plans to scale back stimulus
BoJ Governor Haruhiko Kuroda told the parliament, "unlike Western countries, we have no immediate plans to scale back our monetary stimulus." But the central bank will continue to look at inflation expectations. "We will look not just at price indicators, but also surveys showing how the public feels about price moves," he added.
On exchange rate, Kuroda said, "if the yen weakens further, that could push up import costs. But the recent rise in import costs is driven mostly by an increase in dollar-denominated raw material prices, rather than a weak yen."
"It's desirable for currency rates to move stably reflecting economic fundamentals. I think recent (yen) moves are in line with this trend," Kuroda added.
Looking ahead
US jobless claims, new home sales and Q4 GDP will be the main features today.
EUR/CHF Daily Outlook
Daily Pivots: (S1) 1.0351; (P) 1.0405; (R1) 1.0435; More....
EUR/CHF's fall from 1.0610 resumes after brief recovery and hits as low as 1.0288 so far. The breach of 1.0298 low argues that larger down trend from 1.1149 is resuming too. Intraday bias is back on the downside. Sustained trading below 1.0298 will target 61.8% projection of 1.0936 to 1.0298 from 1.0610 at 1.0216. For now, risk will stay on the downside as long as 1.0459 resistance holds, in case of recovery.
In the bigger picture, long term down trend from 1.2004 (2018 high) is still in progress. Next target is 61.8% projection of 1.2004 to 1.0505 to 1.1149 at 1.0223. Sustained break there will target 100% projection at 0.9650. In any case, break of 1.0610 resistance is needed to be the first sign of bottoming. Otherwise, outlook will remain bearish.
Economic Indicators Update
| GMT | Ccy | Events | Actual | Forecast | Previous | Revised |
|---|---|---|---|---|---|---|
| 00:30 | AUD | Private Capital Expenditure Q4 | 1.10% | 2.90% | -2.20% | -1.10% |
| 13:30 | USD | Initial Jobless Claims (Feb 18) | 239K | 248K | ||
| 13:30 | USD | GDP Annualized Q4 P | 7.10% | 6.90% | ||
| 13:30 | USD | GDP Price Index Q4 P | 6.90% | 6.90% | ||
| 15:00 | USD | New Home Sales M/M Jan | 803K | 811K | ||
| 15:30 | USD | Natural Gas Storage | -137B | -190B | ||
| 16:00 | USD | Crude Oil Inventories | -1.0M | 1.1M |
Technical Outlook and Review
DXY:
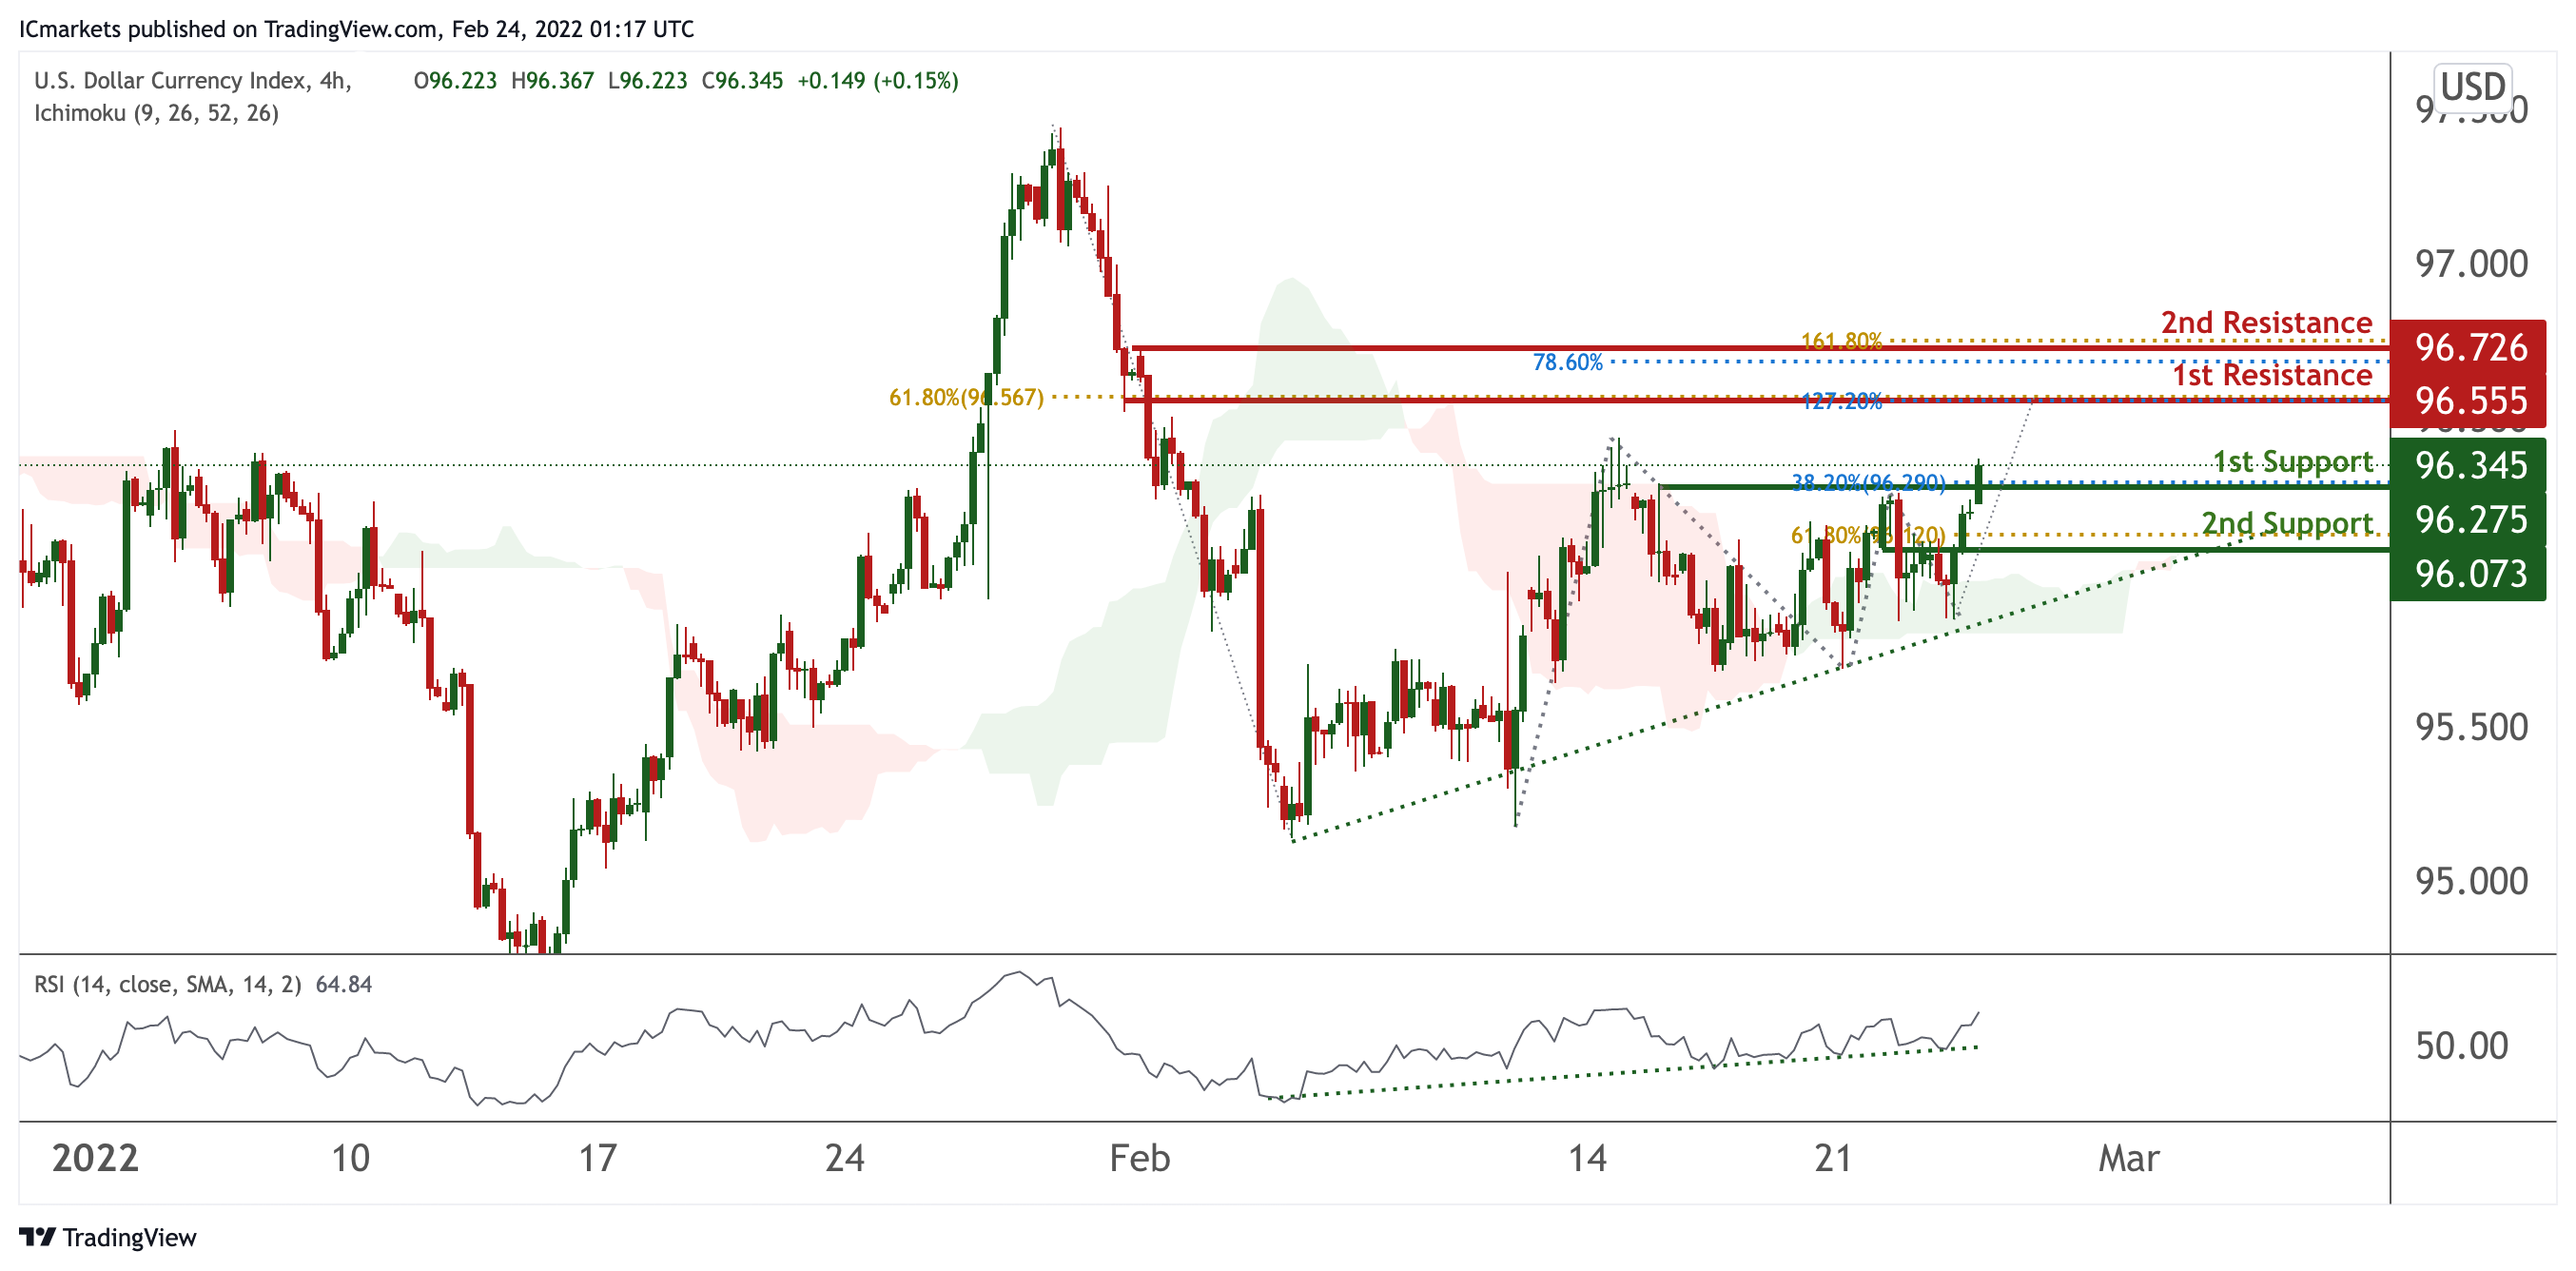
On the H4, prices are on bullish momentum and abiding by an ascending trendline. We see the potential for further bullish continuation from our 1st support at 96.345 in line with 38.2% Fibonacci retracement towards our 1st resistance at 96.555 in line with 127.2% Fibonacci extension and 61.8% Fibonacci retracement. Our bullish bias is supported by prices trading above our ichimoku clouds support and RSI portraying bullish momentum.
Areas of consideration
- H4 1st resistance at 96.345
- H4 1st support at 96.555
XAU/USD (GOLD):
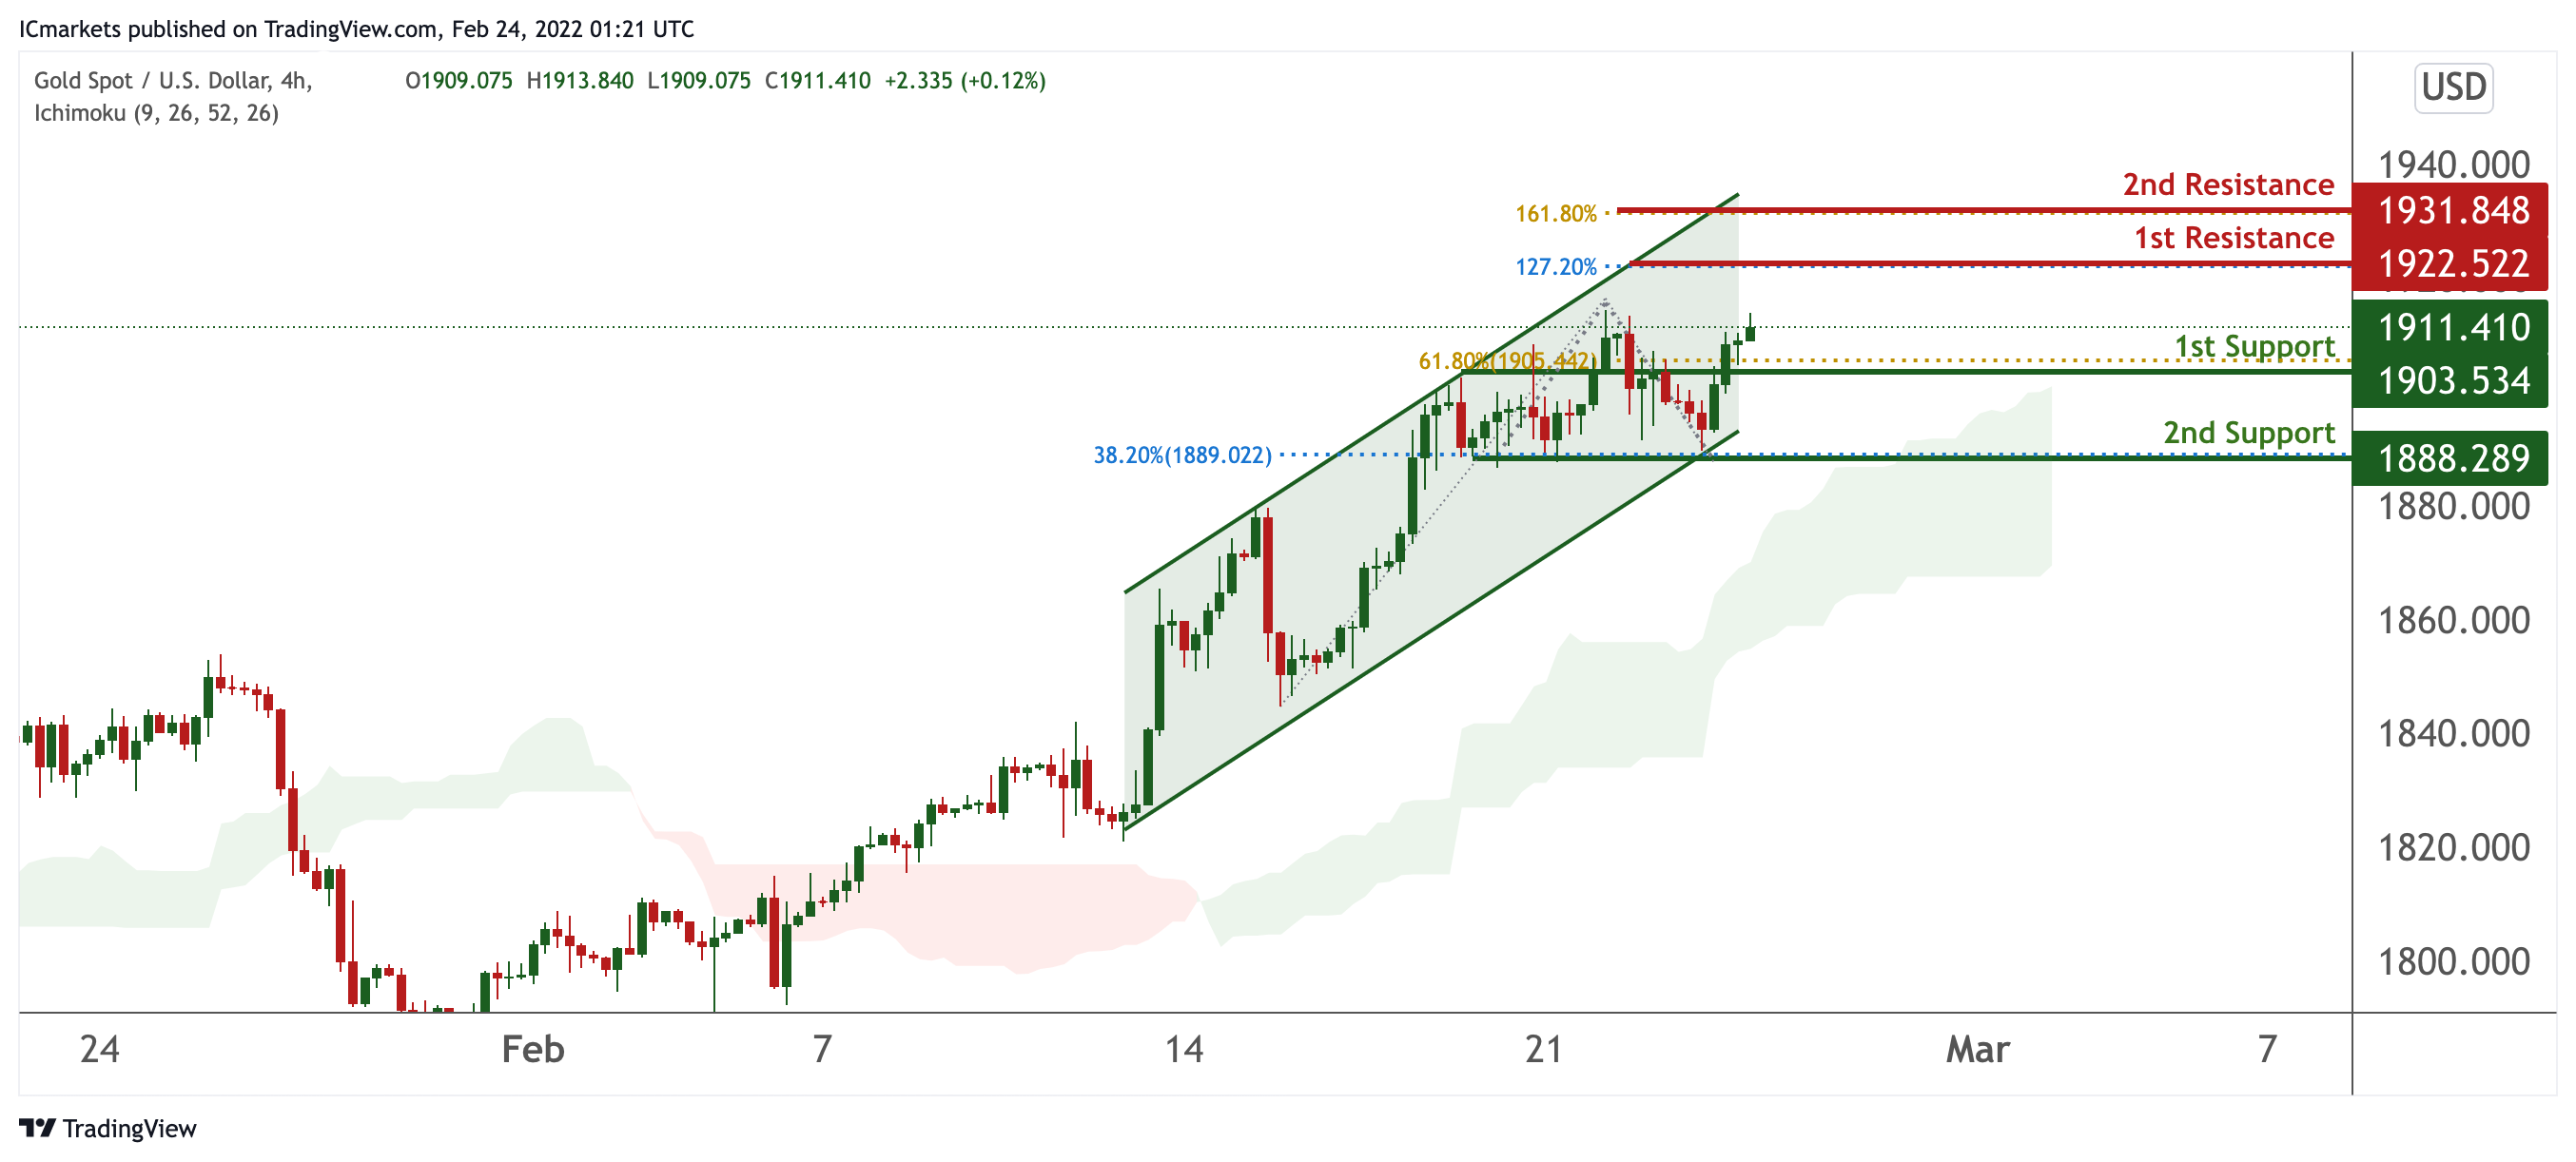
On the H4, prices are on bullish momentum and consolidating in a parallel channel. We see the potential for further bullish continuation from our 1st support at 1903.534 in line with 61.8% Fibonacci extension towards our 1st resistance at 1922.522 in line with 127.2% Fibonacci extension. Prices are trading above our Ichimoku Cloud support, further supporting our bullish bias.
Areas of consideration:
- H4 1st resistance at 1922.522
- H4 1st support at 1903.534
GBP/USD
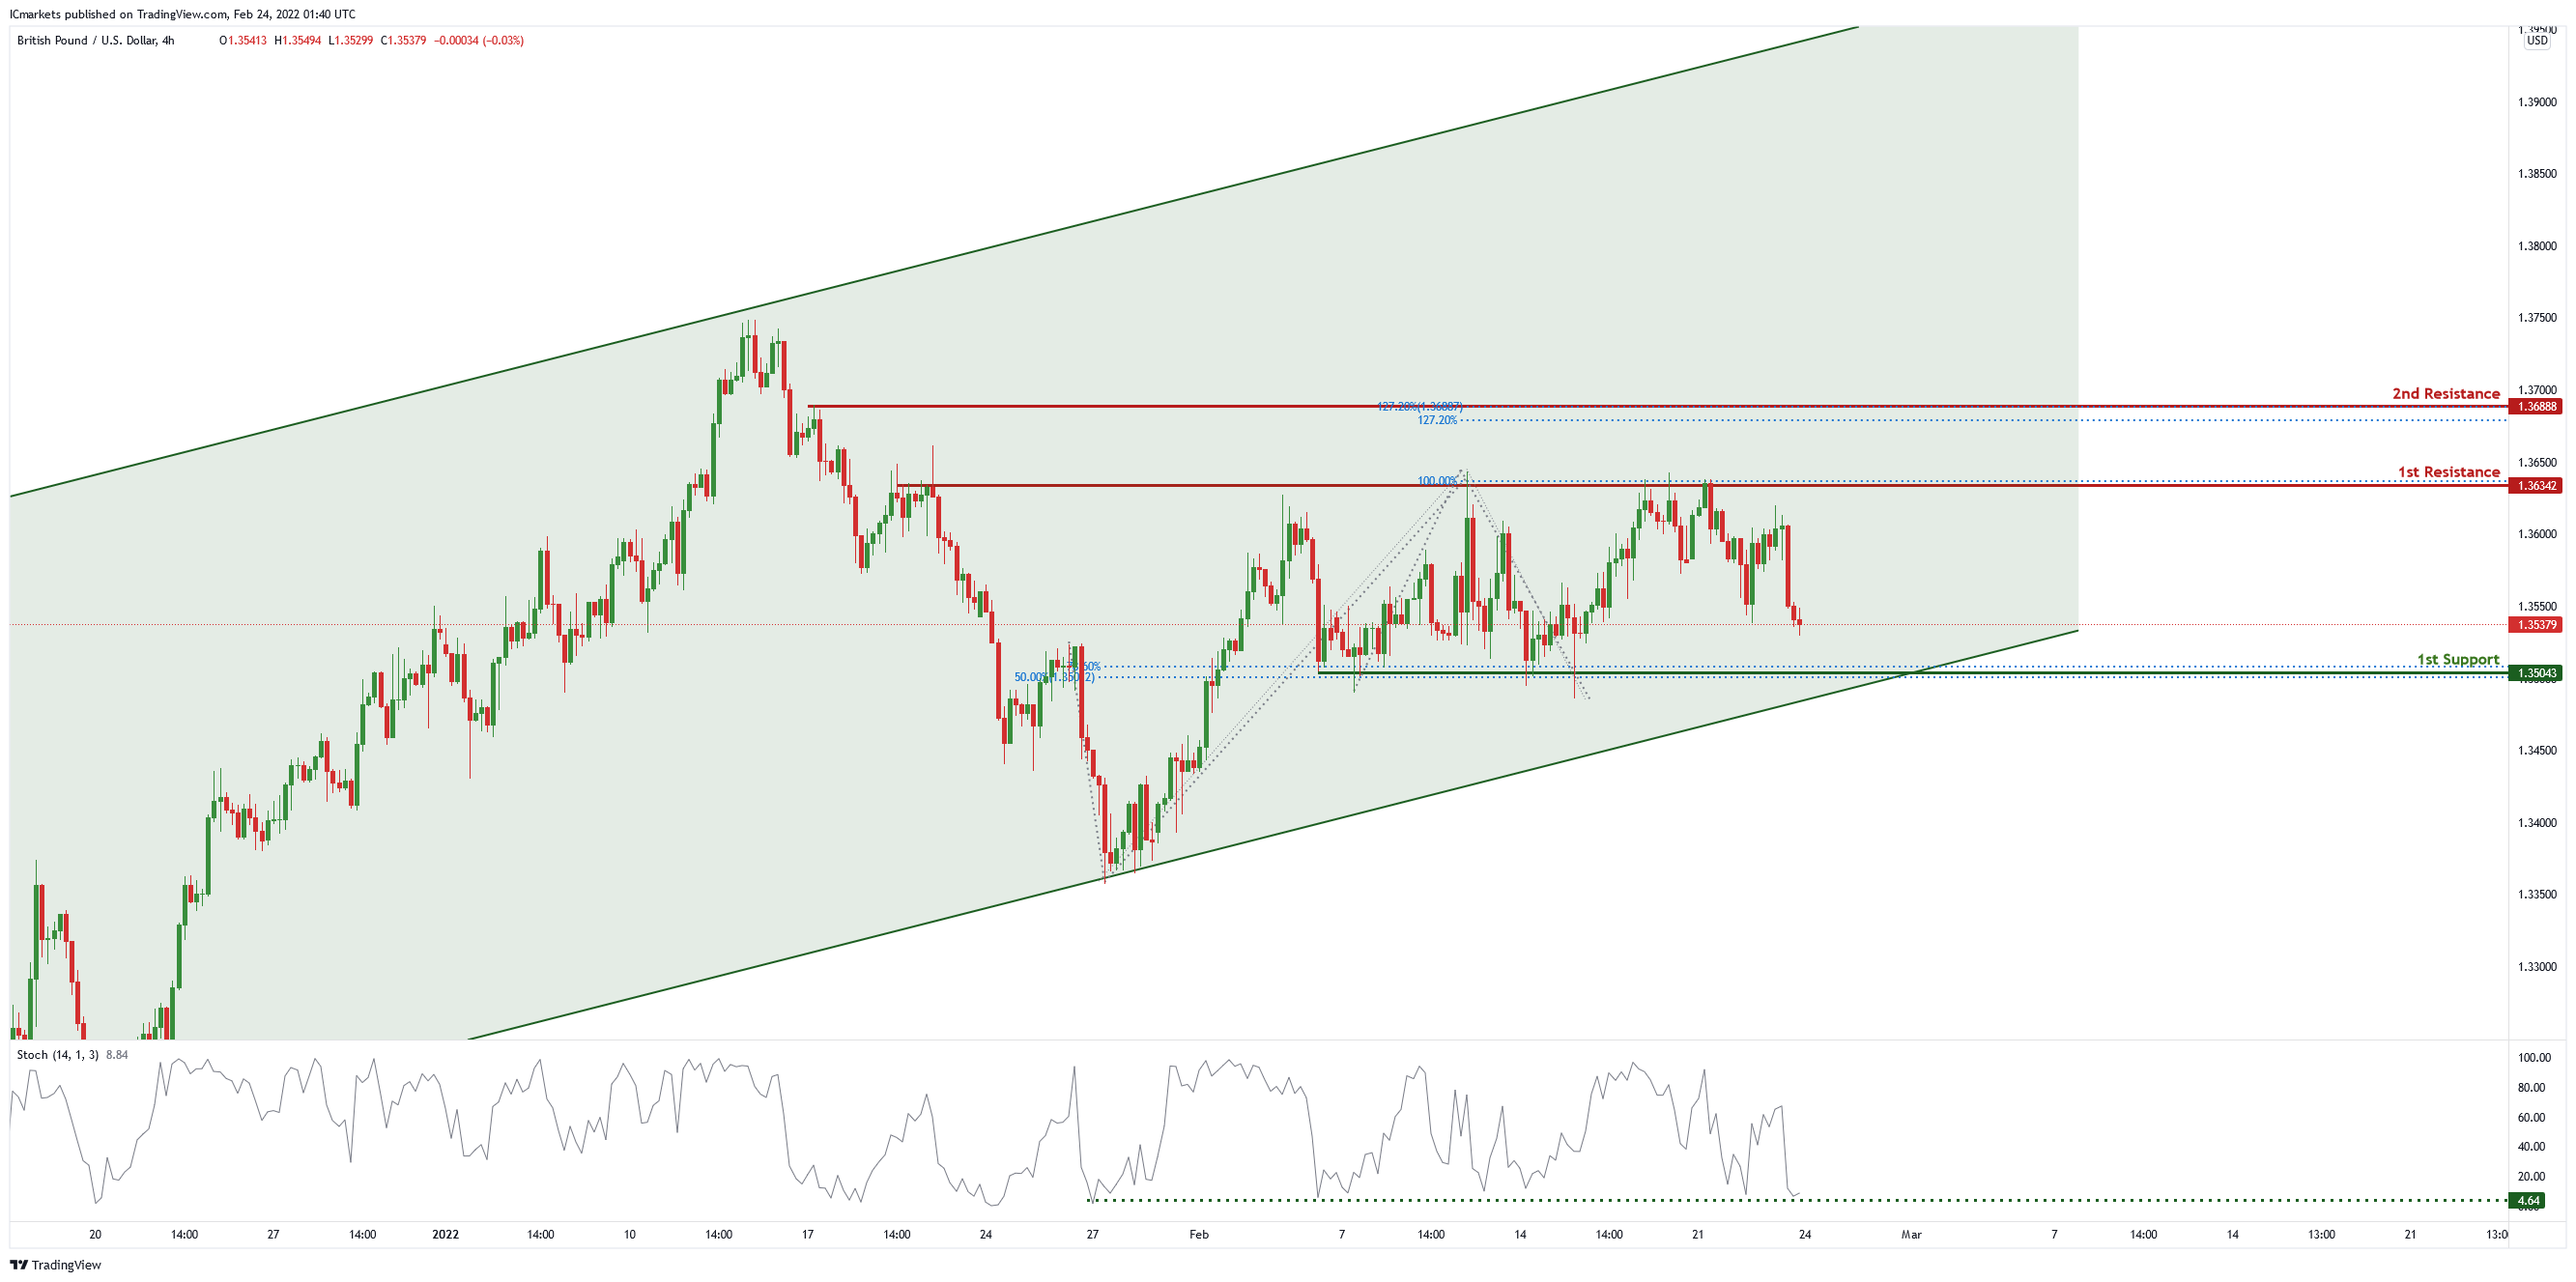
On the H4 chart , price is near 1st resistance level of 1.36342 in line with 61.8% Fibonacci retracement and 100% Fibonacci projection. Price can potentially dip to the take profit level of 1.35043 in line with 50% Fibonacci retracement and 78.6% Fibonacci projection . Our bearish bias is supported by the stochastic indicator as it is near support level.
Areas of consideration
- H4 1st resistance at 1.36342
- H4 1st support at 1.35043
USD/CHF:
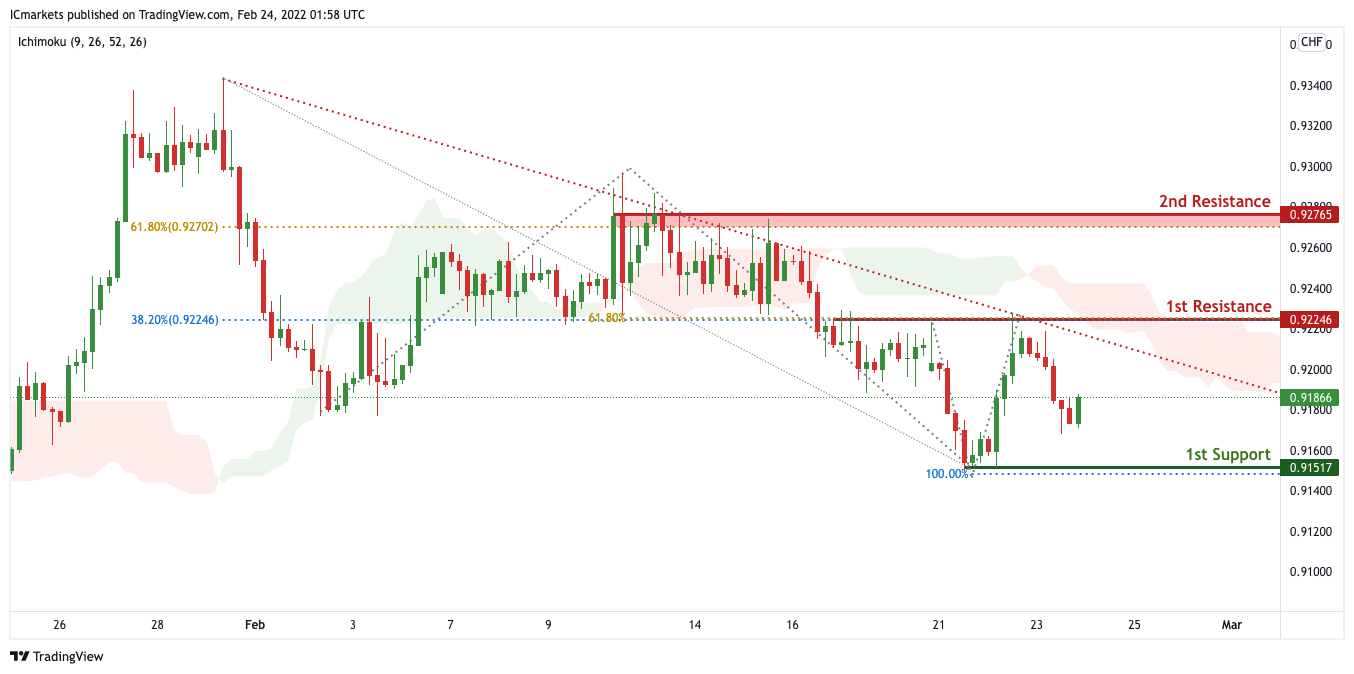
On the H4 timeframe, prices are on bearish momentum and abiding to our descending trendline. We see the possibility of bearish continuation from our 1st resistance at 0.92246 in line with 38.2% Fibonacci retracement and 61.8% Fibonacci projection towards our 1st support at 0.91517 in line with 100% Fibonacci projections. Our bearish bias is further supported by prices trading below our Ichimoku clouds and the descending trend line.
Areas of consideration :
- H4 1st resistance at 0.92246
- H4 1st support at 0.91517
EUR/USD :
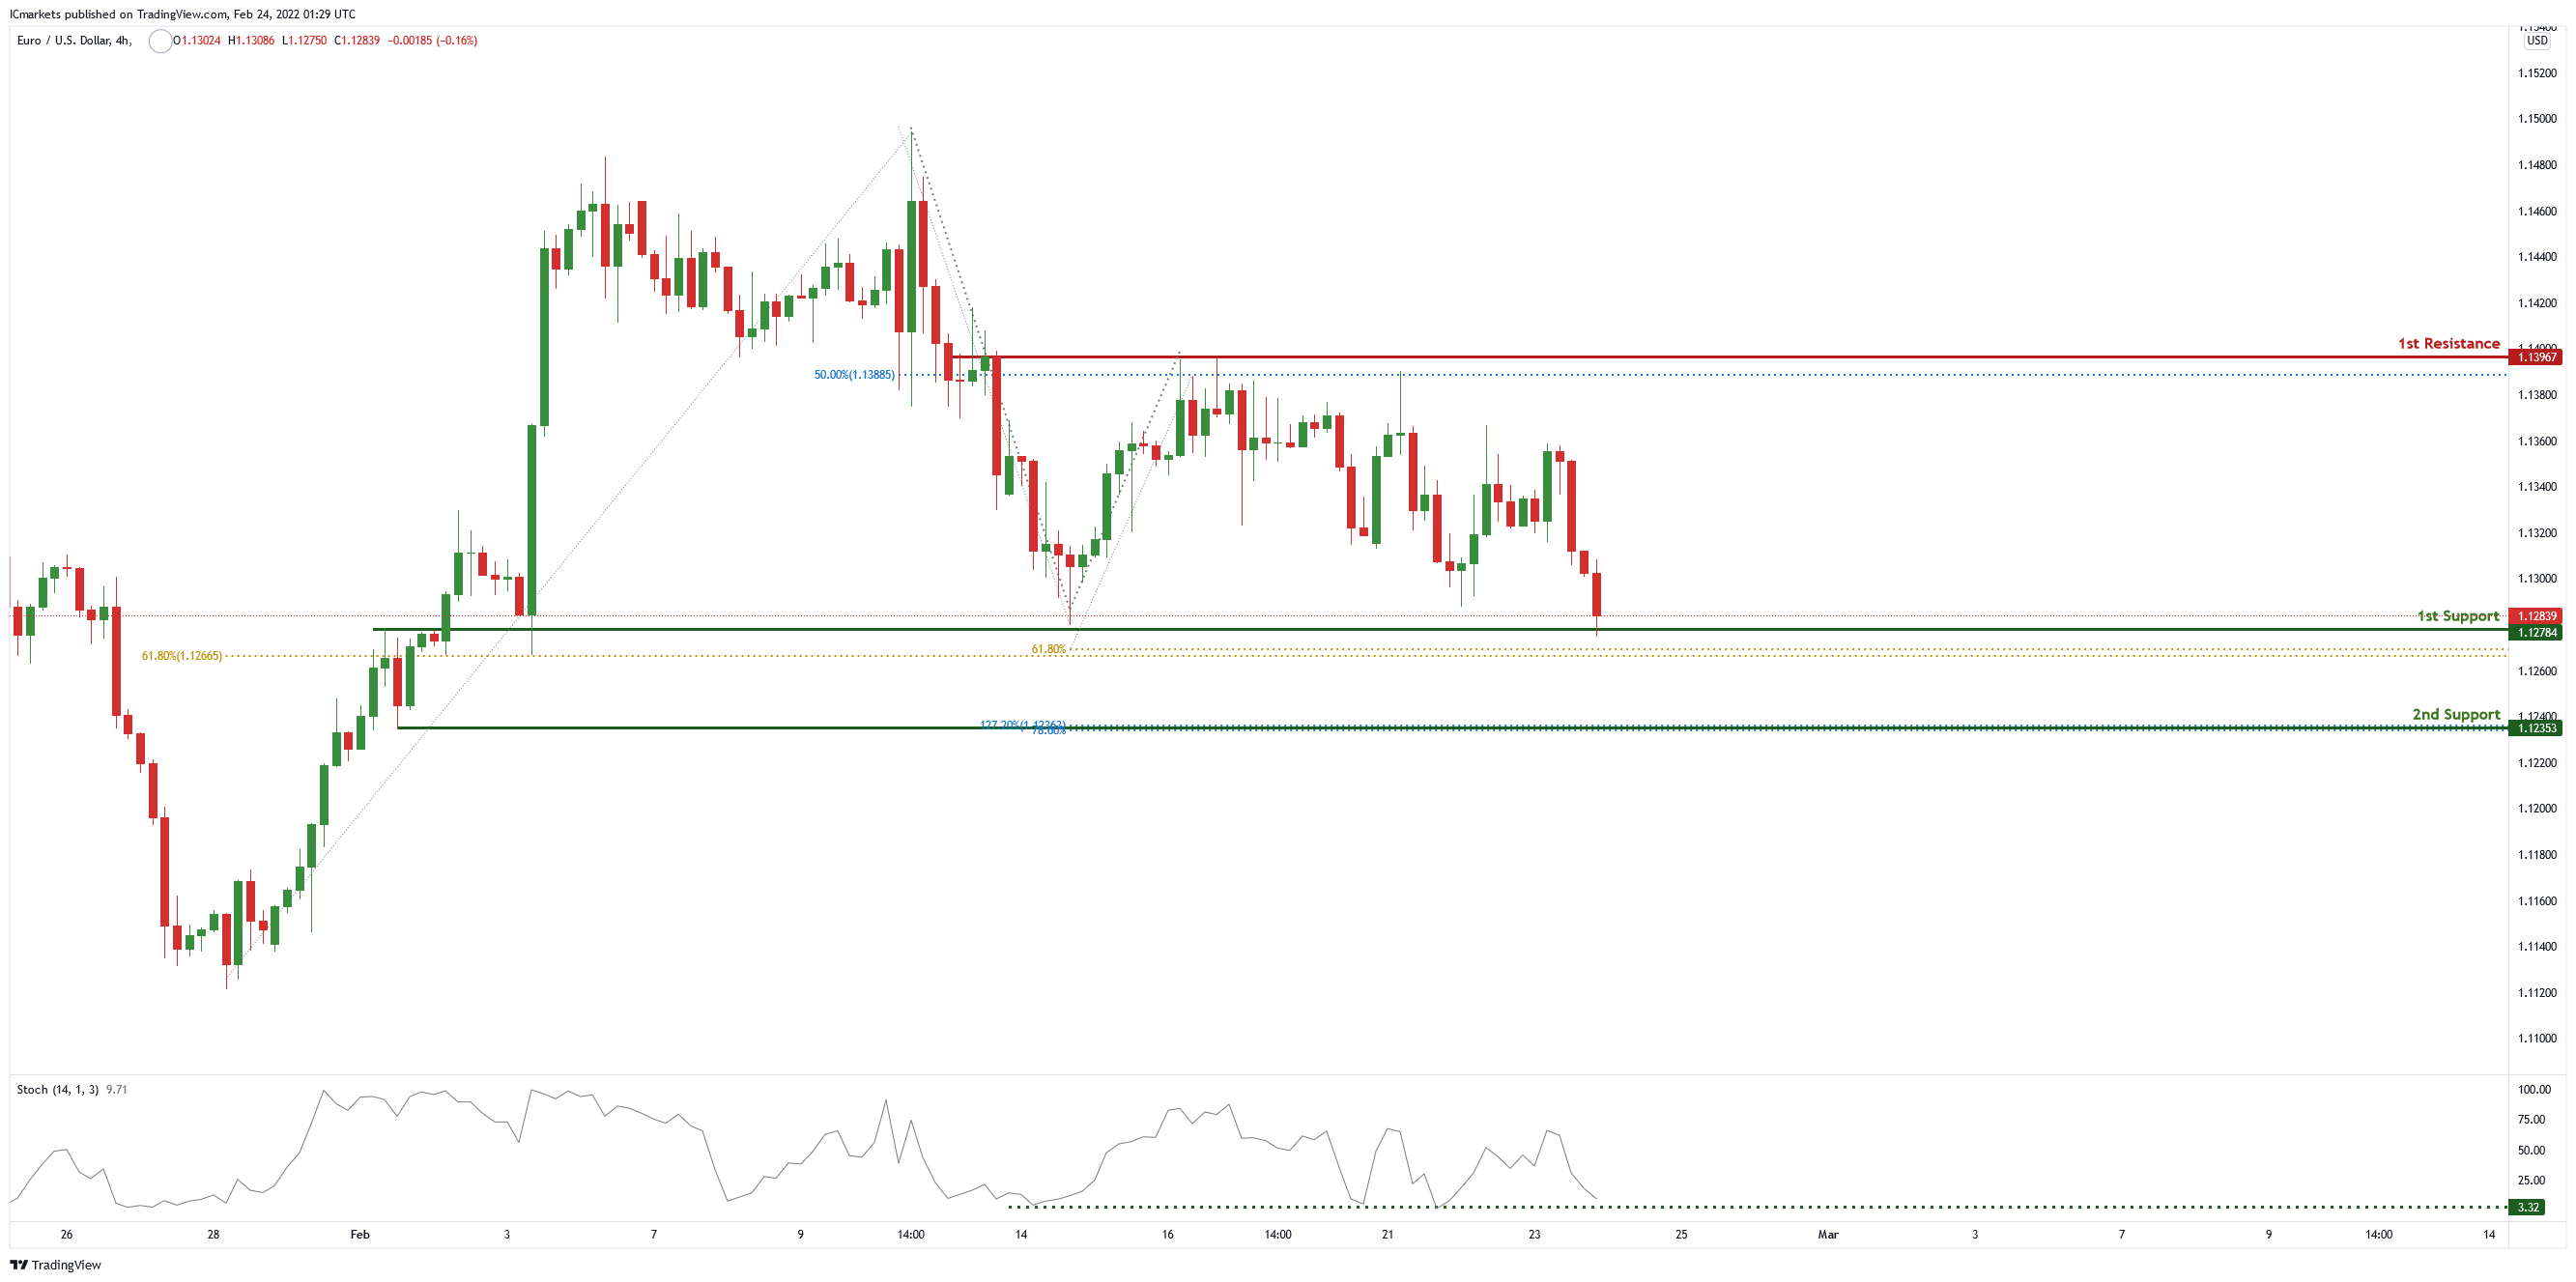
On the H4 chart, price is in the middle of 1st resistance of 1.13967 in line with 50% Fibonacci retracement and 1st support of 1.12784 in line with 61.8% Fibonacci retracement and 61.8% Fibonacci projection. Price can potentially bounce from the 1st support to the 1st resistance level. Our bullish bis is supported by the stochastic indicator as it is near support level.
Areas of consideration
- H4 1st support at 1.12784
- H4 1st resistance at 1.13967
USD/JPY:
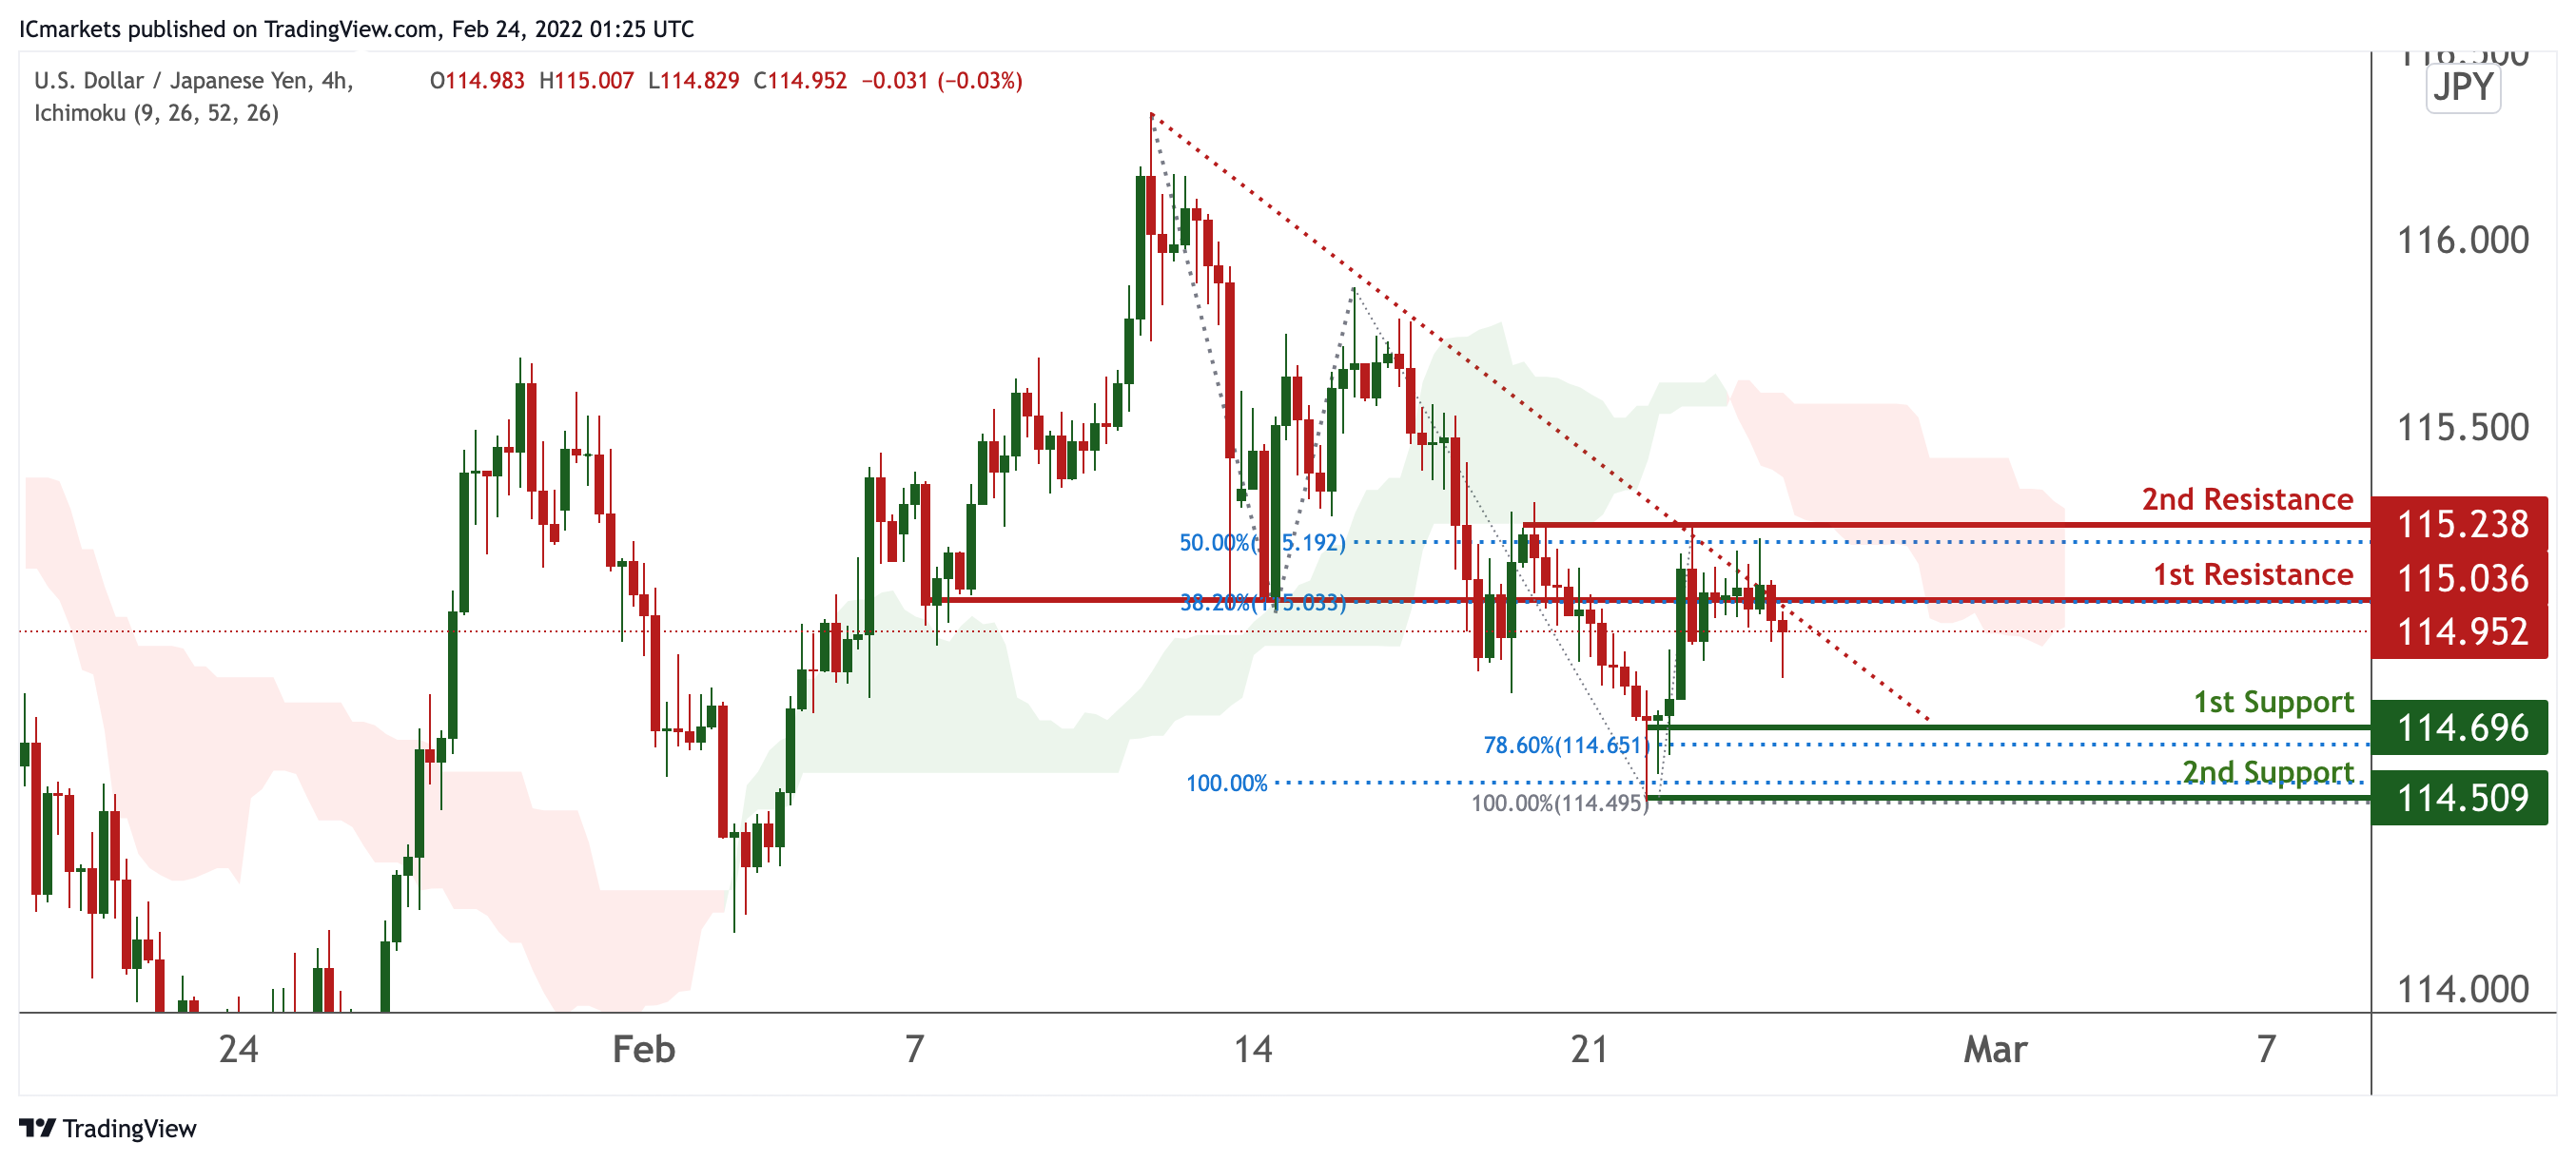
On the H4 timeframe, prices are on bearish momentum and abiding to our descending trendline. We see the possibility of bearish continuation from our 1st resistance at 115.036 in line with 38.2% Fibonacci retracement towards our 1st support at 114.696 in line with 78.6% Fibonacci retracement. Our bearish bias is further supported by prices trading below our Ichimoku clouds. Breaking our 1st resistance will find prices climbing higher towards our 2nd resistance at 115.238 in line with 50% Fibonacci retracement.
Areas of consideration:
- H4 time frame, 1st resistance at 115.036
- H4 time frame, 1st support at 114.696
AUD/USD:
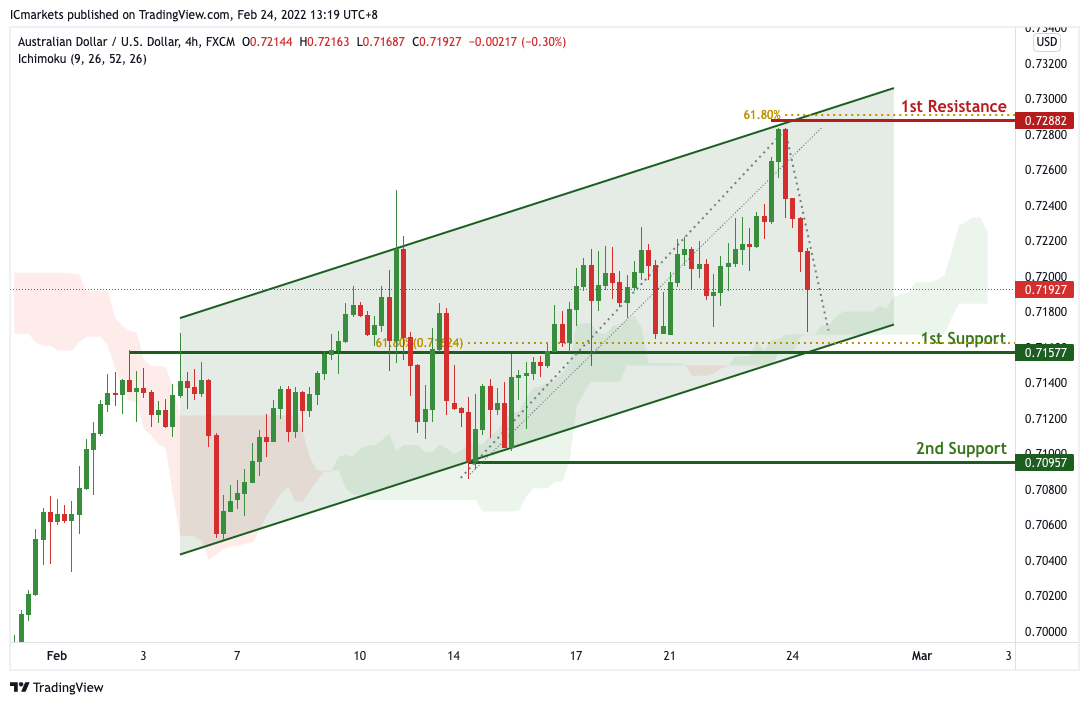
On the H4 timeframe, prices are approaching a pivot and are on bullish momentum. We see potential for a bounce from our 1st support at 0.71577 in line with 61.8% Fibonacci retracement towards 1st resistance at 0.72882 in line with swing high resistance. Prices are trading above our ichimoku cloud support, further supporting our bullish bias. Alternatively, our stop loss will be placed at 0.70957.
Areas of consideration:
- H4 1st resistance at 0.72882
- H4 1st support at 0.71577
NZD/USD:
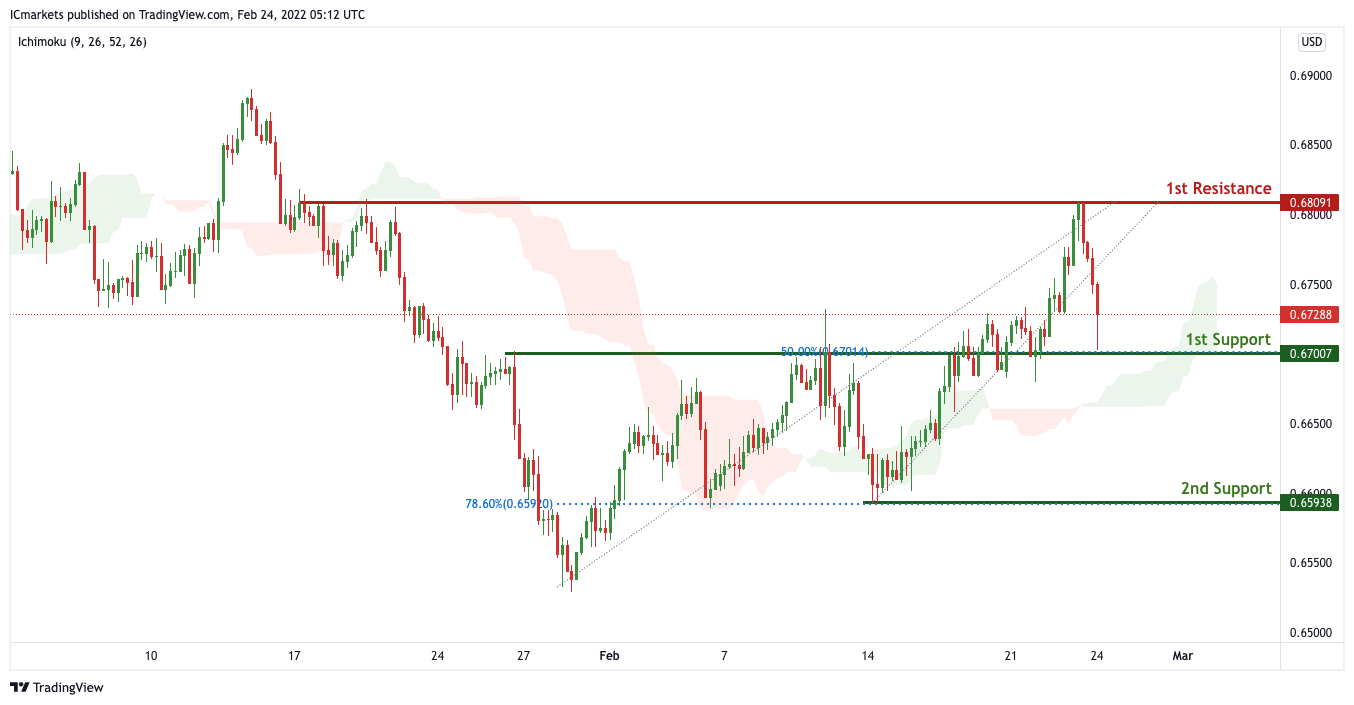
On the H4 timeframe, prices are approaching a pivot and are on bullish momentum. We see potential for a bounce from our 1st support at 0.67007 in line with 50% Fibonacci retracement towards 1st resistance at 0.68091 in line with swing high resistance. Prices are trading above our ichimoku cloud support, further supporting our bullish bias. Alternatively, our stop loss will be placed at 0.65938 in line with 78.6% Fibonacci retracement.
Areas of consideration:
- H4 time frame, 1st resistance at 0.68091
- H4 time frame, 1st support at 0.67007
USD/CAD:
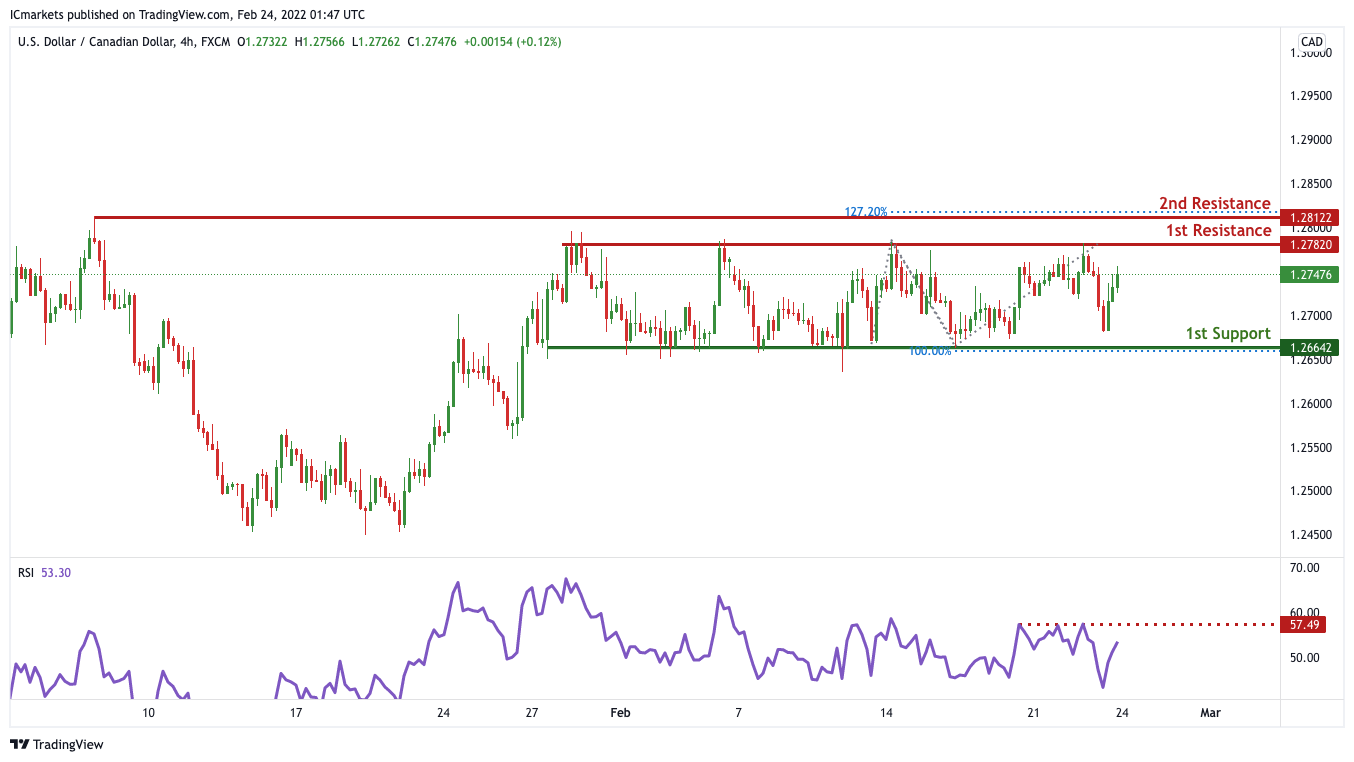
On the H4 timeframe, We see the possibility of bearish continuation from our 1st resistance at 1.27820 in line with horizontal swing high resistance towards our 1st support at 1.26642 in line with the 100% Fibonacci extension level. Our bearish bias is further supported by prices reversing off the RSI indicator.
Areas of consideration:
- H4 time frame, 1st support at 1.26642
- H4 time frame, 1st resistance at 1.27820
OIL:
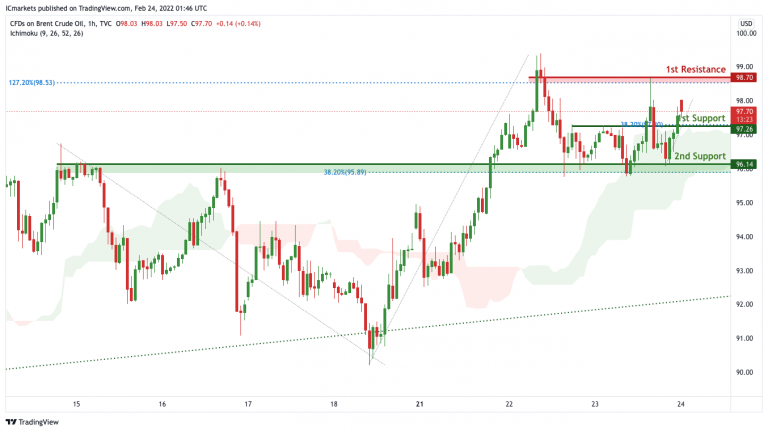
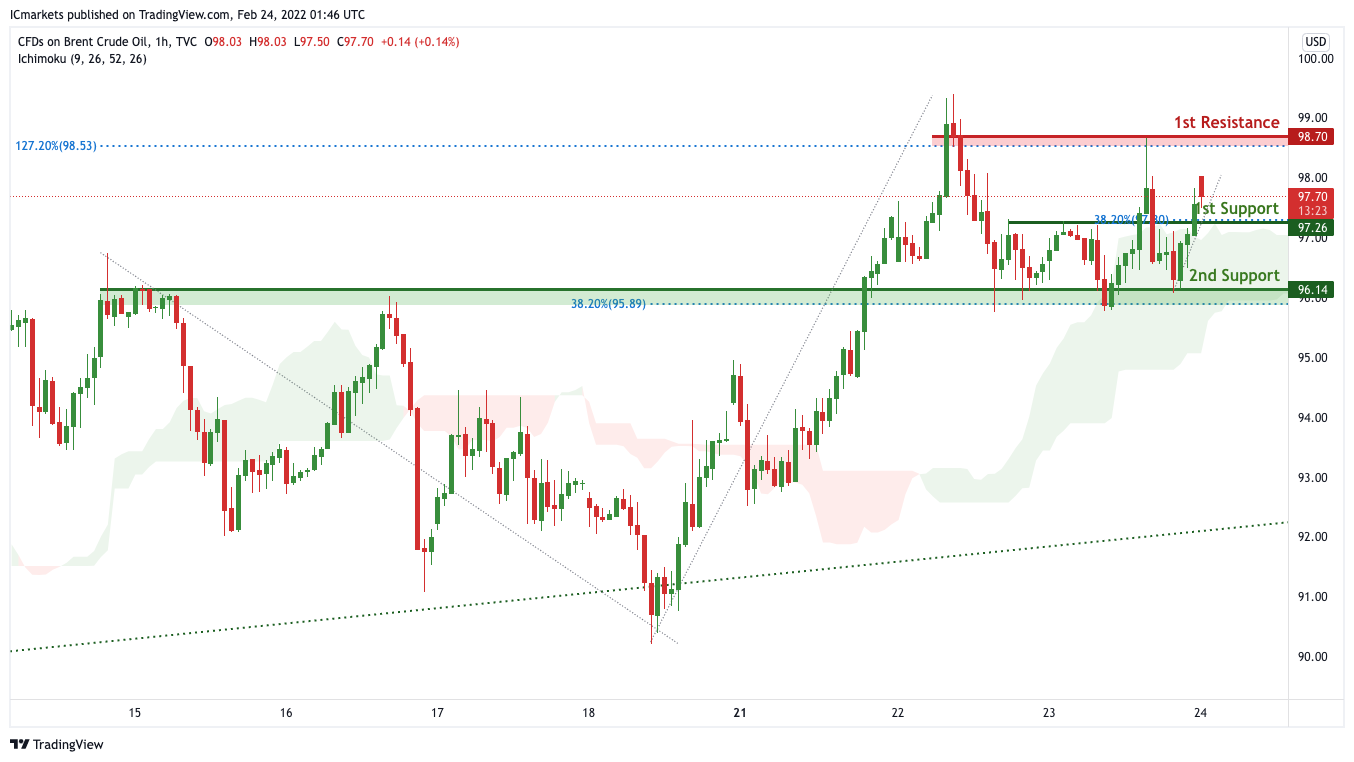
On the H4, with price moving above the ichimoku cloud, we can expect bullish continuation from our 1st support at 97.26 in line with 38.2% Fibonacci retracement towards our 1st resistance at 98.70 which is a strong resistance and in line with 127.2% Fibonacci extension. Alternatively, price may break 1st support structure and head for 2nd support, which coincides with the ascending trendline and 38.2% Fibonacci retracement at 96.14.
Areas of consideration:
- H4 time frame, 1st resistance of 98.70
- H4 time frame, 1st support of 97.26
Dow Jones Industrial Average:
On the H4 timeframe, We see the possibility of bearish continuation from our 1st resistance at 33267 in line with horizontal overlap resistance towards our 1st support at 32451 in line with the horizontal swing low support. Alternatively, price may break 1st resistance and head for 2nd resistance at 34355 in line with the 50% Fibonacci retracement level. Our bearish bias is further supported by how price is moving below the ichimoku cloud
Areas of consideration :
- H4 1st support at 34451
- H4 1st resistance at 33767
Bitcoin ready to break through 33k low to resume down trend
Bitcoin's steep decline today affirms that case that corrective rebound from 33000 has completed at 45842, after failing to sustain above 55 day EMA. The development also argues that down trend from 68986 is ready to resume. Further decline is now expected as long as 39252 resistance holds.
First target will be 33000 low. Decisive break there will confirm this bearish case. It's a bit early to say whether the downside momentum warrants a firm break of 30k handle. But, we'd tentatively put 61.8% projection of 68986 to 33000 from 45852 at 23602 as the next target. Let's see.
Gold resumes rally, targets 1946 next
Gold's rally resumed after brief consolidation and hits as high as 1931.07 so far. In any case, outlook will stay bullish as long as 1889.42 support holds. Next target is 100% projection of 1682.60 to 1877.05 from 1752.12 at 1946.57. Sustained break there, as well as the channel resistance, could prompt some strong upside acceleration ahead.
It should also be noted again that sustained break of 1916.30 should confirm that whole correction from 2074.84 (2020 high) has completed at 1682.60, after defending 38.2% retracement of 1046.27 to 2074.84. Further decisive break of 1946.57 would quickly shot Gold up to 161.8% projection at 2066.74, which is close to 2074.84 high.
BoJ Kuroda: No immediate plans to scale back stimulus
BoJ Governor Haruhiko Kuroda told the parliament, "unlike Western countries, we have no immediate plans to scale back our monetary stimulus." But the central bank will continue to look at inflation expectations. "We will look not just at price indicators, but also surveys showing how the public feels about price moves," he added.
On exchange rate, Kuroda said, "if the yen weakens further, that could push up import costs. But the recent rise in import costs is driven mostly by an increase in dollar-denominated raw material prices, rather than a weak yen."
"It's desirable for currency rates to move stably reflecting economic fundamentals. I think recent (yen) moves are in line with this trend," Kuroda added.
ECB Lane hints at earlier end to asset purchases
ECB Chief Economist Philip Lane said in an interview, "if inflation rates are moving towards our target in the medium term, which is now looking more likely – instead of being well below two per cent as before the pandemic – we will adjust monetary policy". That's because, "we would then, for example, no longer need to make asset purchases to stabilise inflation at our target over the medium term."
"It was different in December, when surveys still showed the expectation that we would need to maintain asset purchases until the middle of next year, but the timeline may be shorter than what people expected then," he added.
Lane also reiterated the "sequencing" of policy normalization. That is, "our net assets purchases will first be scaled down, then ended. Then, the key policy rates will only increase above their current levels if the conditions consistent with our medium-term inflation target are met. So before we talk about potential rate decisions, we need to end net asset purchases. And we need to prepare the market for the eventual end of these purchases.
NZD/USD Extend Rally, US GDP Report Next
Key Highlights
- NZD/USD gained bullish momentum above the 0.6750 resistance.
- A key bullish trend line is forming with support near 0.6740 on the 4-hours chart.
- EUR/USD is still well below 1.1400, and GBP/USD is stable above 1.3550.
- The US GDP could increase 7% in Q4 2021 (Preliminary).
NZD/USD Technical Analysis
The New Zealand Dollar started a major increase from 0.6600 against the US Dollar. NZD/USD gained bullish momentum and surpassed the 0.6700 resistance zone.
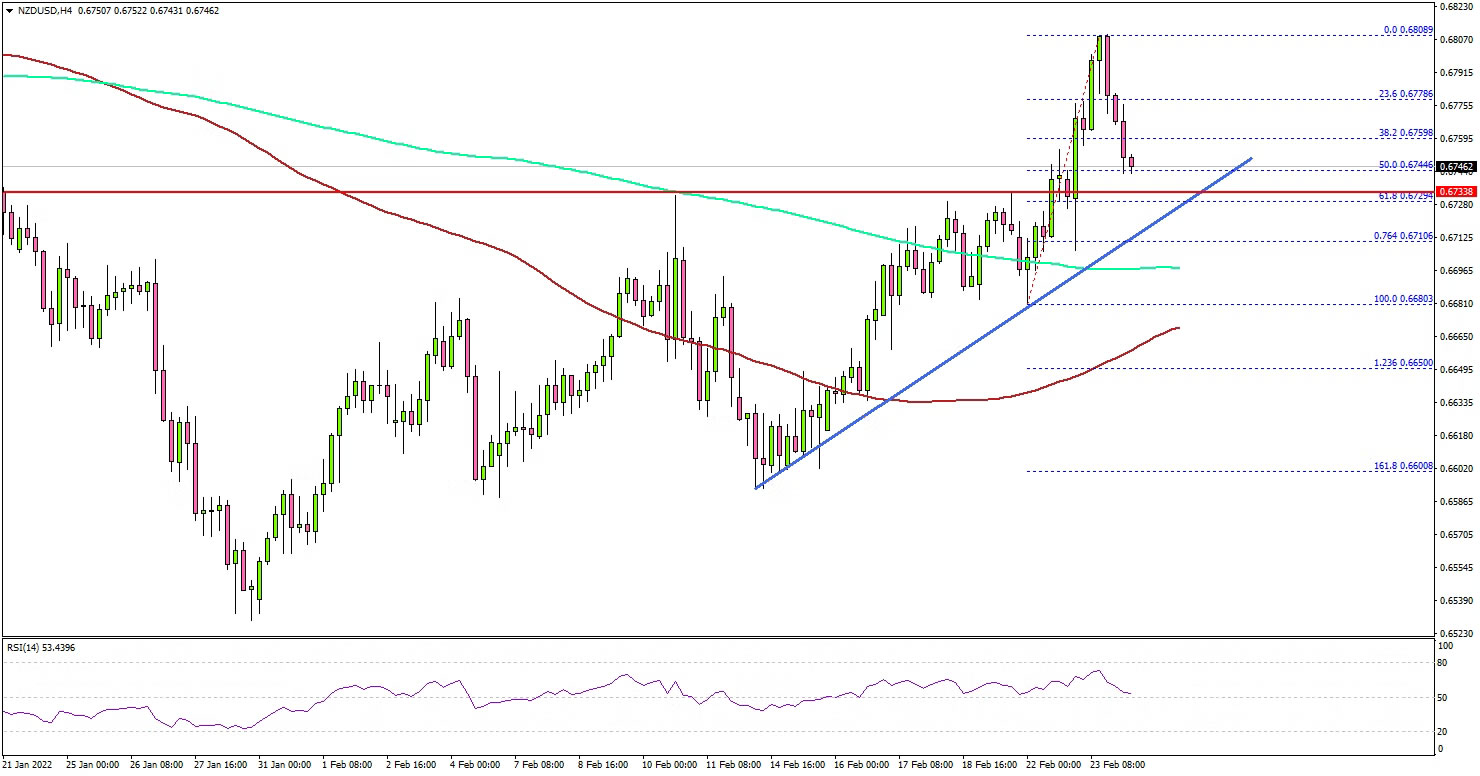
Looking at the 4-hours chart, the pair even broke the 0.6750 resistance level. Finally, the pair even cleared the 0.6800 level, and settled above the 100 simple moving average (red, 4-hours) and the 200 simple moving average (green, 4-hours).
It seems like the pair could rise further above 0.6820. The next major resistance is near the 0.6840 level. Any more gains might send the pair towards the 0.6900 level.
If there is a downside correction, the pair could decline below the 0.6750 level. The next key support is near 0.6740. There is also a key bullish trend line forming with support near 0.6740 on the same chart.
If there is a downside break, the pair could decline towards the 0.6650 level the 100 simple moving average (red, 4-hours). An intermediate support might be 0.6695 and the 200 simple moving average (green, 4-hours).
Looking at EUR/USD, the pair is still struggling to clear the 1.1400 resistance level. Similarly, GBP/USD must settle above 1.3640 to continue higher in the near term.
Economic Releases
- US Gross Domestic Product for Q4 2021 (Preliminary) – Forecast 7.0% versus previous 6.9%.
- US New Home Sales for Jan 2022 (MoM) – Forecast 5.5% versus 11.9% previous.
- US Initial Jobless Claims - Forecast 235K, versus 248K previous.