Sample Category Title
Silver Confronts 200-MA and Upper Bollinger Band
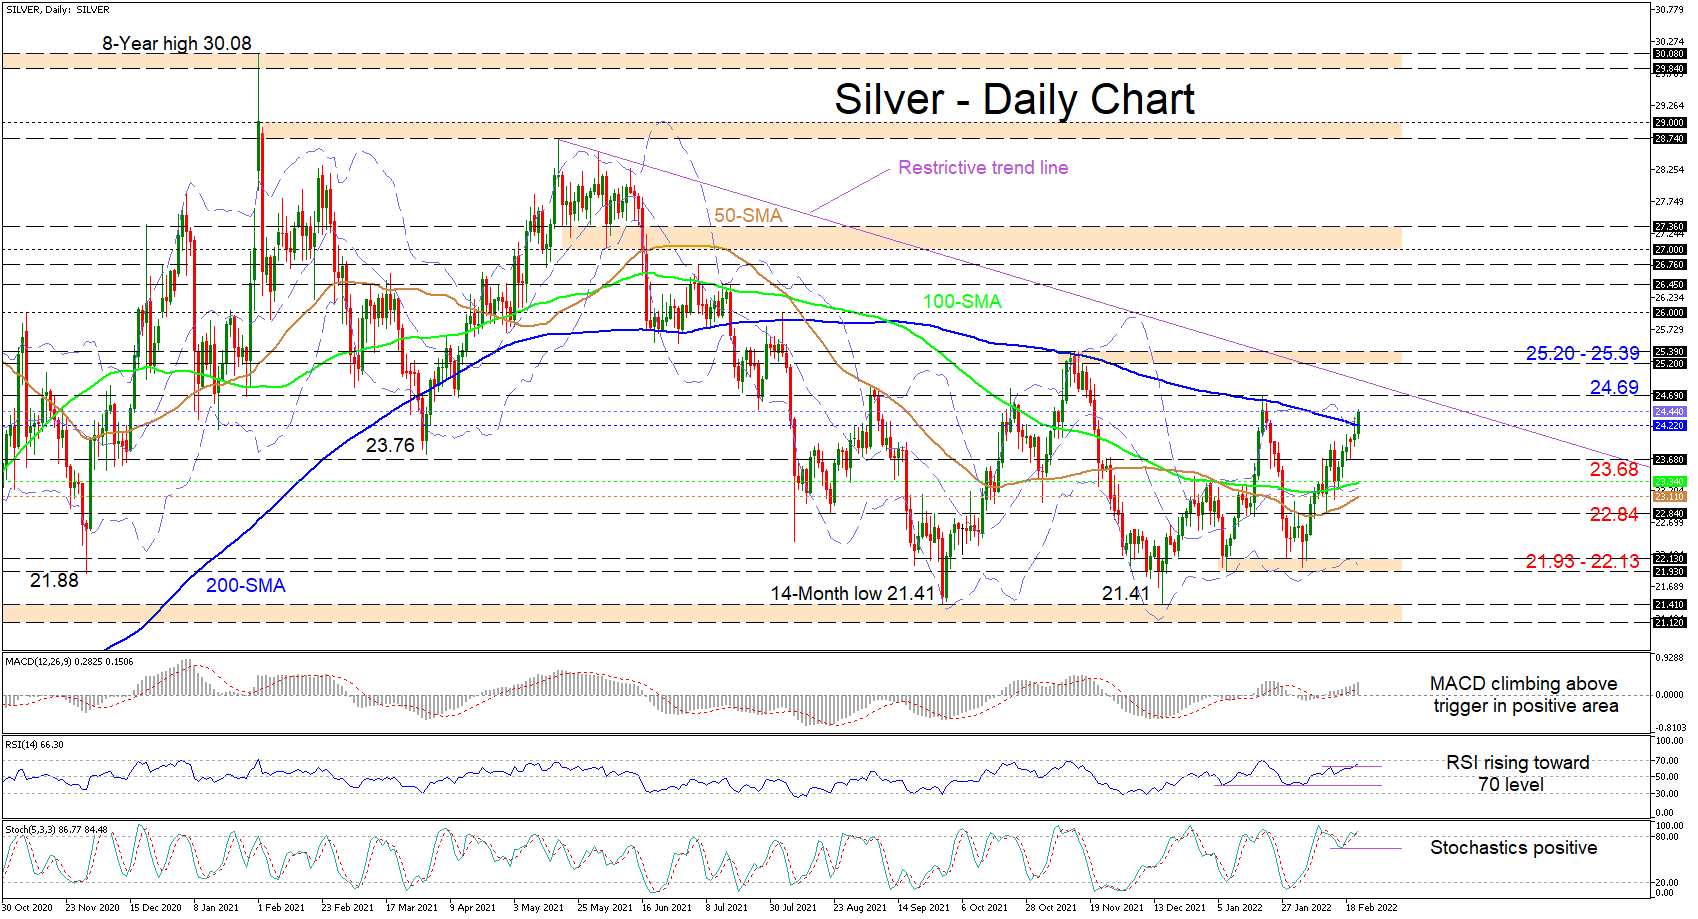
Silver is simultaneously overpowering the 200-day simple moving average (SMA) at 24.22 and the adjacent upper Bollinger band around 24.44 trying to reel in the overhead high of 24.69 and the 25.20-25.39 ceiling of the near five-month sideways market. The gliding 200-day SMA is endorsing a bearish tone but has failed to suppress growing upside impetus, while the upturn in the slopes of the 50- and 100-day SMAs, suggests the minor price rally from the 21.93-22.13 support section may be firming.
The short-term oscillators remain skewed to the upside. The MACD, in the positive region, is advancing above its red signal line, while the climbing RSI is nearing the 70 overbought level. Additionally, above the 80 mark, the stochastic %K line has regained its positive charge, implying bullish pressures are persisting.
If the price manages to close above the 200-day SMA and the upper Bollinger band, prompt resistance could transpire from the 24.69 neighbouring high. Successfully overstepping this, and overshooting the potential descending line pulled from the 28.74 high, may reinforce the odds of a possible bullish breakout of the 25.20-25.39 ceiling of a trading range that has imprisoned the commodity for nearly five-months.
However, if bullish forces dissolve and the price closes back below the 200-day SMA, downside friction could commence at the 23.68 low ahead of a fortified buffer zone between the 100- and 50-day SMA at 23.34 and 23.11 respectively. If selling interest intensifies further, a deeper retracement may ignore the 22.84 barrier and target the 21.93-22.13 tough support section, moulded by the January and February troughs, which also encapsulates the lower Bollinger band.
Summarizing, silver is exhibiting a strong bullish tone above the 200-day SMA and around the upper parts of a broader sideways market. That said, the neutral-to-bullish pressures of the commodity may linger should the price manage to hold north of the 23.68 low and the 100- and 50-day SMAs at 23.34 and 23.11. Moreover, the lower and upper boundaries of the broader trading range are 21.41 and 25.39.
Precious Metals Shine Brighter as Silver Breaks Out
Precious metals continue to shine amid heightened geopolitical risks concerning Ukraine, a struggling global stock market and soaring inflation. Inflation is also helping to keep real bond yields in the negative territory, making the non-interest-bearing gold and silver attractive on a relative basis for yield-seekers.
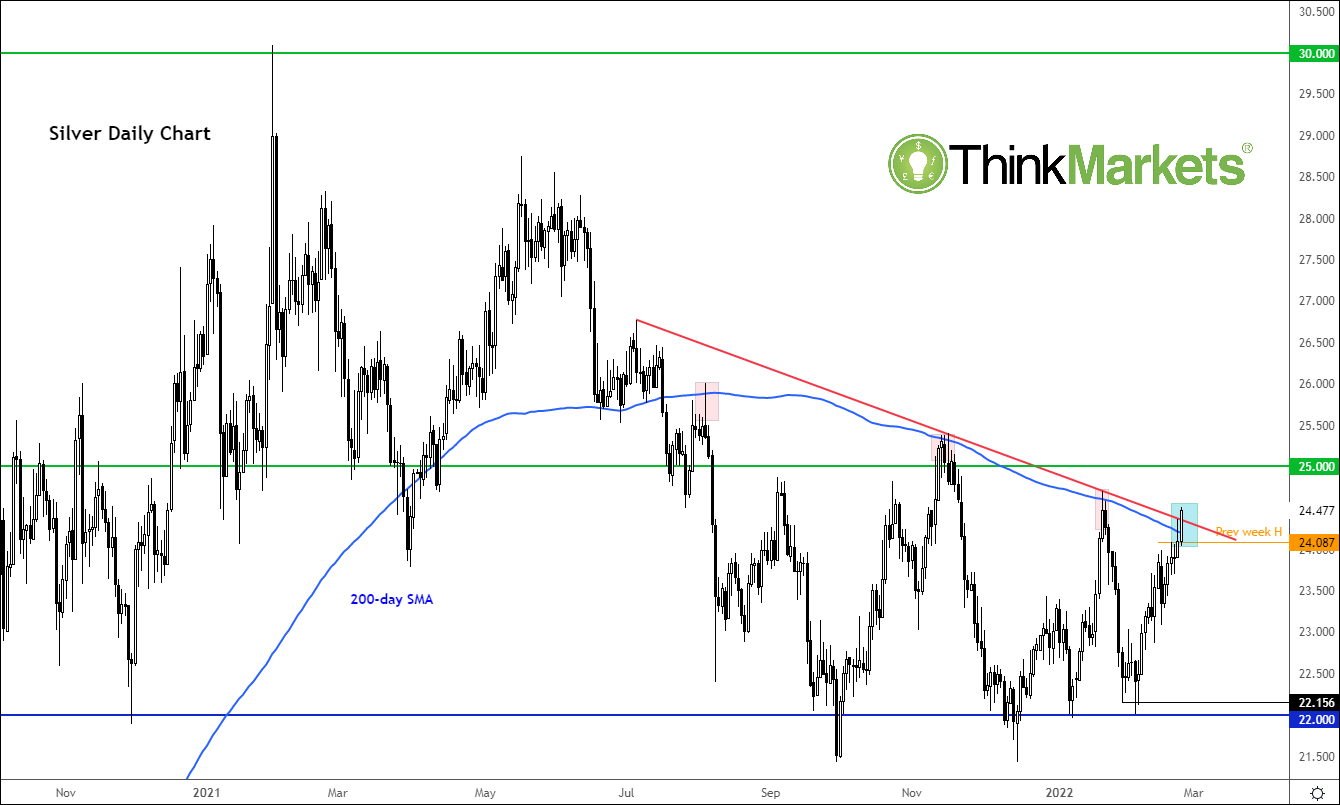
Gold had already been showing strength amid haven flows in recent days, extending its good run of form from the start of the month when inflation concerns intensified. Silver has also been rising along with gold, albeit a little stealthier as it didn’t break any major levels… until today:
Source: ThinkMarkets and TradingView.com
The “poor man's gold” had been unable to take out its 200-day moving average on several occasions in recent past. But today, it has made a more decisive move. A close above here would pave the way for a potential rally to $25.00 next. But there’s the potential for a much larger move, given the current macro backdrop.
GBP/USD: Ripe for a Breakout
GBP/USD, stuck within a tight range of 1.36412-1.34921 since 10 February, is ripe for a breakout. The 200-pip question is in what direction. A lot will depend on how the outlook on monetary policy on both sides of the Atlantic shifts in the coming months.
Technically, the odds looked stacked against a break to the upside. The downtrend in GBP/USD started in the summer of last year has yet to be invalidated. Furthermore, the pairs recent tight range points to a further continuation of the pervious trend.
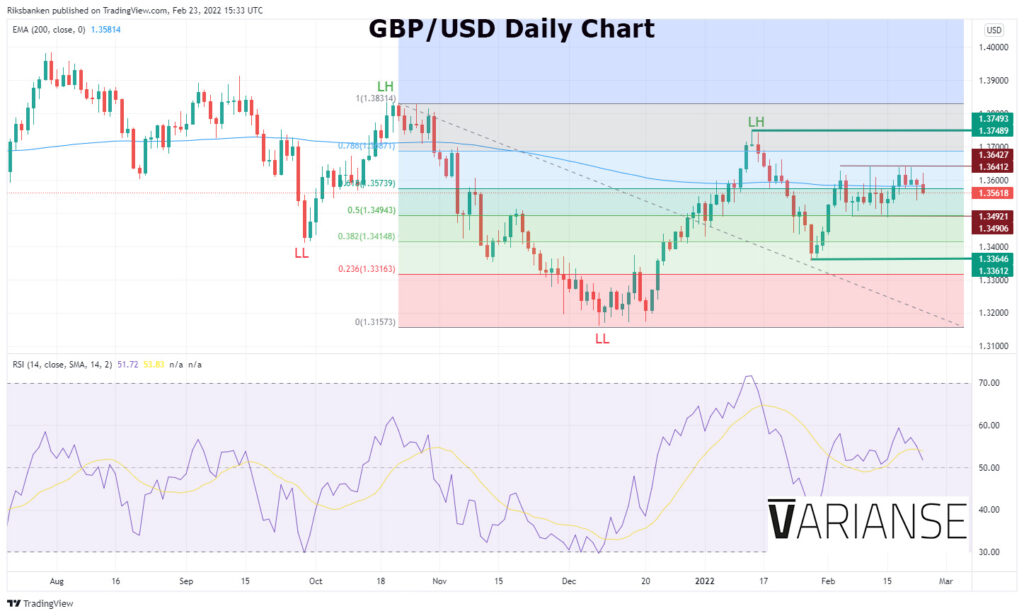
Still, price continues to tightly hug the 200-day exponential moving average and recent momentum has been biased to the upside. In other words, a break to the upside of its recent range certainly can’t be ruled out.
Meanwhile, the 78.6% Fibonacci retracement from the October swing high to the December swing low of 1.36872 could act as an impediment to further gains in the pair. In addition, 1.37493 is likely to act as a further ceiling on any future ascent. In terms of downside, 1.33646 may provide further support, before more substantial selling were to come on board.
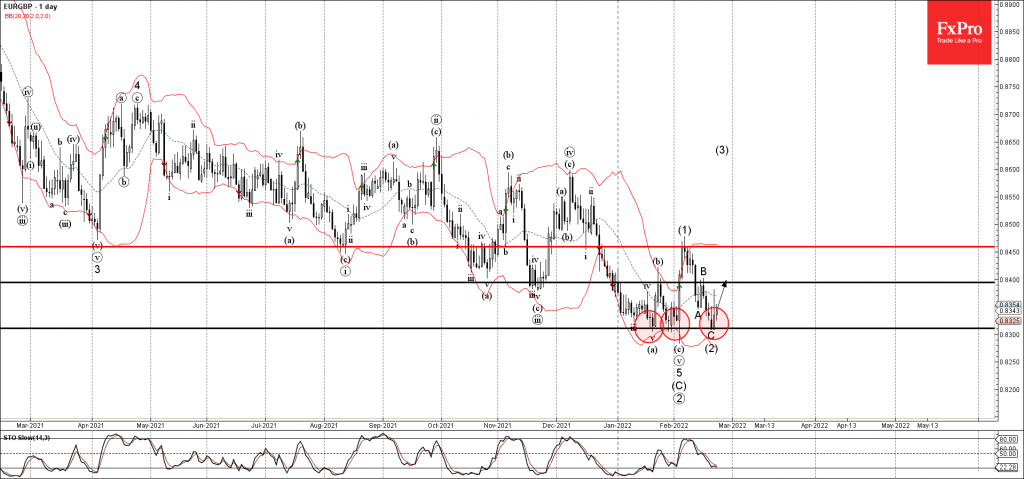
EURGBP Wave Analysis
- EURGBP reversed from support area
- Likely to rise to resistance level 0.8400
EURGBP currency pair recently reversed up from the support area located between the key support level 0.8310 (which has been reversing the pair from the start of January) and the lower daily Bollinger Band.
The upward reversal from this support area stopped the previous medium-term ABC correction (2).
Given the strength of the aforementioned support area – EURGBP currency pair can be expected to rise further toward the next resistance level 0.8400 (top of wave B).
Eco Data 2/24/22
[php_everywhere instance="1"]
Stock Markets Rebound But Uncertainty Remains
You get the feeling that investors are not quite sure what to do today. The markets managed to bounce back sharply from their lows on Tuesday and that momentum carried forward at the start of today’s session, before easing off their best levels again. There isn’t much in the way of economic data to provide any fresh impetus, meaning investors will probably keep focusing on those headlines coming out of Russia and Ukraine. But now that investors have had time to digest everything that has happened, including the not-too-stringent-sanctions, their focus might return to inflation once again. The latest upsurge in energy prices will further exacerbate inflationary pressures and potentially hurt consumer spending.
Investors are wary of the energy crunch in Europe and how this might impact consumer inflation and spending in the months ahead. There is a risk that gas prices might rise further in light of Germany’s decision to cancel the approval of the Nord Stream 2 pipeline. So, inflationary pressures might exacerbate in the near term and force the ECB to apply the brakes by tightening its policy faster. Meanwhile, the Federal Reserve is also set to tighten its monetary policy aggressively, starting with at least a 25 basis point hike in March.
Therefore, investors might be less willing to bid up stock prices too much, until something fundamentally changes.
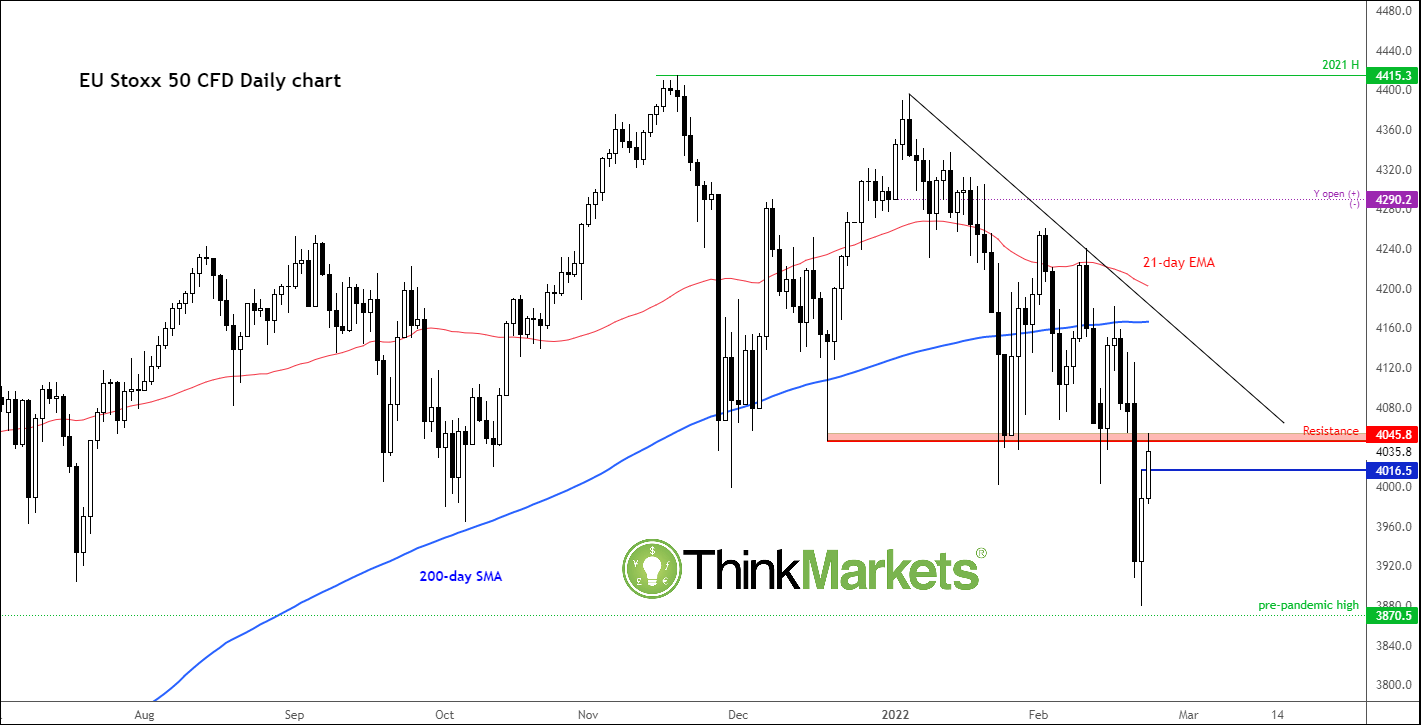
Meanwhile from a technical point of view, some of the global indices are testing key levels, including the German DAX, around 14830 to 15000. In this report, I wanted to highlight a very similar level on the Europe Stoxx 50 index:
Source: ThinkMarkets and TradingView.com
As per the chart, the area around 4045 had been a key support in the past. But now that we have broken below it, the sellers could step in here and trigger a fresh round of selling. If they don’t then that could be an early sign of bullish strength. Let’s see what happens here.
NZDUSD: Kiwi Bird Learns to Fly
The New Zealand dollar has been adding around 1% since the start of the day following the third key rate hike of 0.25 percentage points to 1.0% and comments from the RBNZ on the need for further policy tightening. Wednesday also saw the announcement of the start of a balance sheet reduction, including via active selling.
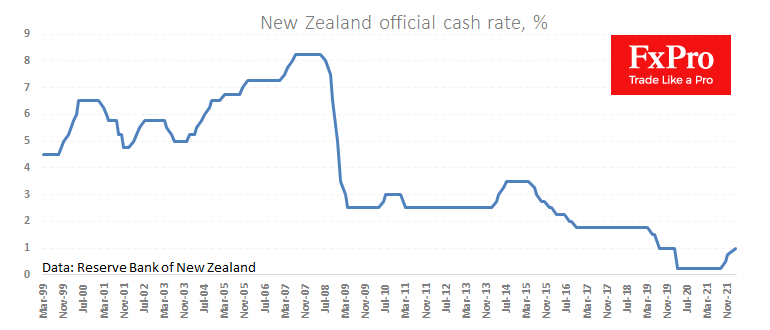
The central bank points to employment above the maximum sustained level and the overall economic performance above its potential, all with elevated inflation. The RBNZ also says further tightening is needed, pointing to upside risks to inflation.
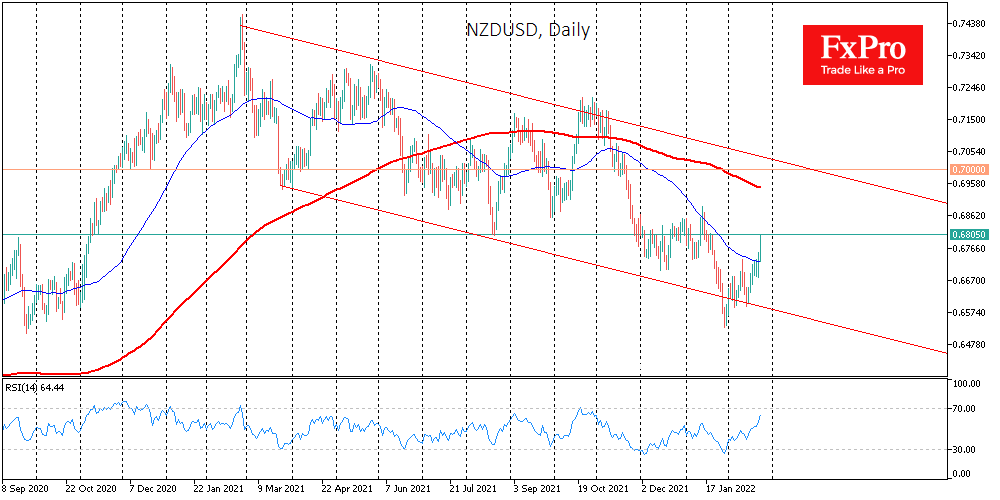
NZDUSD is testing 0.6800, as it did just over a month ago. The Kiwi came under pressure in the previous month due to a general risk bias in global markets. However, the paths of the NZDUSD and international markets diverged in February.
The steady demand of the New Zealand currency, which gained nearly 4% from the lows of late January, contrasts with the S&P500, which lost its rising momentum about a fortnight ago and is again near the lows of the year.
The main reason for that divergence is monetary policy – current and expected. The Reserve Bank of New Zealand has maintained the momentum of tightening for the third time in the last six months and promises further rises later in the year.
New Zealand has also found itself far removed from the worst geopolitical tensions in Europe of recent decades, continuing to benefit from record-breaking commodity prices.
In this environment, it would not be surprising to see the NZDUSD rise as far as 0.7000 by the end of next month, in a break from last year’s downward trend. Although, it would be too naive to expect an easy up ride for the Kiwi, as the US Fed is also signalling a very hawkish stance.
WTI Oil Outlook: Oil Prices Remain at the Back Food on Fading Supply Concerns but Biased Higher above $90
WTI oil consolidates on Wednesday following a 2.4% drop on Tuesday, after concerns about the disruption of oil supplies on the first wave of US and European sanctions on Russia eased.
Also, the signals of potential return of Iranian oil to the market limited gains, however, fears of further escalation of crisis over Ukraine, continue to underpin the oil prices.
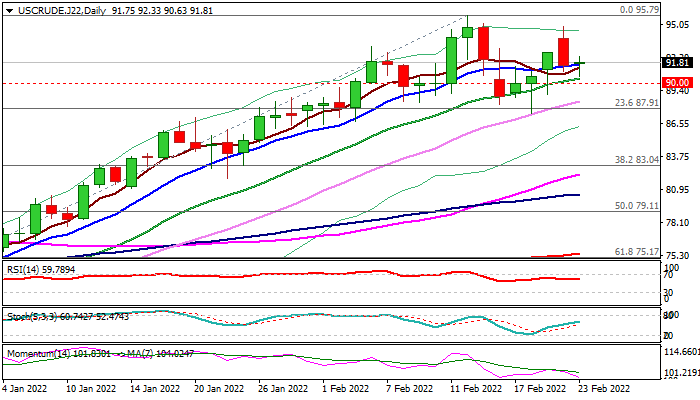
Near-term action remains above rising 10DMA for the third straight day and keep pivotal $90 support out of reach that keeps bias with bulls.
On the other side, fading bullish momentum on daily chart, suggests that the downside is still vulnerable, with easing of geopolitical tensions, or at least fading concerns about global supply, to keep oil prices under pressure.
Fresh near-term bears may gain momentum on loss of $90 support and risk test of next key level at $87.44 (Feb 18 higher low), break of which would generate initial reversal signal on completion of failure swing pattern on daily chart.
Otherwise, the price action is expected to stay within extended consolidation.
Res: 92.33; 93.14; 94.90; 95.79.
Sup: 90.43; 90.00; 89.04; 88.47.
Sunset Market Commentary
Markets
Bank of England officials, including Haskel, Broadbent, Tenreyro and governor Bailey, appeared before parliament today to brief MP’s on monetary policy. The overall tone was balanced and the key takeaway is that “moderate” rate rises are likely in coming months to bring inflation back to target. They pushed back against current hawkish market expectations (>5 rate hikes discounted for the remainder of the year) with Bailey telling markets “not to get carried away”. BoE hawk Ramsden delivered a similar message yesterday. Tenreyro earlier in the testimony warned for the economic risks from quick action on inflation. But she did mention that most inflation shocks are still persistent while Bailey’s biggest concern are second-round effects, referring to companies that are now striking higher wage deals. UK money markets barely reacted and stick to the projected rate path of 1.75% by the end of the year. They still expect policy rates to hit the 1% milestone in May. At that point, the BoE would start actively selling government bonds. This was outlined in the normalization blueprint in August last year. If anything, Bailey nuanced this a bit, saying the central bank “will consider” selling assets. The UK yield curve barely changed and sterling trades a tad weaker post-testimony. EUR/GBP ekes out a small gain from 0.833 to 0.834. GBP/USD continues to hover around the 1.36 pivot.
Trading on other markets was mainly sentiment-driven. Dust settled somewhat after Russia’s Putin recognizing two self-proclaimed separatist republics in eastern Ukraine on Tuesday prompted a series of sanctions by the west. European stocks gain more than 1.2% in a buy-the-rumour, sell-the-fact market reaction. Wall Street opens with gains ranging 0.5-1%. The S&P inches 0.7% higher after it entered correction territory yesterday. Core bonds remain under selling pressure. The US curve flattens with yields 3.3 bps (30y) to 4.9 bps (2y) higher. German yields rise 5.6 bps at the front end and trade 1.8 bps higher in the 10y tenor. European swap yields take it up a notch with the 10y yield (0.857%) closing in on the previous recovery highs (0.874%) again after the 10 bps setback last week. The kiwi dollar on FX markets is the star performer. The currency profits from the RBNZ this morning hiking rates, lifting the rate path and preparing for quantitative tightening. EUR/NZD (1.667) loses support at 1.68 while NZD/USD tests important resistance at 0.68. Other commodity currencies (CAD, NOK and AUD) have a good run as well today. The euro is trading heavy but the dollar is a little worse off. EUR/USD rises marginally from 1.132 to 1.134. The trade-weighted greenback (DXY) eases to 95.93.
News Headlines
Czech National Bank governor Rusnok said in an interview on public radio that developments in Ukraine mean that price growth may ease at a slower pace than outlined in the latest projections. He didn’t rule out the possibility of a further policy rate rise – also following a higher January CPI release (9.9% Y/Y) – to combat this inflation risk, but added that any such move would certainly not a steep one. During this tightening cycle, the CNB already used 75 bps (twice), 100 bps and 125 bps rate hikes to lift the policy rate to 4.5% currently. The Czech money market expects the policy rate to peak at 5% this year. Apart from the upside inflationary risk, the crisis in Ukraine also represents a downside economic risk to the Czech Republic. The Czech koruna trades a little bit stronger in today’s positive risk environment at EUR/CZK 24.50. The CZK swap curve bear flattens with yields rising by 7 bps (30-yr) to 10.7 bps (2-yr).
The German GfK Institute’s measure for consumer sentiment unexpectedly fell in March from -6.7 to -8.1, the softest reading since May last year. Details showed a setback in both income expectations and the willingness to buy, while general business cycle expectations increased slightly. The rise in Covid-infection rates at the time of the survey and high inflation were the main worries. The outlook for the comings months is quite positive given the lifting of Covid-restrictions and hope of a more moderate price inflation.
EUR/USD Mid-Day Outlook
Daily Pivots: (S1) 1.1287; (P) 1.1327; (R1) 1.1366; More...
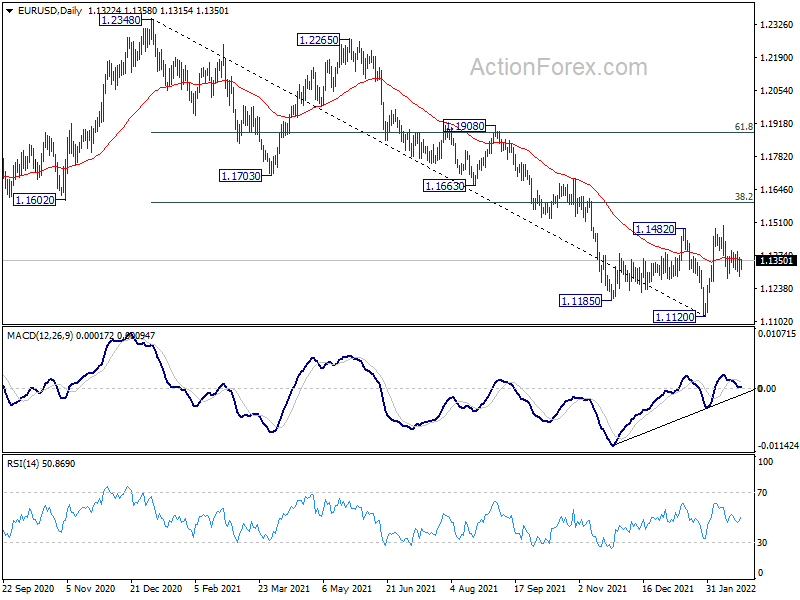
Outlook in EUR/USD is unchanged and intraday bias remains neutral first. On the upside, firm break of 1.1482 will target 38.2% retracement of 1.2348 to 1.1120 at 1.1589 next. Sustained break there will argue that whole fall from 1.2348 has completed too and target 61.8% retracement at 1.1879. On the downside, however, break of 1.1265 support will dampen this bullish view and bring retest of 1.1120 low instead.
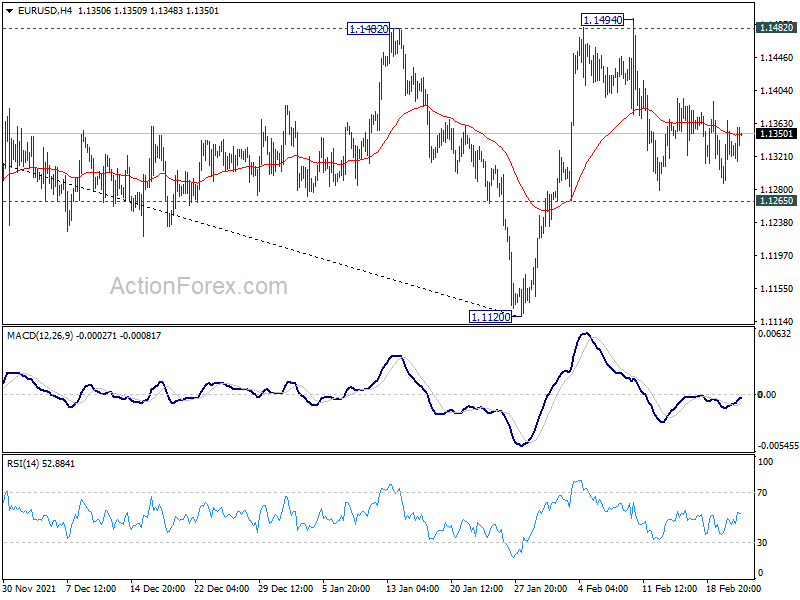
In the bigger picture, the decline from 1.2348 (2021 high) is seen as a leg inside the range pattern from 1.2555 (2018 high). Sustained trading above 55 week EMA (now at 1.1593) will argue that it has completed and stronger rise would be seen back towards top of the range between 1.2348 and 1.2555. However, firm break of 1.0635 (2020 low) will raise the chance of long term down trend resumption and target a retest on 1.0339 (2017 low) next.