Sample Category Title
EUR/USD Eyes Next Break, 1.1400 Presents Resistance
Key Highlights
- EUR/USD is consolidating above the 1.1300 level.
- A key contracting triangle is forming with resistance near 1.1365 on the 4-hours chart.
- GBP/USD is eyeing more upsides above 1.3620 and 1.3640.
- Gold price extended rally and tested the $1,900 zone.
EUR/USD Technical Analysis
The Euro started a downside correction from the 1.1500 resistance against the US Dollar. EUR/USD corrected lower below the 1.1420 support, but stayed above 1.1300.
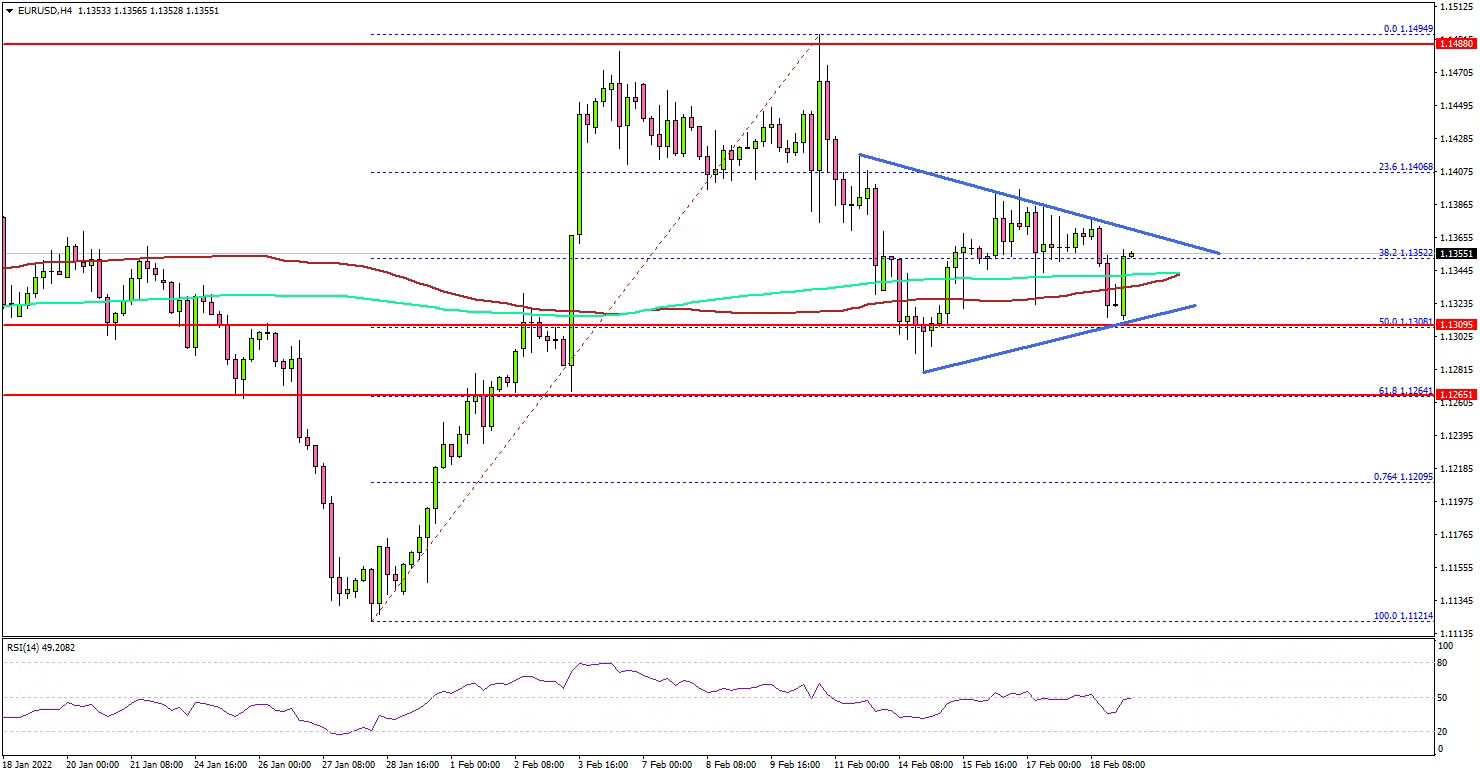
Looking at the 4-hours chart, the pair formed a top near 1.1494 and corrected lower. There was a move below the 1.1400 and 1.1350 support levels. The pair declined below the 38.2% Fib retracement level of the upward move from the 1.1121 swing low to 1.1494 high.
The pair even moved below the 100 simple moving average (red, 4-hours) and the 200 simple moving average (green, 4-hours). However, the bulls appeared near the 1.1300 support zone.
The pair also remained stable above the 50% Fib retracement level of the upward move from the 1.1121 swing low to 1.1494 high. It is now consolidating above the 1.1300 level and seems to be preparing for the next move.
There is a key contracting triangle forming with resistance near 1.1365 on the same chart. The next major resistance is near the 1.1400 level. A close above 1.1400 could open the doors for a strong increase.
If not, EUR/USD might break the triangle support at 1.1320 and extend decline. The next key support is near 1.1300. Any more losses might send the pair towards 1.1200.
Looking at GBP/USD, the pair was able to clear the 1.3600 resistance zone and now aims more upsides above the 1.3640 level.
Economic Releases
- Germany’s Manufacturing PMI for Feb 2022 (Preliminary) - Forecast 59.4, versus 59.8 previous.
- Germany’s Services PMI for Feb 2022 (Preliminary) - Forecast 53.0, versus 52.2 previous.
- Euro Zone Manufacturing PMI for Feb 2022 (Preliminary) – Forecast 58.7, versus 58.7 previous.
- Euro Zone Services PMI for Feb 2022 (Preliminary) – Forecast 51.7, versus 51.1 previous.
- UK Manufacturing PMI for Feb 2022 (Preliminary) – Forecast 57.5, versus 57.3 previous.
- UK Services PMI for Feb 2022 (Preliminary) – Forecast 55.2, versus 54.1 previous.
Threat of War and High Inflation Support Gold
After 1 year of muted and sideways movement, Gold looks to show some strength recently. Gold futures settled at $1900 an ounce for the first time since June last year. A threat of potential war between Russia and Ukraine might contribute to the recent strength. However, the main driver for the precious metal remains to be persistently high inflation. The Fed is widely expected to start raising the benchmark rate in the next March meeting to contain inflation. This should be the first among several benchmark rate raise this year.
Daily Chart of Gold (XAUUSD)
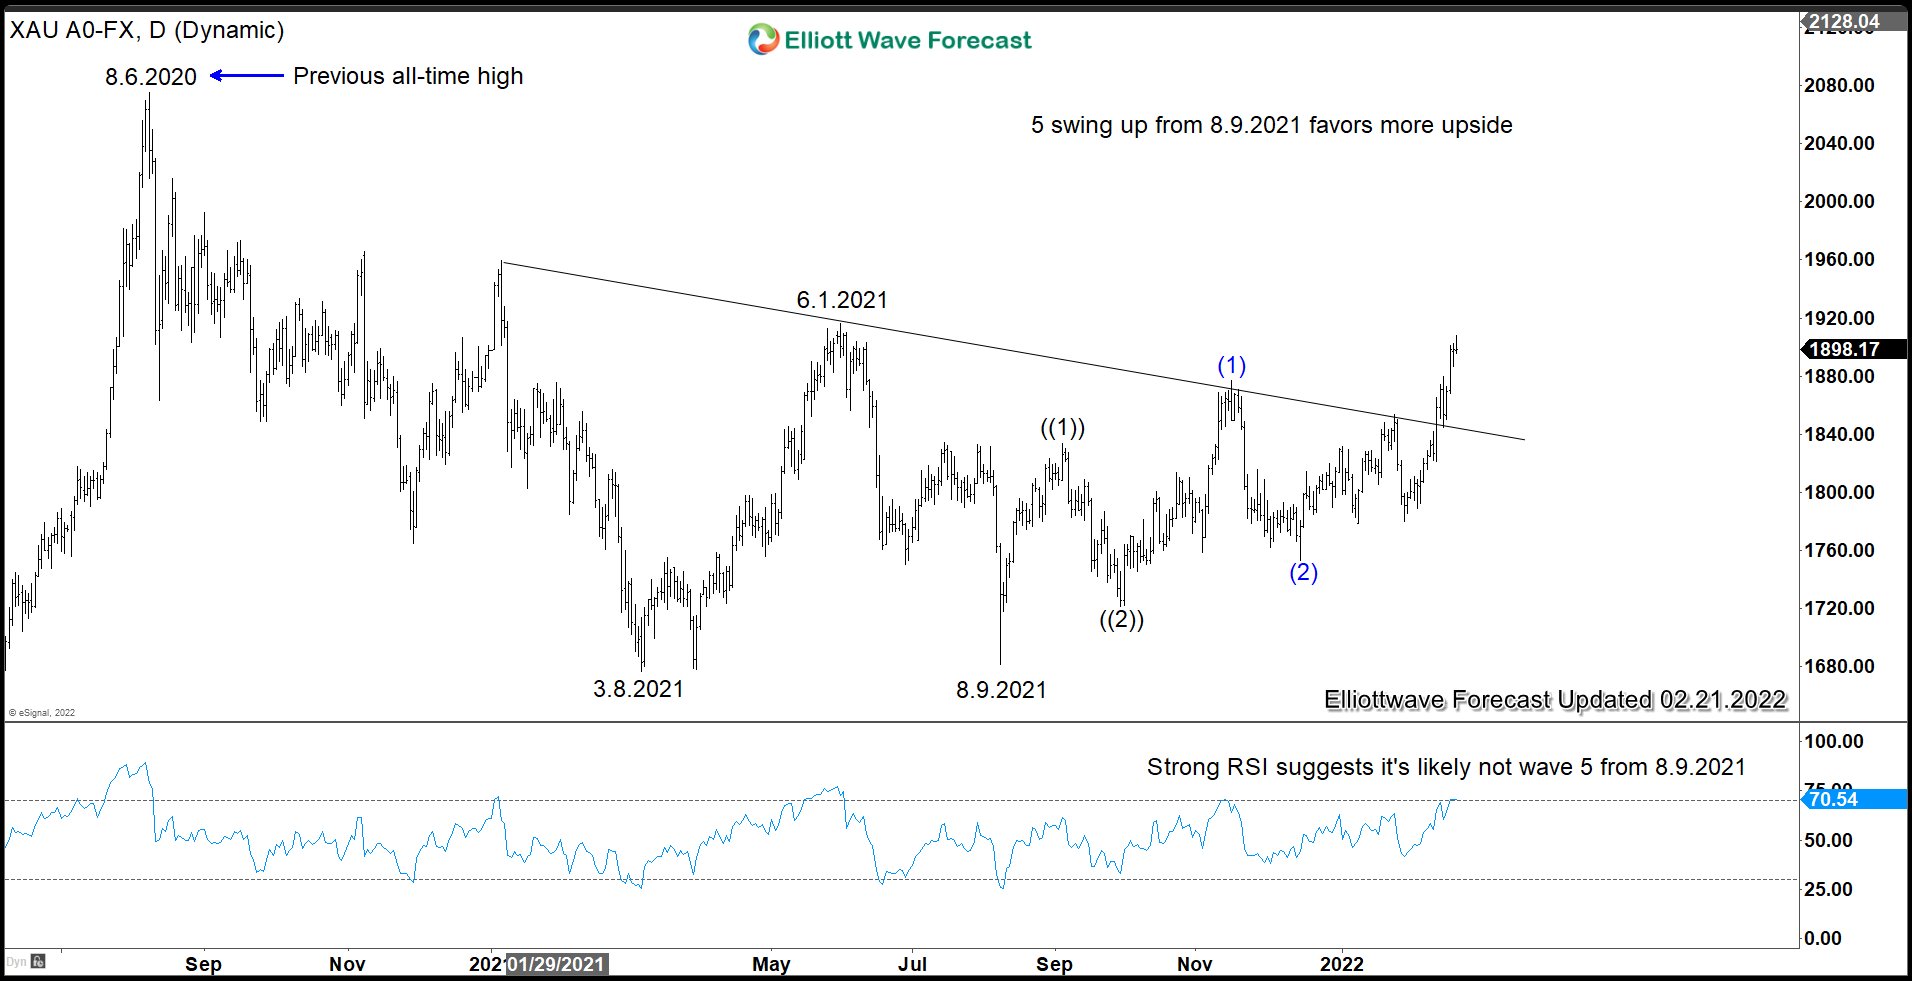
Daily Chart of Gold (XAUUSD) above shows a clear 5 swing from 8.9.2021 low. A 5 swing is an incomplete sequence, suggesting further upside to come. A break above 6.1.2021 high (1916.5) should further creates a higher high sequence from 3.8.2021 low favoring further upside. Momentum, as measured by RSI, also shows strength suggesting the previous metal is not likely within wave ((5)) from 8.9.2021 low. Wave ((5)) usually shows the lack of momentum (momentum divergence). We can conclude therefore that the move higher from 8.9.2021 low can be nesting ((1))-((2))-(1)-(2). This suggests pullback should continue to find support in 3, 7, or 11 swing against wave (2) low at 1753.10.
Gold in Yen (XAUJPY) Breaking to New All-Time High
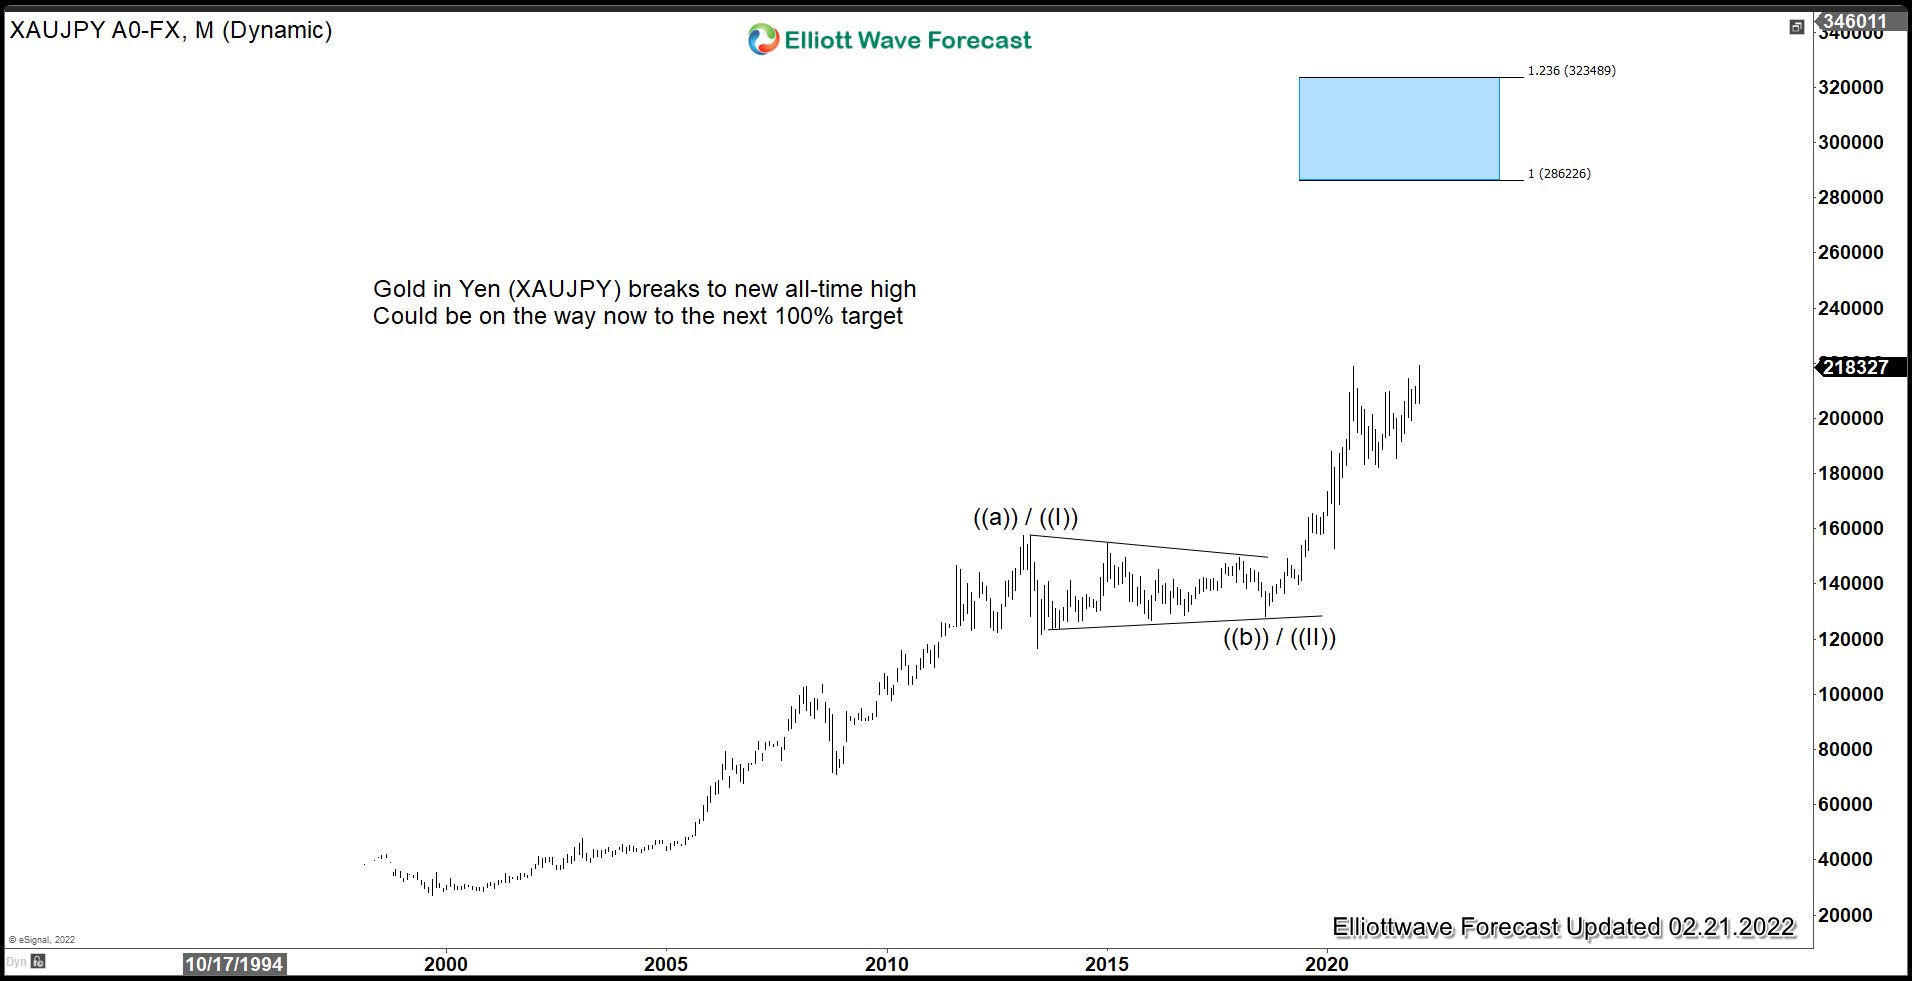
Gold in Yen terms (XAUJPY) broke to new all-time high last week. This is the first currency from G7 which has done so and most likely lead the other fiat currencies. As we can see from the monthly chart above, breaks to new high suggests the correction is over and it is ready to start a new bullish cycle higher. The potential target higher is the 100% extension area which comes at 286226 – 323489.
Eco Data 2/21/22
[php_everywhere instance="1"]
Forex Forecast and Cryptocurrencies Forecast
EUR/USD: Waiting for War and Rate Hike
The period from February 10 to 14 was unexpectedly stormy. Panic moods were diligently warmed up by the leading media, actively discussing the statements of world leaders, primarily the President of the United States, regarding a possible Russian invasion of Ukraine. The White House even decided to relocate its diplomatic mission from Kiev, the capital of Ukraine, to Lviv, away from the zone of possible military operations and closer to the EU borders.
All this happened against the background of the US Federal Reserve's decision to convene an emergency meeting of the FOMC (Federal Open Market Committee). Rumors immediately spread that the refinancing rate would be increased by 50 basis points (bp) right now.
As a result, investors began to panic to get rid of risky assets, and the stock indices S&P500, Dow Jones and Nasdaq flew down.
The EUR/USD went down as well. The markets feared that the "hot" phase of the Russian-Ukrainian conflict would lead to further growth in energy prices and slow down the recovery of the European economy. According to JP Morgan strategists, if the price of oil rises to $150 per barrel, the global consumer price index (CPI) could soar to 7.0%. And according to Capital Economics, inflation in advanced economies could rise to 4.5%.
As a result, having started on February 10 at 1.1494, the war-terrified EUR/USD pair ended up at 1.1279 on February 14. That is, the euro returned to where it started north during Christine Lagarde's hawkish press conference, which she gave after the last meeting of the European Central Bank.
The results of the emergency FOMC meeting left many experts bewildered. There was no increase in interest rates. Perhaps the members of the Committee did not want to provoke further mass sales of shares and decided to wait for the outcome of the conflict between Russia and Ukraine. Moreover, there are signs of its peaceful resolution.
Investors began to calm down little by little. However, it was not possible to avoid a new wave of sales in the stock markets. And it followed on February 17 after another "apocalyptic" speech by US President Joe Biden.
Unlike equities, EUR/USD managed to stay neutral and ended the five-day trading session at 1.1324, within the 1.1260-1.1400 range it traded throughout December and the first ten days of January.
The European currency was kept from further falling, among other things, by multidirectional macroeconomic statistics from the USA. Thus, the number of initial applications for unemployment benefits there amounted to 248K, that is, it increased by 23K instead of the expected fall by 5K. But repeated requests, instead of decreasing by 2K, fell immediately by 26 K.
The dynamics of the EUR/USD pair in the coming days will certainly be influenced by how far the conflict between Russia and Ukraine will go, as well as how deeply European countries and the United States will be involved into it and what the rhetoric of their leaders will be. If there is no war, the topic of the energy crisis in Europe will fade into the background, which will support the European currency.
Support for the dollar is now largely dependent on the Fed. Yes, there are disagreements among FOMC members. But they are not about whether or not to tighten monetary policy, but how quickly to do it and to what extent. The hawkish statements of some members of the Committee give rise to forecasts of 6 or even 7 acts of monetary restriction in 2022. However, a number of leaders of the Federal Reserve Banks believe that it is necessary to act slowly and more carefully, since too aggressive steps could hit the US economy.
At the time of writing, the trend indicators on D1 are 90% red and only 10% green. Among the oscillators, 20% are green, 50% are red, and 30% are neutral.
Experts' forecast for the next week also looks very uncertain: 40% do not exclude the growth of the pair, 50% adhere to the opposite point of view, and 10% remain neutral. However, 65% of analysts support the strengthening of the dollar in a forecast for March.
Resistances are located at levels 1.1385-1.1400, 1.1480, 1.1525, 1.1570 and 1.1615. Support levels are 1.1300, 1.1275, 1.1220. This is followed by 1.1185 and the Jan 28 low at 1.1120.
As for the economic calendar for the coming week, we can note the release of data on business activity (Markit) in Germany and the Eurozone on Monday, February 21. Preliminary annual data on US GDP will become known on Thursday, February 24, and US statistics on orders for capital goods and durable goods will arrive at the end of the week, on Friday.
GBP/USD: Consolidation of the Pair, Consolidation of Experts
The macro data released last week supported the British currency. This applies to both the labor market and the consumer market. The unemployment rate in the United Kingdom remained unchanged at 4.1%, which was exactly in line with the forecast. At the same time, the number of applications for unemployment benefits decreased from 51.6K to 31.9K in January. Retail sales added 1.9% after a 4.0% dip in December and are above the long-term trend level. All this is a positive signal about the recovery of the country's economy.
Looking back a few years, we can see that the 2007-2008 financial crisis was followed by an eight-year period during which retail sales remained below the trend line. This was one of the reasons that prevented the Bank of England from raising rates. But now both inflation indicators and the state of the labor market can give it a free hand in tightening monetary policy. Moreover, the British regulator is still in the lead, raising interest rates faster than its counterparts on the other side of the Atlantic do.
However, this superiority is very shaky. The growth in sales may not be due to an improvement in the economic situation, but due to pent-up demand for goods and services, access to which was limited due to quarantine measures during the COVID-19 pandemic. So, the upcoming steps of the British regulator are likely to be very balanced. So as not to repeat the mistakes of the ECB, which rushed to raise the rate in May 2009, undermining the economic recovery.
In support of the forecast, it is enough to recall that only 4 out of 9 members of the BoE committee voted for a 50 bps rate increase at the last meeting. The majority, including the head of the bank, Andrew Bailey, decided to raise the rate by only 25 basis points, citing a slowdown in economic growth.
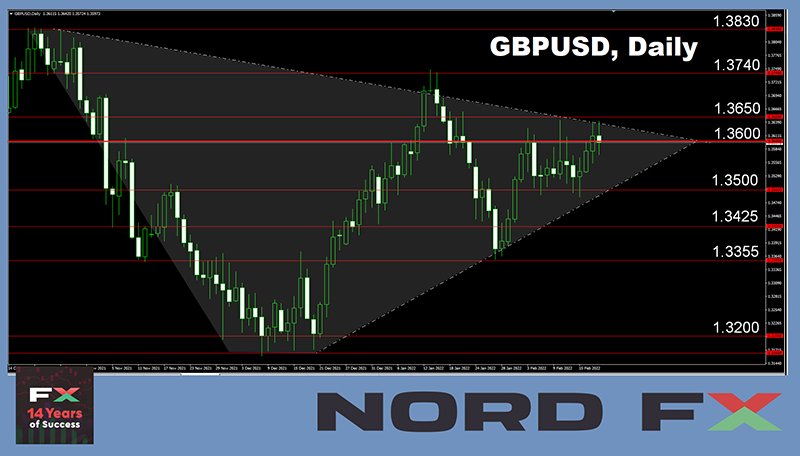
Economic indicators allow the pound to successfully repel the attacks of the US currency at the moment, and we can see the GBP/USD pair consolidating around 1.3600. We can say that experts' forecasts for the coming week are also consolidating: 25% of them vote for a sideways trend. 40% vote for moving north and 35% for moving south. (When moving to a monthly forecast, the number of bear supporters increases to 70%).
The overwhelming majority of indicators are aimed upwards D1. Among the oscillators, there are 70% of those. 20% have taken a neutral position, the remaining 10% side with the dollar. Among trend indicators, 90% are for the growth of the pair, 10% are for its fall.
Supports are located at 1.3570, 1.3500, 1.3425, 1.3355, the next strong support is 100 points lower. Resistance levels are 1.3600, 1.3650, 1.3700-1.3740, 1.3830 and 1.3900.
Of the events of the coming week, data on business activity in the services sector (Markit), which will be published on Monday, February 21, as well as the hearing of the UK Inflation Report on Wednesday, February 23, are of interest.
USD/JPY: Investors at a Crossroads
The USD/JPY was trading in a fairly narrow range throughout the past week, less than 110 pips (114.78-115.86). As already mentioned, investors are now most concerned about two issues: the expected Russian invasion of Ukraine and the increase in the refinancing rate by the US Central Bank. And, apparently, they have not yet decided what to do with such a safe-haven currency as the yen at this stage.
On the one hand, the increase in USD rates should push the pair up, strengthening the position of the US currency.
On the other hand, the escalation of the conflict in Ukraine may remind the markets of economic crises and a spike in inflation. In this case, one can expect a complete loss of risk appetite among investors and an influx of their capital into such a safe haven as the Japanese currency. Actually, this is happening now, although not on a very large scale: it is enough to compare the charts of stock indices and USD/JPY. This relationship is even clearer when compared to the EUR/JPY chart, since, unlike the US, the Eurozone is located in close proximity to the potential war zone.
Analysts' forecasts for the coming week are as follows: 25% of them are in favor of a sideways trend, 50% are in favor of the pair's growth and 25% are in favor of its fall.
Among the oscillators on D1, 30% are neutral gray, 10% are green, 60% are red (with a quarter of them in the oversold zone). Trend indicators have a 50-50 draw. The nearest resistance zone is 115.30, then 115.70. The main goal of the bulls is to renew the high of 116.34 and rise to where the pair has not been seen since January 2017. Support levels are at 115.00, 114.80, 114.15, 113.75, 113.45, 113.20, 112.55 and 112.70.
No significant economic events are expected in Japan next week.
CRYPTOCURRENCIES: Crypto Market Black Friday
BTC/USD is back where it was a month ago. The chart of the last two weeks resembled the chart of mid-January. The front line then lay at the $42,000 level, along which the bulls and bears fought with varying degrees of success. Last time, they ended with the pair falling to $32.945, and, according to a number of analysts, a similar outcome is possible this time as well. It depends not so much on the sales caused by a possible Russian invasion of Ukraine, but on the US Federal Reserve. Tightening monetary policy and rising interest rates could hurt all risky assets, including cryptocurrencies.
Bitcoin has acted as an inflation protector throughout the pandemic. This was one of the main drivers of its growth. But if inflation returns to normal, who needs such a protector?
There is no doubt that the US Central bank will try to curb inflation, which has already reached a 40-year high. But how successful its efforts will be is a question to which different experts give different answers. Bitcoin supporters continue to convince everyone (and themselves in the first place) that we are ahead of an endless rise in prices and serious financial turmoil.
According to Parallax Digital CEO Robert Breedlove, the same thing could happen to the dollar as to the currency of Venezuela. The US currency will hyperinflate by 2035, at which point the price of BTC in dollar terms will become astronomical: 1, 5, or 10 million USD per coin.
The legendary investor, founder of Miller Value Partners, Bill Miller almost half of whose fortune is now made up of cryptocurrency, also stood up to the defense of bitcoin. "It's like an insurance policy. You don't want your house to burn down, and you don't want to get into a terrible accident, but you pay for insurance every year in case it happens," explained the billionaire.
Tom Lee, co-founder of the analytical firm Fundstrat, called $200,000 a target mark for bitcoin in an interview with CNBC and explained who will facilitate its achievement. And these are not institutional investors at all, but small investors. According to the analyst, the total net worth of US households exceeds $141 trillion. People will look for ways to protect them over the next decade in order not to lose their savings due to inflation, . Therefore, Lee says, the inflow of capital into cryptocurrency can be "huge".
The high price of this asset is an obstacle to the mass adoption of bitcoin, in his opinion. Therefore, Tom Lee has supported the idea of switching to Satoshi, a millionth of BTC.
Jurrien Timmer, Director of Global Macroeconomics at Fidelity Investments, one of the largest asset management companies, is also optimistic. He is confident that the value of the first cryptocurrency will repeat the growth of Apple's market value. "I compared the network effect of bitcoin to the network effect of Apple computers. As Apple's earnings increase, its share price rises exponentially. I have reason to believe that bitcoin is following the same path. The price of this cryptocurrency will only increase as demand increases." And according to Trimmer, it will reach $100,000 by 2023.
This expert believes that BTC benefits from its strong difference from all other crypto assets. "Perhaps other digital currencies will look more profitable against the background of bitcoin because of the better scalability, but at the same time they are likely to be less decentralized. For me, bitcoin is like gold, and other cryptocurrencies are more like venture capital."
Analyst Willy Woo believes that the future of the US dollar in terms of inflation has not yet been determined. Bitcoin's capitalization is currently below $1 trillion, and breaking this mark will give the coin more resilience, and it will grow over the next five years. Further growth to the gold capitalization of almost $11 trillion will be relatively smooth, after which it will slow down. As for the final figure, Willy Woo believes that the capitalization of bitcoin could eventually grow to $40 trillion.
As for the immediate prospects, according to analyst Nicholas Merten, bitcoin is now giving signals of future growth and "its capitalization could reach $4 trillion potentially in October-December 2022." That is, the asset will show a 220% increase in relation to the previous record high. The previous rally was 392% up and it was 359% up earlier.
"This is a really great signal," says Merten. "The past resistance level is becoming an upward support. Investors are ready to pay more and more, which indicates the market is ready to return to the formation of another uptrend."
The fact that BTC/USD was above the 50-day moving average for 10 days really looked like a trend reversal. A breakdown of the 200-day MA at $48,000 could be the next confirmation. Investors were also encouraged by the growth of the Crypto Fear & Greed Index. If at the same BTC price, it was in the zone of Extreme Fear at the level of 20 points a month ago, it reached 52 points on Thursday, February 17.
However, another wave of active sales on Black Friday, February 18 brought another portion of doubts about the bulls' near victory. The Crypto Fear and Greed Index fell into the Fear zone to the 30 mark. The 50-day MA has again turned from support to resistance, and the total crypto market capitalization has not managed to gain a foothold above the psychologically important level of $2.0 trillion, and it is $1.815 trillion at the time of writing.
In conclusion, it remains only to quote the words of Tom Lee from Fundstrat. "If there is no crystal ball, it is very difficult to be accurate in cryptocurrency," he joked about the forecasts. According to a proverb, there is some truth in every joke. In this case, this proportion clearly exceeds 50%.
EUR/USD Weekly Outlook
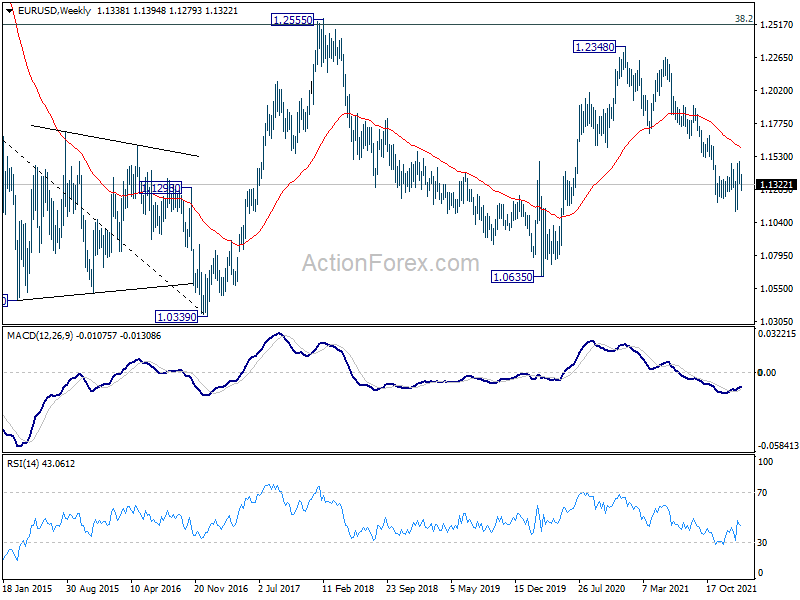
EUR/USD stayed in range between 1.1265 and 1.1494 last week and outlook is unchanged. Initial bias remains neutral this week first. On the upside break of 1.1482 will target 38.2% retracement of 1.2348 to 1.1120 at 1.1589 next. Sustained break there will argue that whole fall from 1.2348 has completed too and target 61.8% retracement at 1.1879. On the downside, however, break of 1.1265 support will dampen this bullish view and bring retest of 1.1120 low instead.
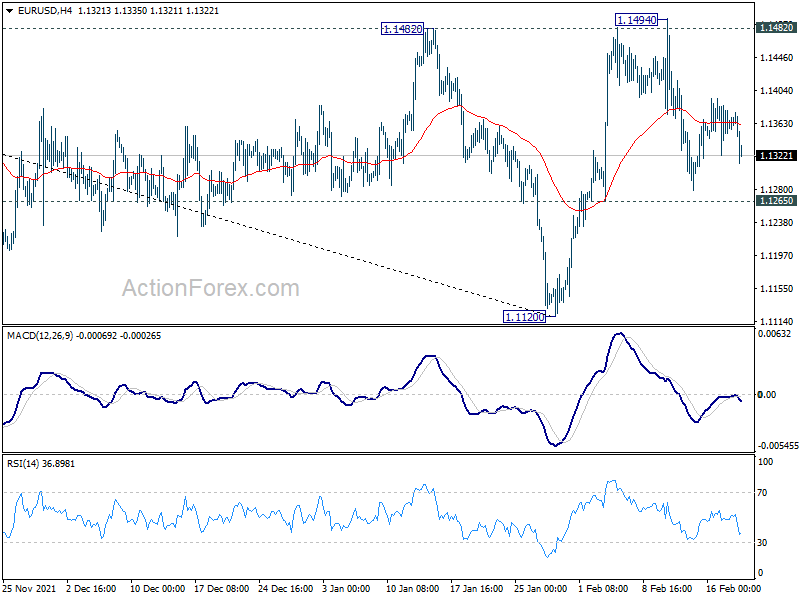
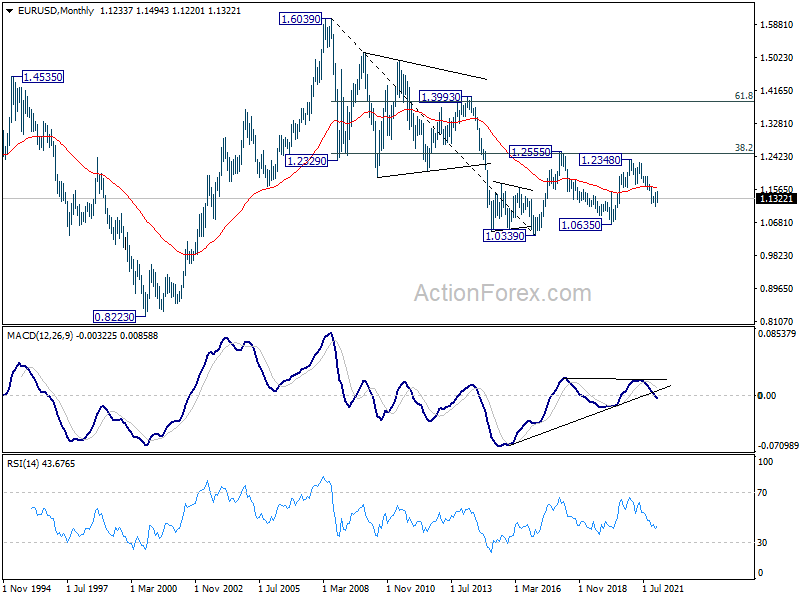
In the bigger picture, the decline from 1.2348 (2021 high) is seen as a leg inside the range pattern from 1.2555 (2018 high). Sustained trading above 55 week EMA (now at 1.1593) will argue that it has completed and stronger rise would be seen back towards top of the range between 1.2348 and 1.2555. However, firm break of 1.0635 (2020 low) will raise the chance of long term down trend resumption and target a retest on 1.0339 (2017 low) next.
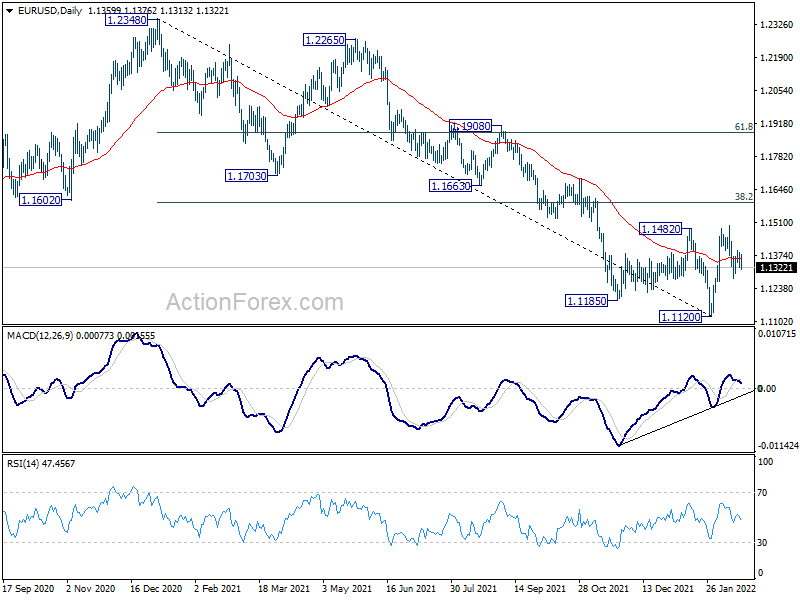
In the long term picture, in another case, as long as (38.2% retracement of 1.6039 (2008 high) to 1.0339 (2017 low) at 1.2516 holds, the down trend from 1.6039 could still resume through 1.0339 low. However, sustained trading above 1.2516 will argue that the long term trend has reversed.
USD/JPY Weekly Outlook
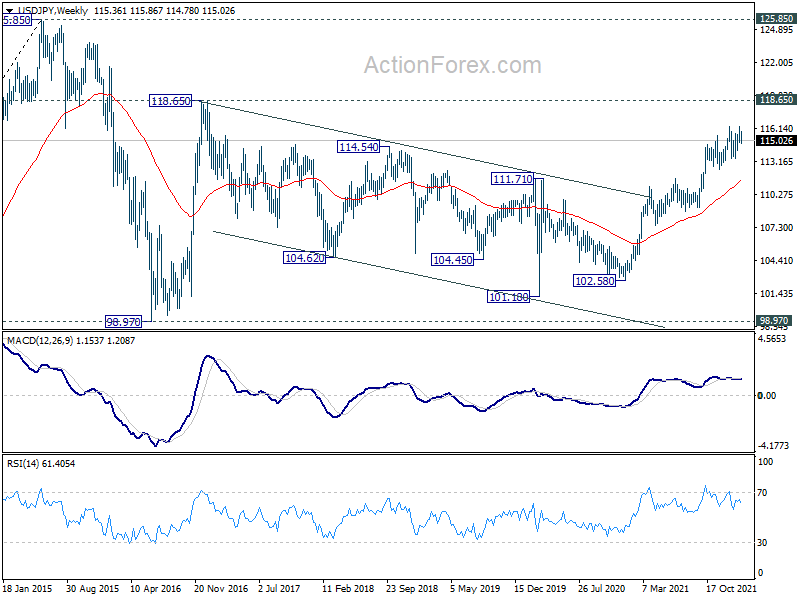
Outlook is unchanged that fall from 116.33 is seen as the third leg of the corrective pattern from 116.34. Initial bias is mildly on the downside this week for 114.14 support first. On the upside, however, break of 115.86 will turn bias back to the upside for 116.34 resistance instead.
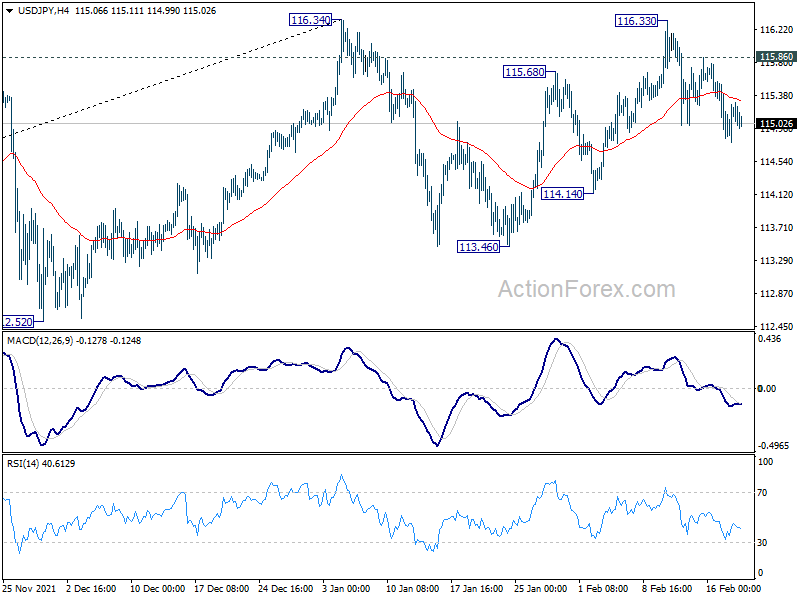
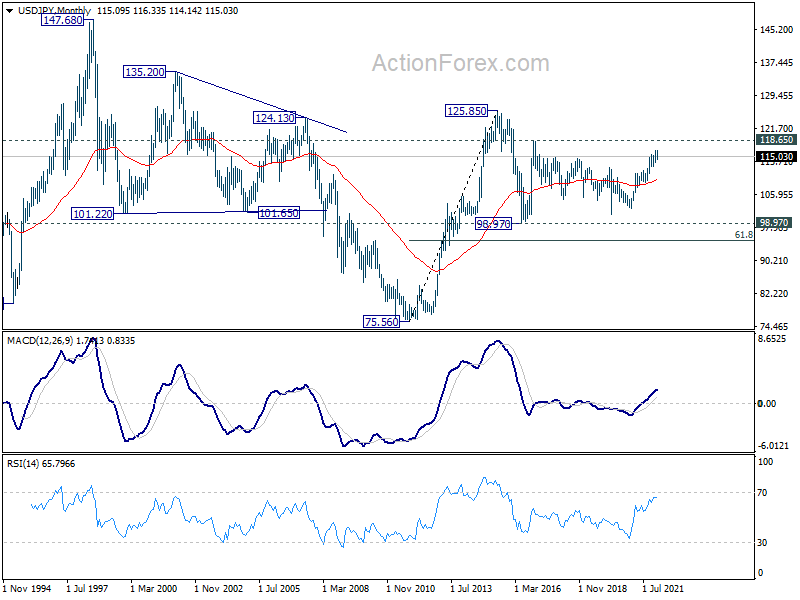
In the bigger picture, no change in the view that rise from 102.58 is the third leg of the up trend from 101.18 (2020 low). Such rally should target a test on 118.65 (2016 high). Sustained break there will pave the way to 120.85 (2015 high) and raise the chance of long term up trend resumption. This will remain the favored case as long as 55 week EMA (now at 111.31) holds.
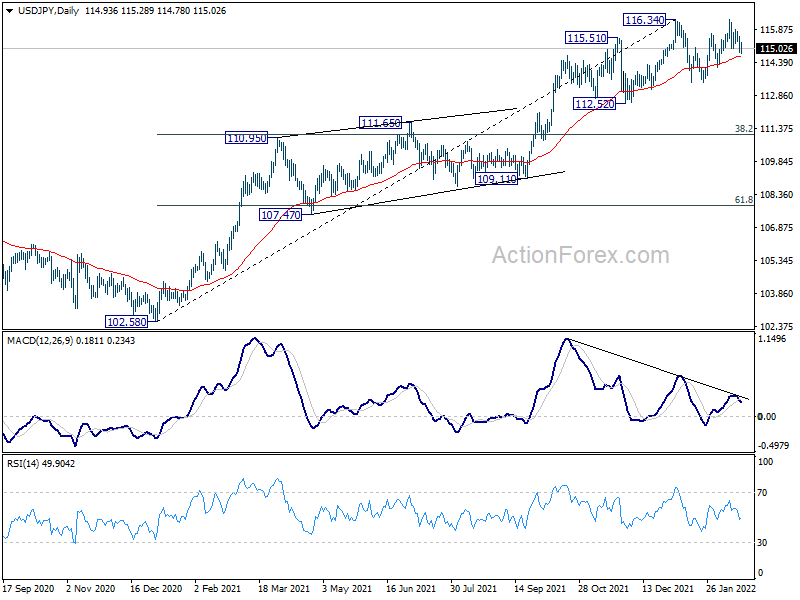
In the long term picture, the rise from 75.56 (2011 low) long term bottom to 125.85 (2015 high) is viewed as an impulsive move, no change in this view. Price actions from 125.85 are seen as a corrective pattern which could still extend. In case of deeper fall, downside should be contained by 61.8% retracement of 75.56 to 125.85 at 94.77. Up trend from 75.56 is expected to resume at a later stage for above 135.20/147.68 resistance zone.
GBP/USD Weekly Outlook
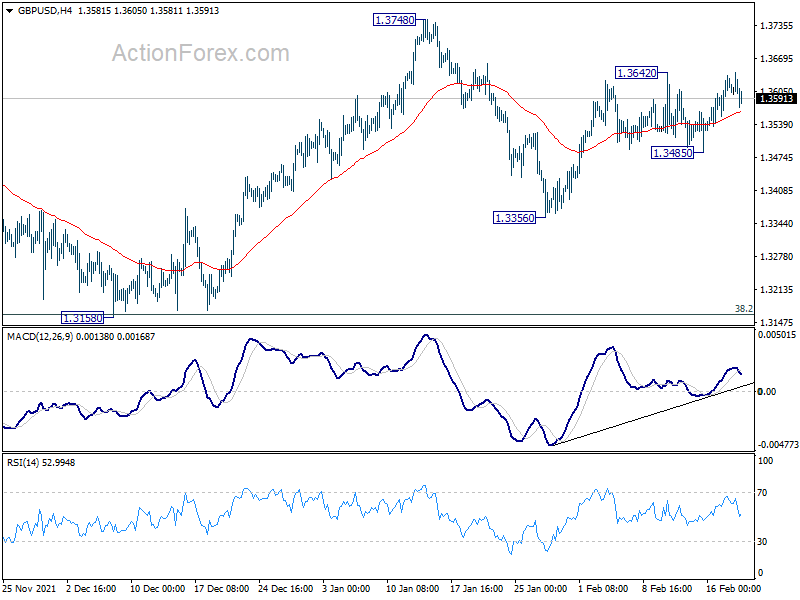
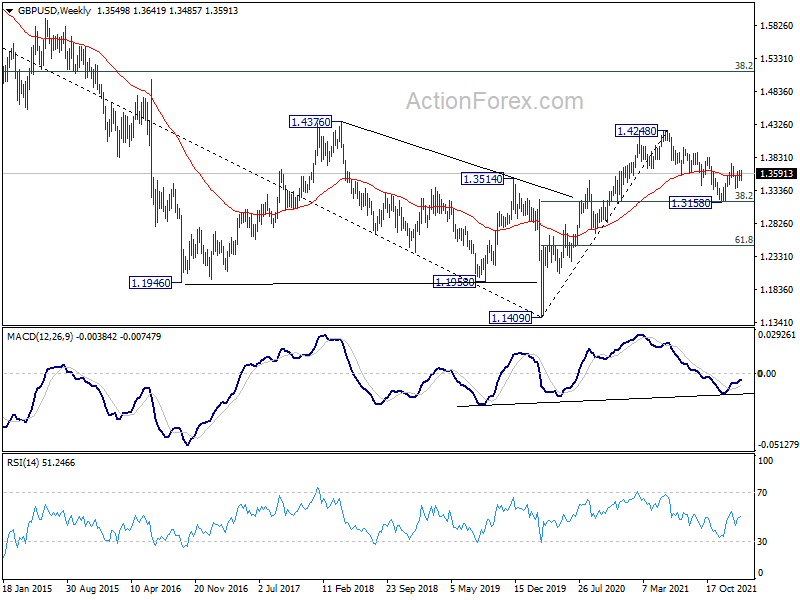
Sideway trading continued in GBP/USD last week and outlook is unchanged. Initial bias remains neutral this week first. Break of 1.3642 will resume the rebound from 1.3356 to 1.3748 resistance. Firm break there will revive the bullish case that correction from 1.4248 has completed with three waves down to 1.3158. Further rally should then be seen to retest 1.4248 high. On the downside, though, break of 1.3485 will turn bias to the downside for 1.3356 support instead.
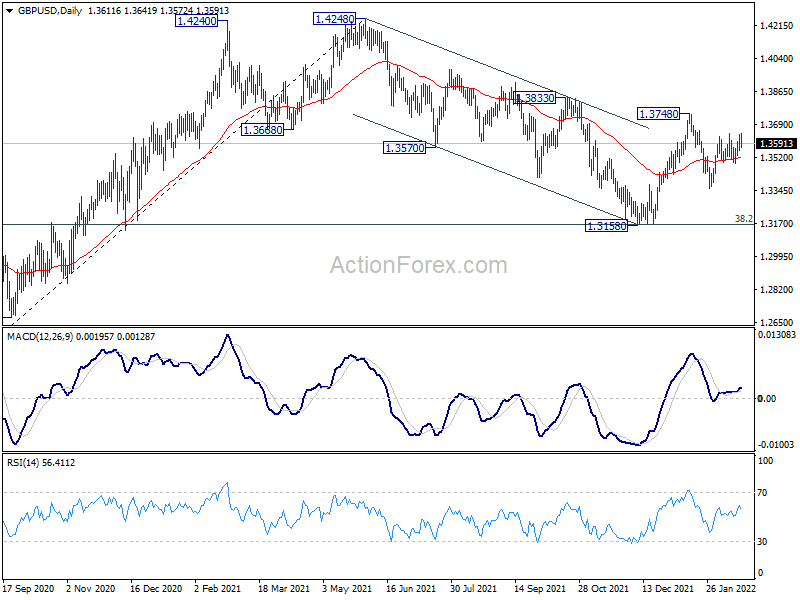
In the bigger picture, as long as 38.2% retracement of 1.1409 to 1.4248 at 1.3164 holds, up trend from 1.1409 (2020 low) is still in progress. On resumption, next target will be 38.2% retracement of 2.1161 to 1.1409 at 1.5134. Nevertheless sustained break of 1.3164 will argue that whole rise from 1.1409 has completed and bring deeper fall to 61.8% retracement at 1.2493.
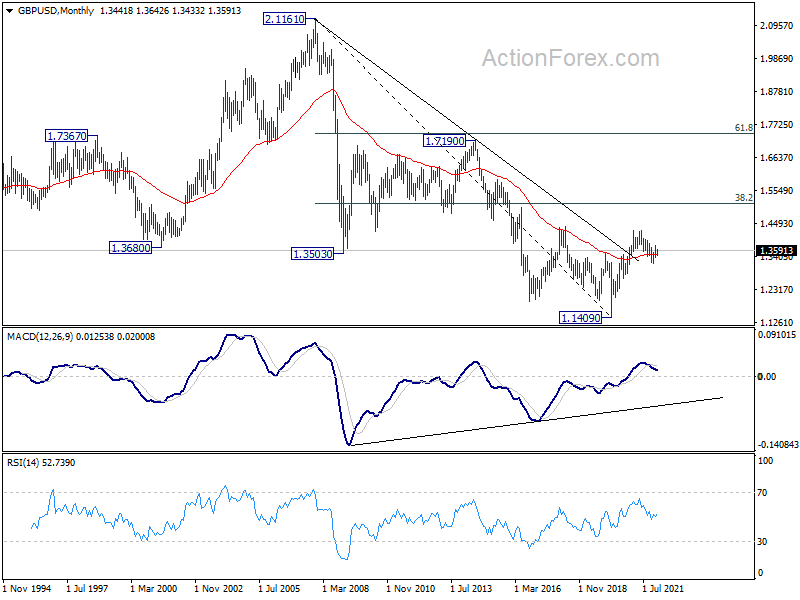
In the longer term picture, a long term bottom should be in place at 1.1409, on bullish convergence condition in monthly MACD. Rise from there would target 38.2% retracement of 2.1161 to 1.1409 at 1.5134. Reaction from there would reveal whether rise from 1.1409 is just a correction, or developing into a long term up trend.
USD/CHF Weekly Outlook
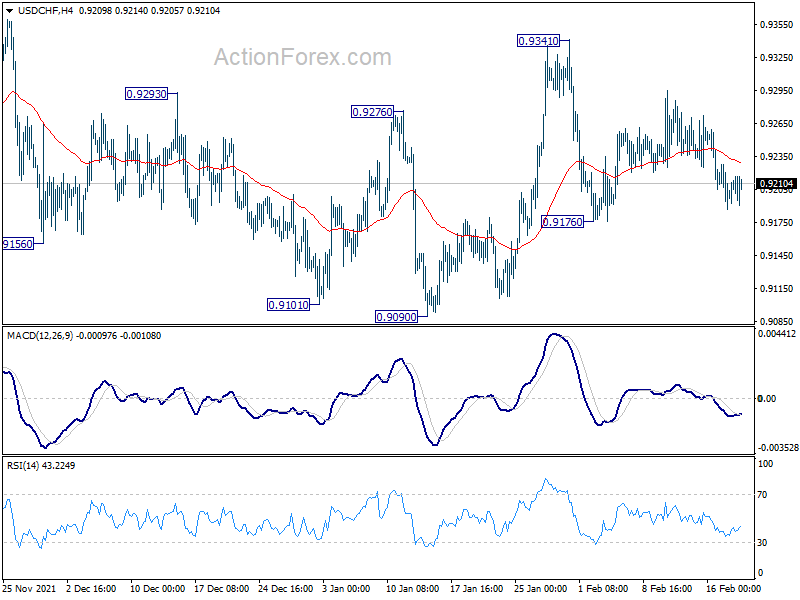
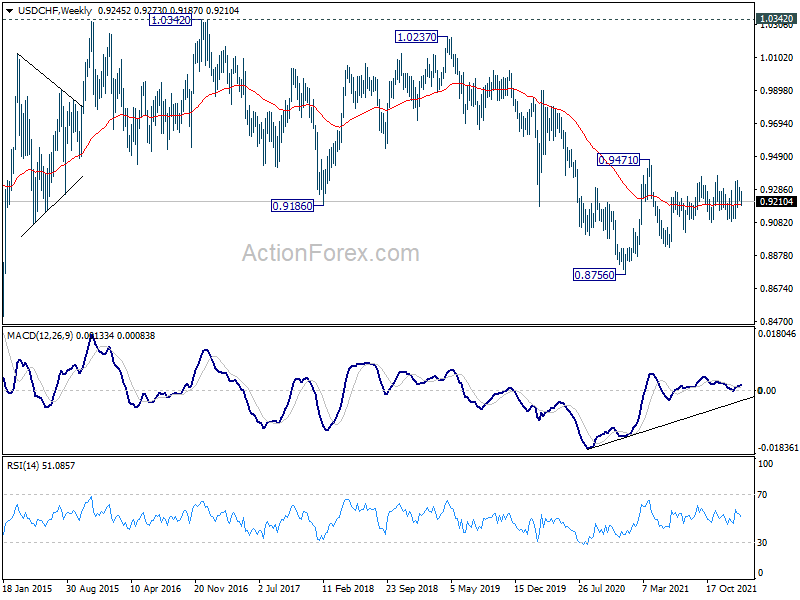
Range trading continued in USD/CHF last week and outlook remains unchanged. Initial bias stays neutral this week first. Overall, further rally is mildly in favor as long as 0.9090 support holds. On the upside, break of 0.9372 will resume the choppy rally from 0.8925 to 0.9471 high. However, break of 0.9090 will turn bias back to the downside for 0.8925 support instead.
In the bigger picture, medium term outlook will be neutral at best as long as 0.9471 resistance holds. Larger down trend could still extend through 0.8756 (2021 low). However, firm break of 0.9471 will argue that the trend has already reversed and rebound the rally from 0.8756 with another impulsive move.
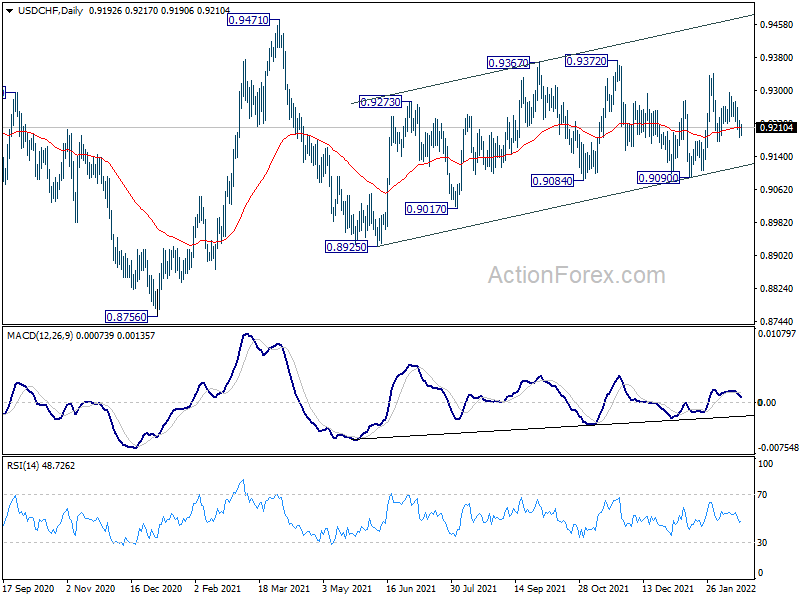
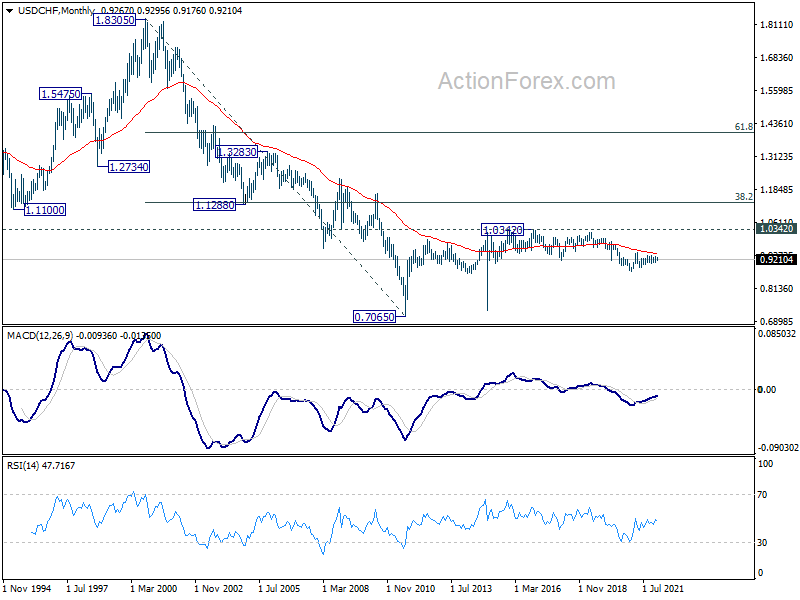
In the long term picture, price actions from 0.7065 (2011 low) are currently seen as developing into a long term corrective pattern, at least until a firm break of 1.0342 resistance.
AUD/USD Weekly Outlook
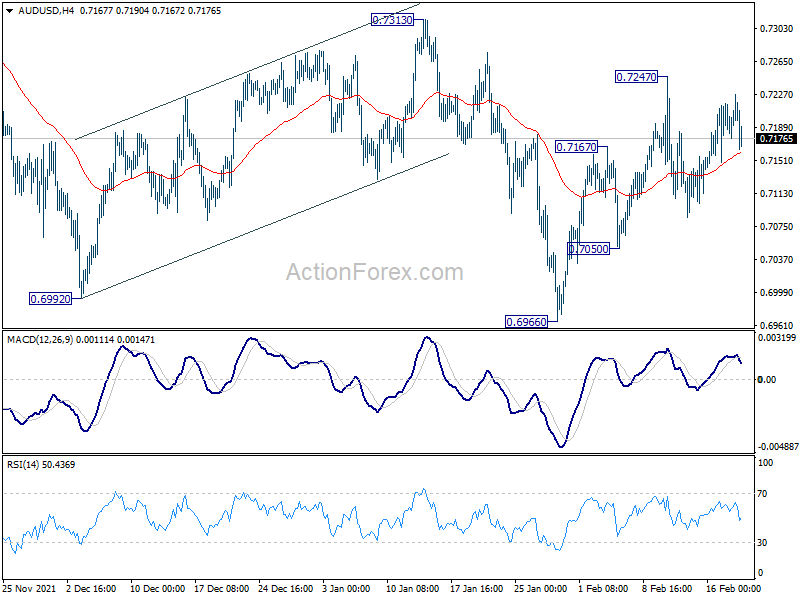
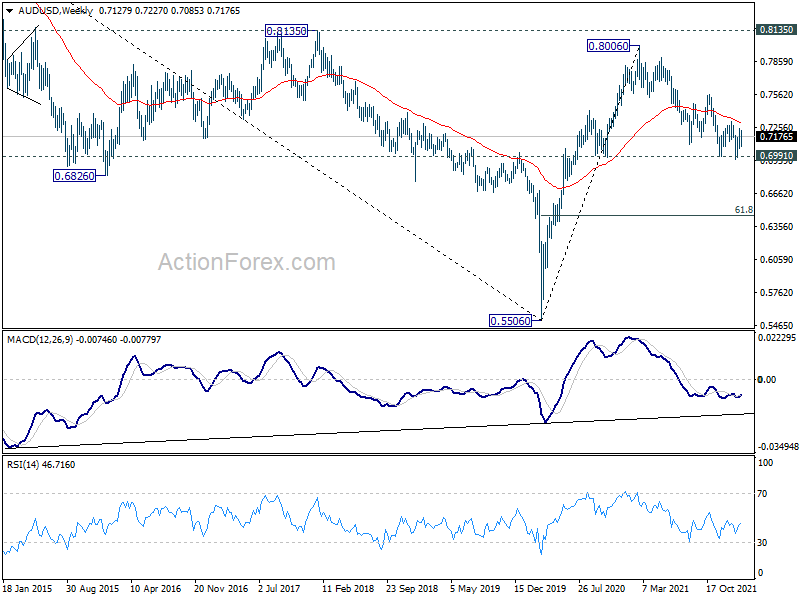
AUD/USD stays in range below 0.7247 last week and outlook is unchanged. Initial bias remains neutral this week first. Further rise would remain in favor as long as 0.7050 support holds. Above 0.7247 will target 0.7313 resistance. Decisive break there argue that correction from 0.8006 has completed at 0.6966, after hitting 0.6991 key support. Outlook will be turned bullish for 0.7555 resistance next. On the downside, however, break of 0.7050 support will bring retest of 0.6966 low instead.
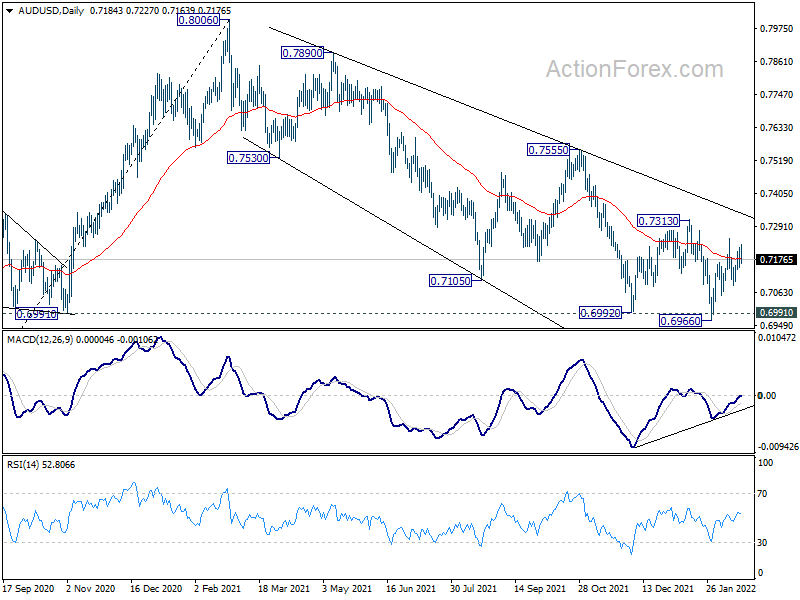
In the bigger picture, focus remains on 0.6991 key structural support. Sustained break there will argue that the whole up trend from 0.5506 might be finished at 0.8006, after rejection by 0.8135 long term resistance. Deeper decline would then be seen back to 61.8% retracement of 0.5506 to 0.8006 at 0.6461. Meanwhile, strong rebound from 0.6991 will retain medium term bullishness. That is, whole up trend from 0.5506 is still in progress.
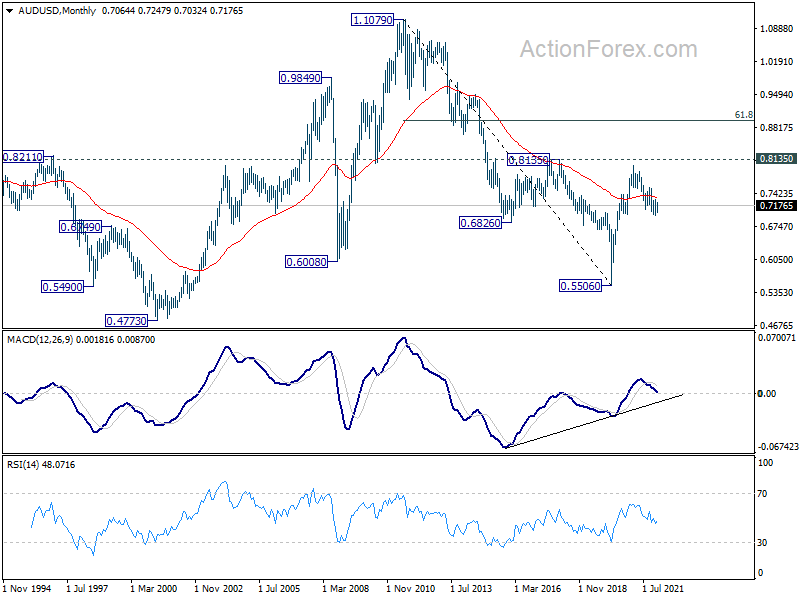
In the longer term picture, focus remains on 0.8135 structural resistance. Decisive break there will argue that rise from 0.5506 is developing into a long term up trend that reverses whole down trend from 1.1079 (2011 high). However, rejection by 0.8135 will keep long term outlook neutral at best.
USD/CAD Weekly Outlook
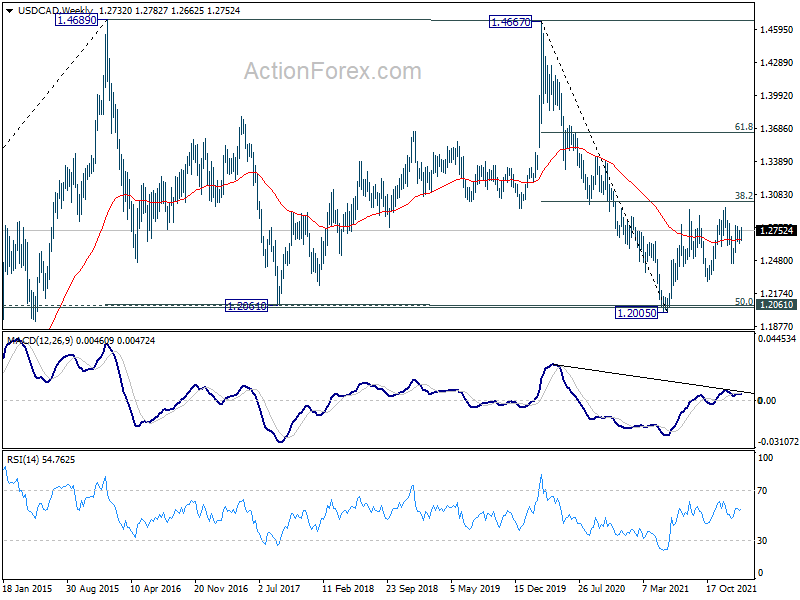
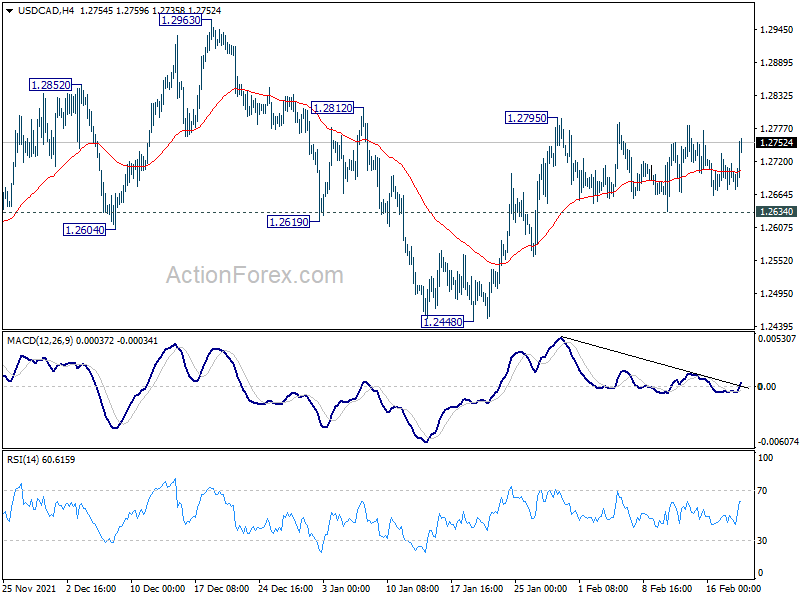
USD/CAD stays in consolidation below 1.2795 last week and outlook is unchanged. Initial bias stays neutral this week and further rally is in favor. On the upside, break of 1.2795 will resume the rally from 1.2448 to 1.2963 resistance next. However, break of 1.2634 support will turn bias back to the downside for 1.2448 support instead.
In the bigger picture, focus stays on 38.2% retracement of 1.4667 (2020 high) to 1.2005 (2021 low) at 1.3022. Sustained break there should confirm that the down trend from 1.4667 has completed after defending 1.2061 long term cluster support. Further rise would then be seen towards 61.8% retracement at 1.3650. However, rejection by 1.3022 will maintain medium term bearishness. Break of 1.2005 will resume the down trend from 1.4667 and that carries larger bearish implications too.
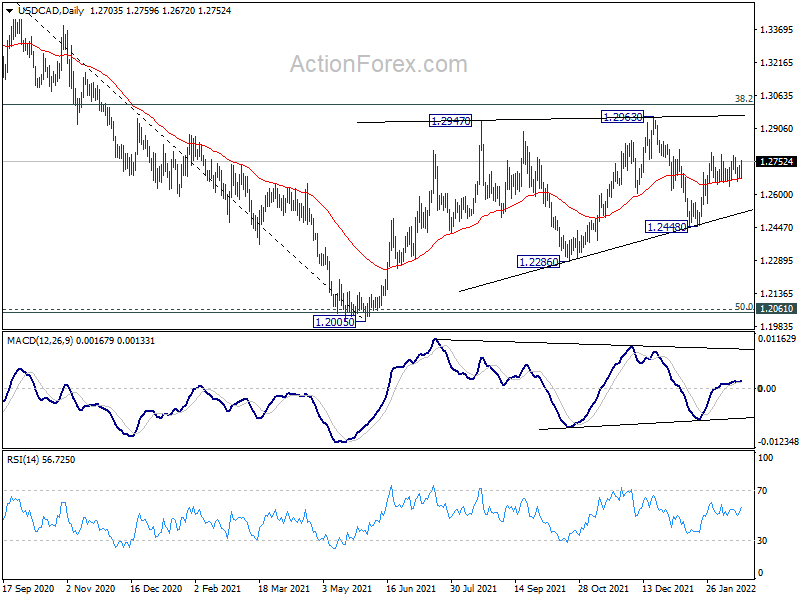
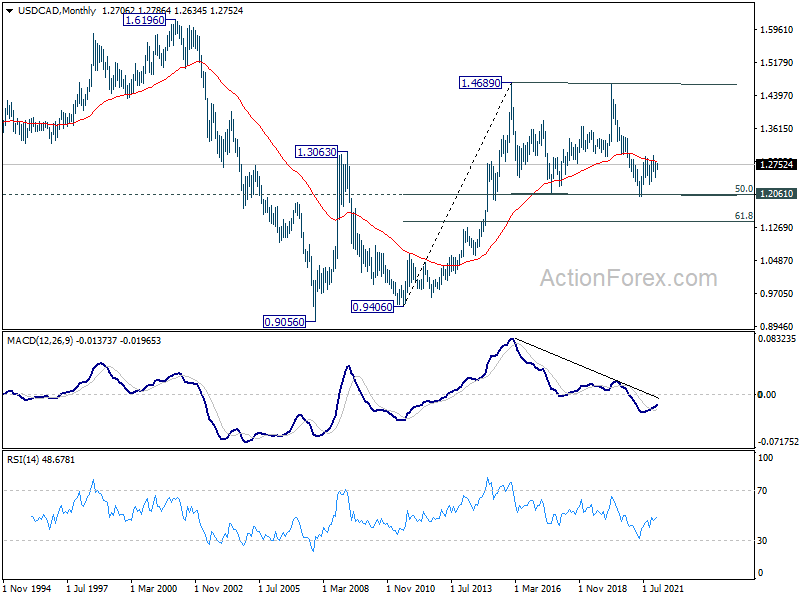
In the longer term picture, we're viewing price actions from 1.4689 as a consolidation pattern. Thus, up trend from 0.9506 (2007 low) is still expected to resume at a later stage. This will remain the favored case as long as 1.2061 support holds, which is close to 50% retracement of 0.9406 to 1.4689 at 1.2048. However, firm break of 1.2061 support will argue that USD/CAD has already started a long term down trend. Next target is 61.8% retracement of 0.9406 to 1.4689 at 1.1424.