Sample Category Title
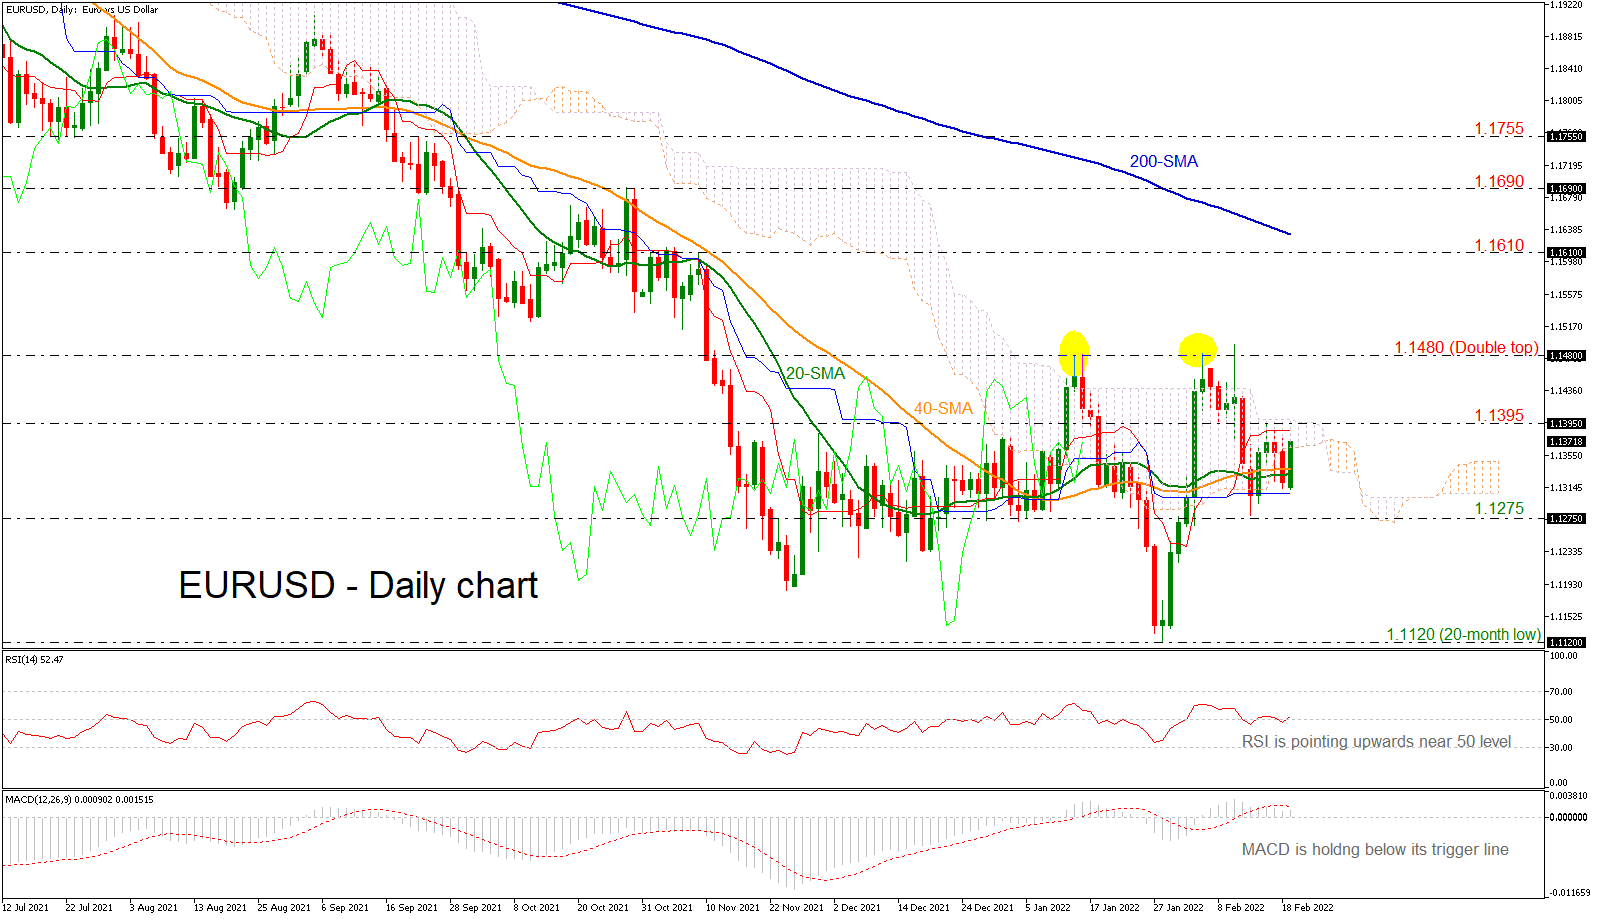
EURUSD Shows Some Positive Signs in Short-Term; Double Top is Active
EURUSD has found strong support at the blue Kijun-sen line of the Ichimoku indicator, while it is still standing above the short-term simple moving averages (SMAs). The double top formation is still holding but any breaks above 1.1480 may shift the neutral outlook to bullish.
Regarding the technical indicators, the RSI indicator is pointing upwards around the neutral threshold of 50, while the MACD is falling below its trigger line in the positive region with weak momentum. Furthermore, the Ichimoku cloud is acting as a resistance area for the bulls.
If the price overcomes the immediate resistance at 1.1395, it could meet the 1.1480 significant barrier ahead of a rally towards the 1.1610 hurdle and the 200-day SMA around 1.1630.
Alternatively, a closing candle beneath the 20- and 40-day SMAs, which are ready for a bullish cross, may send the market towards the 1.1275 support. Underneath this level, the price could revisit the 20-month trough of 1.1120 before tumbling to 1.1015, taken from the inside swing high on April 2020.
All in all, in the long-term, EURUSD has been in declining movement since May 2021; however, in the medium- and short-term timeframes, the pair is neutral. Any upside moves above 1.1480 or below 1.1120 could draw the next direction on price.
EUR/JPY Struggles for Support
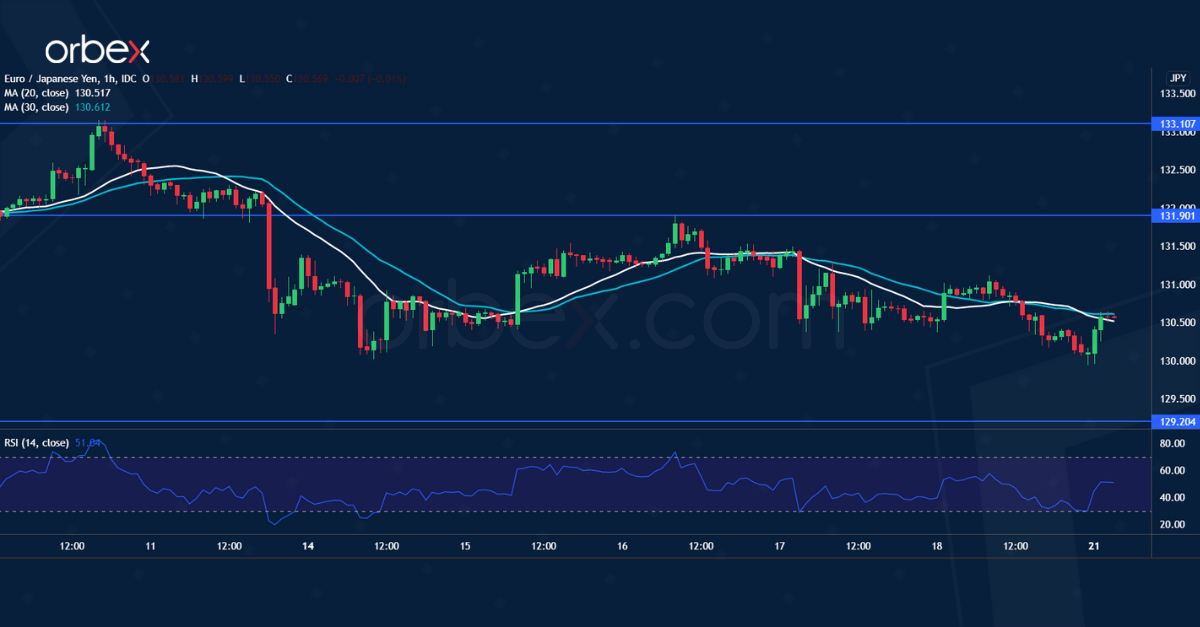
The Japanese yen rallies amid growing risk aversion across the board. The euro continues to shed gains from the surge earlier this month.
A fall below 131.90 triggered profit-taking, and the latest rally came out to be a dead cat bounce after it was capped by this support-turned-resistance. A break below 130.40 (which sits over the 30-day moving average) shows fragility in market sentiment and would cause another round of sell-off.
129.20 at the base of the bullish impetus would be the next support.
USD/CAD Awaits Breakout
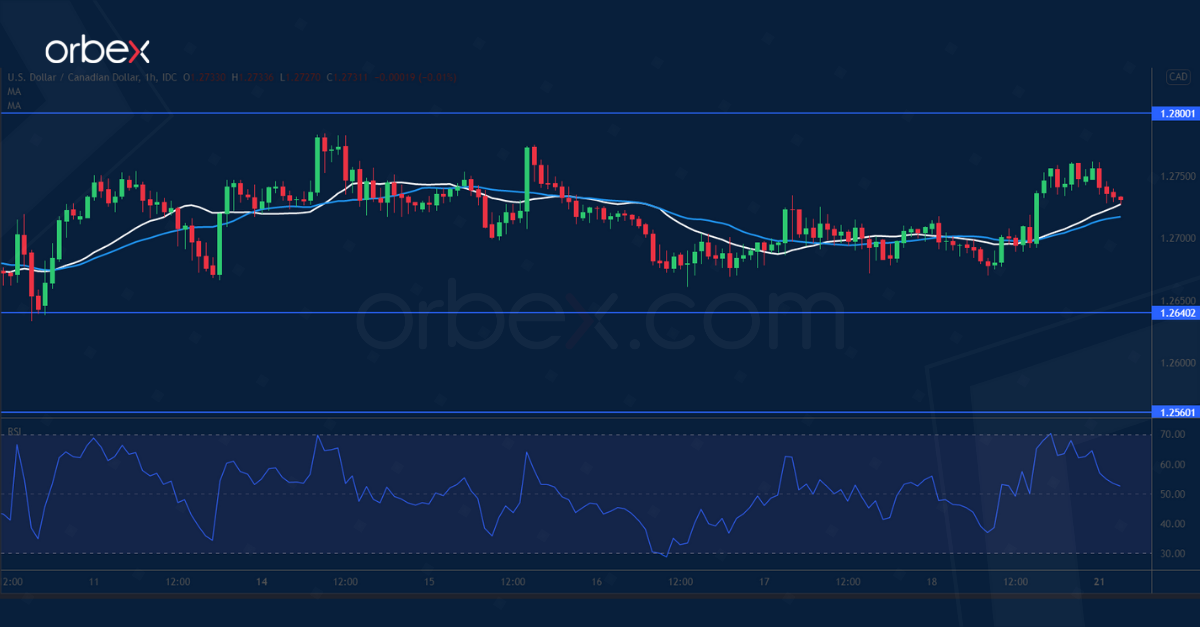
The Canadian dollar tanked after disappointing retail sales in December.
The US counterpart is still struggling below the supply zone around 1.2800. A close above this daily resistance could propel the pair to last December’s high at 1.2950, a prerequisite for a bullish continuation in the medium-term.
The current sideways action is a sign of indecision. 1.2640 is the lower boundary of the recent consolidation range. A bearish breakout would bring the greenback to a previous low at 1.2560.
GBP/USD Tests Resistance
The sterling edged higher after January’s retail sales beat expectations. The recent pause has been an opportunity for the bulls to accumulate.
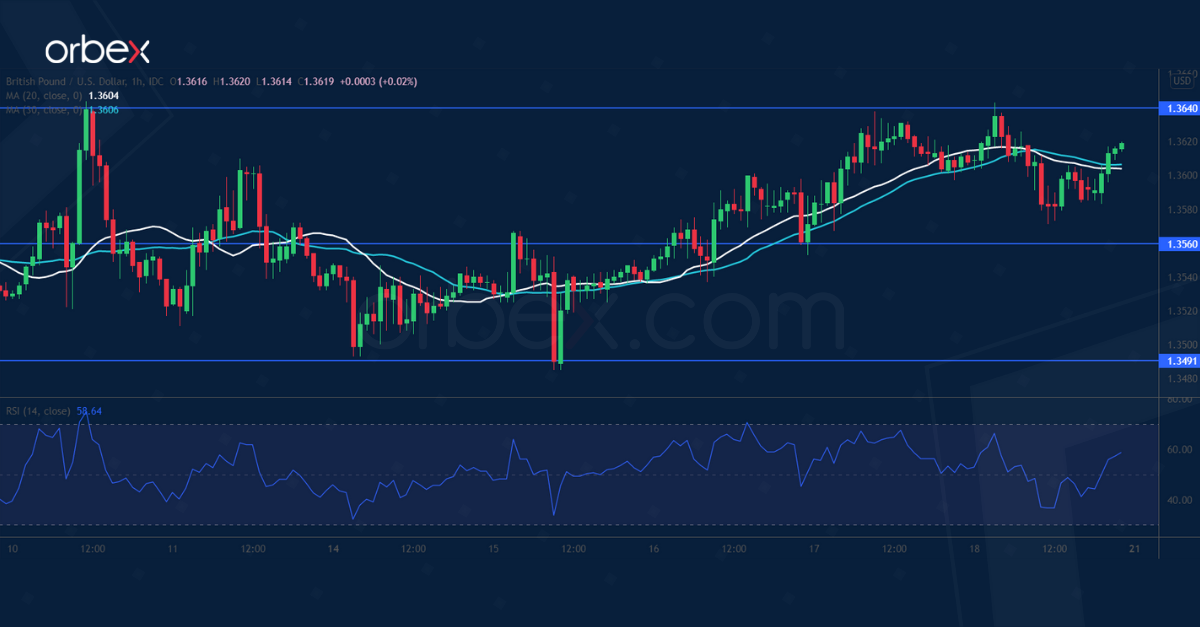
A break above 1.3640 would signal solid buying after previous failed attempts. The daily resistance at 1.3750 would be the next hurdle. Its breach could trigger a broader reversal in the weeks to come.
1.3560 is the immediate support. And 1.3490 at the lower end of the horizontal consolidation is the second line of defense in case the pair needs to attract more support.
Ukraine-Russia Crisis, Swiss Secrets and the Fed
The week starts with some comfort regarding the Ukrainian crisis on news that Biden and Putin agreed to meet. US futures are in the positive after having closed the week on a bearish tone.
Gold traded a touch below the $1910 this morning but eased below the $1900 mark on encouraging Ukraine-Russai news. The yellow metal could give back the Ukraine-related gains rapidly if there is a sustainable resolution at the border. Yet, if the things get worse, gold won’t hesitate to advance as high as needed, and that includes the possibility of an advance to $2000. But that’s not the base case scenario.
Oil slipped below the $90 per barrel on Friday and is now steady a touch above that level. Normally, the Ukraine tensions are expected to be a positive catalyzer for oil prices, but the positive correlation between the geopolitical tensions and oil prices were interrupted last week. Investors price in the possibility of an Iran deal which would unlock the Iranian oil exports, as well as the negative implications of a potential war in Ukraine, which would hit the global recovery. Therefore, the bull sentiment is no longer as strong as at the beginning of last week. Moreover, any relief in the Ukrainian situation should pull the prices lower toward the $86/87 region, the October peak.
In Switzerland, the sentiment is soft due to the Swiss Secrets that broke in over the weekend. The latest news will likely batter Credit Suisse and send a broader shockwave to the Swiss bank, but the medium term implications for the other Swiss banks should remain limited.
Death cross formation?
US indices closed last week on a negative note. The S&P500 slid 0.72% and Nasdaq lost 1.23%. Nasdaq is now walking with big steps toward a death cross formation on its daily chart, which could further increase the bearish pressure on the stock price. The next important levels to watch this week are 13725, the January dip, then 12990, the major 38.2% Fibonacci retracement on post-pandemic recovery which should distinguish between the post-pandemic positive trend and a medium term bearish reversal.
The macro environment isn’t necessarily supportive of the equity markets this year. The hawkish Fed expectations, an imminent rate hike, combined with the prospects of an early and maybe an aggressive shrinking of the Fed’s balance sheet are not appetizing for risk investors. This being said, we begin the week having mostly ruled out the possibility of seeing a 50bp hike in March meeting. The US yields have been easing since last week. Although that’s mostly due to increased safe haven flows towards the US sovereign bonds, some key Fed officials also came with remarks that gets the market refocus on an eventual 25bp in March. Activity in the fed funds shows that the consensus is again a 25bp hike in March. Happy Monday.
GBP/JPY Daily Outlook
Daily Pivots: (S1) 155.98; (P) 156.64; (R1) 157.05; More...
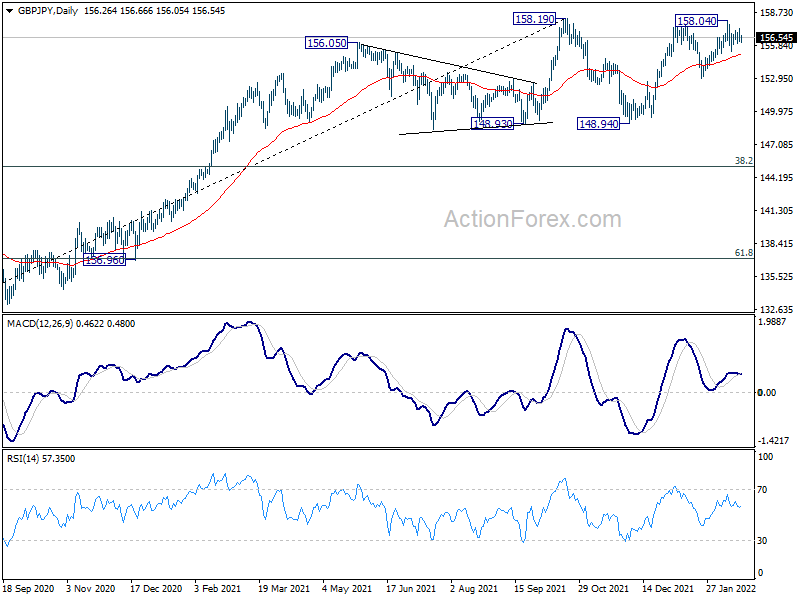
Intraday bias in GBP/JPY remains neutral at this point. On the downside, break of 155.11 resistance should confirm rejection by 158.19 resistance. Intraday bias will be turned to the downside for 152.88 support, to extend the corrective pattern from 158.19 with another falling leg. However, on the upside, sustained break of 158.19 will resume larger up trend.
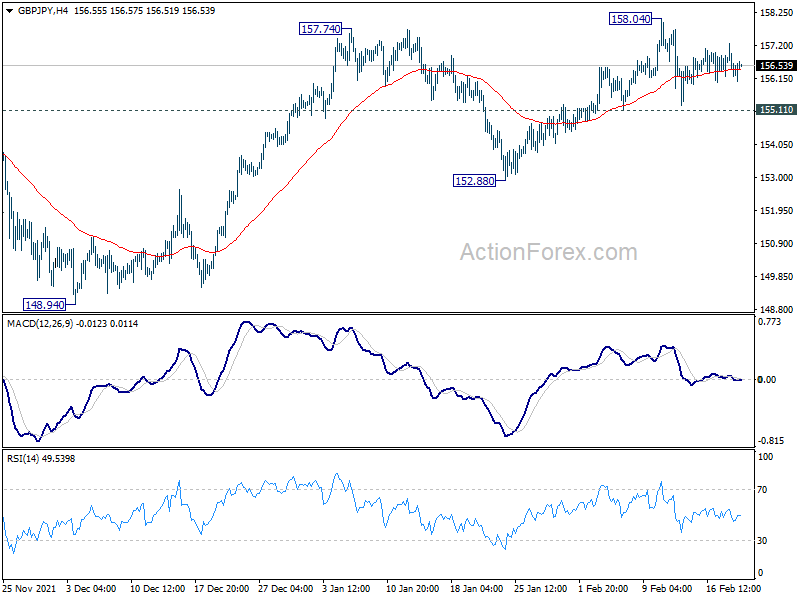
In the bigger picture, price actions from 158.19 are seen as developing into a consolidation pattern to up trend from 123.94 (2020 low). Downside should be contained by 123.94 to 158.19 at 145.10 to bring rebound. Firm break of 158.19 will resume the up trend to long term fibonacci level at 167.93. However, sustained break of 145.10 will raise the chance of trend reversal and target 61.8% retracement at 137.02.
EUR/JPY Daily Outlook
Daily Pivots: (S1) 129.95; (P) 130.54; (R1) 130.86; More....
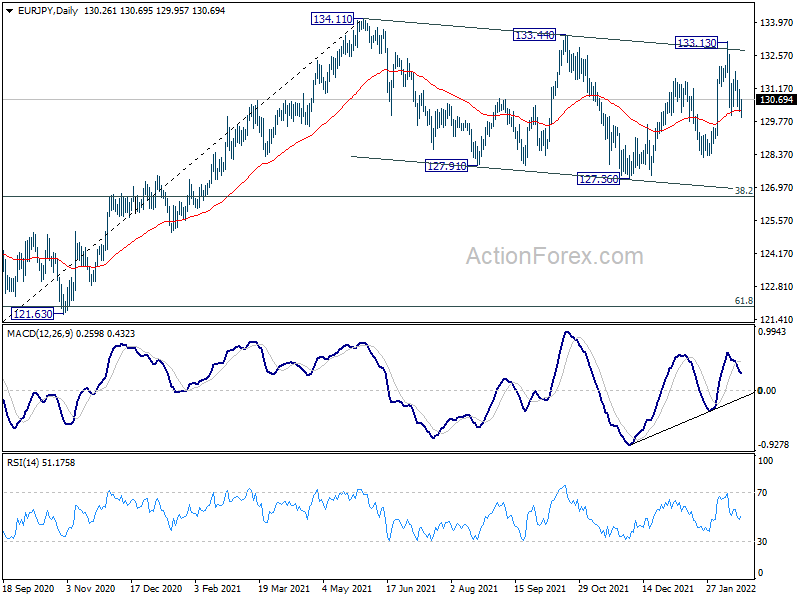
Intraday bias in EUR/JPY remains neutral first. Corrective pattern from 134.11 is seen as extending with another falling leg. Break of 130.03 will bring deeper fall to 128.23 support first. Break will target 127.36 support and below. On the upside, however, break of 133.13 will bring retest of 134.11 high.
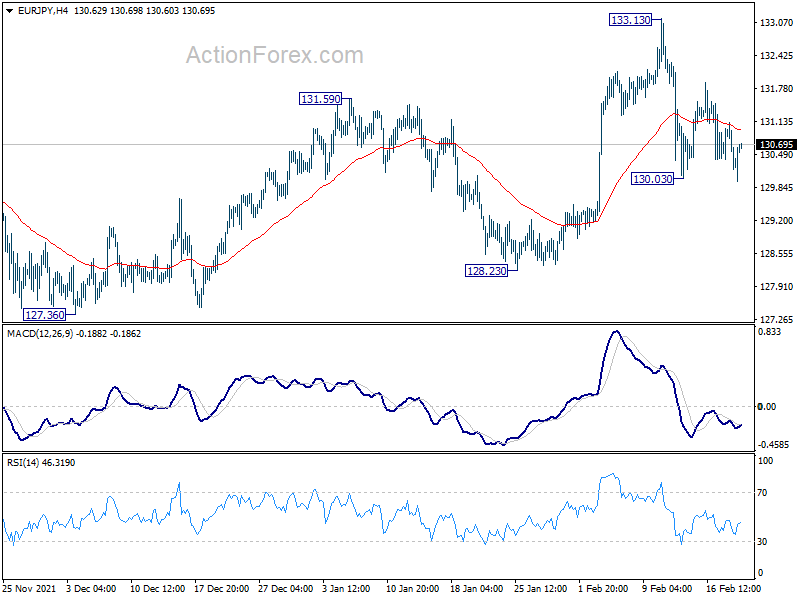
In the bigger picture, price actions from 134.11 are currently seen as a consolidation pattern only. As long as 38.2% retracement of 114.42 (2020 low) to 134.11 at 126.58 holds, up trend from 114.42 is still in favor to continue. Break of 134.11 will target long term resistance at 137.49 (2018 high). However, sustained break of 126.58 will raise the chance of bearish reversal. In this case, deeper decline would be seen to 61.8% retracement at 121.94, and possibly below.
EUR/GBP Daily Outlook
Daily Pivots: (S1) 0.8319; (P) 0.8338; (R1) 0.8348; More...
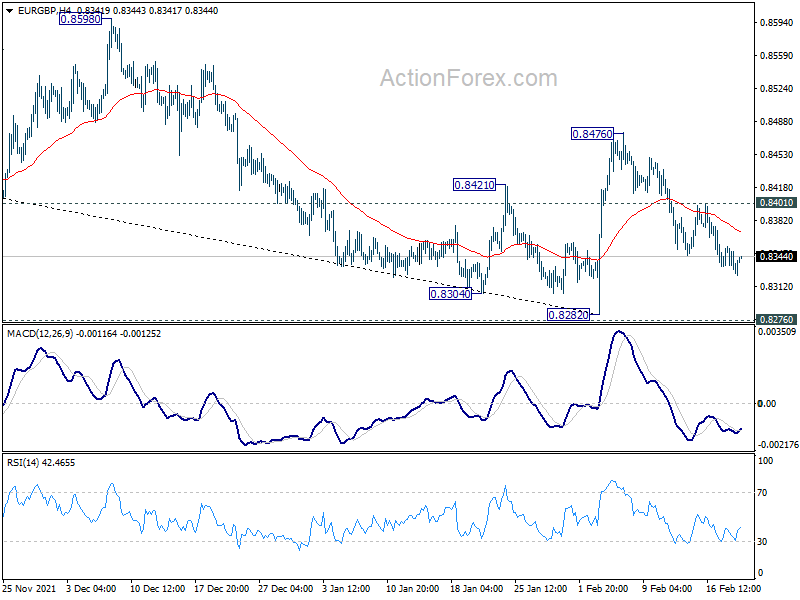
Intraday bias in EUR/GBP stays mildly on the downside for retesting 0.8282 low. Sustained break of 0.8276 key long term support will carry larger bearish implication. On the upside, above 0.8401 minor resistance will turn bias back to the upside for 0.8476 resistance. Break there will resume the rebound from 0.8282.
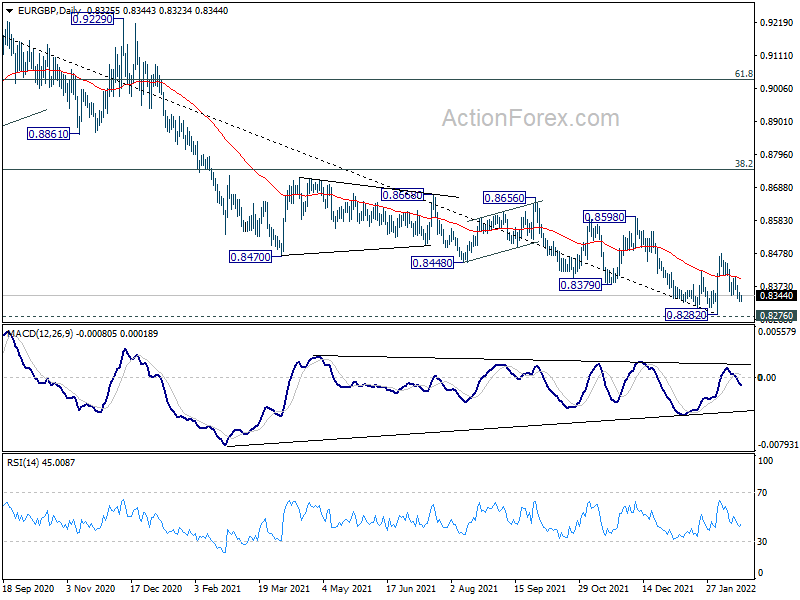
In the bigger picture, price actions from 0.9499 (2020 high) are still seen a corrective pattern that should be contained by 0.8276 long term support (2019 low). Sustained trading above 38.2% retracement of 0.9499 to 0.8282 at 0.8747 will affirm this bullish case. However, sustained break of 0.8276 will argue that the long term trend has reversed. Deeper decline would be seen to 61.8% retracement of 0.6935 to 0.9499 at 0.7917.
EUR/AUD Daily Outlook
Daily Pivots: (S1) 1.5731; (P) 1.5779; (R1) 1.5825; More...
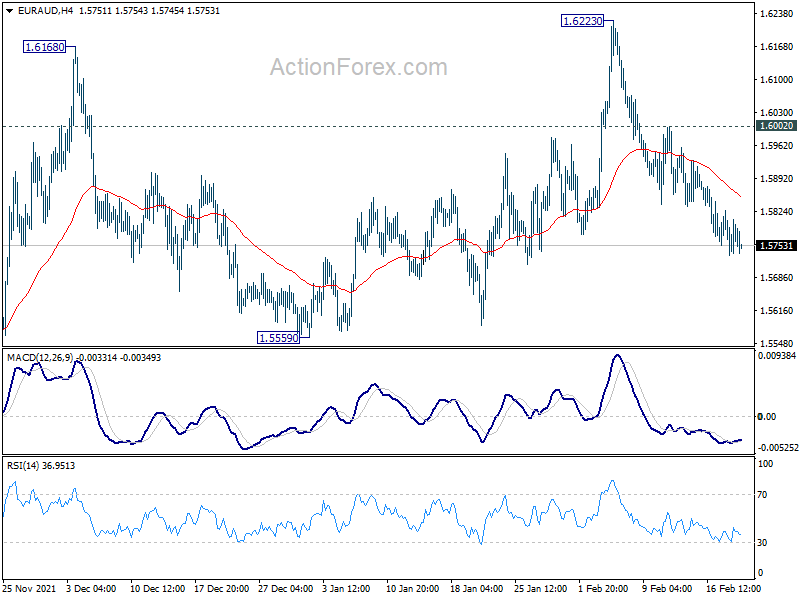
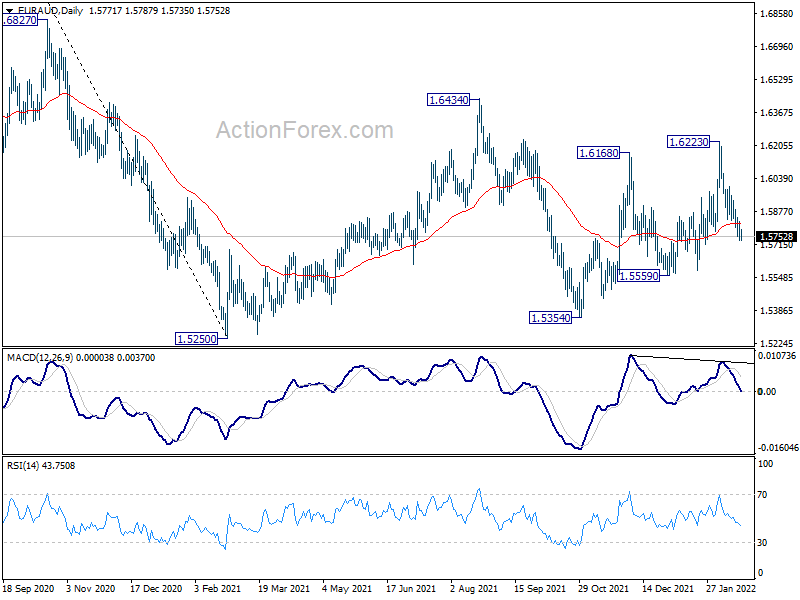
Intraday bias in EUR/AUD stays mildly on the downside at this point. Rise from 1.5559 could have completed at 1.6223 already. Deeper fall would be seen to 1.5559 support first. Break there will also indicate that corrective rise from 1.5354 has completed in form of a three wave pattern. Further decline would then be seen back to 1.5250/5354 support zone. On the upside, above 1.6002 minor resistance will bring retest of 1.6223 resistance instead.
In the bigger picture, rise from 1.5354 is seen as the third leg of the corrective pattern from 1.5250 low. Further rise cannot be ruled out, but even in that case, strong resistance should be seen at 38.2% retracement of 1.9799 to 1.5250 at 1.6988. Larger down trend from 1.9799 is in favor to extend through 1.5250 at a later stage.
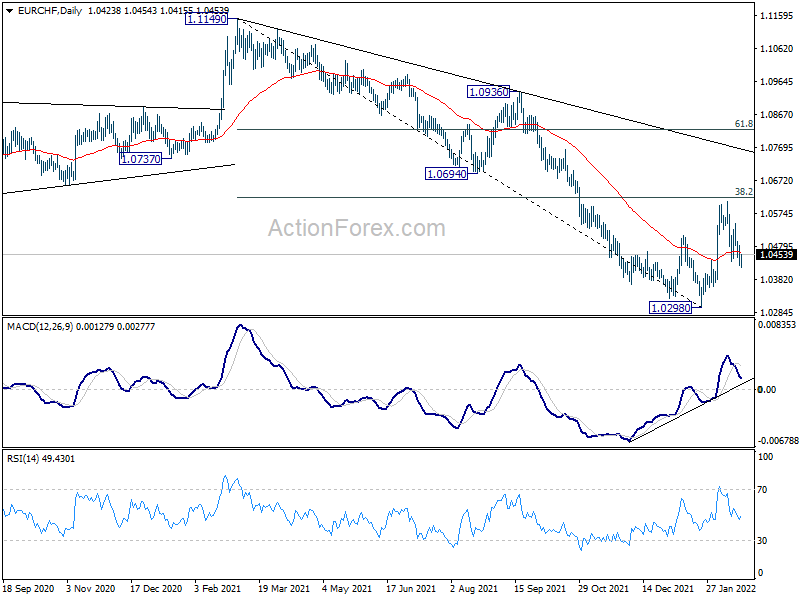
EUR/CHF Daily Outlook
Daily Pivots: (S1) 1.0411; (P) 1.0447; (R1) 1.0467; More....
Intraday bias in EUR/CHF remains mildly on the downside at this point. Rebound form 1.0298 could have completed at 1.0610 already, after rejection by 38.2% retracement of 1.1149 to 1.0298 at 1.0623. Deeper fall would be seen for retesting 1.0298 low. On the upside, above 1.0480 minor resistance will turn intraday bias neutral first.
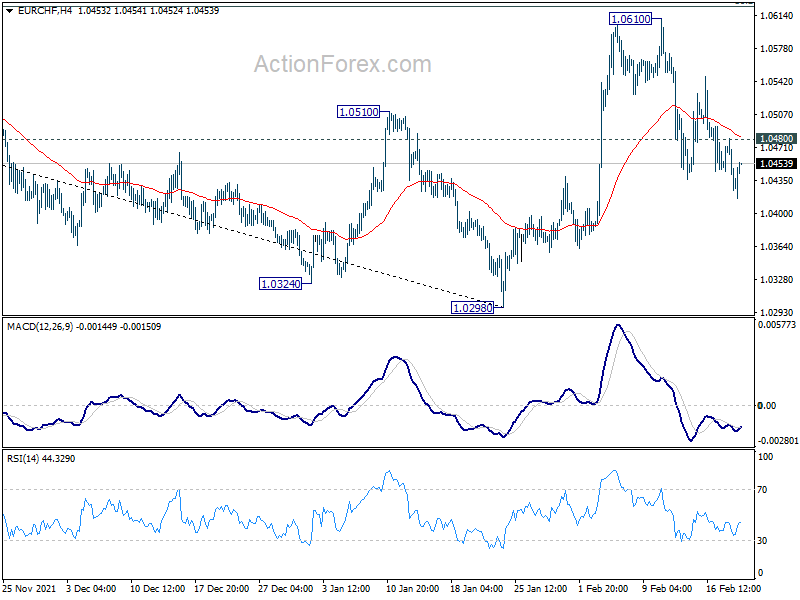
In the bigger picture, a medium term bottom was formed at 1.0298 on bullish convergence condition in daily MACD. Rebound from there is still tentatively viewed part of a corrective pattern. That is, larger down trend from 1.2004 (2018) could still extend through 1.0298 to 61.8% projection of 1.2004 to 1.0505 to 1.1149 at 1.0223. However, sustained trading above 55 week EMA (now at 1.0667) will argue that the down trend is over, and bring stronger rise back to 1.1149 next.