Sample Category Title
Early Signs of Crypto Winter
Last week, BTC repeated the dynamics of the first ten days of February. The rate strengthened on Monday-Tuesday, and on Wednesday, it exceeded the level of $44,800. Then on Thursday, the price began to fall sharply in unison with stock indices. The decrease in risky assets was caused by the growing tension around Ukraine, where the situation is becoming tenser.
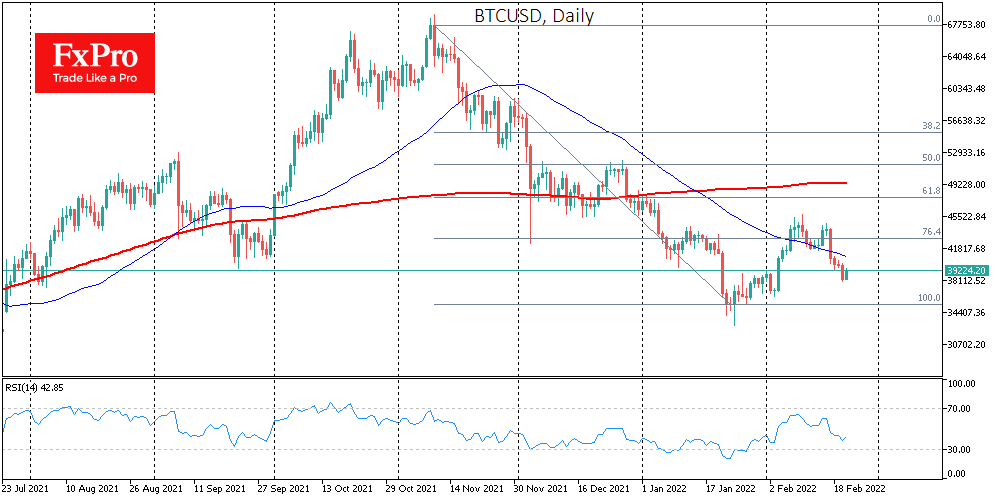
On Friday, Bitcoin continued to fall, briefly dropping below the round level of $40,000. This mark was broken on Sunday, and BTC tested the next support level at $38,000. The situation is aggravated by the increase in cryptocurrency sales by miners. As a result, the bears may try to push the price to $36,000 and even $33,000.
We must say that bitcoin has lost all the growth of February over the past week. In addition to the upcoming Fed rate hike, BTC has been hit by growing geopolitical risks.
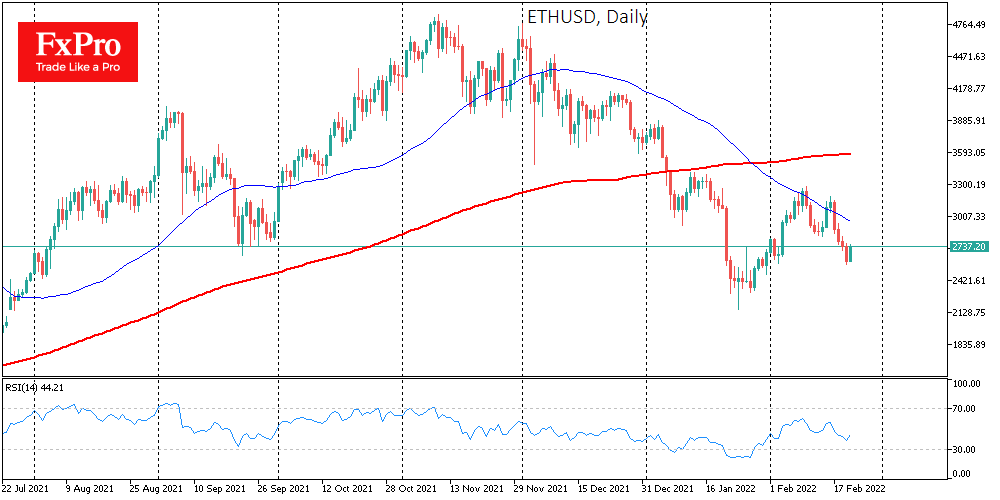
In addition to this, the founder of Ethereum, Vitalik Buterin, noted that he sees early signs of the onset of crypto winter. This spurred crypto sales among retail investors over the weekend. However, ETHUSD is up 5.3% on Monday, recouping Sunday’s decline and continuing to struggle to close the third month in the red.
Overall, Bitcoin was down 9.2% over the past week, ending it at around $38,300. Ethereum lost 9.7%, other leading altcoins from the top ten also sank: from 3.3% (Avalanche) to 11% (Cardano).
The total capitalization of the crypto market fell by 7% in a week, to $1.82 trillion. The Bitcoin dominance index fell 0.7% to 40%, due to less weakening of altcoins. The Bitcoin Fear and Greed Index lost another 2 points to 25 on Monday, returning to the extreme fear territory.
Bitcoin (BTCUSD) Elliott Wave: Forecasting The Path & Selling The Rallies
Hello fellow traders. Another instrument that has given us trading setup lately is BTCUSD. In this technical blog we’re going to take a quick look at the Elliott Wave charts of Bitcoin. As our members know the Cryptocurrency shows lower low sequences in the cycle from the all-time high ( 10 November 2021). That makes BTCUSD bearish against the 52094.62 pivot. We recommended members to avoid buying BTCUSD at this stage and keep selling rallies in 3,7,11 swings. Recently Bitcoin has given us 3 waves bounce against the 52094.62 high that has given us good trading opportunity. In the further text we are going to explain the Elliott Wave Forecast and the trading strategy.
BTCUSD H4 Elliott Wave Analysis 02.07.2022
BTCUSD is correcting the cycle from the 52185.7 peak. Correction looks to be unfolding as Elliott Wave Zig Zag pattern, with ABC red labeling. Recovery (X) blue already shows 3 waves up and price is at the extremes (blue box zone) . We recommended members to avoid buying the Cryptocurrency at this stage while favoring the short side. We expect sellers to appear at the blue box : 42374.5-46131.7 area. As the cycle from the November 2021 looks incomplete, we believe Bitcoin should see further decline from the marked zone or 3 waves pull back alternatively. Once pull back reaches 50 Fibs against the B red low, we will make short position risk free ( put SL at BE). Invalidation for the trade would be break above 1.618 fibs extension: 46131.7
As our members know Blue Boxes are no enemy areas , giving us 85% chance to get a pull back.
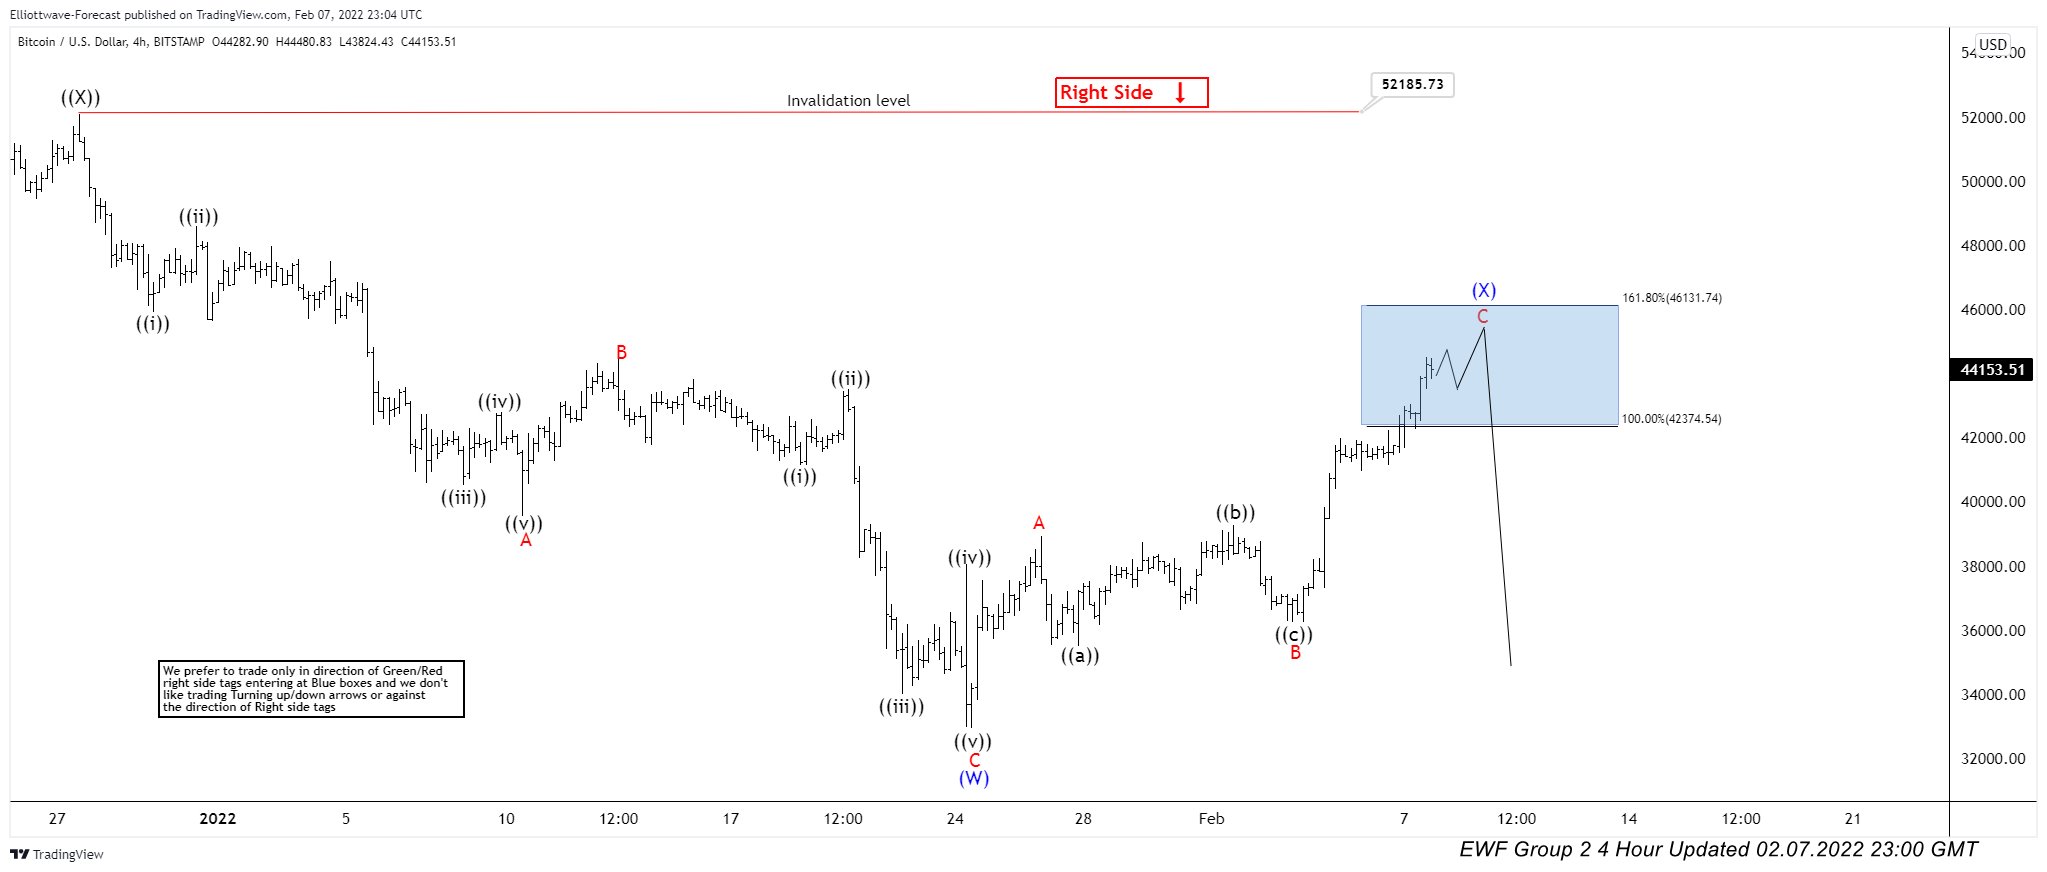
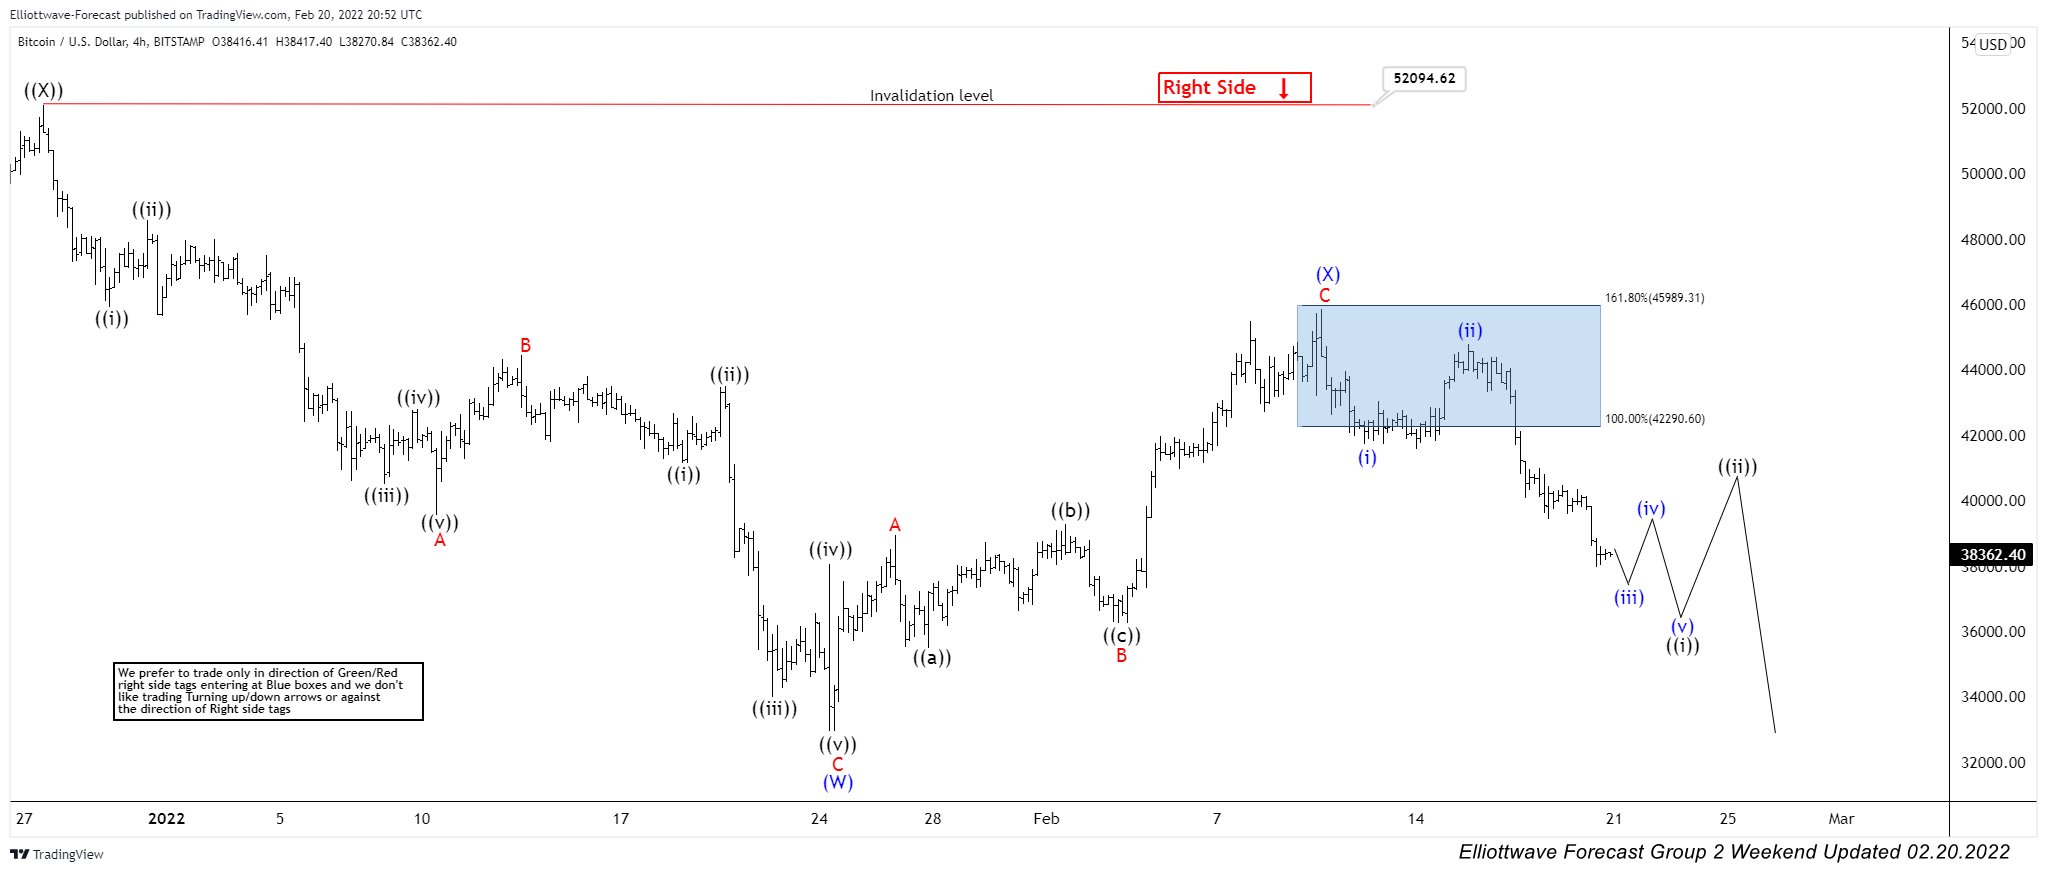
BTCUSD H4 Elliott Wave Analysis 02.07.2022
The price held below upper level of the blue box : 45989.3 . Sellers were strong enough to pull the price lower. We are calling (X) recovery completed at 45875.8 high. However, break of January 24th low is needed for a confirmation. The decline from the selling zone ( blue box) has already reached and exceeded 50 fibs against the ((b)) black connector. As a result members who took short trades are enjoying profits in risk free positions now. All positions from the blue box are risk free. (SL is put at BE) + partial profit is taken.
We know it’s not popular to call decline in $BTCUSD, but that is what sequences suggest. As our members know we have had a lot of buying setups in BTCUSD during the past 2 years. But at this moment Crypto still shows incomplete sequences so bulls should be careful. 52094.6high is the key pivot to hold for the bearish view.
Keep in mind market is dynamic and presented view could have changed in the mean time. You can check most recent charts in the membership area of the site. Best instruments to trade are those having incomplete bullish or bearish swings sequences.We put them in Sequence Report and best among them are shown in the Live Trading Room.
EUR/USD is Saving Strength for Future
The major currency pair is consolidating around 1.1360 at the beginning of the week. Global markets are a bit calmer today than usual – the US is celebrating Presidents’ Day.
At the same time, there is a local demand for the “greenback” at times of geopolitical escalations. Investors use the American currency as a “safe haven” asset.
Later this week, there will be some interesting macroeconomic reports, for example, the US GDP for the fourth quarter of 2021, and also the data on durable goods orders and personal spending/income.
In addition to that, financial markets remain very sensitive to any comments that come from politicians.
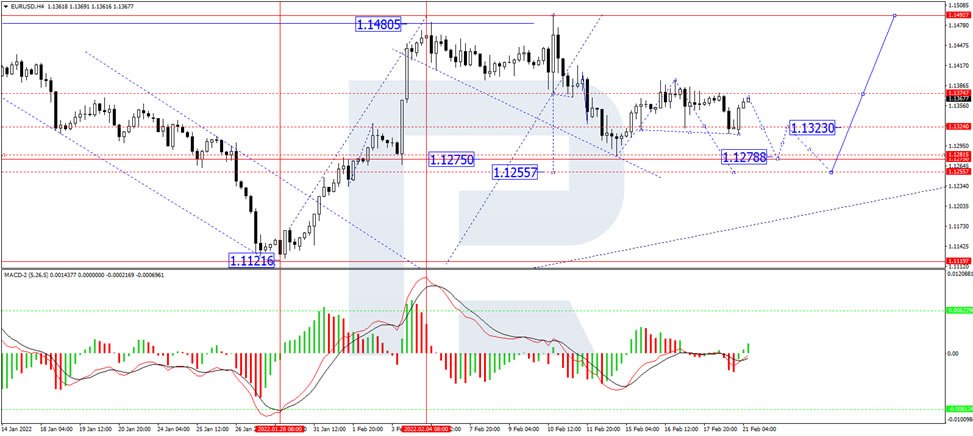
In the H4 chart, having finished another descending wave at 1.1313 along with the correction towards 1.1360, EUR/USD is consolidating below the latter level. If later the price breaks this range to the upside, the market may start another growth towards 1.1404 and then resume falling to break 1.1330. After that, the instrument may continue trading downwards to reach 1.1255 and then form one more ascending wave with the target at 1.1500. From the technical point of view, this scenario is confirmed by MACD Oscillator: its signal line is growing to break 0 and then continue moving towards new highs.
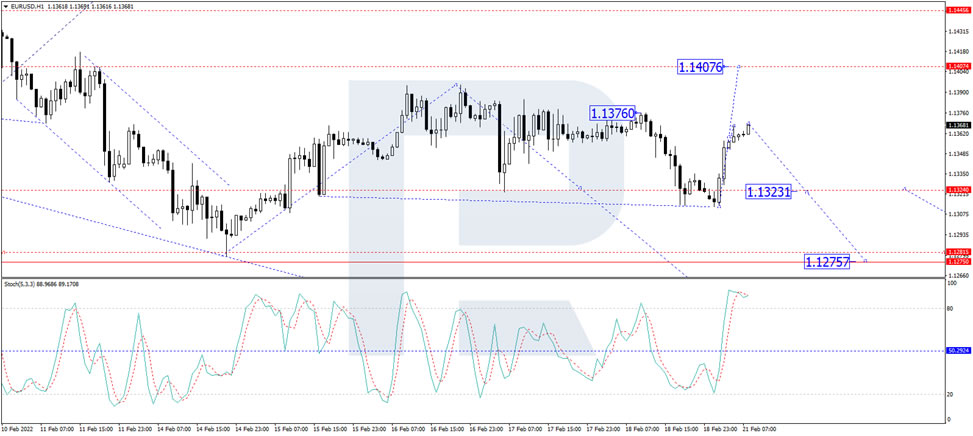
As we can see in the H1 chart, after rebounding from 1.1313, EUR/USD is forming a new ascending impulse and may soon reach 1.1360. After that, the asset is expected to consolidate around the latter level and break the range upwards to reach 1.1390. Later, the market may resume falling to return to 1.1360 and then start another growth towards 1.1404. In the future, the instrument may form a new descending wave with the target at 1.1330. From the technical point of view, this idea is confirmed by the Stochastic Oscillator: its signal line is moving above 80 and may resume falling to reach 50. Later, the line may rebound from 50 and start a new growth to return to 80.
Bundesbank: German economy to decline in Winter, pick up again in Spring
Bundesbank said in the latest monthly report that German economic output is likely to decline noticeably again in the winter quarter of 2022.
But economic prospects are "good". It said, "in view of the very good demand situation, the German economy should pick up speed again in the spring, provided that the pandemic subsides and the supply bottlenecks continue to ease."
"Thus, from today's perspective, the economic outlook is only slightly less favorable than expected in the projections from December 2021, despite the increased burden caused by the pandemic and high inflation,"conclude the experts.
GBP/USD Outlook: Cable Regains Traction on Optimistic News
Bulls tighten grip on Monday, driven by news of possible Biden-Putin meeting over Ukraine that revived risk appetite at the beginning of the week.
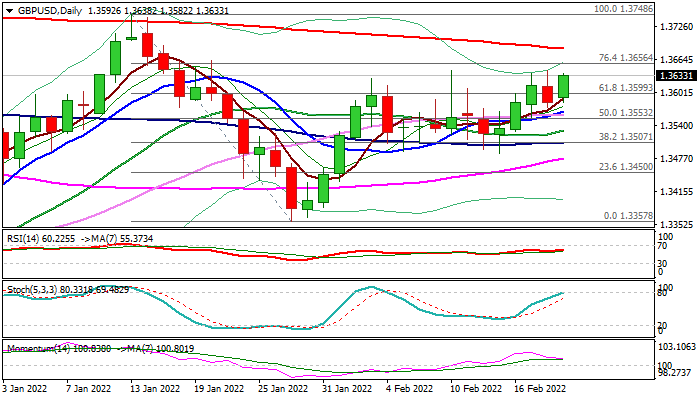
Fresh strength pressures tops of past two days (1.3638/42) which lay just ahead of pivotal Fibo barrier at 1.3656 (76.4% of 1.3748/1.3357), break of which would expose 200DMA (1.3685) and open way for attack at 2022 high (1.3748, posted on Jan 13).
The action is supported by bullish daily studies, although weakening bullish momentum may slow the advance for extended consolidation.
Solid bids at 1.3600 (former key resistance reverted to support) and 1.3566 (rising 10DM) should contain dips and offer better buying opportunities.
Res: 1.3642; 1.3656; 1.3685; 1.3748.
Sup: 1.3600; 1.3582; 1.3566; 1.3553.
Pound Rises on Strong Services PMI
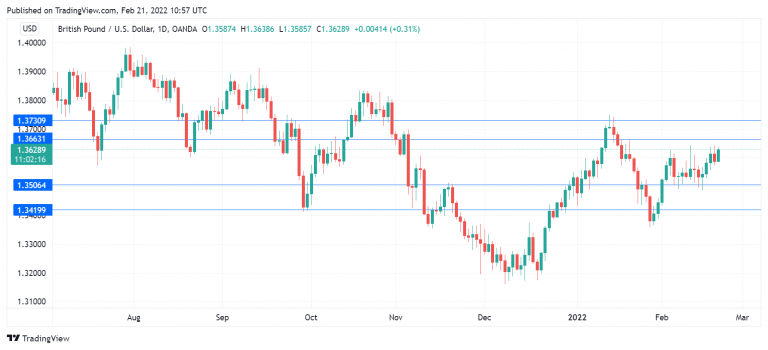
The pound has posted gains at the start of the week, punching above the 1.36 line. In the European session, GBP/USD is trading at 1.3634, up 0.35% on the day.
PMIs points to UK rebound
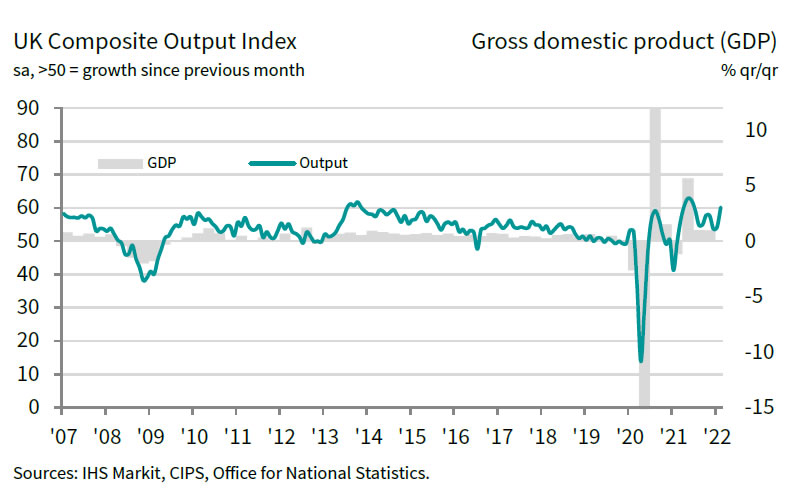
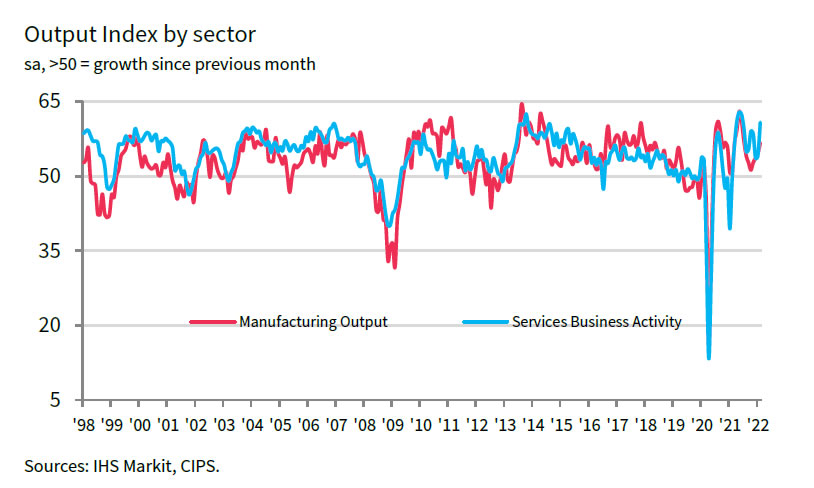
The UK economy continues to grow and has rebounded after a bump from Omicron in January. Manufacturing and services both showed significant expansion for February, boosted by the cancellation of most Covid restrictions. Manufacturing PMI remained steady at 57.3, while the Services PMI impressed with a reading of 60.8, up from 54.1 beforehand. The strong numbers point to a resilient economy, with inflation at its highest level in 30 years.
The impressive PMI numbers have reinforced expectations that the BoE will raise interest rates at its March meeting. This would mean an unprecedented third successive rate hike by the central bank. The BoE will likely implement a hike of 25 basis points, which would raise the cash rate to 0.75%. What will happen after March? We’re likely to see further hikes in order to wrestle down inflation, but the exact number of hikes will depend on how strong inflation is and the strength of the economy.
There have been further skirmishes between the Ukraine army and the pro-Russian separatists, with fears that Russia is deliberately creating these flare-ups in order to justify an invasion of Ukraine. Russia has over 100 thousand troops around the border with Ukraine, and could choose to invade at any time. However, there have been some diplomatic maneuvering in the meantime, notably a possible meeting between Presidents Biden and Putin. Biden expressed his willingness to meet Putin if there was no invasion. The situation in Ukraine remains very tense, and market direction in the coming days will depend to a large extent on developments in this global crisis.
- There is resistance at 1.3662 and 1.3731
- There is support at 1.3506 and 1.3419
Ukraine Summit Hopes Lift Euro, Gold Elevated But Off Highs
- Biden and Putin agree to hold talks as Russia and Ukraine on the brink of war
- Gold’s advance halted at $1,900/oz as risk tone recovers
- Euro is revived, strong PMIs help too; dollar and yen pull back
Simmering tensions over Ukraine continued to keep investors on edge at the start of the new trading week even as hopes of a peaceful resolution for the crisis were kept alive by a last-ditch effort by France. The French President Emmanuel Macron has reportedly persuaded the US and Russian leaders to hold a summit to prevent the breakout of an all-out-war in Ukraine.
However, while both US President Joe Biden and Russian President Vladimir Putin have “agreed in principle”, the Kremlin is downplaying the prospect of an imminent meeting, with Putin’s spokesman saying, “it’s premature to talk about specific plans for a summit”.
The latest developments suggest the markets’ rollercoaster ride is far from being over just yet as the Ukraine crisis has erupted at a time when traders are also grappling with tightening monetary policy around the world amid soaring inflation.
Some market participants have already started to question whether central banks would be able to proceed with their plans to remove stimulus should Russia invade Ukraine. Though, in reality, policymakers may have no choice but to slam on the brakes even harder if an invasion triggers Russian sanctions, pushing energy prices even higher.
Easing tensions thwart gold’s bid to crack $1,900
With the threat of Russia launching the biggest war in Europe since World War II hanging over the markets, gold has been on a roll this month, briefly hitting the $1,900/oz mark earlier today for the first time since June 2021. The geopolitical turmoil has positioned gold as one of the best performing assets in the year-to-date, surpassed only by oil among the major commodities.
The precious metal is currently trading slightly below the $1,900 level following the news that there may yet be a diplomatic way out of the Ukraine standoff. However, the fact that the pullbacks in bullion prices on positive headlines have not been as great as the gains from fresh escalations can only imply that investors are becoming increasingly worried about the situation.
Oil prices have also barely receded whenever nerves have been calmed by renewed dialogue between Western, Russian and Ukrainian leaders. Growing signs that a deal with Iran on its nuclear programme is getting close has not had much impact in hampering the rally.
Upbeat PMIs add to improved appetite in FX markets
Meanwhile, in the currency markets, the euro was enjoying a strong bump up from the slight easing in Ukraine frictions. The single currency was further lifted from upbeat flash PMI numbers out of the Eurozone today that showed growth perked up more sharply than expected in February, hitting the fastest in eight months.
As long as nothing jeopardises the euro area’s recovery and inflationary pressures stay heated, the ECB will have no excuse but to end its quantitative easing programme in Q2 or Q3, sooner than it is currently projecting.
The euro was last quoted around $1.1360, while the pound also got a boost from solid UK PMI data to stand 0.3% firmer.
The risk sensitive aussie and kiwi were the other big beneficiaries from today’s brightened mood, which weighed on the safe haven US dollar and Japanese yen, though not so much on the Swiss franc.
Dollar struggles as cautious Fed adds to woes
The dollar index has started the week on the back foot, skidding by about 0.25%. Aside from the fresh hopes of war being averted by a possible Biden-Putin summit, the dollar has been somewhat struggling lately from tempered expectations that the Federal Reserve will hike rates by 50 basis points in March.
Fed officials speaking over the weekend downplayed the need for an aggressive move in rates at the next meeting as the influential head of the New York Fed, John Williams, became the latest to argue against “a big step”.
US 500 Index Surrounded by Bearish Technicals
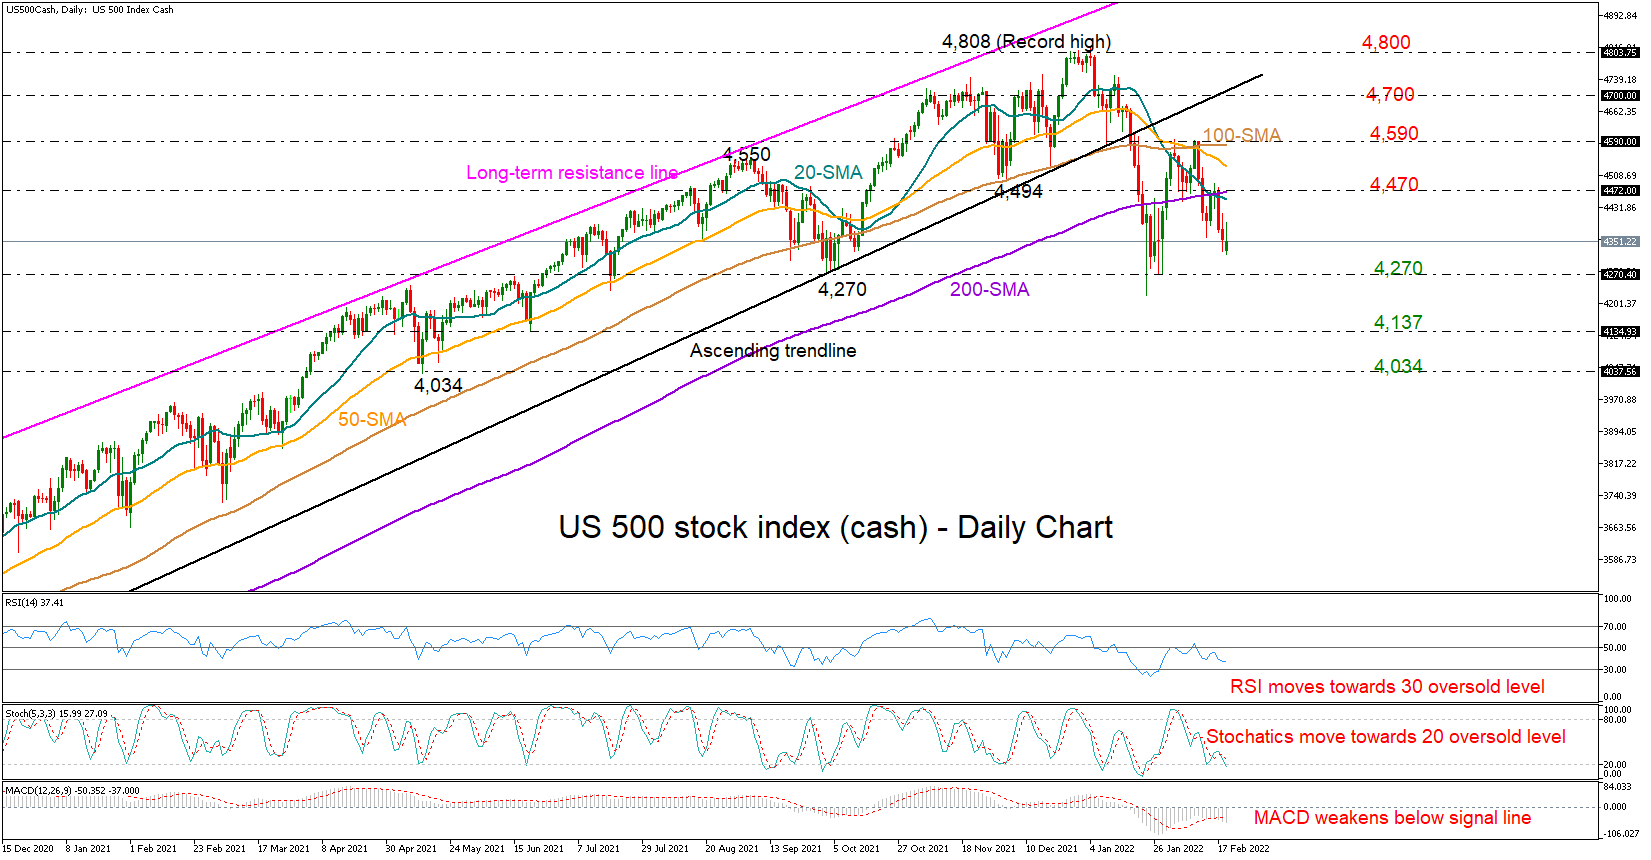
The US 500 stock index (cash) faced a tough wall near its 20- and 200-day simple moving averages (SMAs) last week, which negatively crossed each other for the first time since March 2020, raising worries the pullback from the record high of 4,808 could gain extra legs.
Structurally, the index sustains a neutral outlook as the latest sell-off has not successfully violated the key low of 4, 270 from September 30 despite the flash drop to 4,221 at the end of January. That said, the falling 50-day SMA continues to reduce its distance with the 200-day SMA, feeding caution that a bearish pattern could still take shape in the chart.
In the meantime, the momentum indicators are not favoring bullish actions. The RSI and the Stochastics are decelerating towards their oversold levels, while the MACD is negatively charged below its red signal and zero lines, suggesting a continuation towards the 4,270 low. If sellers manage to crack that floor, the price could retest the 4,221 trough before tumbling to 4,137. Running lower, some consolidation could emerge around May’s low of 4,034.
In the event the bulls take the lead, the focus will be on the 20- and 200-day SMAs and the 4,472 resistance. A successful penetration at this point could clear the way towards the 100-SMA and the 4,590 ceiling unless the 50-day SMA eases bullish pressures beforehand. Any step higher could bolster buying appetite, bringing the broken ascending trendline next into view near 4,700.
Summarizing, the US 500 stock index is surrounded by bearish tides in the short-term picture and, despite its sideways trajectory over the past four months, risks for a downtrend extension remain alive.
AUD/USD Pair Moved into a Positive Zone from 0.7150
The Aussie Dollar started a fresh increase from the 0.7120 support zone against the US Dollar. The AUD/USD pair traded above the 0.7150 level to move into a positive zone.
The pair even traded above the 0.7200 level and the 50 hourly simple moving average. Recently, it cleared a key connecting bearish trend line with resistance near 0.7188 on the hourly chart. An immediate resistance on the upside is near the 0.7215 level.
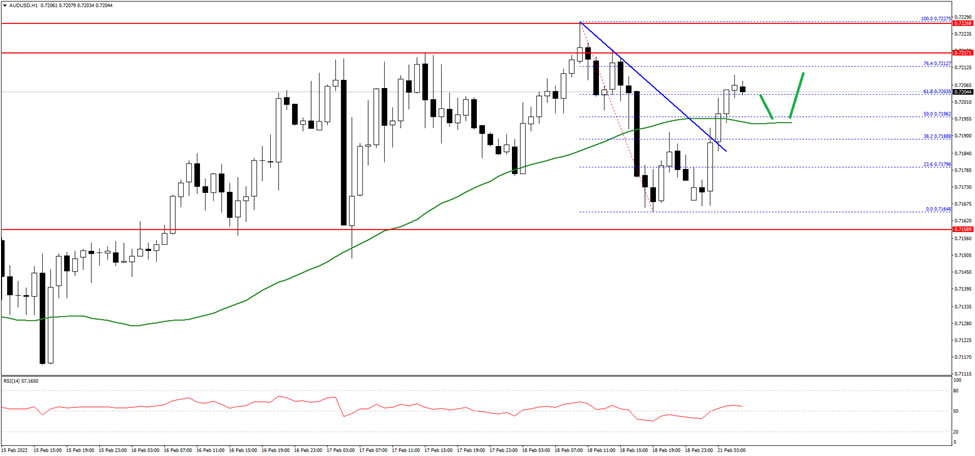
The next major resistance is near the 0.7220 level, above which the pair could rise steadily towards the 0.7250 level in the near term. Any more gains could send the pair towards 0.7280 on FXOpen.
An immediate support on the downside is near the 0.7195 level. The next key support is near the 0.7180 level. A clear break below the 0.7180 support could lead the pair towards the 0.7120 support.
UK PMI Manufacturing unchanged at 57.3, services jumped to 60.2
UK PMI Manufacturing was unchanged at 57.3 in February, below expectation of 57.5. PMI Services surged from 54.1 to 60.8, above expectation of 55.2, an 8-month high. PMI Composite rose from 54.2 to 60.2, also an 8-month high.
Chris Williamson, Chief Business Economist at IHS Markit, said:
"The latest PMI surveys indicate a resurgent economy in February, as business activity leapt as COVID-19 containment measures were relaxed.
"With the PMI's gauge of output growth accelerating markedly in February and cost pressures intensifying to the second-highest on record, the odds of an increasingly aggressive policy tightening have shortened, with a third back-to-back rate rise looking increasingly inevitable in March.
"However, the indications of a growing plight for manufacturers will need to be watched, and the service sector's new business index will need to be monitored for signs of the demand revival losing steam. Given the rising cost of living, higher energy prices and increased uncertainty caused by the escalating crisis in Ukraine, downside risks to the demand outlook have risen."