

Sample Category Title
WTI oil rises on geo tension, ready for breakout to 100?
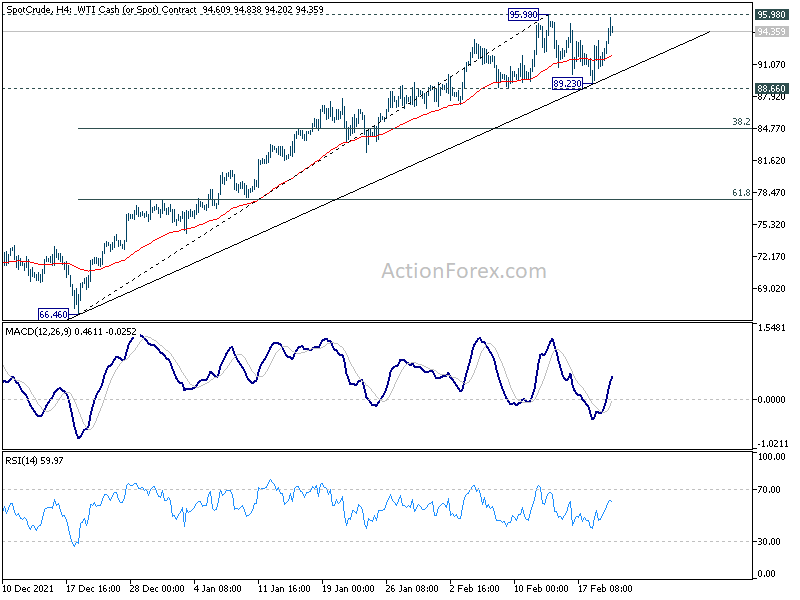
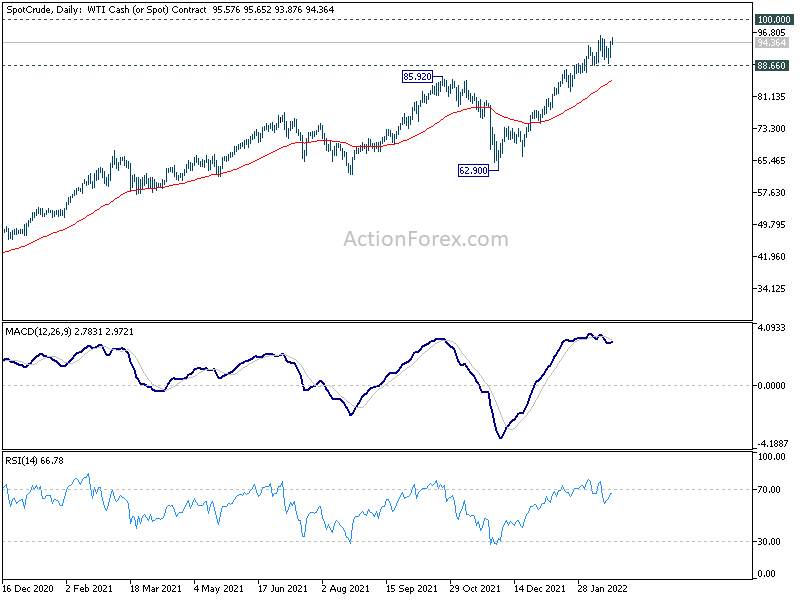
WTI crude oil edged higher today and it's now pressing 95.98 resistance. Any deterioration in geopolitical situation could forcefully push WTI through this resistance to resume the medium term up trend. Next target will be 100 psychological level.
Rejection by 95.98 will extend the corrective pattern from 95.98 with another falling leg, possibly back to 89.23 support. But 88.66 support should provide the floor in this case, to set up the range for sideway trading.
Gold breaks 1900, upside acceleration ahead?
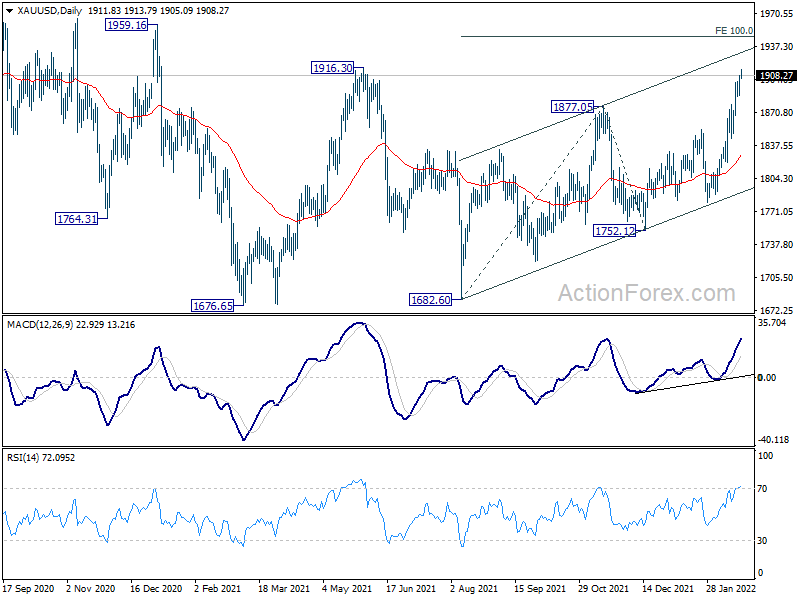
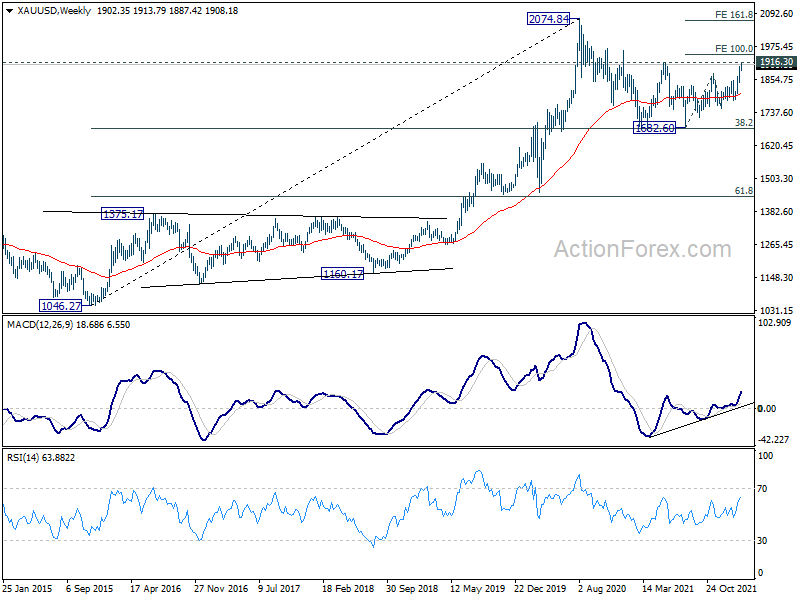
Gold's rally resumes today and hits as high as 1913.79 so far, breaking 1900 handle. It's now eyeing 1916.30 resistance. Break there will extend current rise from 1682.60 to 100% projection of 1682.60 to 1877.05 from 1752.12 at 1946.57.
Also, it should be pointed out that, firstly, sustained break of 1916.30 should confirm that whole correction from 2074.84 (2020 high) has completed at 1682.60, after defending 38.2% retracement of 1046.27 to 2074.84. Secondly, sustained break of 1946.57 would likely bring upside acceleration.
In this case, Gold could be quickly shot up to 161.8% projection at 2066.74, which is close to 2074.84 high.
Technical Outlook and Review
DXY:
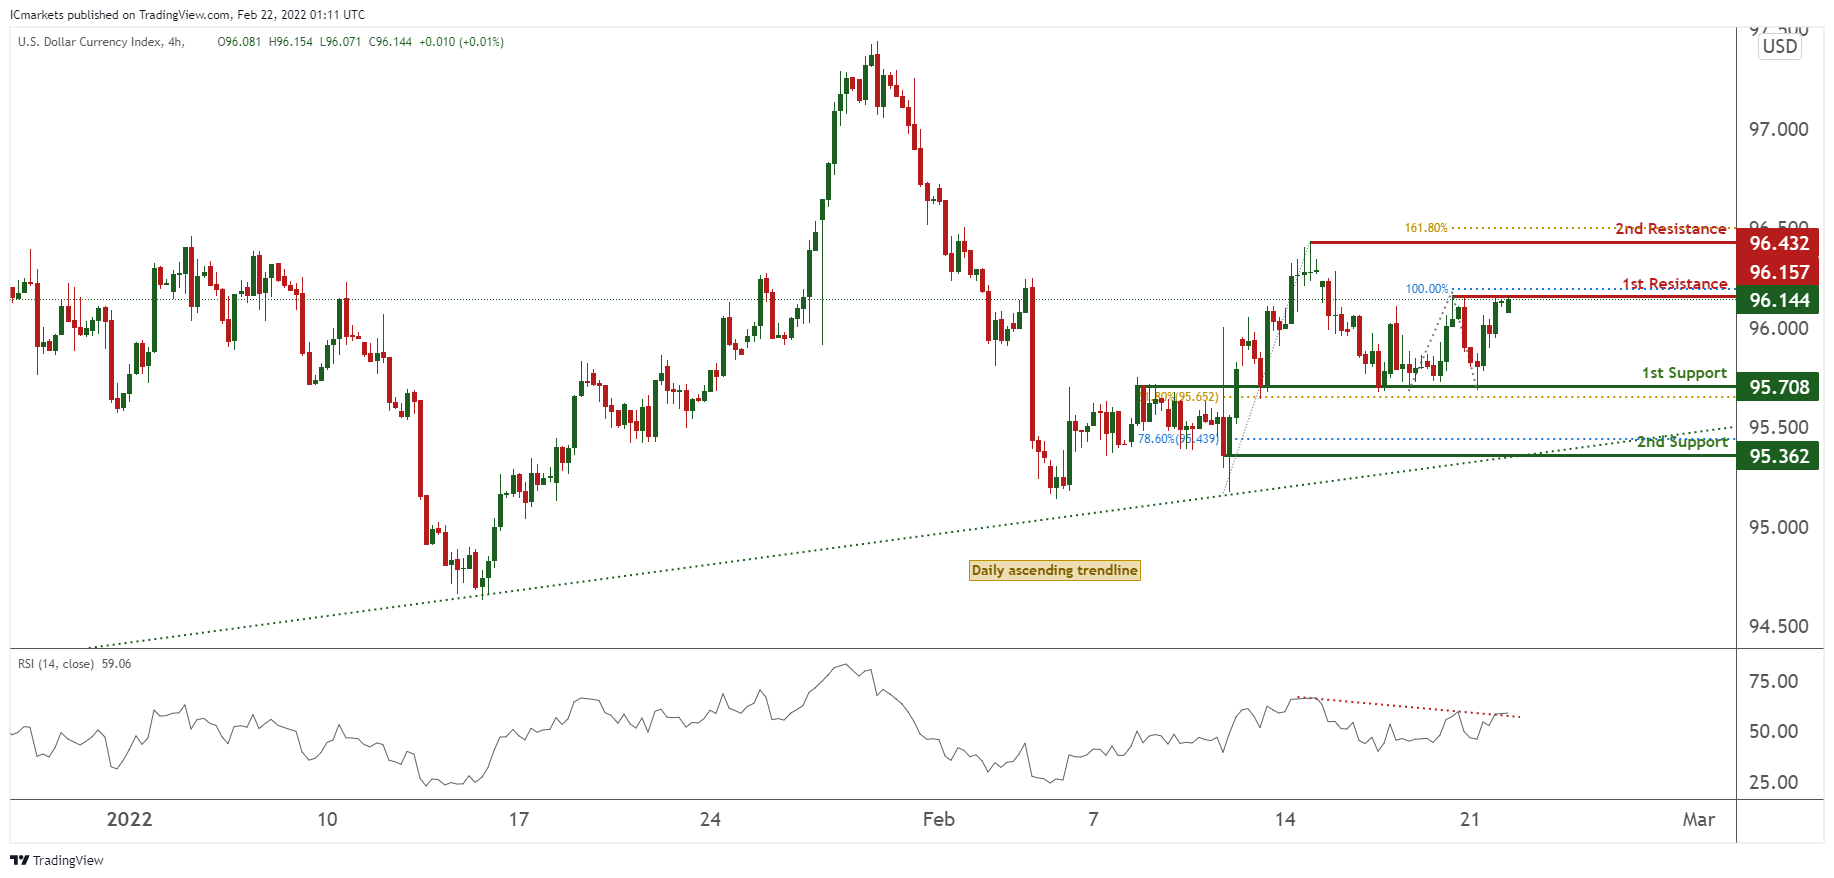
On the H4, prices are at a pivot and recent swing high. We see potential for a short pullback from our 1st resistance at 96.157 in line with 100% Fibonacci extension towards our 1st support at 95.708 in line with 61.8% Fibonacci retracement. RSI are showing bearish momentum, further supporting our bearish bias.
Areas of consideration:
- H4 time frame, 1st resistance at 96.157
- H4 time frame, 1st support at 95.708
XAU/USD (GOLD):
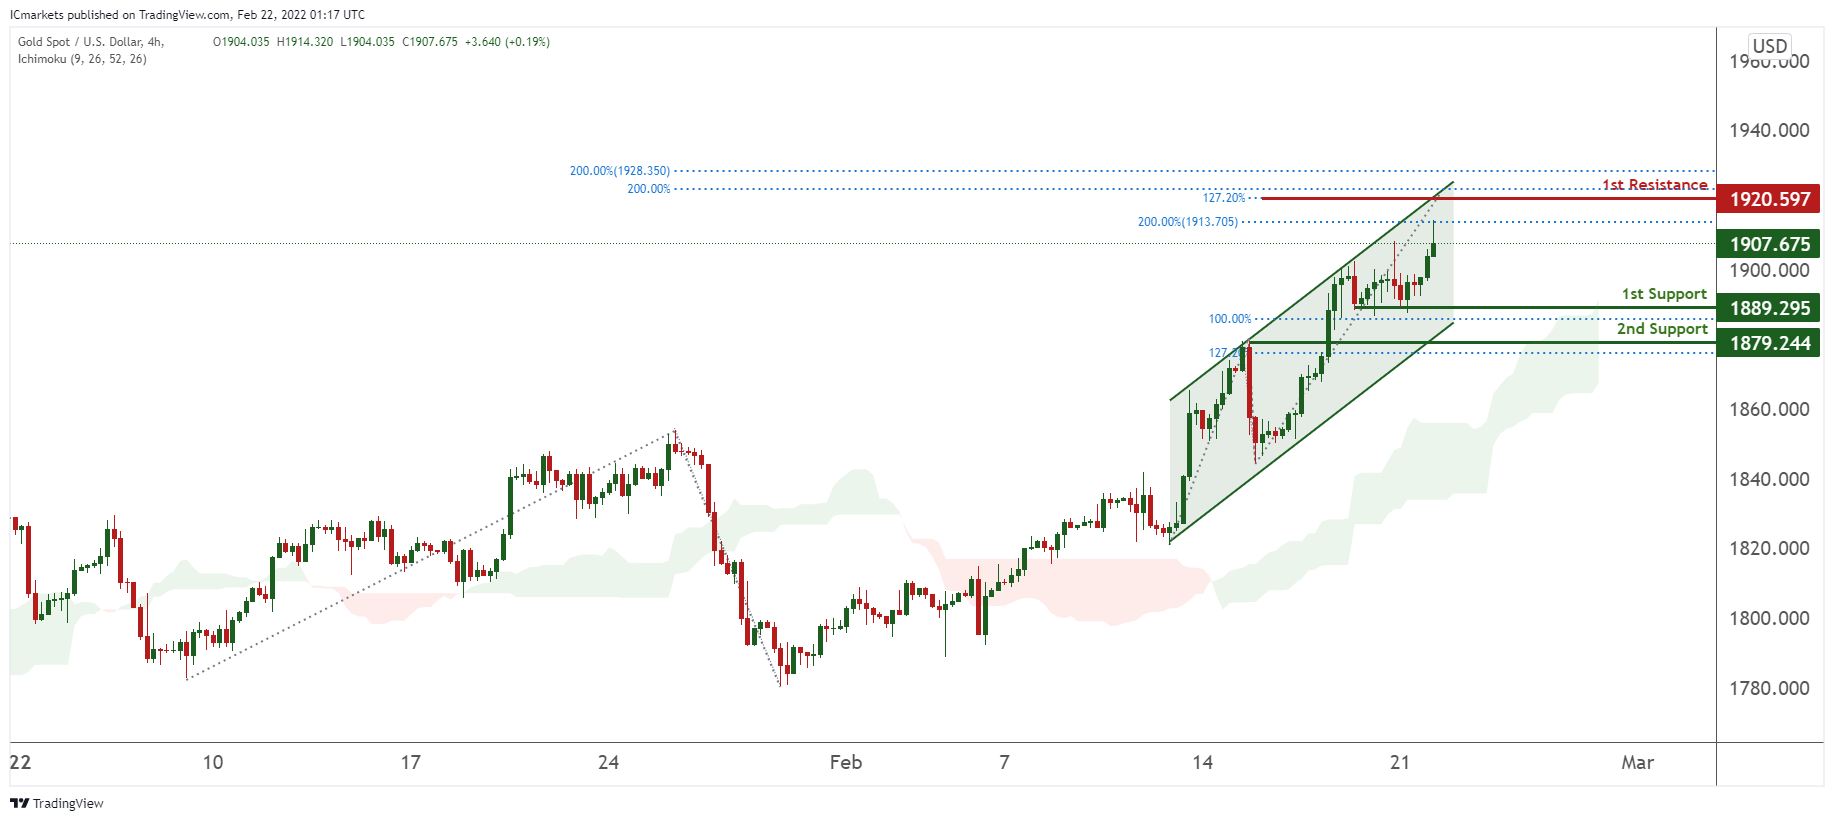
On the H4 chart, prices are on bullish momentum and abiding to our ascending channel. We see potential for bullish continuation from our 1st support at 1889.295 in line with 100% Fibonacci extension towards our 1st resistance at 1920.597 in line with which is an area of Fibonacci confluences. Prices are trading above our Ichimoku support, further supporting our bullish bias.
Areas of consideration:
- 4h 1st support at 1889.295
- 4h 1st resistance at 1920.597
GBP/USD
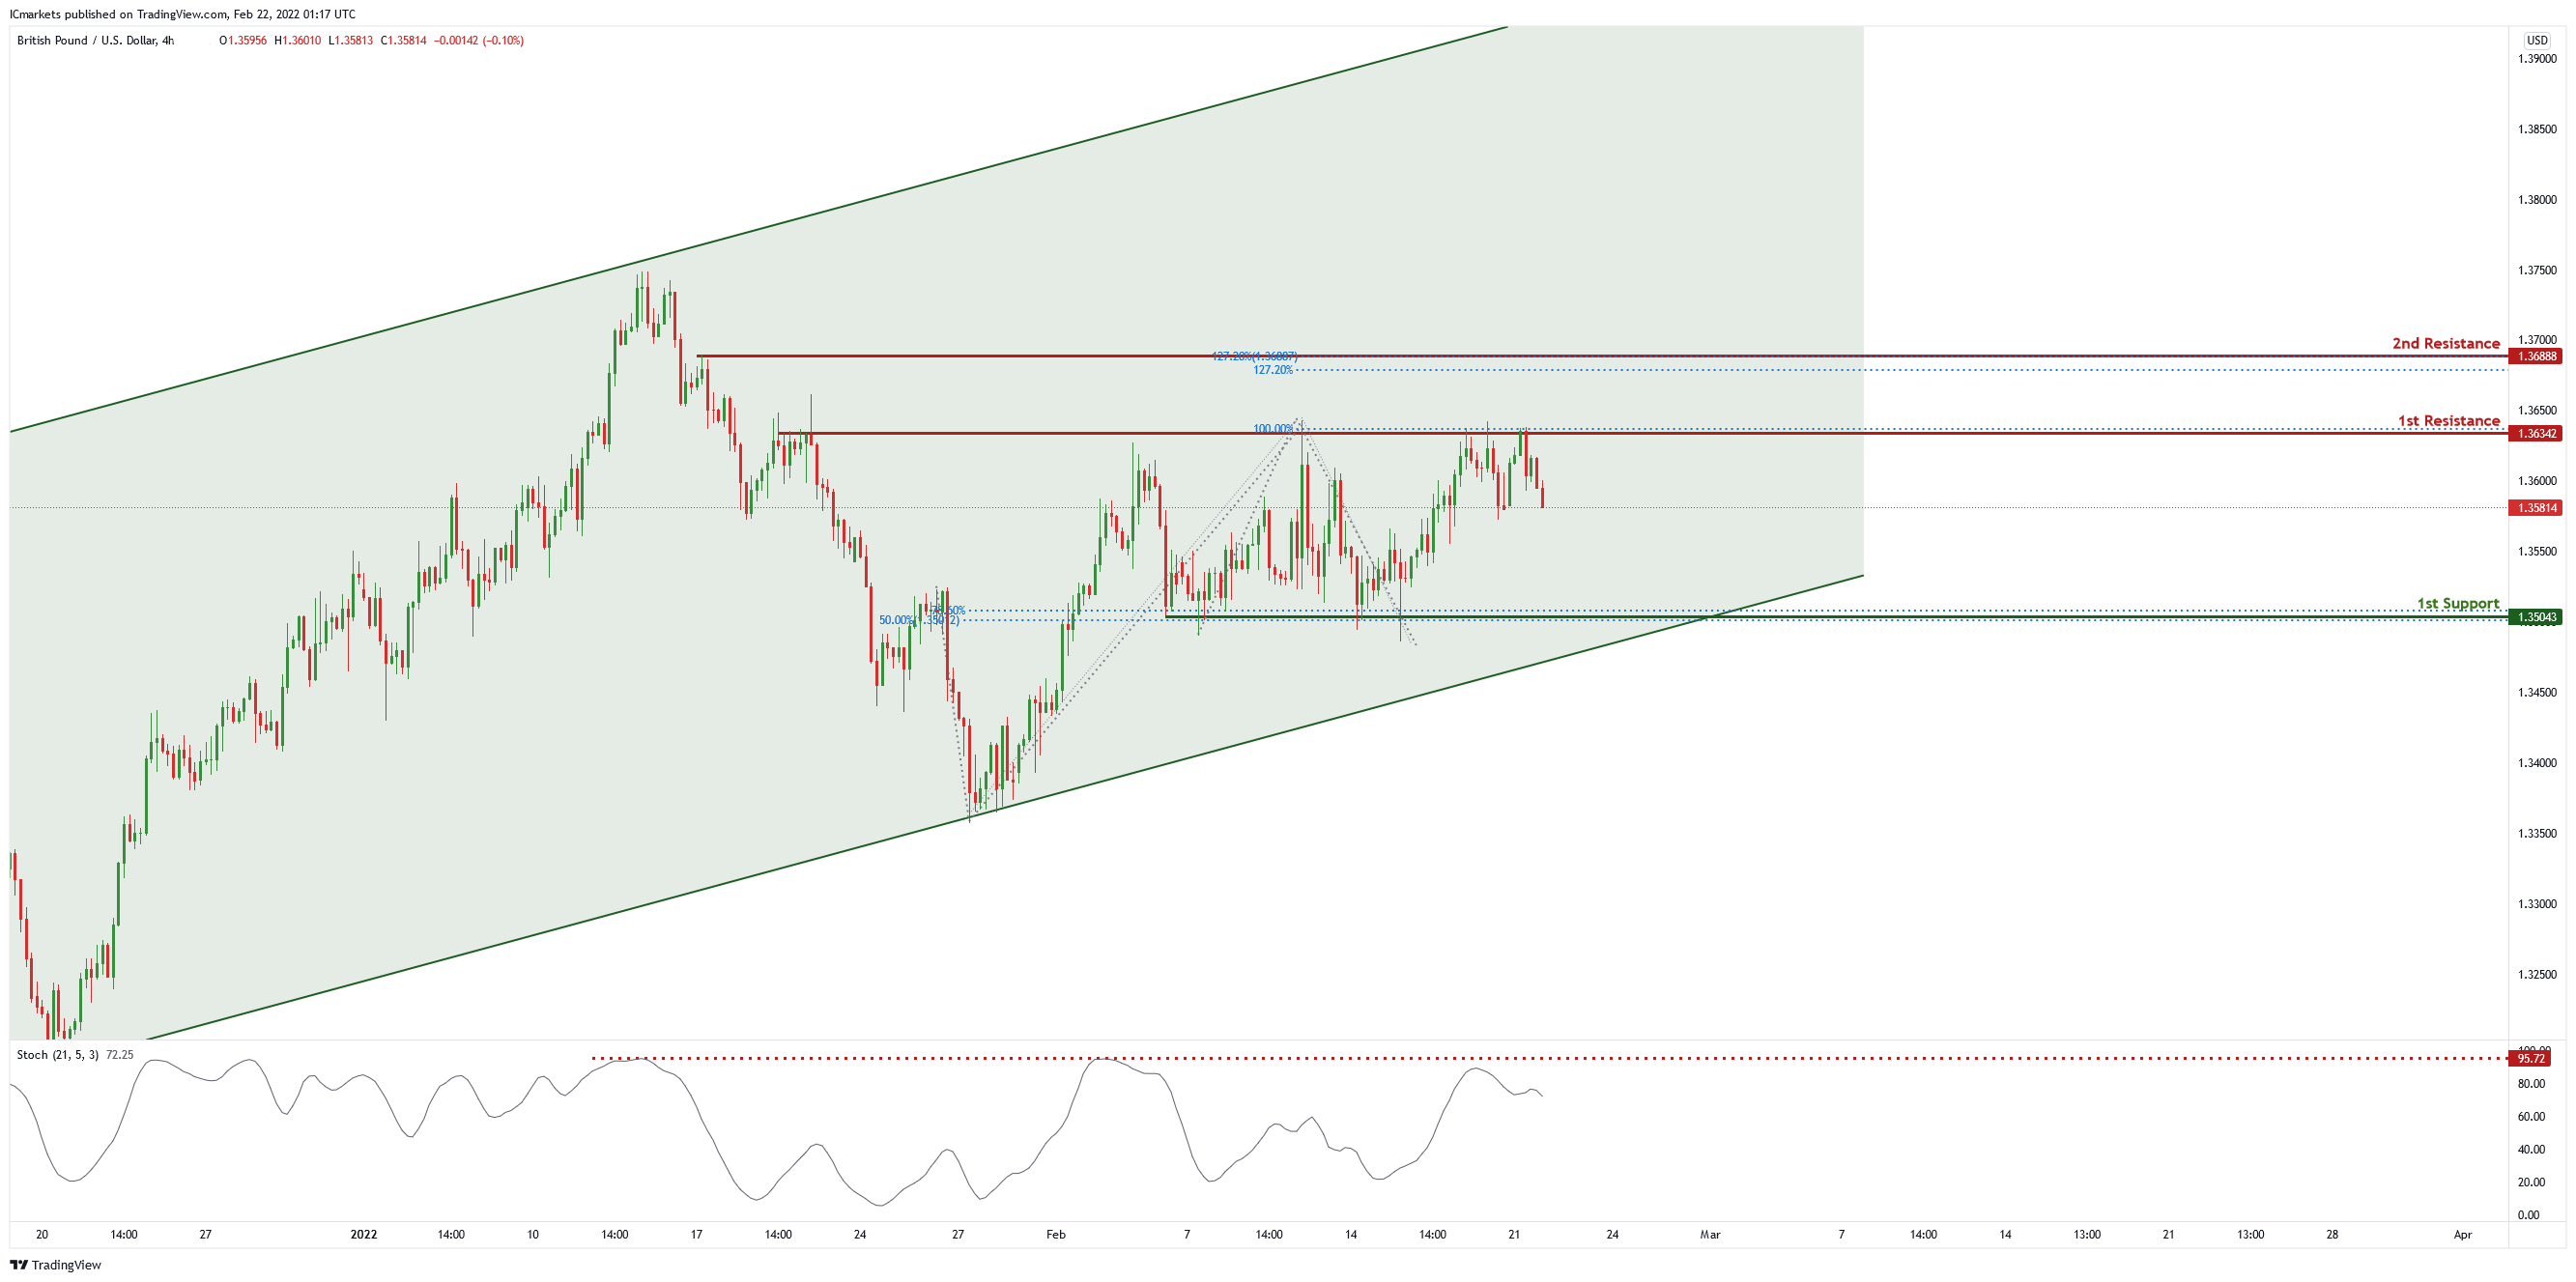
On the H4 chart , price is near 1st resistance level of 1.36342 in line with 61.8% Fibonacci retracement and 100% Fibonacci projection. Price can potentially dip to the take profit level of 1.35043 in line with 50% Fibonacci retracement and 78.6% Fibonacci projection . Our bearish bias is supported by the stochastic indicator as it is near resistance level.
Areas of consideration
- H4 1st resistance at 1.36342
- H4 1st support at 1.35043
USD/CHF:
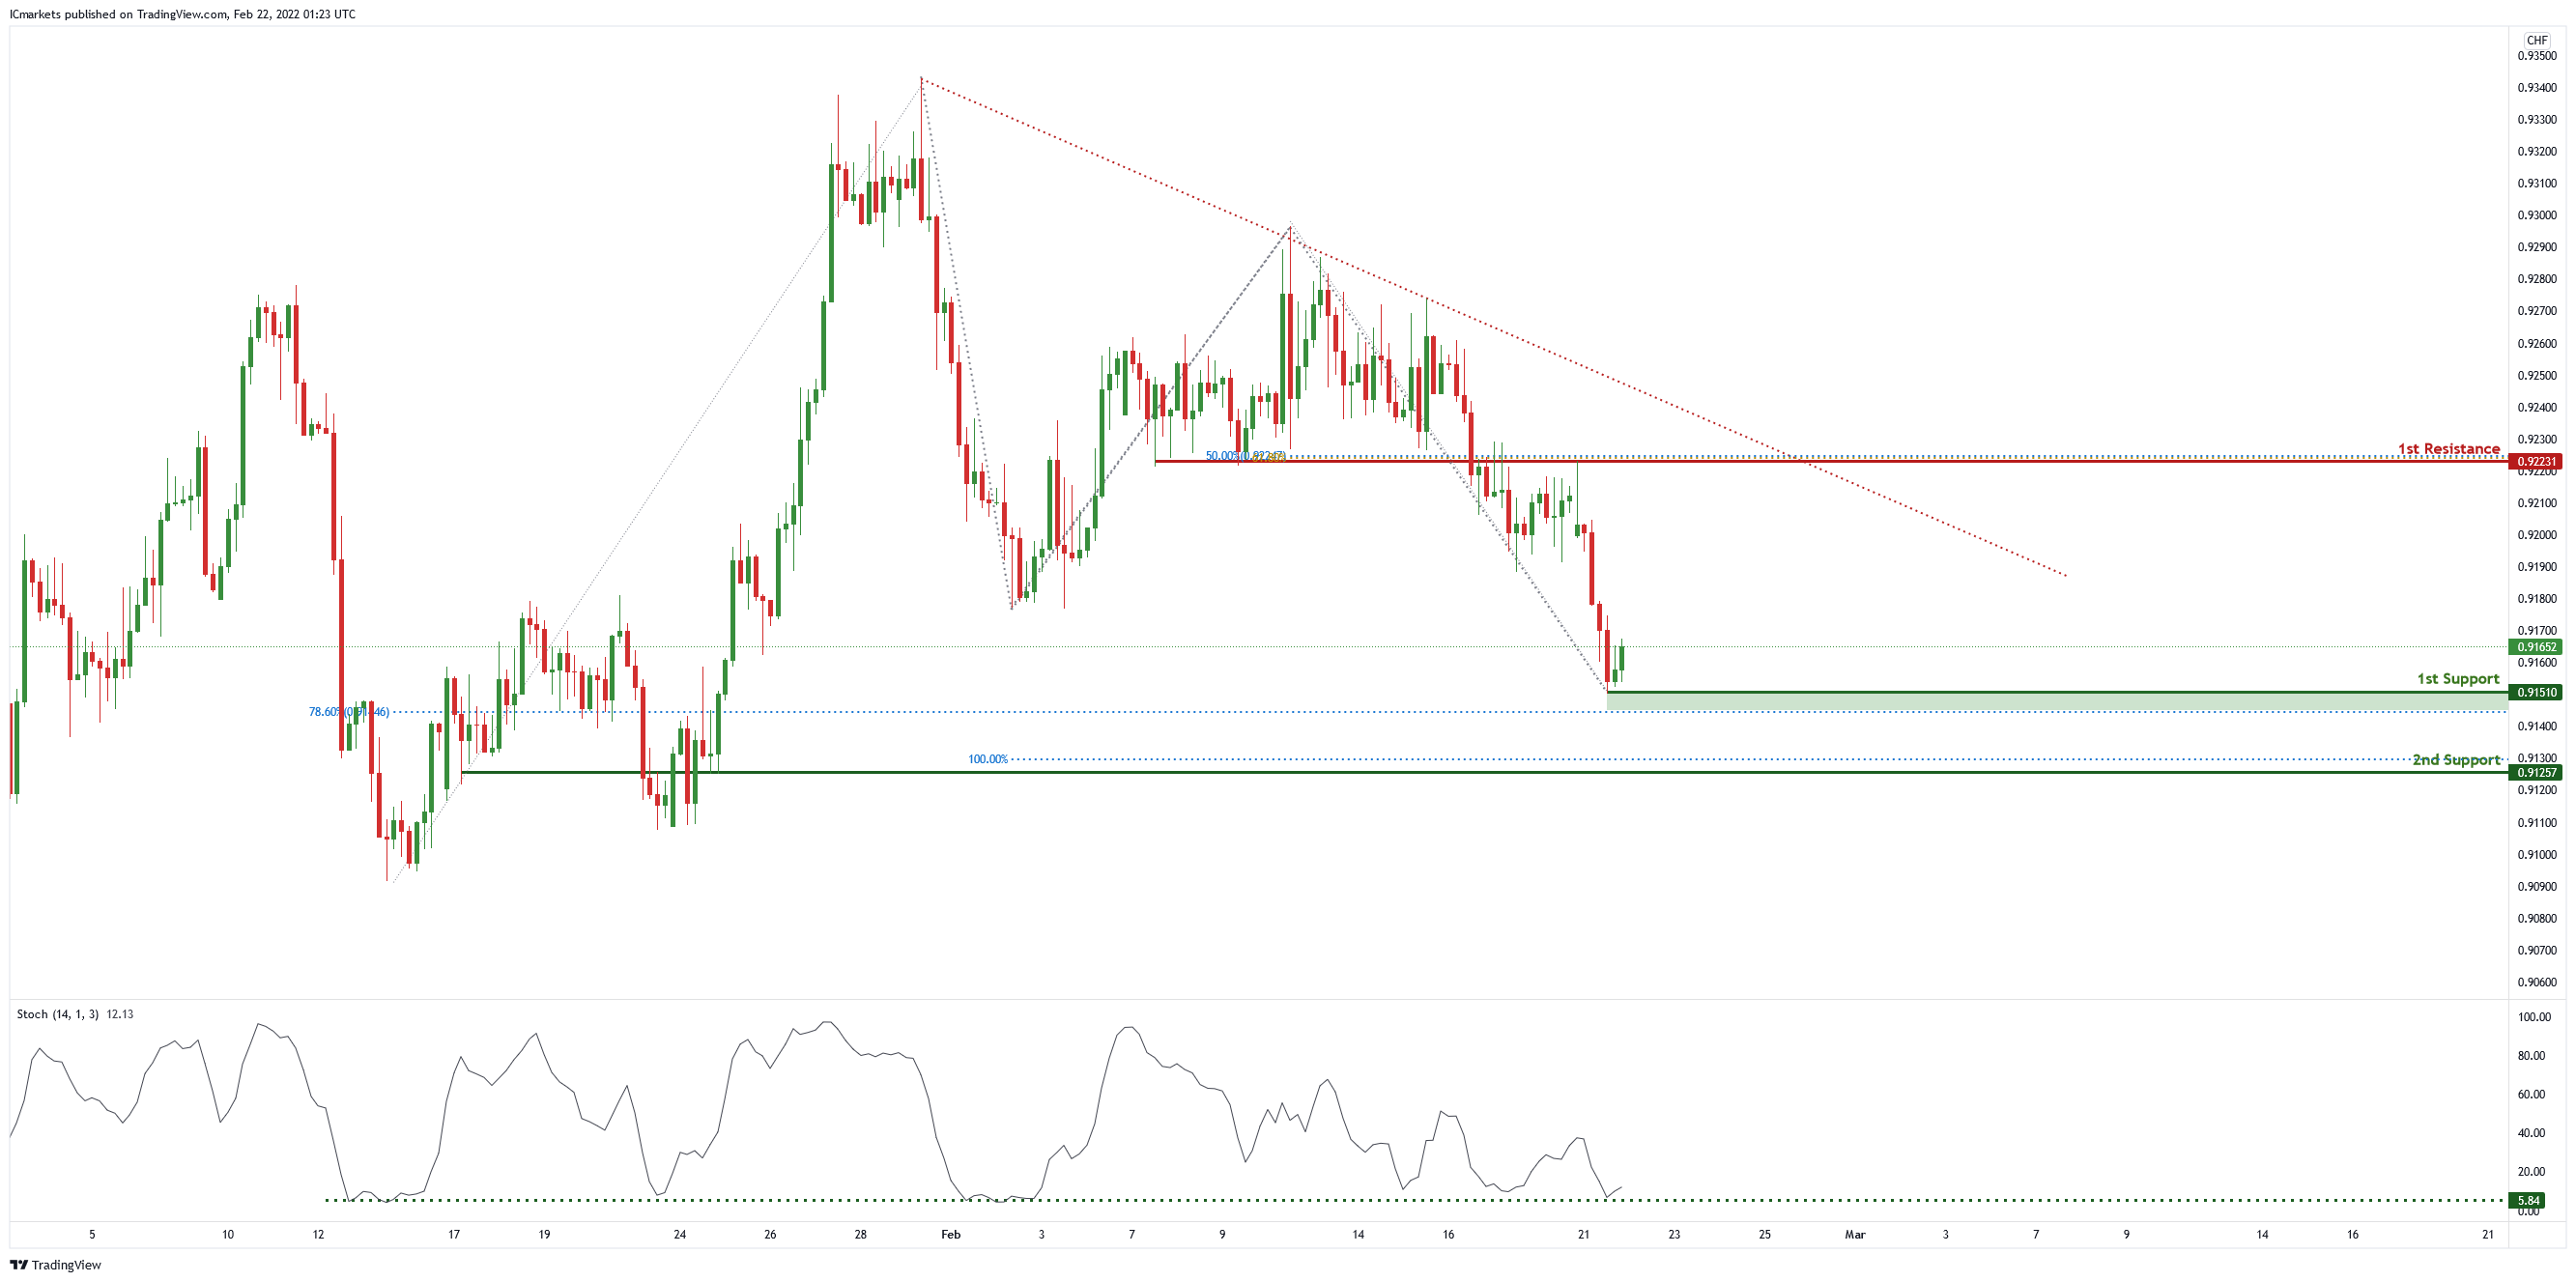
On the H4 chart price is abiding by a descending trendline and near 1st support of 0.91510 in line with 78.6% Fibonacci retracement. Price can potentially bounce to the 1st resistance of 0.92231 in line with 50% Fibonacci and 61.8% Fibonacci projection. Our bullish bias is supported by the stochastic indicator as it is at support level.
Areas of consideration :
- H4 1st resistance at 0.92231
- H4 1st support at 0.91510
EUR/USD :
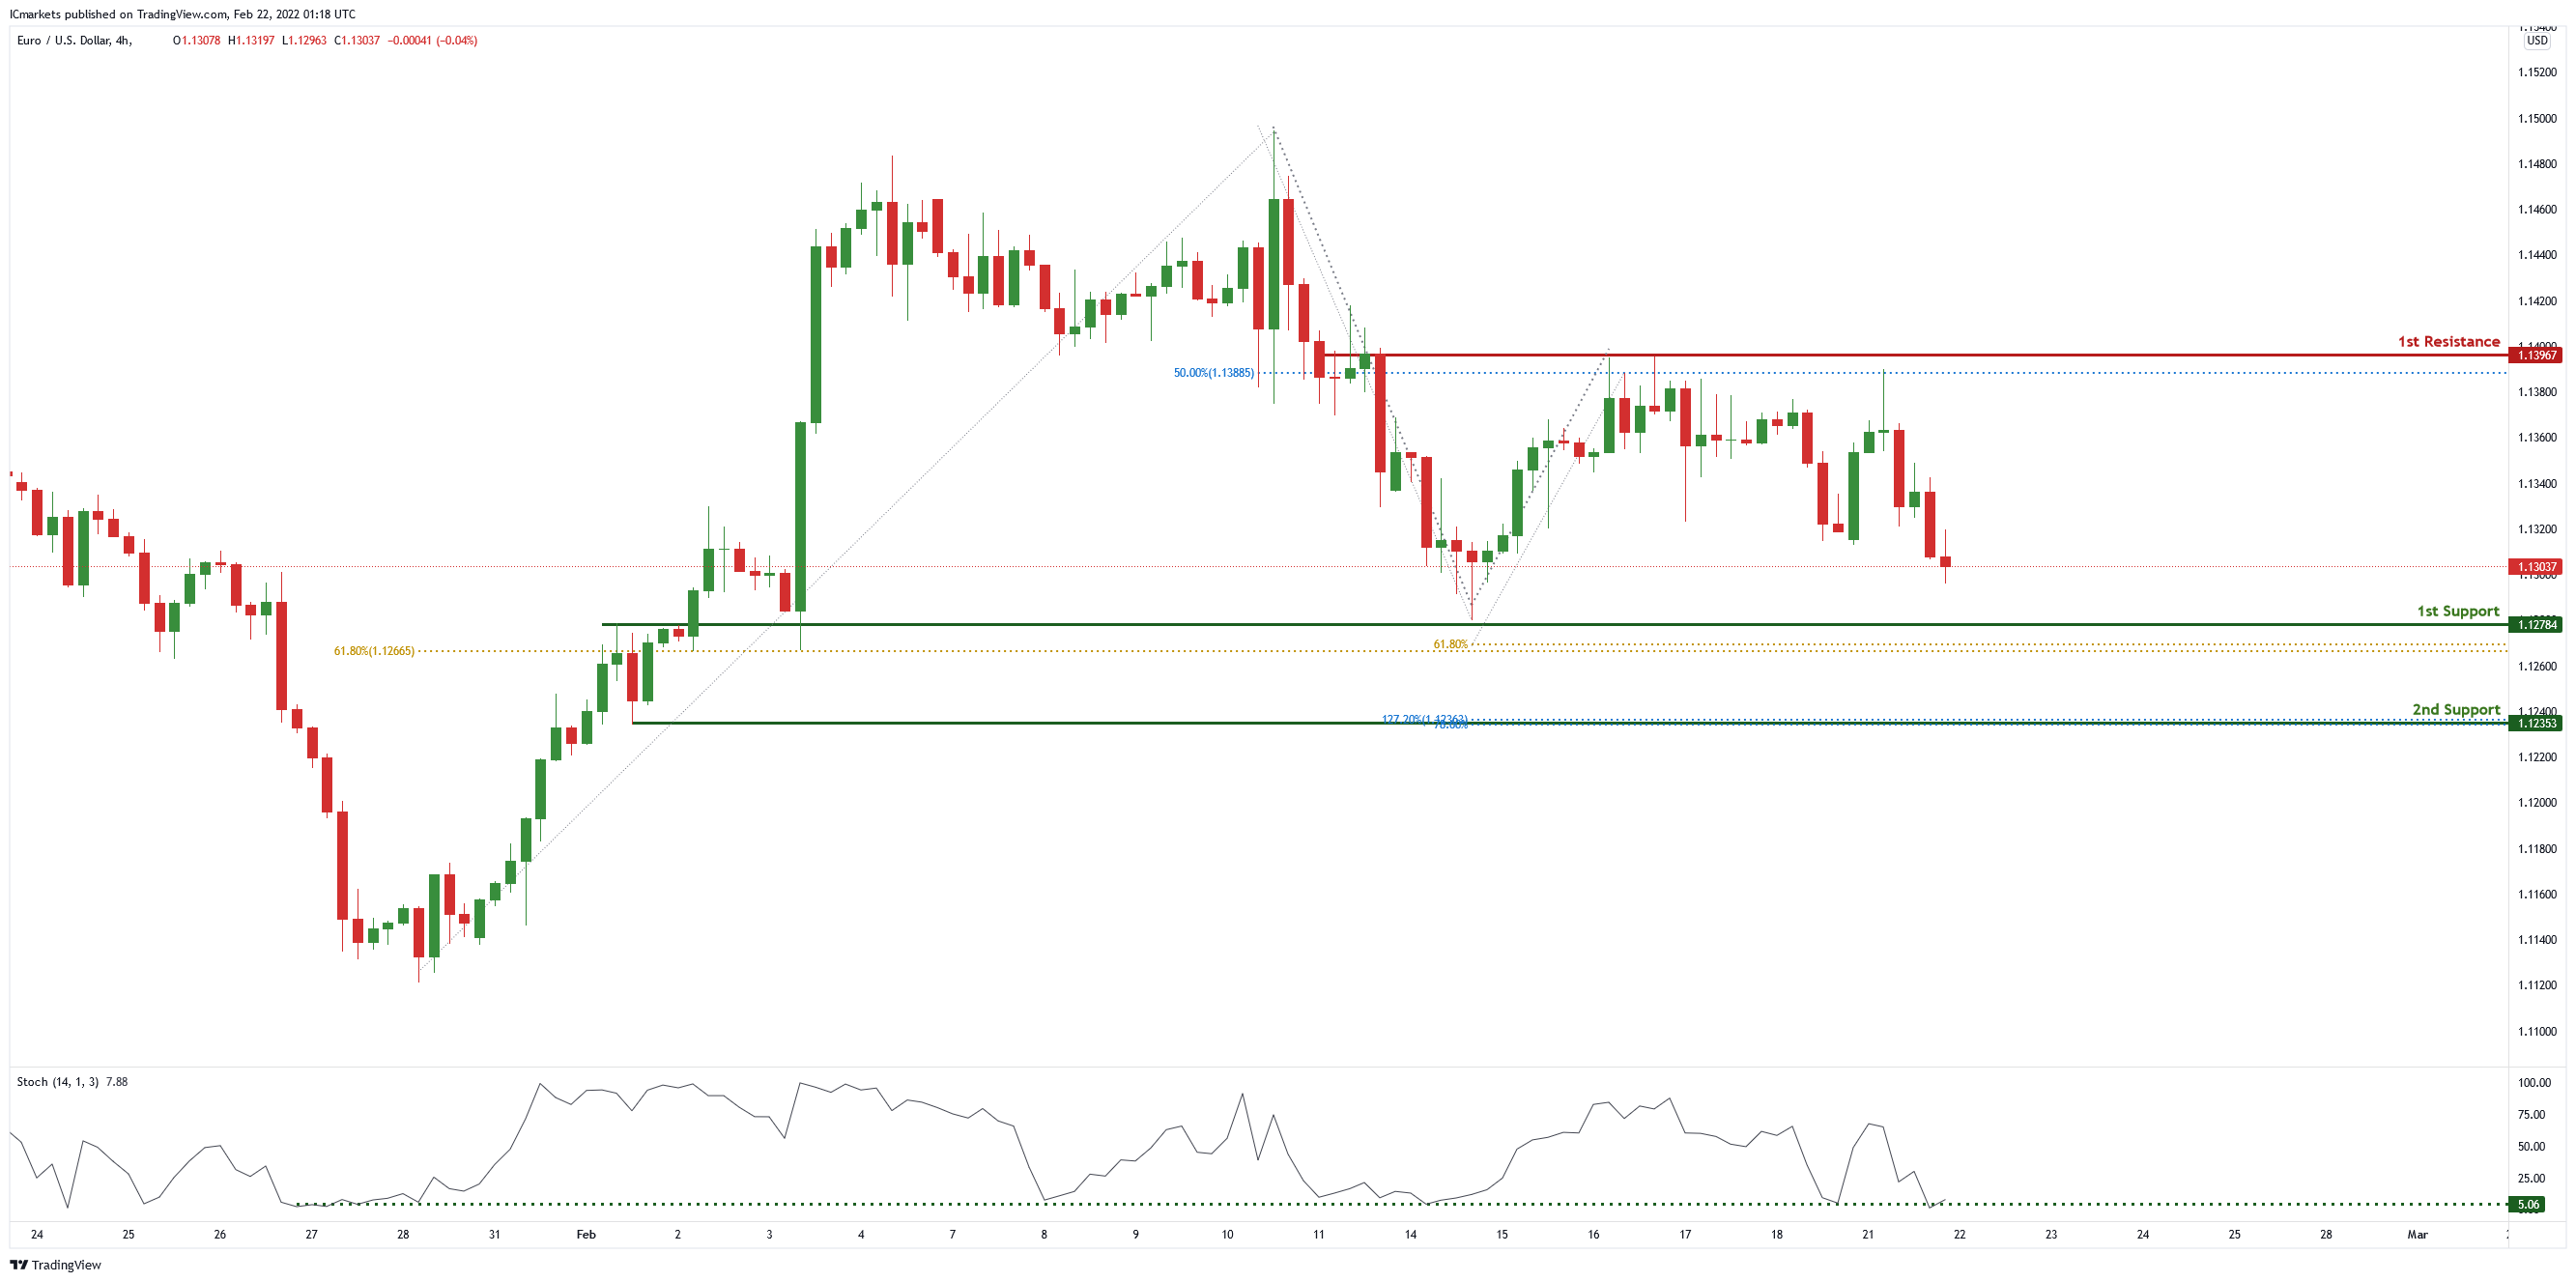
On the H4 chart price is near 1st support level of 1.12784 in line with 61.8% Fibonacci retracement and 61.8% Fibonacci projection. Price can potentially go to the 1st resistance level of 1.13967 in line with 50% Fibonacci retracement. Our bullish bias is supported by the stochastic indicator as it is at support level.
Areas on consideration :
- H4 1st support at 1.12784
- H4 1st resistance at 1.13967
USD/JPY:
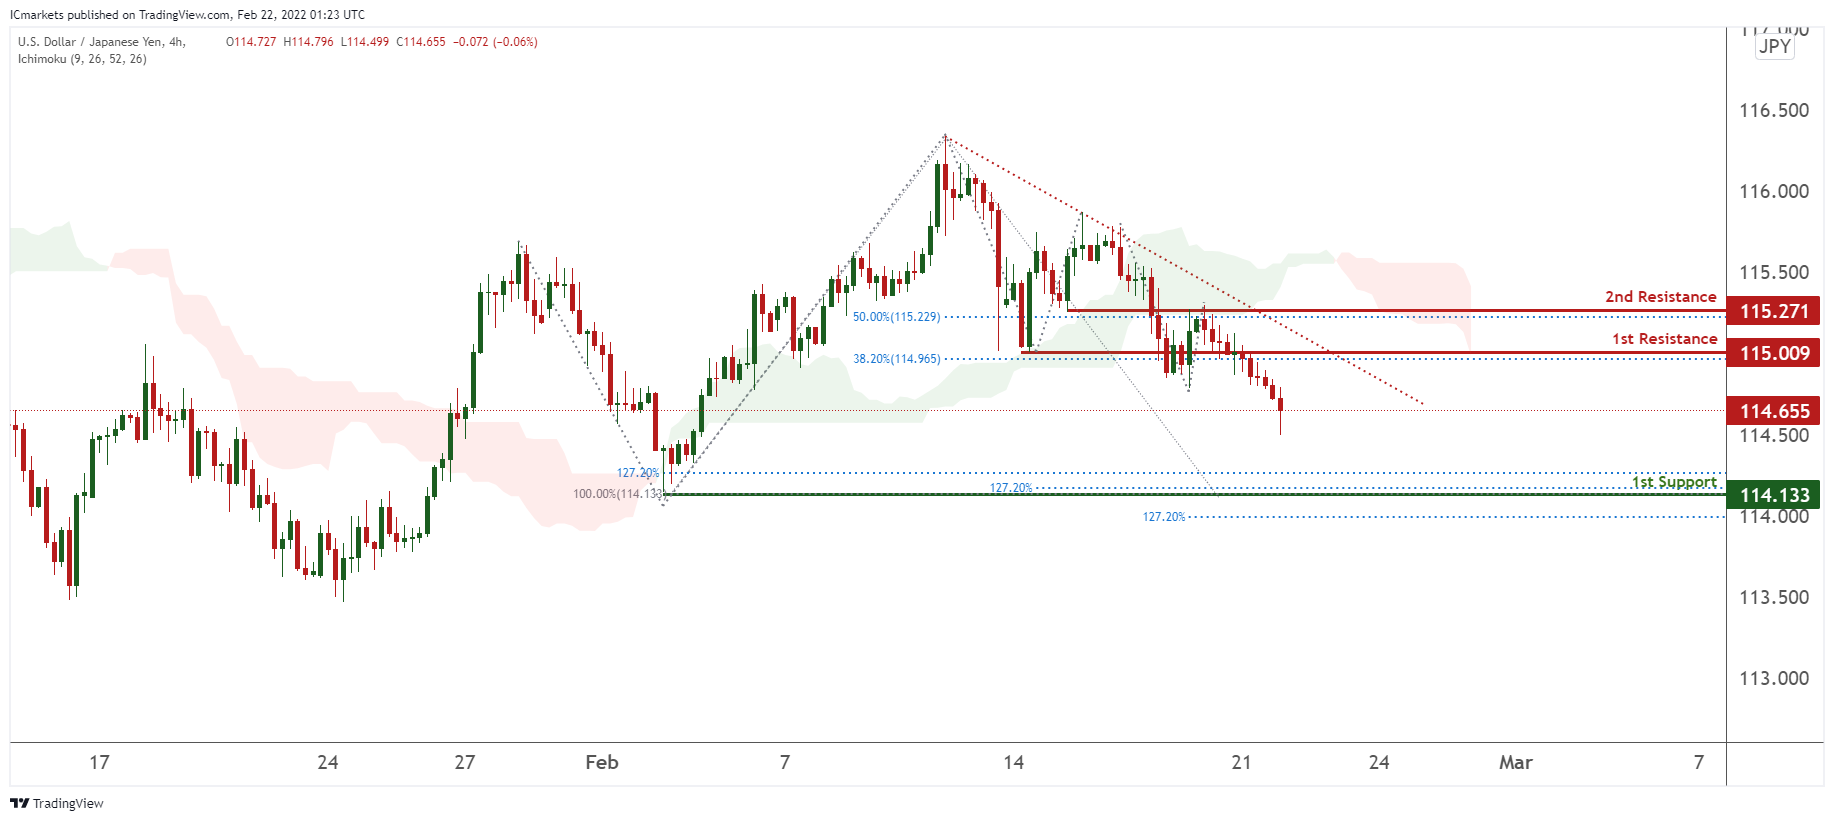
On the H4 timeframe, prices are on bearish momentum and abiding to our descending trendline. We see the possibility of bearish continuation from our 1st resistance at 115.009 in line with 38.2% Fibonacci retracement towards our 1st support at 114.133 in line which is an area of Fibonacci confluences. Our bearish bias is further supported by prices trading below our Ichimoku clouds.
Areas of consideration:
- H4 time frame, 1st resistance at 115.009
- H4 time frame, 1st support at 114.133
AUD/USD:
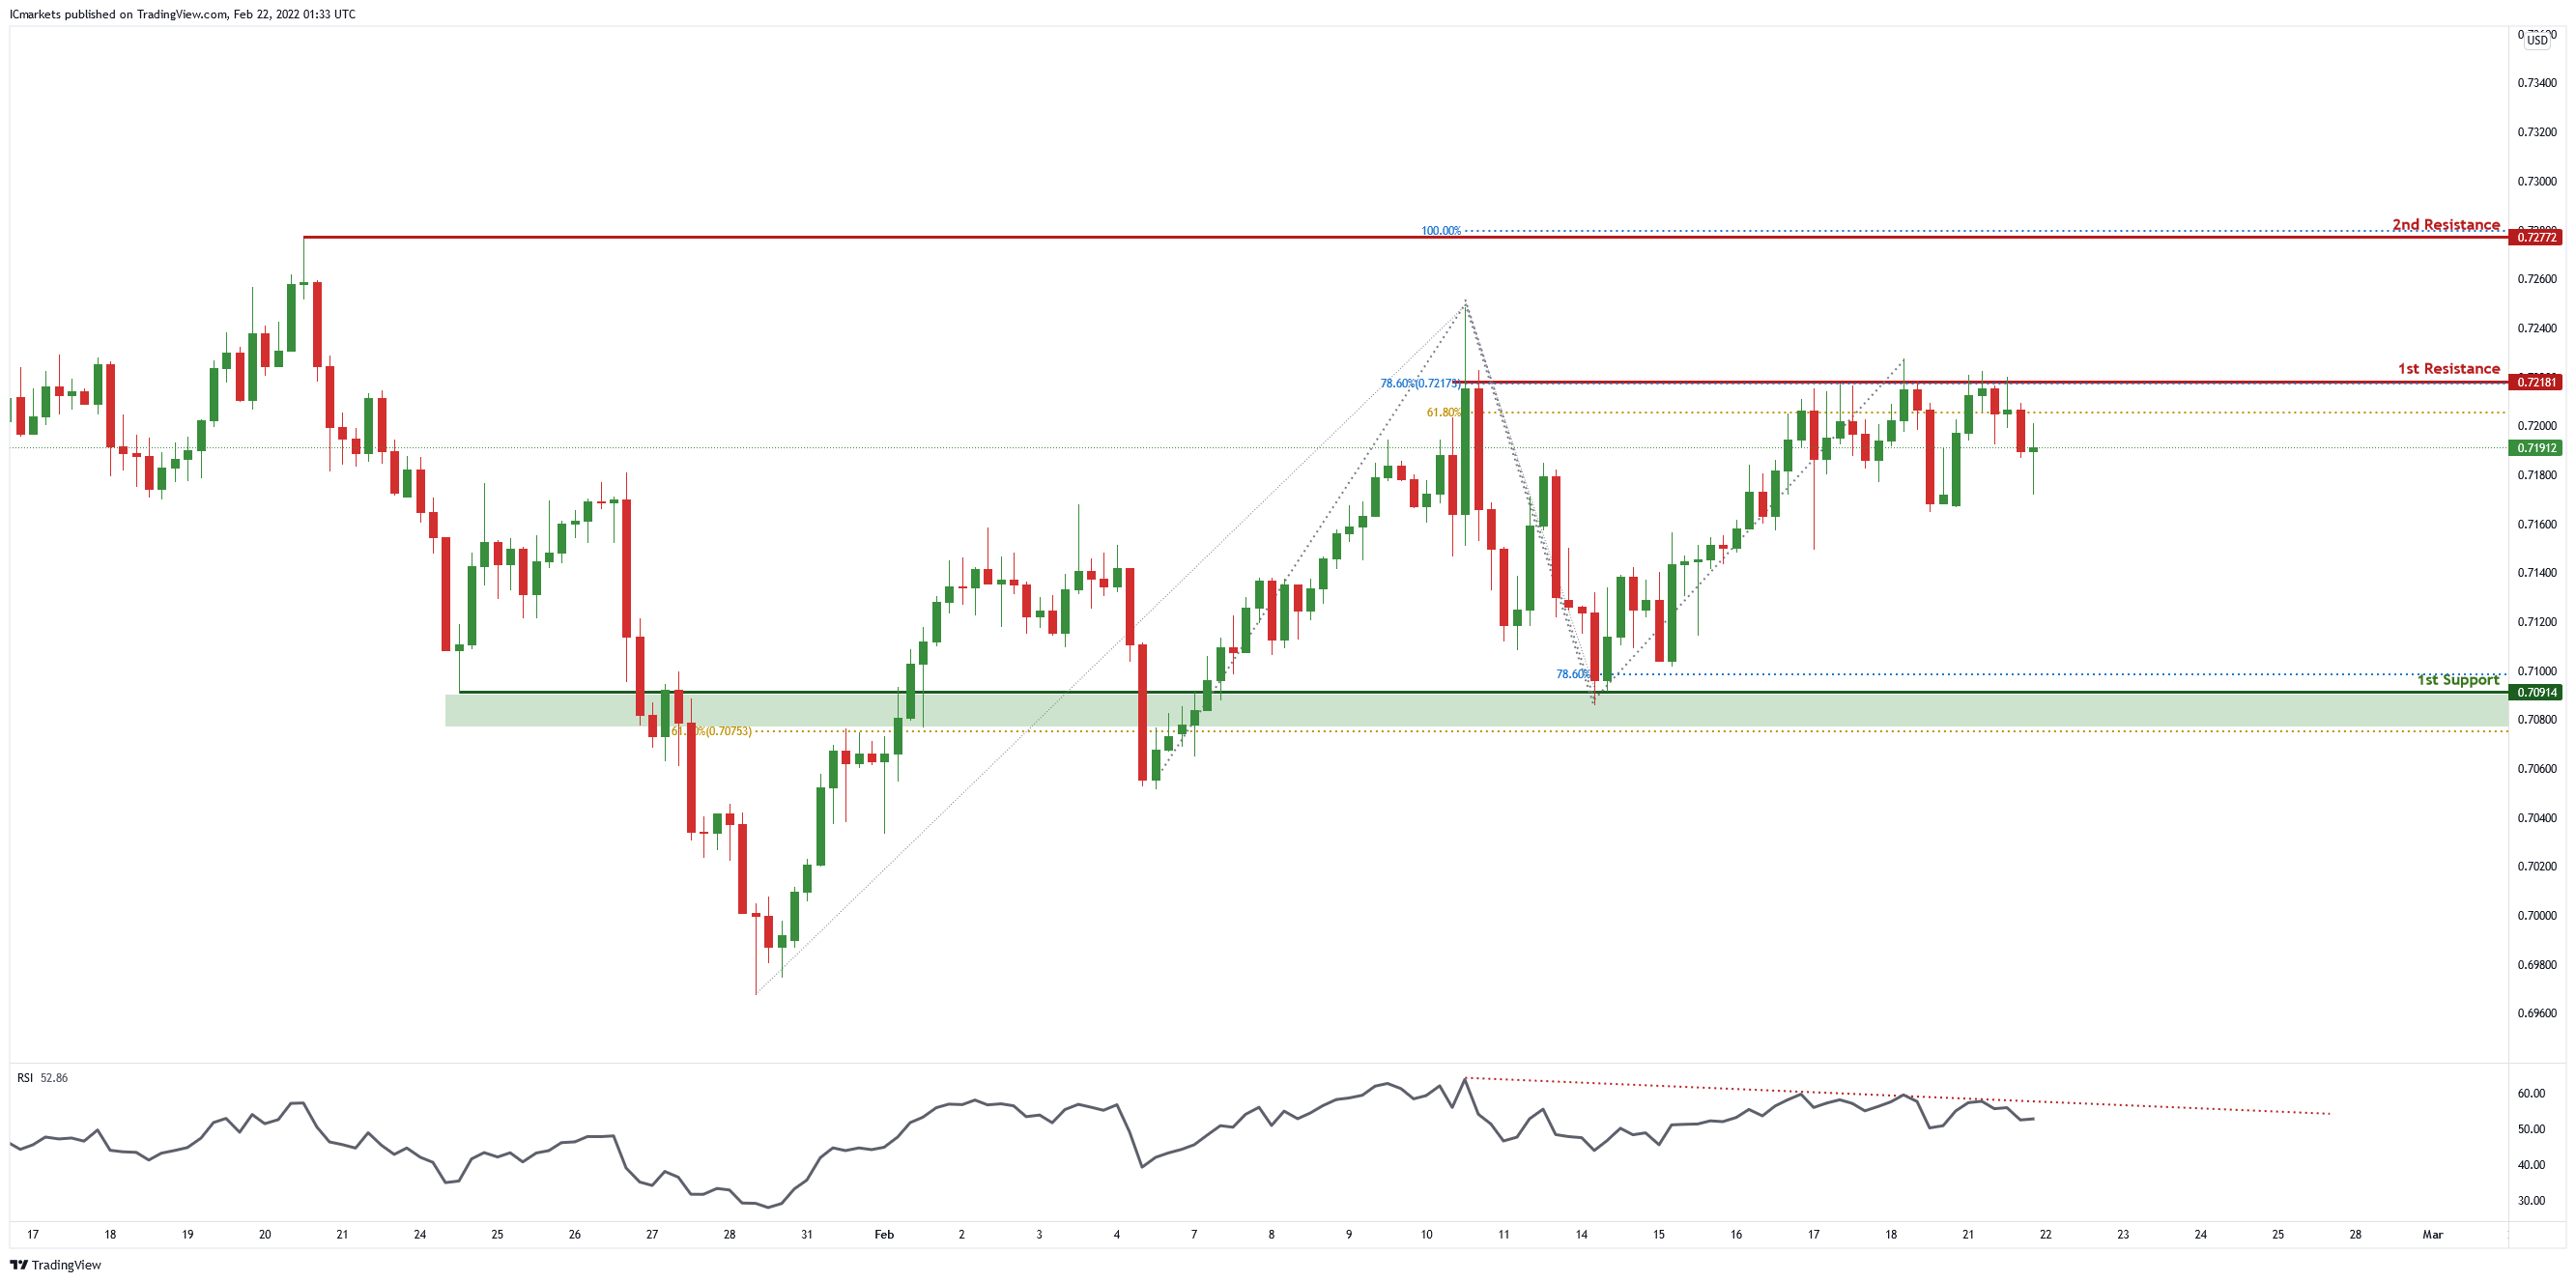
On the H4 chart , price is near 1st resistance level of 0.72181 in line with 78.6% Fibonacci projection and 61.8% Fibonacci retracement. Price can potentially dip to the 1st support level of 0.70914 in line with 78.6% Fibonacci projection and 61.8% Fibonacci retracement. Our bearish bias is supported by RSI indicator as it is abiding by a descending trendline
Areas of consideration:
- H4 1st resistance at 0.72181
- H4 1st support at 0.70914
NZD/USD:
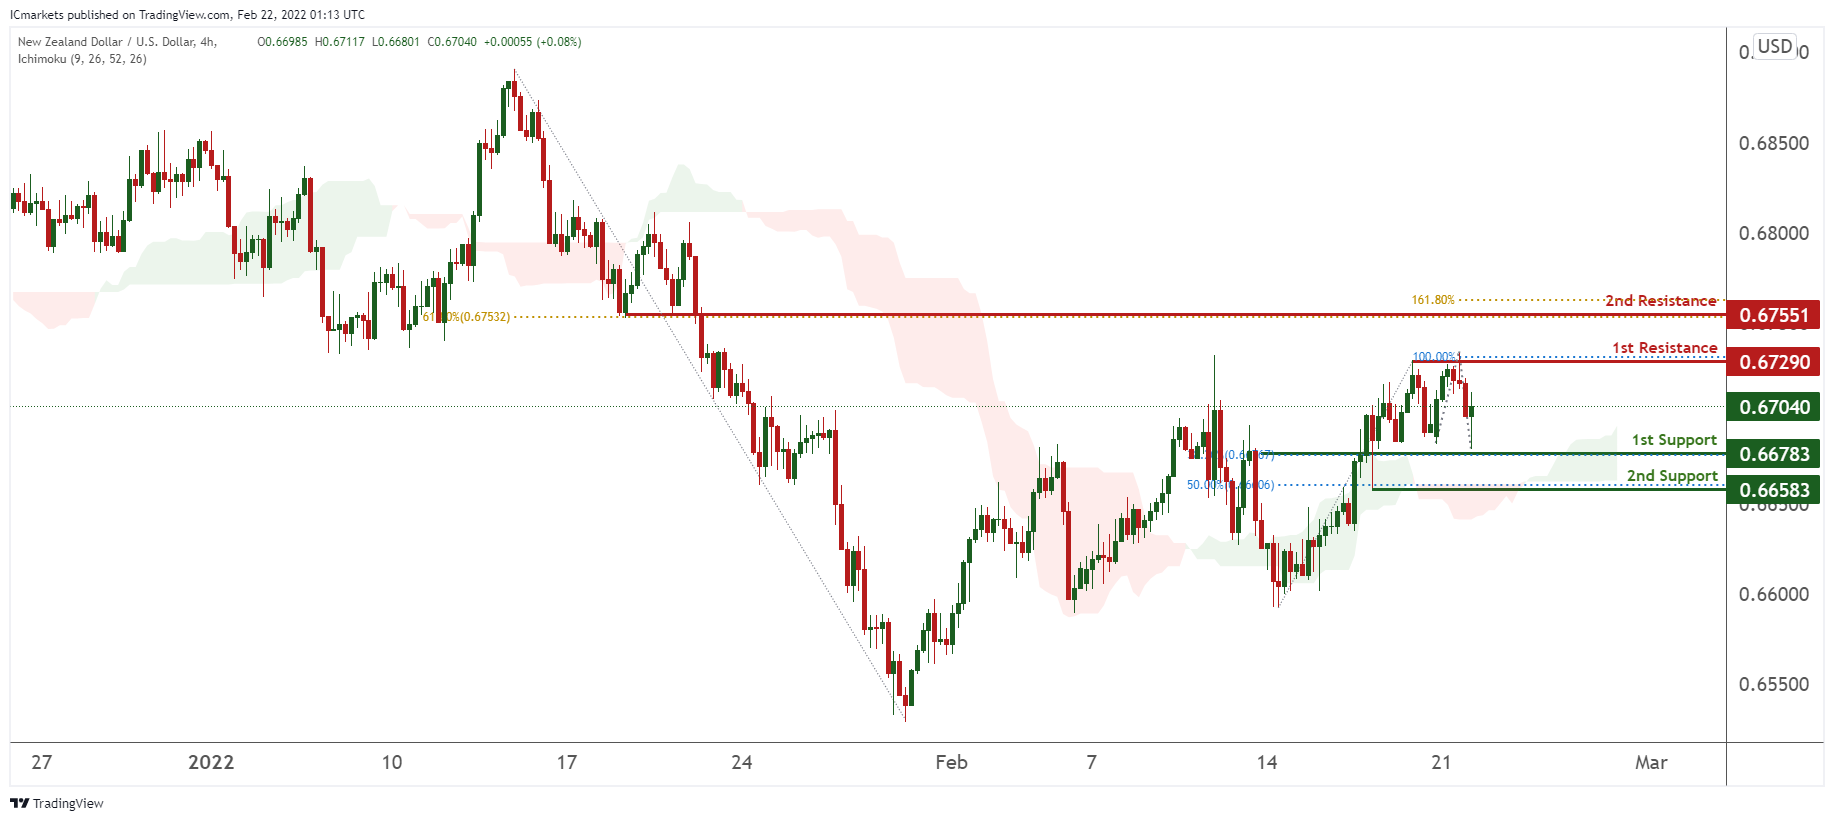
On the H4 timeframe, prices are approaching a pivot and are on bullish momentum. We see potential for a bounce from our 1st support at 0.66783 in line with 38.2% Fibonacci retracement towards 1st resistance at 0.67290 in line with 100% Fibonacci extension. Prices are trading above our ichimoku cloud support, further supporting our bullish bias. Alternatively, our stop loss will be placed at 0.66583 in line with 50% Fibonacci retracement.
Areas of consideration:
- H4 time frame, 1st resistance at 0.67290
- H4 time frame, 1st support at 0.66783
USD/CAD:
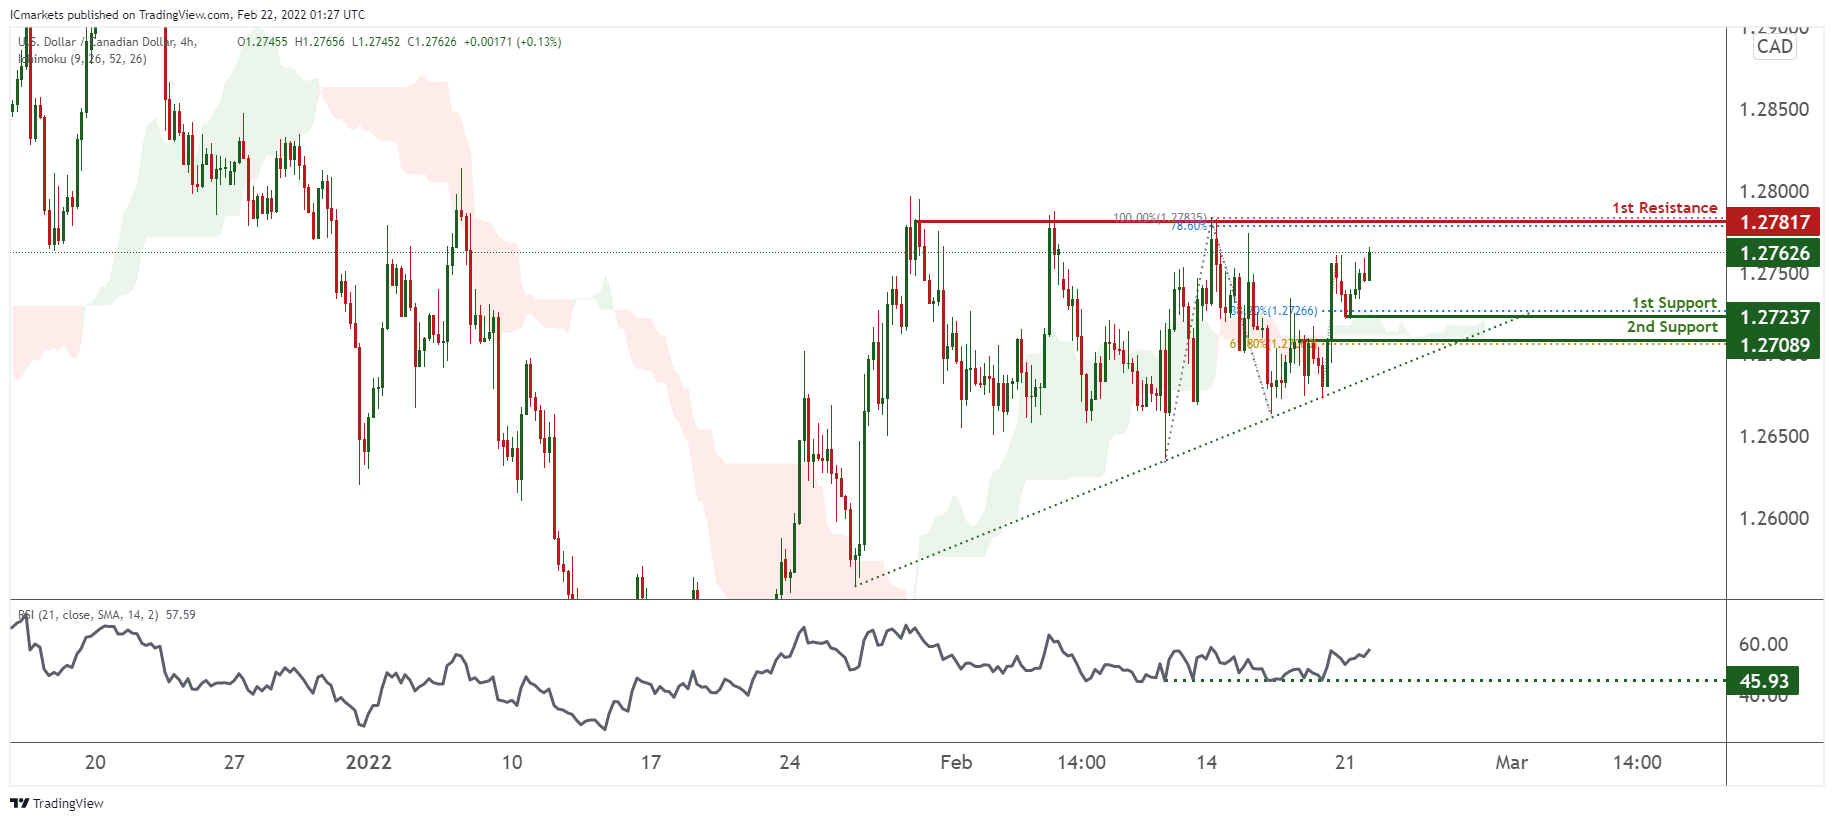
On the H4, prices are on bullish momentum and abiding to an ascending trendline. With RSI being at levels where bounces previously occurred, we can expect bullish continuation from our 1st support at 1.27237 in line with 38.2% Fibonacci retracement towards our 1st resistance at 1.27817 which is a strong resistance and in line with 100% Fibonacci retracement and 78.6% Fibonacci extension. Alternatively, price may break 1st support structure and head for 2nd support, which coincides with the ascending trendline and 61.8% Fibonacci retracement at 1.27089.
Areas of consideration:
- H4 time frame, 1st support at 1.27237
- H4 time frame, 1st resistance at 1.27817
OIL:
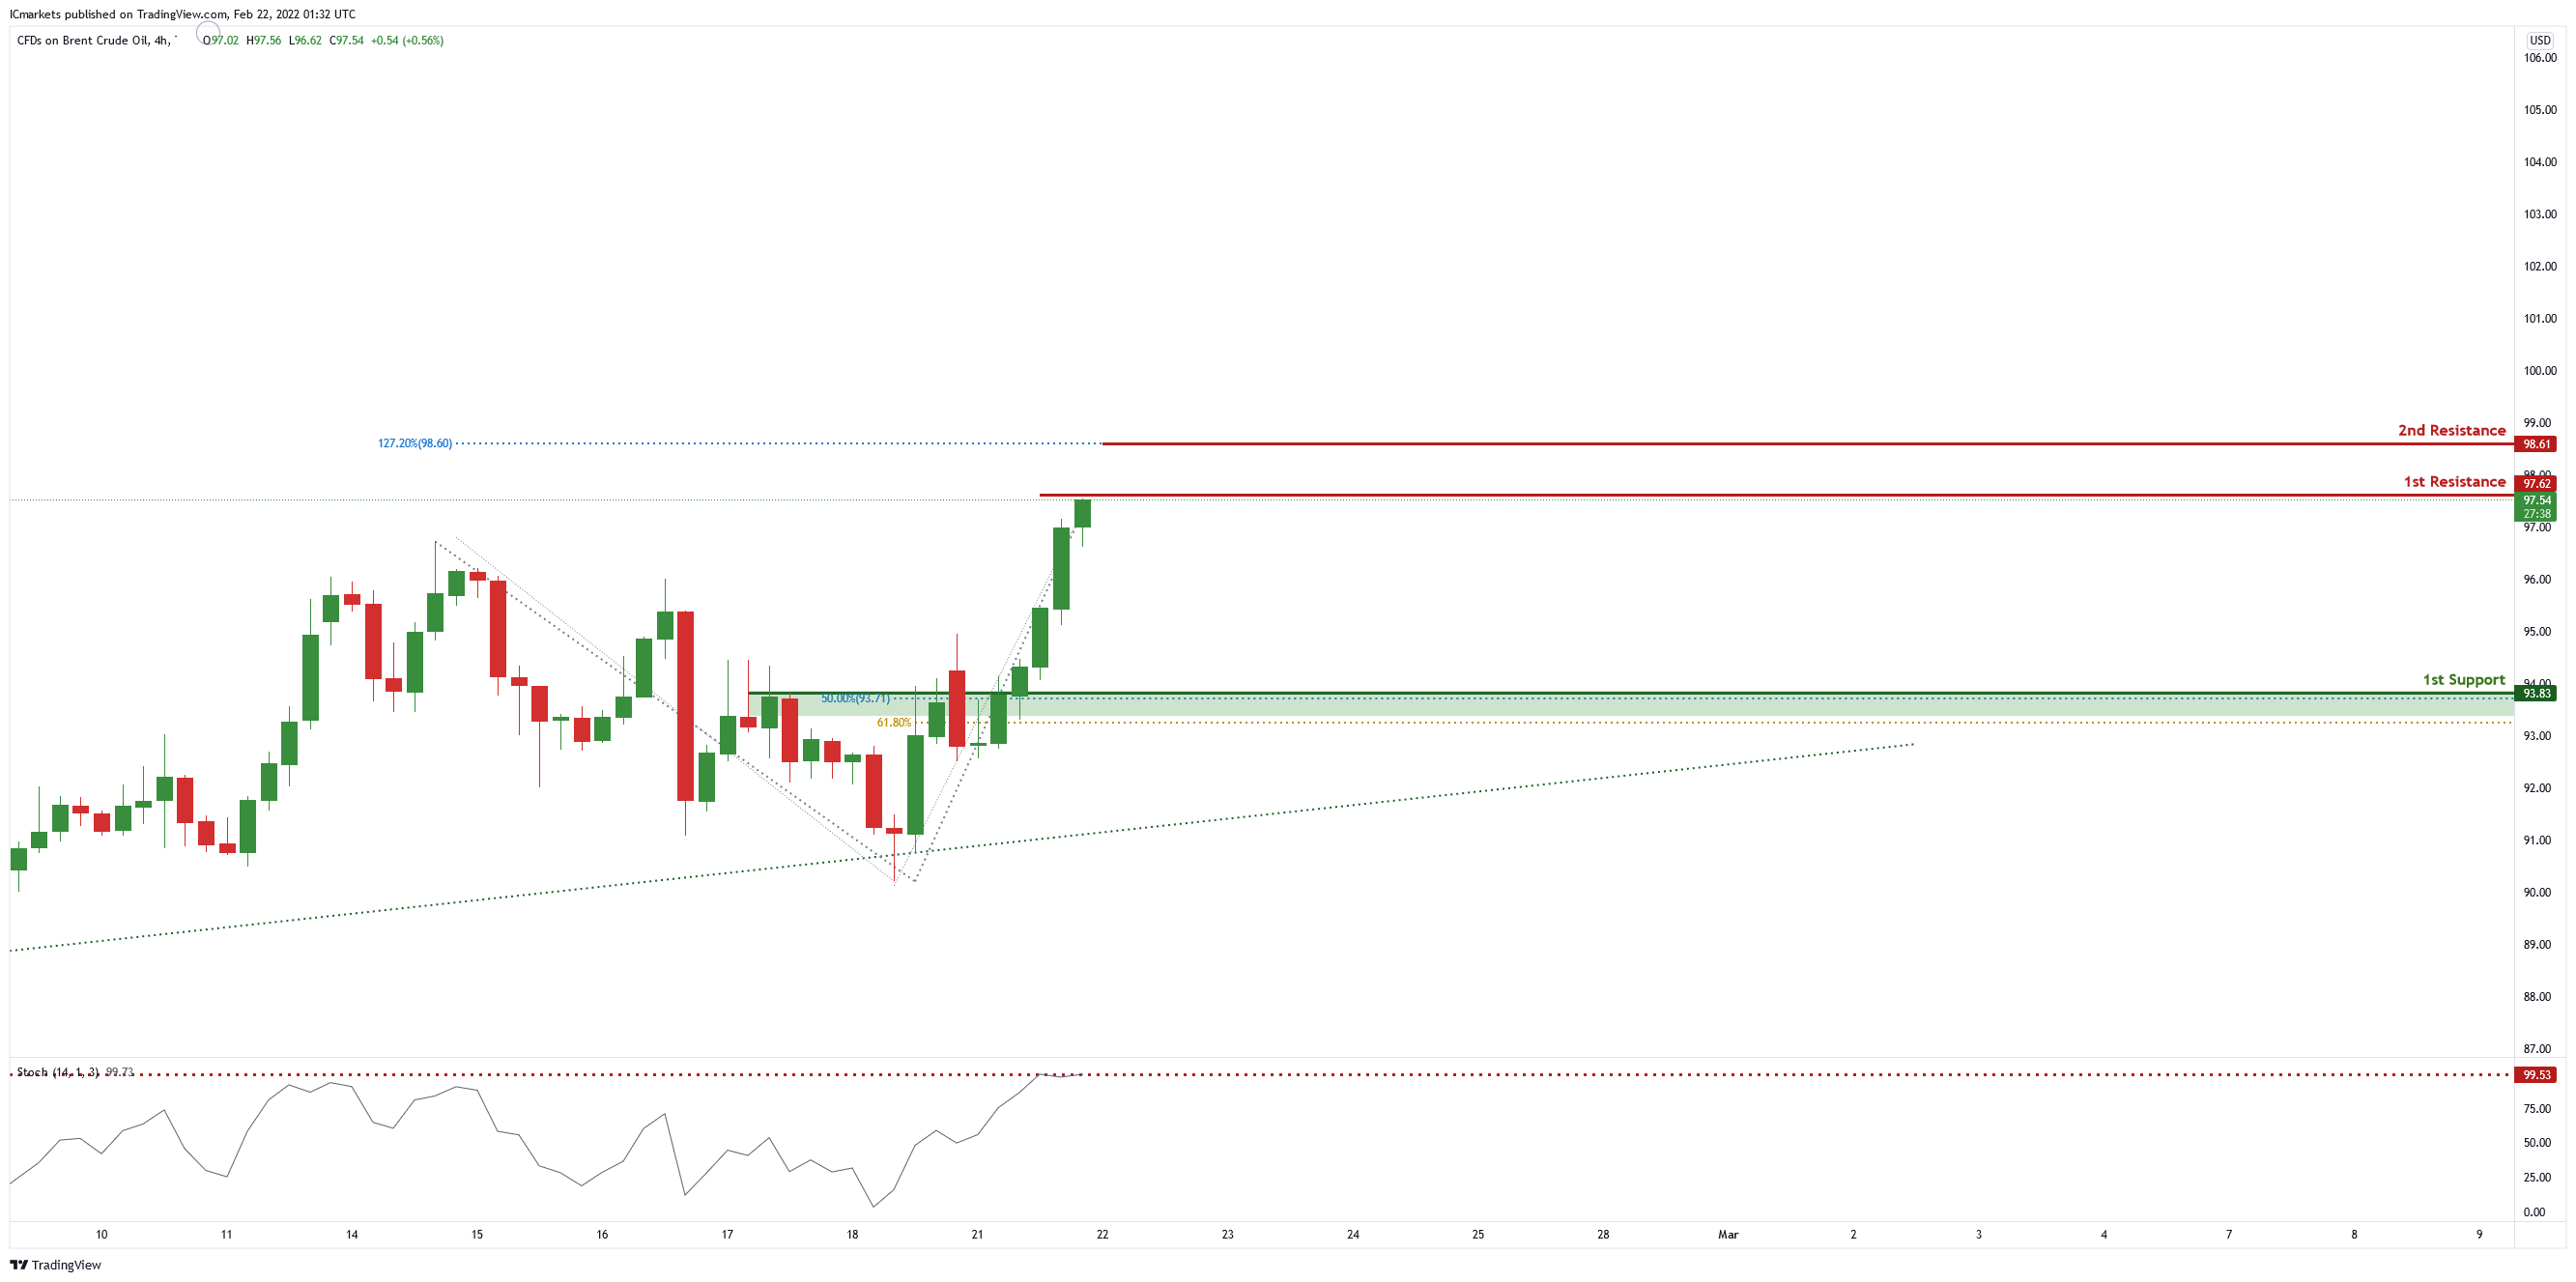
On the H4 chart , price is near the 1st resistance level of 97.62 which is also the graphical swing high. Price can potentially dip to the 1st support level of 93.83 in line with 50% Fibonacci retracement and 61.8% Fibonacci projection. Our bearish bias is supported by the stochastic indicator as it is near resistance level.
Areas of consideration:
- H4 time frame, 1st resistance of 97.62
- H4 time frame, 1st support of 93.83
Dow Jones Industrial Average:
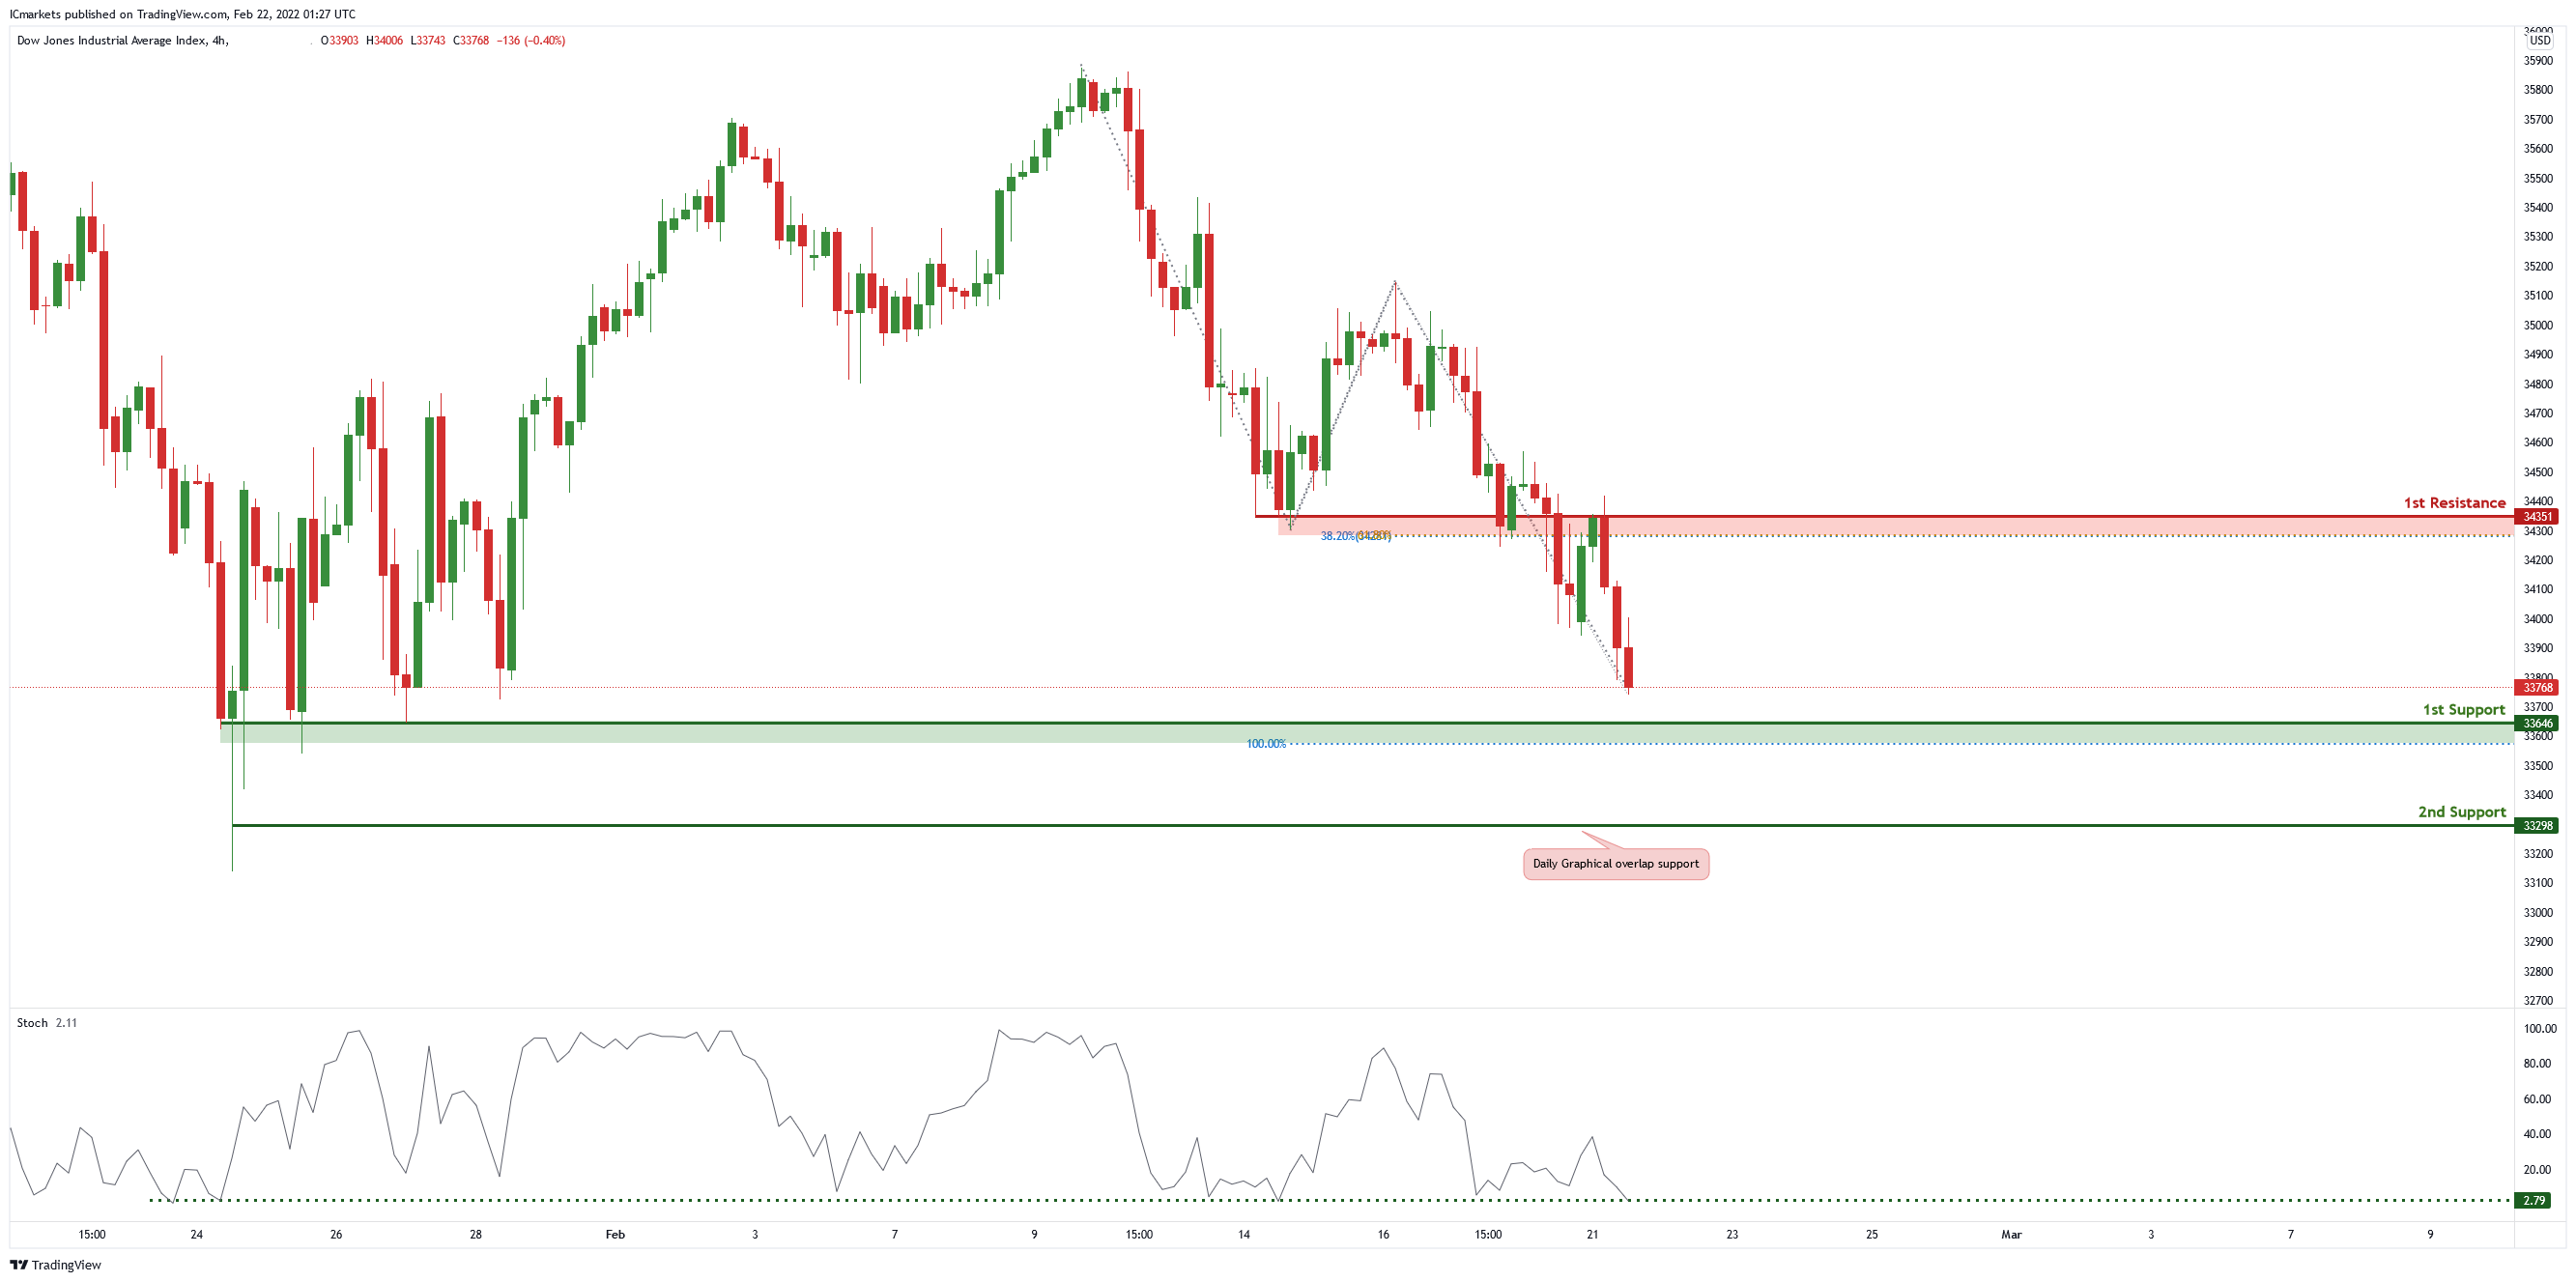
On the H4 chart, price is near 1st support level of 33646 in line with 100% Fibonacci projection. Price can potentially bounce from 1st support to 1st resistance level of 34351 in line with 38.2% Fibonacci retracement and 61.8% Fibonacci projection. Our bullish bias is supported by the stochastic indicator as it is at support level.
Areas of consideration :
- H4 1st support at 33646
- H4 1st resistance at 34351
GBP/USD Remains Supported For More Upsides
Key Highlights
- GBP/USD is holding gains above the 1.3550 support.
- A crucial bullish trend line is forming with support near 1.3580 on the 4-hours chart.
- EUR/USD must clear 1.1400 to start a fresh increase.
- The US Manufacturing PMI could increase to 56.0 from 55.5 in Feb 2022 (Preliminary).
GBP/USD Technical Analysis
The British Pound started a decent increase from 1.3485 against the US Dollar. GBP/USD gained pace for a move above the 1.3550 resistance level.
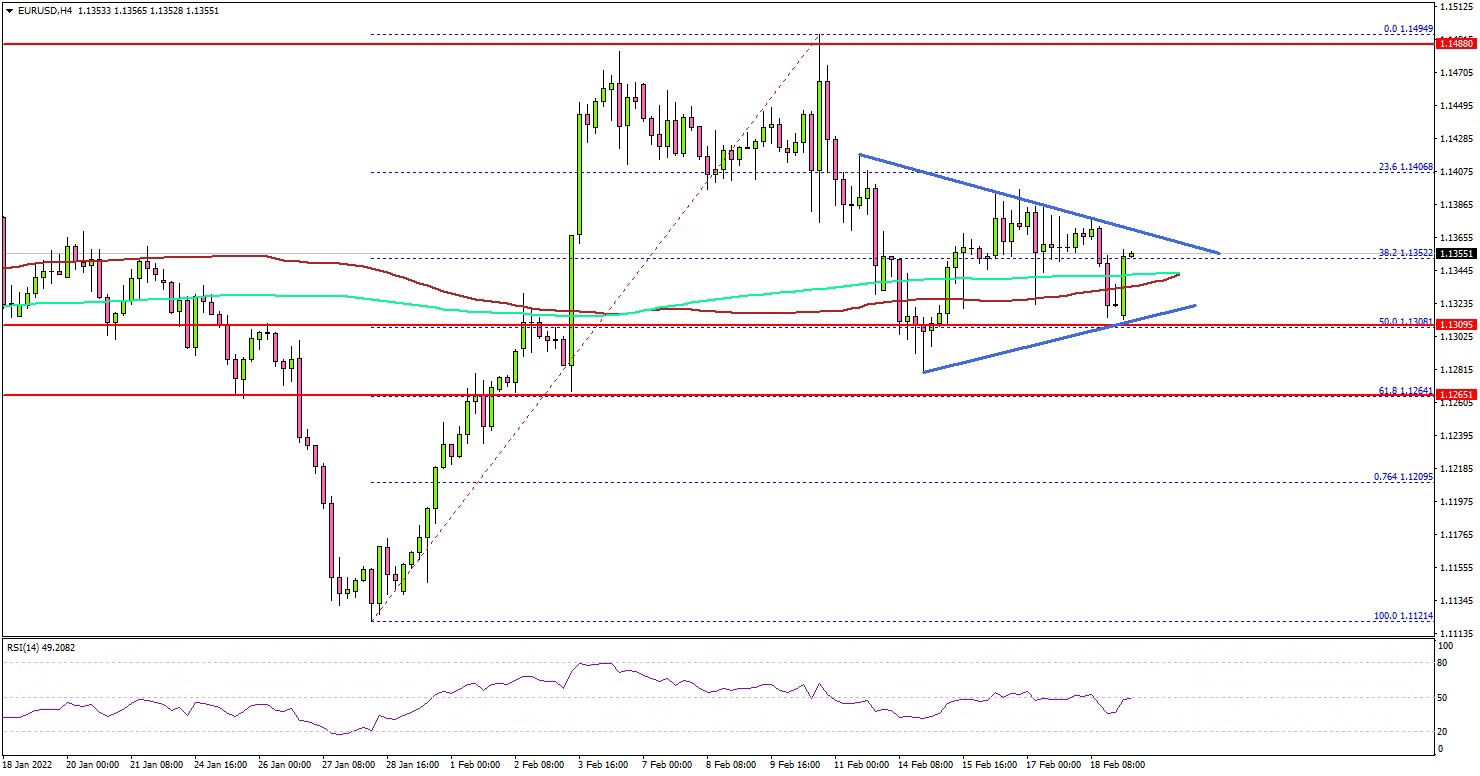
Looking at the 4-hours chart, the pair even broke the 1.3600 resistance level. There was a spike towards the 1.3640 resistance, and a close above the 100 simple moving average (red, 4-hours) and the 200 simple moving average (green, 4-hours).
On the upside, the pair might gain strength if there is a close above 1.3640 and 1.3650. The next major resistance is near the 1.3720 level. Any more gains might send the pair towards the 1.3800 level.
If not, GBP/USD might correct lower towards 1.3550. There is also a crucial bullish trend line forming with support near 1.3580 on the same chart.
The next key support is near 1.3540, below which the pair could extend losses. In the stated case, it could revisit the 1.3500 zone.
Fundamentally, the UK PMI manufacturing for Feb 2022 (Prelim) was released yesterday by both the Chartered Institute of Purchasing & Supply and Markit Economics. The market was looking for a minor decline from 57.3to 57.2.
The actual result was positive, as the UK PMI manufacturing posted a strong increase of 57.3 in Feb 2022. More importantly, the PMI services saw a rise from 54.1 to 60.8.
Looking at EUR/USD, the pair must settle above the 1.1380 and 1.1400 resistance levels to start a steady increase in the near term.
Economic Releases
- German IFO Business Climate Index for Feb 2022 – Forecast 96.5, versus 95.7 previous.
- US Manufacturing PMI for Feb 2022 (Preliminary) – Forecast 56.0, versus 55.5 previous.
- US Services PMI for Feb 2022 (Preliminary) – Forecast 53.0, versus 51.2 previous.
NZD/USD: Positively Placed ahead of the RBNZ
Economists widely expect the Reserve Bank of New Zealand (RBNZ) to hike its overnight cash rate by 25 bps for a third consecutive time on Wednesday.
Whether or not the central bank’s decision holds any surprises doesn’t detract from what ultimately could prove a positive technical setup for NZD/USD further down the line.
NZD/USD hit a high of 0.74607 in February of last year but failed to establish a fresh higher. Instead, the currency pair has been trapped in a range between 0.74607 and the previous swing low of 0.65095. Within that range, NZD/USD has formed a downward trend channel, which led price to test near but fail a break close to the bottom of its this long-held range.
Both the failed test of the bottom of the range and the downward channel could portend a continuation of last year’s uptrend. Still, considering recent geopolitical tensions related to the Ukraine and NZD/USD’s sensitivity to “risk-on” and “risk-off” sentiment, NZD/USD trades are not for the faint of heart.
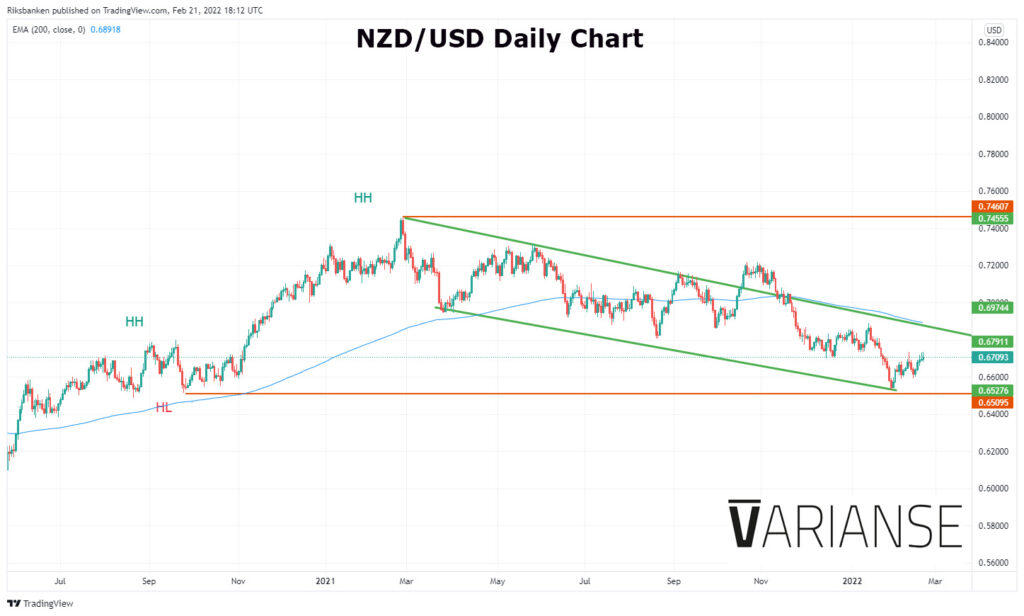
That said, for those looking for upside, there is a lot of cohesions in terms of chart. A definitive break above the 0.67052 region leaves 0.68907 the next major point of resistance, which coincides near both 200EMA and the upper band of the upward trend channel. From there, the .71000 pivot region could be in the grabbing. Meanwhile, downside, at least for the moment looks strongly contained near the 0.65095 region.
Bitcoin Provides Hope for Crypto Bulls
After breaking its 3-month-old bearish trend line at the start of this month, there was optimism that Bitcoin had bottomed out. But that optimism quickly faded as the largest digital coin and other cryptos couldn’t decouple from equities as investors shun risk. We saw stocks drop sharply along with cryptos and government bonds, as yields rose on speculation about several rate increases from the likes of Federal Reserve, Bank of England and many other central banks in 2022. Inflation concerns outweighed optimism about a global recovery after the omicron variant scare.
While there are still no clear signs of a turnaround, Bitcoin bulls have stepped in right where they should have today, providing us with a glimmer of hope that perhaps the cryptocurrency has already bottomed out. We need to see confirmation now in the former of bullish price action from here on.
Bitcoin bounces off key support
Specifically, BTC/USD had found support off the $37K area, which was the base of the previous breakout in early Feb. Not only that, but this is also where the 61.8% Fibonacci retracement level comes into play:
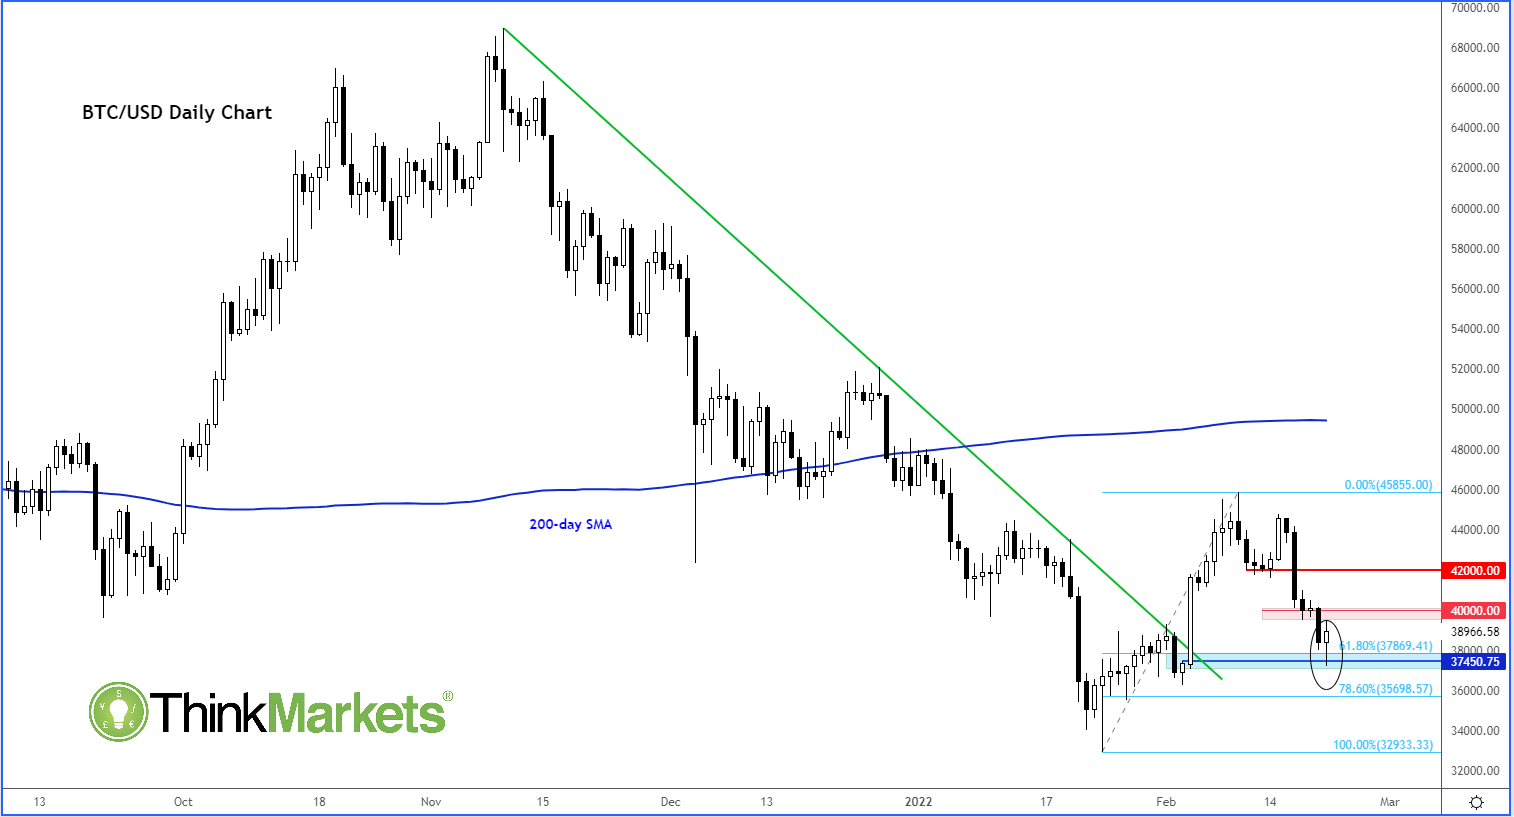
After major reversals take place, price usually retraces deep – to around 61.8 or 78.6 percent against the impulsive move – before resuming in the direction of the reversal, in this case upwards. So, we now need to see evidence of the turnaround by price going on to break a few resistance levels. The first such area is shaded in red on the chart, around $40K, was being tested at the time of writing.
A decisive close north of $40K will thus provide us the first major clue that the market has indeed bottomed out. But all bets would be off if the blue shaded region breaks first.
Brent Wave Analysis
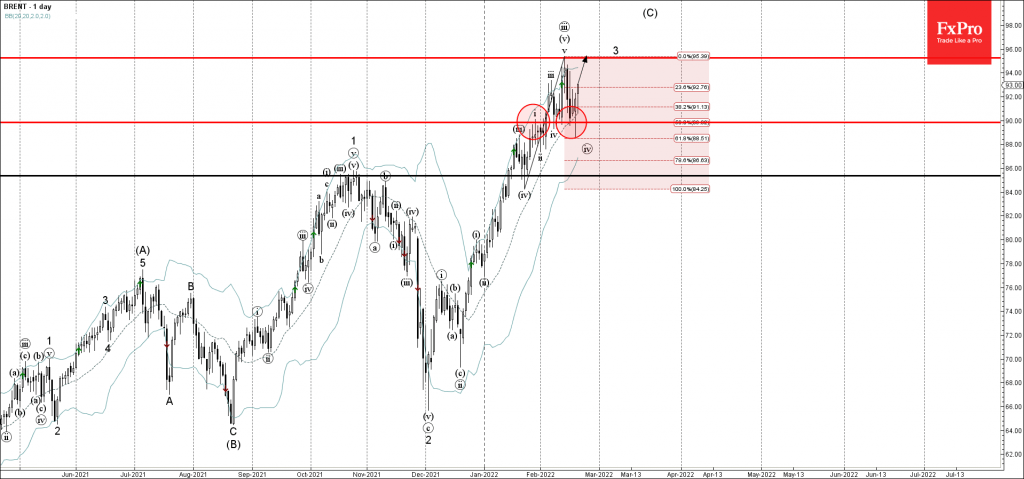
- Brent reversed from support area
- Likely to rise to resistance level 95.25
Brent crude oil recently reversed up from the combined support area located between the round support level 90.00 (former resistance from the end of January), 20-day moving average and the 50% Fibonacci correction of the previous impulse wave (v) from last month.
The upward reversal from this support area stopped the previous short-term corrective wave (iv).
Given the clear daily uptrend – Brent crude oil can be expected to rise further toward the next resistance level 95.25 (top of last wave (iii) – target for the completion of the active impulse wave 3).
EURCHF Wave Analysis
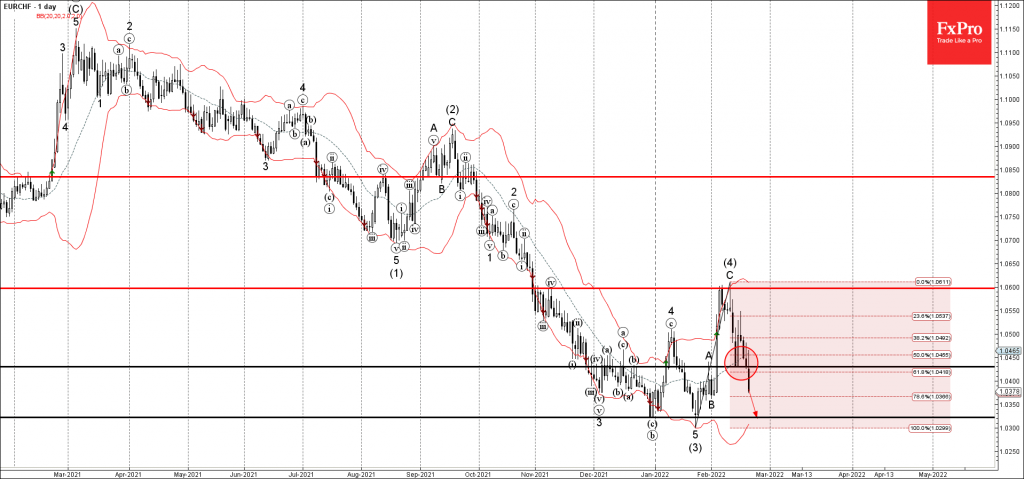
- EURCHF broke support area
- Likely to fall to support level 1.0320.
EURCHF currency pair recently broke the support area located between the key support level 1.0430 (former top of wave A from the end of January) and the 50% Fibonacci correction of the previous ABC correction (4).
The breakout of this support area accelerated the active intermediate impulse wave (5).
Given the clear daily downtrend – EURCHF currency pair can be expected to fall further toward the next key support level 1.0320 (which has been reversing the price from the end of December).
Eco Data 2/22/22
[php_everywhere instance="1"]
Fed Bowman support rate hike in March, but size depends on data
Fed Governor Michelle Bowman said in a speech, " I support raising the federal funds rate at our next meeting in March and, if the economy evolves as I expect, additional rate increases will be appropriate in the coming months."
However, "I will be watching the data closely to judge the appropriate size of an increase at the March meeting," she added.
"In the coming months, we need to take the next step, which is to begin reducing the Fed's balance sheet by ceasing the reinvestment of maturing securities already held in the portfolio," she added. "Returning the balance sheet to an appropriate and manageable level will be an important additional step toward addressing high inflation."