

Sample Category Title
US durable goods orders dropped -0.9% mom in Dec, led by transportation equipment
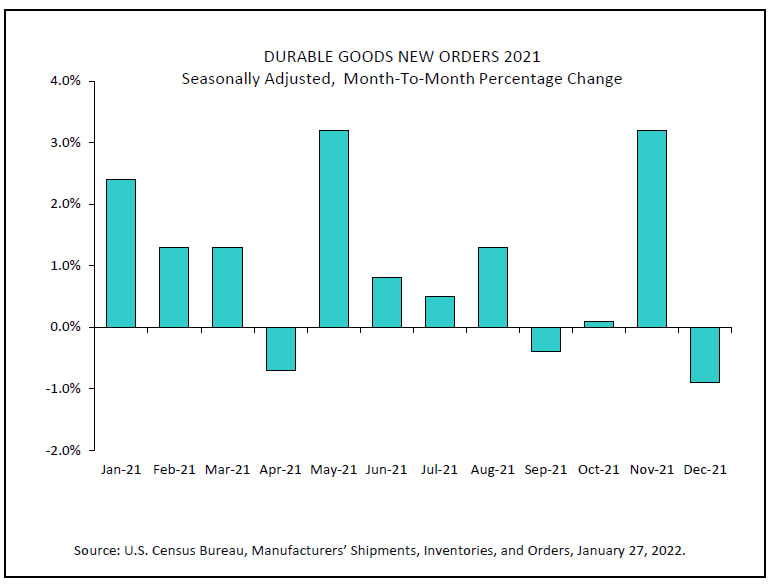
US durable goods orders dropped -0.9% mom, or USD -2.4B to USD 267.6B in December, worse than expectation of -0.5%. Ex-transport orders rose 0.4% mom, above expectation of 0.5% mom. Ex-defense orders rose 0.1%. Transportation equipment dropped USD -3.3B, or -3.9% mom to USD -80.1B.
US GDP grew 6.9% annualized in Q4, well above expectations
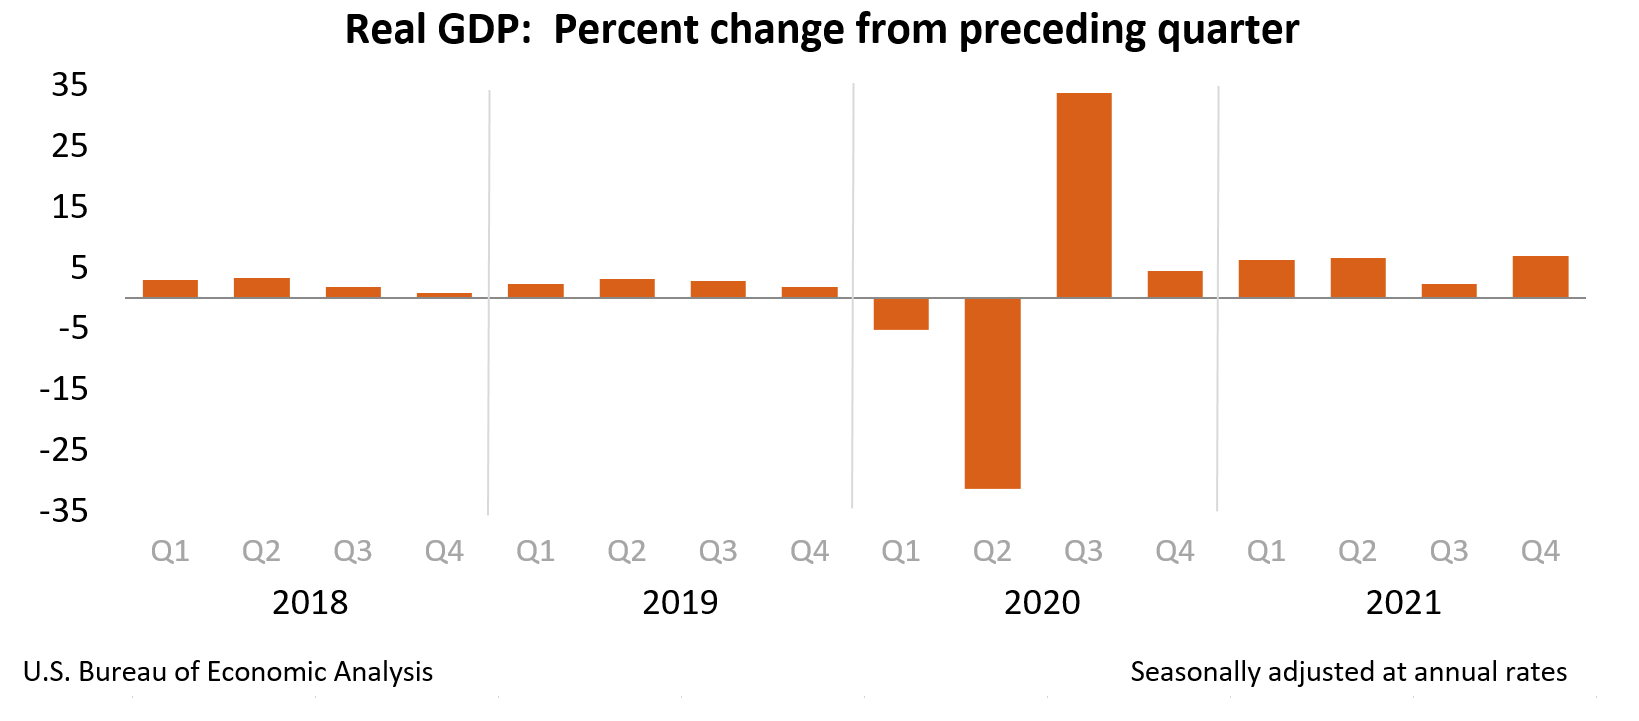
US GDP grew at 6.9% annualized rate in Q4, faster than Q3's 2.3%, well above expectation of 5.6%. The increase in real GDP primarily reflected increases in private inventory investment, exports, personal consumption expenditures (PCE), and nonresidential fixed investment that were partly offset by decreases in both federal and state and local government spending. Imports, which are a subtraction in the calculation of GDP, increased.
For 2021 as a whole, real GDP grew 5.8% The increase in real GDP in 2021 reflected increases in all major subcomponents, led by PCE, nonresidential fixed investment, exports, residential fixed investment, and private inventory investment. Imports increased.
EUR/USD downside breakout, how bearish is the long term outlook?
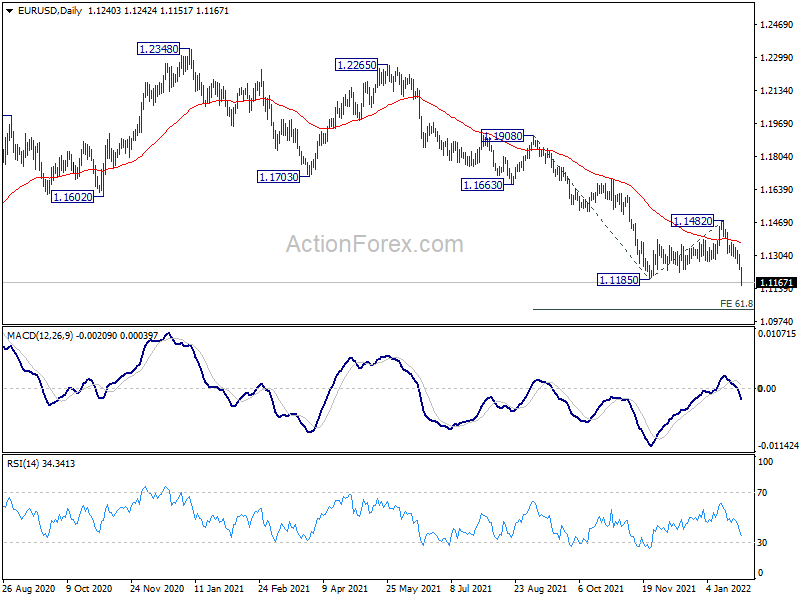
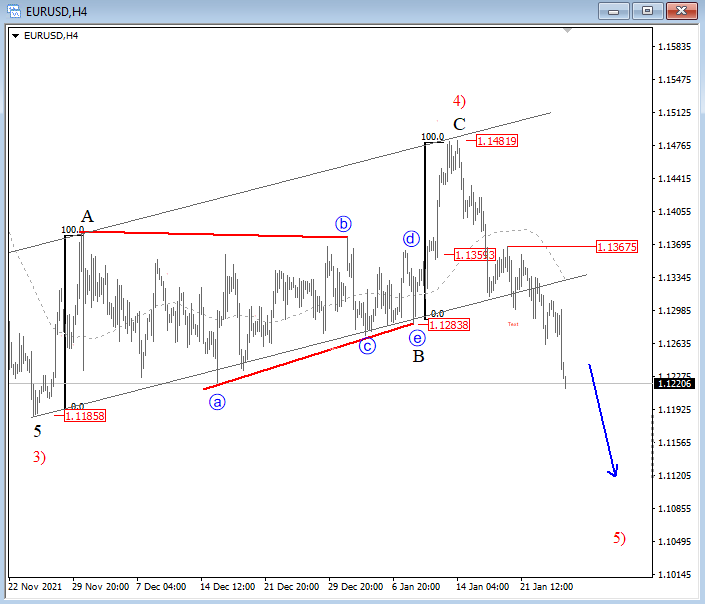
EUR/USD finally breaks out to the downside and falls to the lowest level since June 2020. Near term outlook is staying bearish and next target is 61.8% projection of 1.1908 to 1.1185 from 1.1482 at 1.1035.
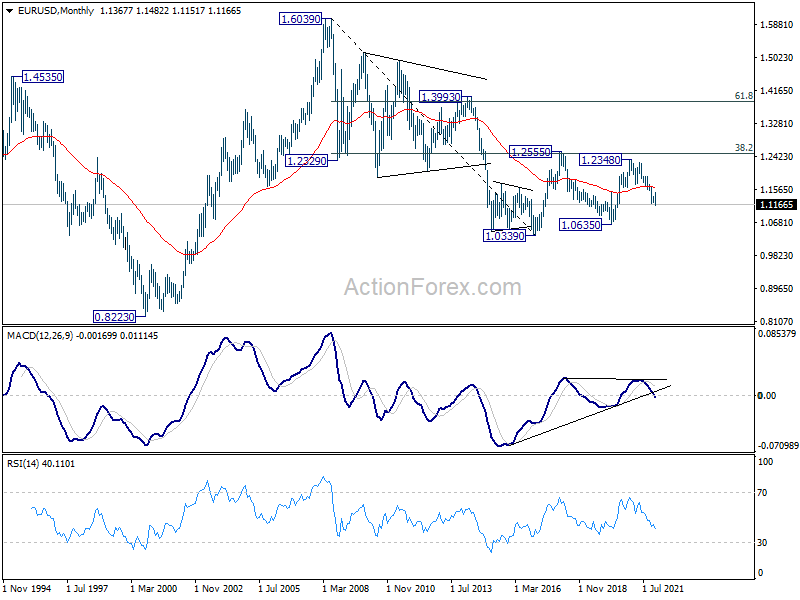
The biggest question is indeed in the long term picture. As seen in the monthly chart, an interpretation is that price actions from 1.0339 (2017 low) are a three wave consolidation pattern that has completed at 1.2348, after double rejections by 38.2% retracement of 1.6039 to 1.0339 at 1.2516. If that's the case, a break through 1.0339 low would be eventually be seen.
Of course, it's still a bit early to tell if the above bearish case is true. And that is unlikely to be revealed soon, at least not by first half of the year. But it's something that is worth noting.
EUR/USD Accelerates to South: Elliott Wave Analysis
FOMC statement with hawkish remarks are driving the USD higher while stocks has seen a new reversal down. At the same time, this means that market can stay in risk-off and more dollars gains ahead especially now when metals also turned south.
EURUSD is coming to the downside on 4h chart, now even accelerating after hawkish FED yesterday, so it appears that more weakness is in play now for a fifth wave drop below 1.1185. This can then be final leg of wave C) when looking at higher degree waves.
EUR/USD 4h Elliott Wave analysis
Dollar Soars, Stocks Sink after Powell Hints Fed Will Move Faster on Rates
- Powell makes a further hawkish pivot, signals end of era of highly accommodative policy
- Yields and dollar jump, but stocks are battered, upbeat earnings offer some support
- Kiwi biggest FX loser even as strong CPI fuels RBNZ rate hike bets
Fed Chair Jerome Powell left investors in no doubt that borrowing costs are set to rise in the coming months, leaving the door open to both a faster and steeper pace of rate increases. As expected, the Fed on Wednesday gave a clear signal for a March rate hike, but there was no discussion on shrinking the balance sheet. Powell said the decision on reducing the balance sheet will be made at the next two meetings.
However, markets were startled by Powell’s complete shift in tone on inflation, with the Fed chief not sounding optimistic on the supply chain issues being resolved quickly. Thus, he didn’t see inflation easing until the second half of this year.
On the other hand, his remarks on the labour market couldn’t have been more bullish, describing it as “very, very tight”. That can only mean that bringing inflation back down to 2% is now the Fed’s number one priority right now, which begs the question of how markets will react should the Fed raise rates at every meeting this year, and perhaps by more than 25-basis-points increments.
US yield curve flattens, dollar surges
Fed fund futures are now pricing almost one additional rate hike for 2022, bringing the total to five. But some analysts see more than that, and this is even before the next dot plot chart in March, which will reveal how FOMC members’ forecasts for 2023 have changed. Having been slow at first to make that initial hawkish pivot, there’s now a risk the Fed will be much more aggressive with lifting rates than current market pricing suggests.
The two-year yield on Treasury notes surged to a fresh 23-month high today, briefly hitting 1.20%. But the 10-year yield eased off from yesterday’s spike, suggesting there’s some worries about the longer-term US growth outlook from much tighter Fed policy over the next few years.
Nevertheless, the jump in short-term yields boosted the US dollar, pushing its index against a basket of currencies to 6-week highs.
Meanwhile, the modest moves in the 10-year Treasuries, which risky stocks are most sensitive to, may have staved off a massive panic on Wall Street.
US stocks suffer least from hawkish Fed as Asia tumbles
Although all of Wall Street’s main indices took a dive after the Fed’s announcement and Powell’s press briefing, having been up earlier in the day, the losses were contained for the Dow Jones and S&P 500. The tech-heavy Nasdaq even managed some marginal gains.
Microsoft’s earnings beat injected some optimism into US equities on Wednesday, while Tesla’s solid results after the market close might be aiding Nasdaq futures to edge up.
However, it seems that the Fed’s ‘get tough on inflation’ stance has spooked equites elsewhere around the world. Asian stocks in particular have been hit hard, though European indices appear to be coming off their lows.
Earnings will remain in focus later today as Apple is scheduled to report its results after the closing bell, along with Visa and McDonald’s. The advance GDP print for the fourth quarter will be eyed too in the United States.
Strong CPI can’t stop the Kiwi’s bleeding
Overnight, stronger-than-expected CPI figures out of New Zealand failed to lift the kiwi, which has plunged to 14-month lows versus the greenback. Fears about an aggressive Fed appear to be overpowering rising expectations of rate hikes in other countries. Even though 50-bps rate rises are looking more likely by the RBNZ after the inflation data, the New Zealand dollar just keeps skidding in the face of a stronger US dollar.
The euro also took a heavy beating, plummeting below $1.12 for the first time since late November. The Canadian dollar managed to steady, however, from earlier lows, as the Bank of Canada flagged a rate hike at its next meeting in March yesterday.
NZD Falls to 11-Week Low on Hawkish Fed
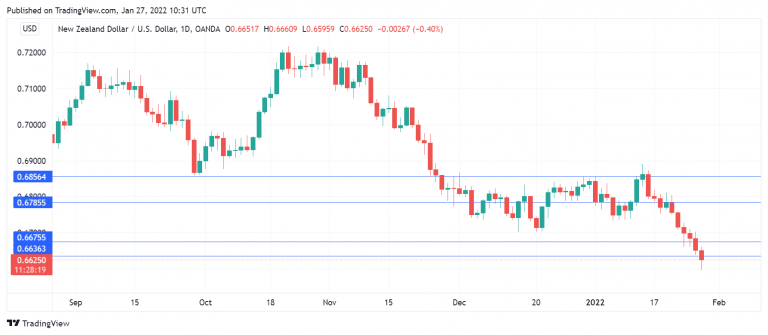
The New Zealand dollar is in negative territory on Thursday, after posting five straight losing sessions. In the Asian session, NZD/USD fell below the 0.66 line for the first time since November 2nd and is down 0.40% on the day.
New Zealand CPI hits 5.9%
New Zealand consumer inflation surged to 5.9% in Q4, up from 4.9% in the third quarter. We’ve seen inflation jump to 30 and 40-year highs in the US and the UK, respectively, and now it’s New Zealand’s turn, as inflation is at its highest level since June 1990. Economists had expected a reading of around 6%, with the RBNZ forecasting a 5.7% rise. Much of the sharp jump in CPI can be attributed to higher gasoline prices, as well as supply chain disruptions which have led to shortages in supermarkets and elsewhere.
RBNZ policy makers will undoubtedly be concerned that CPI overshot the bank’s forecast, and the surge in inflation will put additional pressure on the bank to continue raising rates. The RBNZ raised rates by a quarter-point to 0.75% in November and the markets have priced in about 1.5% in rate hikes in 2022, with a hike expected at the bank’s policy meeting next month.
Hawkish Fed boosts US dollar
In the US, Federal Reserve Chair Powell had a hawkish message for the markets, more in what he didn’t say than what he actually said. Powell did not rule out raising rates at every meeting and was careful not to make any commitments on the course of rate increases, although a March lift-off seems a done deal. The Fed was also vague about a date for reducing the balance sheet, with the FOMC statement stating that the Fed “expects that reducing the size of the Fed’s balance sheet will commence after the process of increasing the target range for the federal funds rate has begun.”
The baseline assumption is that the Fed will implement four rate hikes of 0.25% each in 2022. The risk of further hikes is tilted to the upside, primarily because of surging inflation, which hit 7% in December and shows no signs of easing.
Powell’s hawkish performance gave a broad boost to the US dollar, with NZD/USD falling by 0.35% on Wednesday. The kiwi has taken a tumble, falling 1.30% this week, after a similar drop last week.
NZD/USD Technical
- NZD/USD is putting strong pressure on support at 0.6675. Close by, there is support at 0.6636
- There is resistance at 0.6785 and 0.6856
AUDUSD Refreshes Downward Forces, Bearish Risks Grow
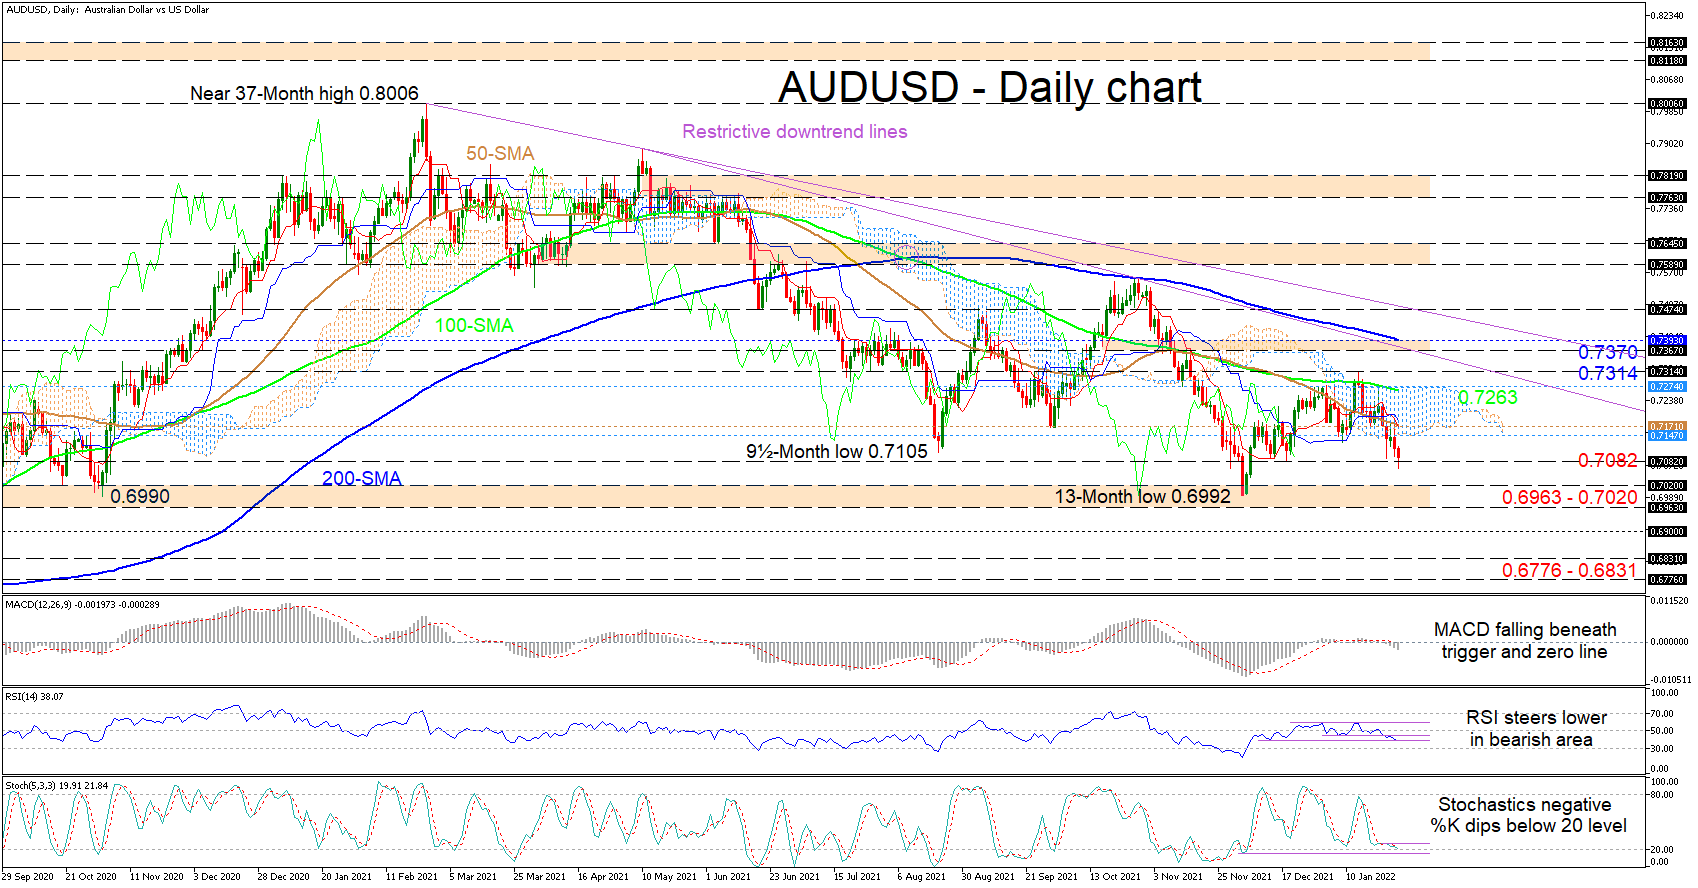
AUDUSD has dipped back beneath the Ichimoku cloud rekindling the dominant bearish tone, after the 100-day simple moving average (SMA) directed the price lower. The gradual decline in the SMAs is suggesting the downward trend in the pair may endure.
The Ichimoku lines are indicating that negative forces have been jump started, while the short-term oscillators are skewed to the downside. The MACD is pushing lower beneath its red trigger and zero lines, while the RSI is gliding lower in the bearish region. The stochastic lines are flirting with the 20 oversold level, promoting additional losses in the pair. Should they clearly move into oversold territory with force, this could confirm downward pressure is intensifying.
If the price manages to clearly push under the immediate 0.7082 barrier, sellers may then face the 0.6963-0.7020 critical base that stretches back to mid-July 2020. Successfully piercing below this key boundary, the price could meet the 0.6900 handle before the bears seek out the 0.6776-0.6831 support zone, shaped by the troughs over the second part of June 2020.
Otherwise, if buyers re-emerge, they face a congested upward path of resistance starting from the cloud’s lower band at 0.7147. Now, the overwhelming zone of resistance begins from 0.7147 and could stretch up till the cloud’s ceiling at 0.7274. That said, the pair would need to initially thrust into the cloud and overstep the 50-day SMA at 0.7171 - along with the adjacent Ichimoku lines - before propelling for the 100-day SMA, which is near the ceiling of the cloud. From here, the neighbouring 0.7314 high and restrictive trendline, pulled from the 0.7890 peak, may try to mute upside momentum from challenging the resistance band between the 0.7370 high and the 200-day SMA.
Summarizing, AUDUSD is sustaining a bearish bearing beneath the SMAs, the 0.7314 high and the descending diagonal line. That said, a break below 0.6963-0.7020 could reinforce the bearish bias, while a climb above 0.7400 could be a convincing signal boosting optimism in the pair.
USDCHF Unlocks 2-Week High with Strong Rally
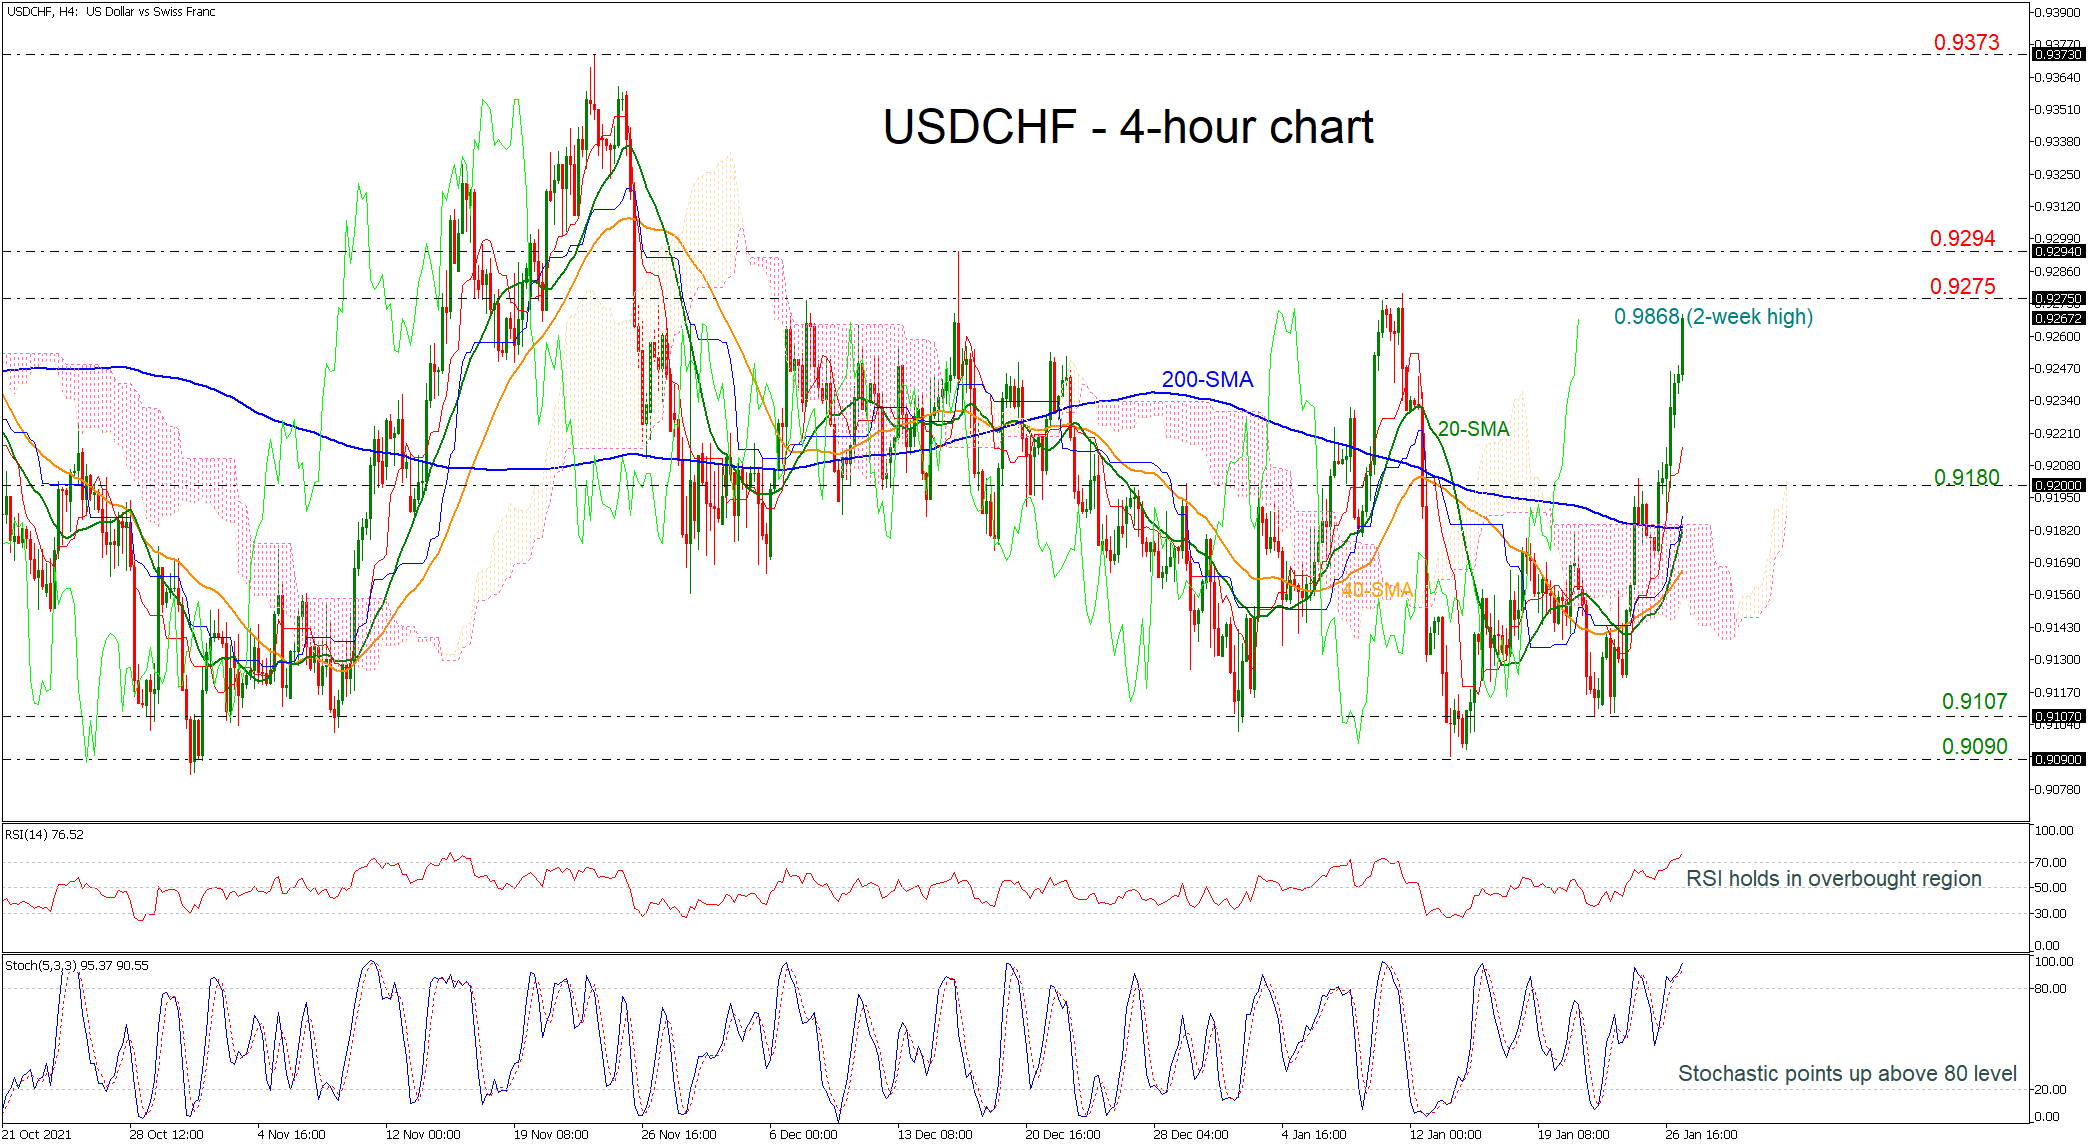
USDCHF is rallying to a fresh two-week high of 0.9868, creating several bullish sessions. The price overcame the short-term simple moving averages (SMAs) with the technical indicators holding in the overbought region. The RSI is ticking up above the 70 level, while the stochastic is pointing upwards with strong momentum.
Immediate resistance is coming from the 0.9275 barrier before touching the 0.9294 high, registered in December 2021. Moving higher, the 0.9373 may halt the bullish movements, achieved in November 2021.
Alternatively, a bearish correction may meet some support at the 0.9180 barrier, ahead of the 200-period simple moving average (SMA) at 0.9183. Below this level, the Ichimoku cloud is acting as a support area for the pair, while the 40-period SMA at 0.9165 is hovering within the cloud as well. Declining further, the 0.9107 and 0.9090 barrier may behave as turning points.
To conclude, USDCHF is looking bullish in the short-term and neutral in the long-term timeframe. A climb beyond the 0.9294 barrier may add some optimism for positive moves in the broader picture.
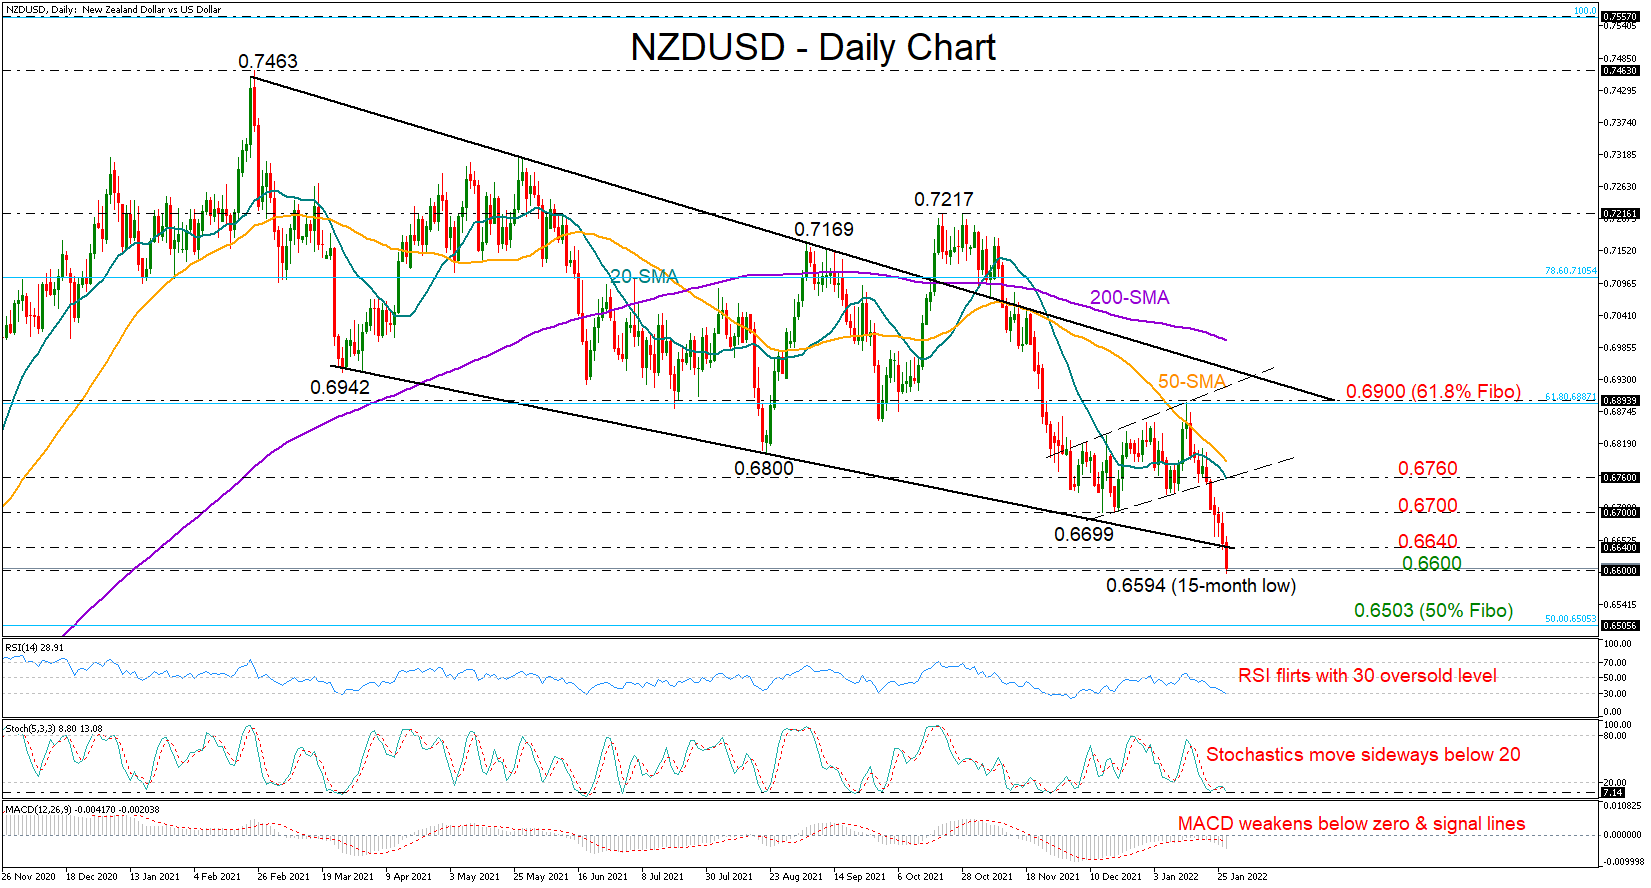
NZDUSD Worsens Bearish Status Below Channel
NZDUSD plunged below the 10-month-old descending channel early on Thursday, powering its broad bearish trend towards an almost 15-month low of 0.6594.
Oversold conditions are present according to the RSI and the Stochastics, though the former is just piercing its 30 level and the latter shows no sign of improvement below 20. Hence, an upside reversal in the price could come with some delay, as the negative momentum in the MACD also reflects.
A close below the 0.6600 round level could generate additional losses towards the 0.6500 number. This is where the 50% Fibonacci retracement of the 2017 – 2020 downtrend is positioned. Therefore, another violation here could confirm a continuation towards the 0.6380 support region from June 2020.
In the event of a false channel breakout, where the pair recoups its latest downfall and returns above 0.6640, the 0.6700 resistance may attempt to block the way to the broken short-term ascending trendline and the 20-day simple moving average (SMA), both currently at 0.6760. The constraining 50-day SMA is converging towards that region too. Nevertheless, if that strong wall collapses, the rally could pick up steam towards the previous high of 0.6889 and the 38.2% Fibonacci.
Summarizing, NZDUSD has worsened its bearish status in the short- and long-term timeframes by falling below 0.6640. While the violation still requires confirmation, a decisive close below 0.6600 is expected to activate a new selling round.
Fed Fallout Set to Run Further
- Fed Chair Powell open to raising rates faster
- S&P 500 is likely to confirm technical correction
- Growth stocks and gold susceptible to more aggressive Fed
- Rising policy error risk could spur safe havens
Market screens worldwide are bathed in red as investors and traders worldwide come to terms with the Fed’s willingness to be more aggressive in getting inflation under control.
Asian stocks are falling alongside European and US futures, which should see the S&P 500 re-enter correction territory. Yields on the 10-year US Treasury are cooling slightly after yesterday’s spike towards the 1.90% mark, although the benchmark dollar index (DXY) is still pushing higher at the time of writing. The buck’s surge has already contributed to spot gold’s largest single-day drop since November, as the precious metal gets dragged closer to the $1800 mark.
Markets ramp up Fed tightening timeline
The jitters in equity markets were already on show at the start of the week when the VIX spiked to its highest level since October 2020. Fed Chair Jerome Powell’s latest hawkish pivot has coerced markets into believing that looming rate hikes could happen more frequently and the Fed balance sheet reduction will happen sooner-than-expected. Such a scenario may have well jarred the trapdoor below risk assets wider.
Since the start of the week, markets have now fully priced in an extra Fed rate hike by February 2023, bringing the tally to five over the next 12 months. The tightening cycle is expected to kick off in March, with Chair Powell implying as much at his press conference. There’s even the chance that the FOMC raises rates by 50-basis points at the next meeting, double the customary 25-basis point moves, if elevated inflation continues. The central bank will then commence its quantitative tightening after raising rates. The earlier-than-expected withdrawal of the Fed’s supportive polices and potentially faster pace of rate hikes suggests there’s more room for equities to fall.
Fed speak, inflation data might trigger even more volatility
In between FOMC meetings, policymakers and market participants are set to be data-dependent, keeping a watchful eye on the latest signals on consumer prices and adjusting their US monetary policy outlooks accordingly. The commentary out of Fed officials will also be gleamed for clues for policymakers’ biases towards monetary policy tightening.
Notable shifts in this hawkish narrative are set to trigger further bouts of volatility until markets can come to terms with higher rates. More aggressive revisions to the Fed policy outlook would leave tech and growth stocks susceptible to further declines while the greenback could advance to new cycle highs on the back of rising Treasury yields, at the expense of gold prices.
However, with key yield curves flattening further on the back of the latest FOMC meeting, markets are increasingly wary on the prospects of a Fed policy mistake that curtails growth in the world’s largest economy. If these concerns are taken up a notch, that could spur demand for safe haven assets.