

Sample Category Title
EUR/AUD Daily Outlook
Daily Pivots: (S1) 1.5763; (P) 1.5822; (R1) 1.5902; More...
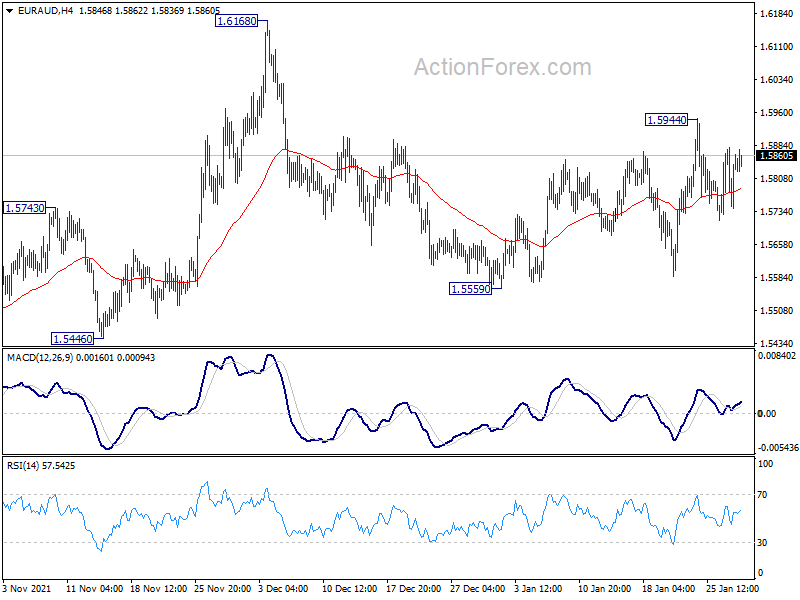
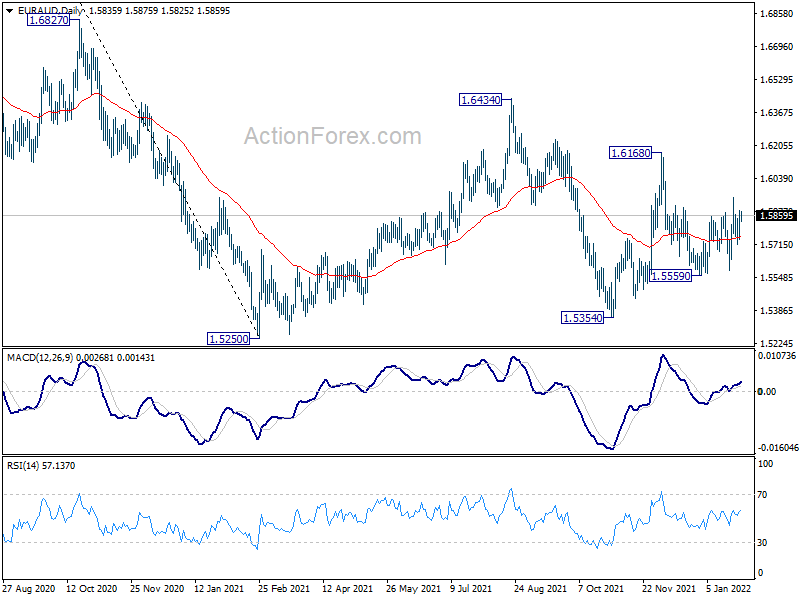
No change in EUR/AUD's outlook as range trading is still in progress. Intraday bias remains neutral for the moment. On the upside break of 1.5944 will resume the rise from 1.5559 to 1.6168 first. On the downside, break of 1.5559 will resume the fall from 1.6168 to retest 1.5250/5354 support zone.
In the bigger picture, rise from 1.5354 is seen as the third leg of the corrective pattern from 1.5250 low. Further rise cannot be ruled out, but even in that case, strong resistance should be seen at 38.2% retracement of 1.9799 to 1.5250 at 1.6988. Larger down trend from 1.9799 is in favor to extend through 1.5250 at a later stage.
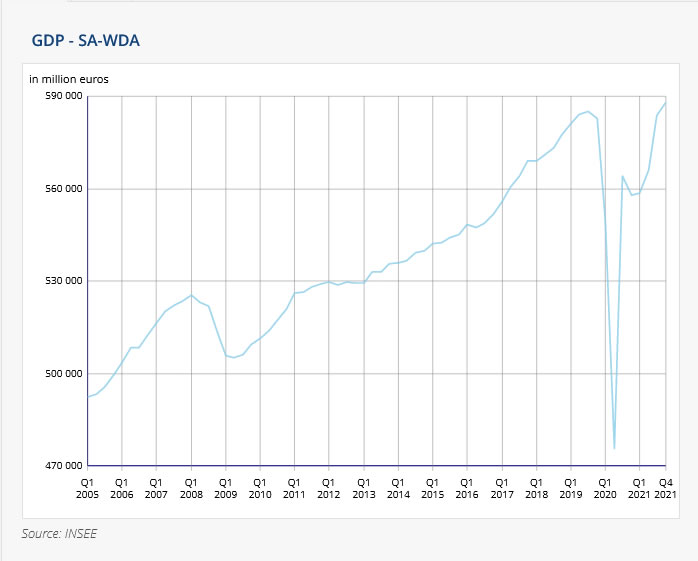
France GDP grew 0.7% in Q4, up 7% in 2021
France GDP grew 0.7% qoq in Q4, above expectation of 0.5% qoq. On average over 2021, GDP increased by 7.0% after -8.0% in 2020. GDP was 0.9% above pre-pandemic level in Q4 2019. But the average level of GDP in 2021 was still -1.6% below its average level in 2019.
Looking at some details, final domestic demand (excluding inventories) contributed to +0.5 points. In particular, the growth rate of household consumption expenditure (+0.4%) was similar to that of gross fixed capital formation (GFCF, +0.5%). Contribution of foreign trade to GDP growth was slightly negative this quarter at -0.2 points. contribution of inventory changes to GDP growth was positive this quarter (+0.4%).
EURJPY Consolidates as Bearish Tone Softens
EURJPY buyers are fighting back after recording a one-month low of 128.24, where a support base has developed during this past week. That said, the 200-period simple moving average (SMA) is endorsing a broader neutral bias, while the bearish 50- and 100-period SMAs are defending the descent in the pair. Worth mentioning is a nearing bearish crossover of the 200-period SMA by the 100-period one, which would confirm selling interest has ramped up.
The Ichimoku lines are indicating that downward forces are struggling, while the short-term oscillators are transmitting mixed signals in directional momentum. The MACD, in the negative region, is remaining buoyant north of the red trigger line, while the RSI is encountering some difficulty in overstepping the 50 threshold. The positively charged stochastic oscillator is promoting upside gains in the pair.
If the price pushes over the Ichimoku lines, which are hovering around 128.75, resistance could then evolve around the nearby 128.95 high and the approaching 50-period SMA at 129.10. Not much higher, the cloud’s lower band and the 129.23-129.44 resistance border may prove difficult to conquer. Yet, if the bulls succeed, they could then aim for the 200-period SMA at 129.72, which if breached too, would reinforce upside confidence bringing the 129.96-130.08 resistance barrier into play.
If the Ichimoku lines around 128.75 halt moves higher, sellers may face initial downside limitations from the 128.24-128.42 hardened floor. Sliding below this boundary, the pair could snag at the 128.00 handle as it directs for the 127.30-127.50 upside defence, which extends back until February 2021. A break beneath the support foundation could intensify the bearish bias with a drop headed to the 127.00 mark.
Summarizing, EURJPY is exhibiting a neutral-to-bearish tilt and a break below the 128.24-128.42 immediate floor could boost downside tendencies. That said, for the bullish mood to improve, the price would need to climb north of the 130.00 mark.
ECB Preview – Inflation Uncertainty and Data Dependency
The Fed meeting this week has turned the ECB meeting on Thursday next week much more interesting than anticipated from a market perspective. While we do not expect the meeting to bring significant new signals to the market, attention to the elevated inflation and even more data dependence as well as the difference to Fed will be in focus.
Since the December meeting, where ECB communicated its planned monetary policy calibration until October 2022, no data release has warranted a change in stance. We expect ECB to convey a robust, yet slowing, economic outlook and an elevated uncertainty on the inflation outlook with a confirmation of inflation expected to settle below the 2% target towards the end of the year and in 2023 and 2024.
We expect attention to the recent rise in real rates, but given the absolute level of the metric, we do not believe this would give cause for concern at the ECB.
We do not see ECB giving indications to follow the other major central banks in their tightening cycle. To us, it would be a surprise if ECB were to announce new TLTRO rounds at the meeting next week. We continue to expect tiering multiplier to be increased to 12 later in the year (most likely in June).
From a near-term market reaction perspective, we remain unconvinced whether markets will buy into the ECB's wait-and-see stance and keep the very aggressive front end pricing for Dec22 (which are 21bp).
EUR/USD Reaches Lowest Levels Since Spring 2020
Market movers today
Q4 21 GDP figures are released for a range of euro area countries. While Germany's GDP likely declined amid continuing manufacturing bottlenecks and increased consumer caution, Spain and France might have edged out a plus. EU Commission's economic sentiment for January is also released.
In the US, personal consumption data will give more insights about how consumers reacted to the new COVID-19 wave and rising prices in December, after the weak retail sales figures. PCE inflation data for December is also due.
We expect Swedish GDP to have expanded by 0.9% q/q in Q4 21, while NIER's economic survey will likely show easing confidence in January. In Norway, unemployment and retail sales figures are on the agenda.
The 60 second overview
Central banks in focus: Markets continued to digest Wednesday's hawkish FOMC message, with five 25bp hikes now almost fully priced in for this year. US dollar continued to appreciate, with EUR/USD breaking below 1.12 and reaching lowest levels since spring 2020. Market sentiment has remained relatively calm despite the looming monetary tightening, with equities ending the day somewhat lower, but commodities holding on to their early 2022 gains. US Q4 GDP also surprised to the upside, with annualized q/q growth rate picking up 6.9%. While the rise was partially driven by inventory building, private consumption remains strong, supporting the case for tighter monetary policy. While we do not look for new signals from the ECB next week, Fed's more hawkish line makes the meeting more interesting from market perspective given the elevated inflation pressures and increasing divergence between the two central banks. Read more in our ECB Preview - Inflation uncertainty and data dependency, 28 January.
Russia-Ukraine standoff: Yesterday there was a relief rally in RUB as Russia did not rule out further talks with the US over its security demands despite the US written response falling short of Russian demands. The Russian officials indicated that the US and Russia are looking into a new meeting between the two countries foreign ministers next week. If such a meeting will indeed be setup, it will be hard to imagine a Russian move into Ukraine near-term. There were also some media stories that China had urged Russia not to escalate military tensions when the winter Olympics takes place from next Friday until 20 February. This was rebuked by China but given that China is increasingly the most important Russian allied, the two sides may well be in contact over the situation. This would point to diplomatic dialogue being tried out over the next month. We continue to see it as a close call whether Russia will move in military in Ukraine or a diplomatic solution is found. RUB has rallied some 4% and Russian equities have risen over 10% since yesterday.
Commodities: While worries around possible sanctions affecting Russian supply have likely supported crude oil price recently, brent has remained around USD90/bbl this week despite the relief rally in RUB markets and hawkish FOMC. Similarly, while easing from China provides some support, industrial metal prices have held on to their early 2022 gains. We continue to see this as a challenging environment for the Fed, and we eventually expect broad commodity prices to moderate amid Fed tightening and broad USD appreciation.
Equities: US markets closed somewhat lower on Thursday in volatile trading, as investors digested the FOMC meeting. Interestingly, defensives - and not value - was the clear winner, although investors squeezed in a fifth rate hike into the market pricing. Consumer discretionary and bond proxy real estate led the market lower, while utilities and energy ranked among the outperformers. Dow closed unchanged, S&P 500 -0.5%, Nasdaq -1.4% and Russell 2000 in huge underperformance, down -2.3%. VIX moved somewhat lower for the first time since the selloff. Asian markets are rebounding this morning after the sharp selloff yesterday. US futures are also higher.
FI: A strong sell-off from the get go driven by the one-sided hawkish Fed comments on Wednesday night lead to Bunds peaking 5bp higher. After the initial reaction the move gradually faded during the trading session, with Bunds ending the day less than 2bp higher. The BTPs-Bund spread tightened markedly 6bp to 134bp amid still no outcome on the Italian presidential election. The curve flattened markedly, with both the short end higher and the long end lower in yields, in a classical response to the Fed communication.
FX: One can look at this week's price action as a regime shift having taken place in spot EUR/USD: Market confidence has strongly increased in favour of a stronger USD. We continue to forecast 1.08. In RUB, risks appear to have been overdone in the short term: RUB has rallied some 4% and Russian equities have risen over 10% since yesterday.
Credit: Heavy trading in credit where particularly CDS indices were in bad shape, with iTraxx Xover widening 8.4bp, thus closing in 280bp and Main 1.9bp, closing in 58. HY bonds widened 3.5bp and IG 0.5bp.
Nordic macro
Sweden: Statistics Sweden (SCB) releases the Q4 GDP indicator 08.00 CET. Market consensus is for a 1.0 % qoq increase, a tenth above our own forecast. In addition, SCB also releases December LFS, retail sales and household lending, however, all these are of less importance given the GDP outcome. More interesting is the January NIER (KI) survey, which showed declining confidence in all sectors except manufacturing in December. The previous survey also showed very high selling price expectations in retail trade and manufacturing while it was substantially more modest in private services.
Riksbank buys linkers, SEK 0.5 bn each of IL3109 and IL3114.
Norway: In Norway, layoffs have stopped rising since the government introduced support for wages at COVID-stricken businesses before Christmas. We therefore expect seasonally adjusted registered unemployment to be unchanged at 2.3% in January, and the unadjusted rate to rise to 2.6%.
There have been some big swings in retail sales in recent months, but levels are still around 7% above pre-COVID levels. We therefore expect them to come down at some point as the economy reopens again and consumption shifts more towards services, but uncertainty is high in the coming months.
EUR/USD Pair is Now Correcting Higher from the 1.1131 Low
The Euro started a fresh decline from well above the 1.1320 zone against the US Dollar. The EUR/USD pair traded below the 1.1250 support zone to move into a bearish zone.
There was also a move below the 1.1200 level the 50 hourly simple moving average. A low was formed near 1.1131 and the pair is now correcting higher. An immediate resistance near the 1.1155 level.
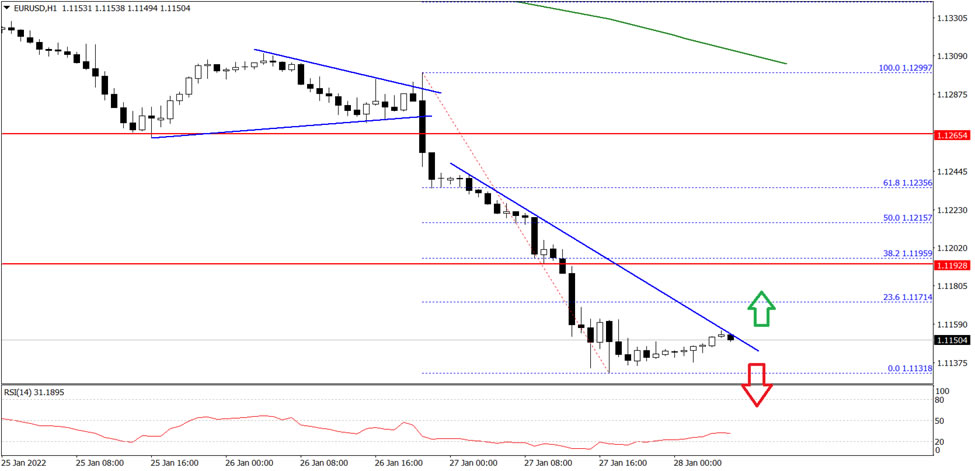
The next major resistance is near the 1.1180 level. A break above the 1.1180 and 1.1185 resistance levels could start a decent increase towards the 1.1220 level in the near term.
On the downside, an initial support is near 1.1140 on FXOpen. The next key support is near 1.1120, below the pair could decline heavily. In the stated case, the pair could move down towards the 1.1050 level in the near term.
Technical Outlook and Review
DXY:
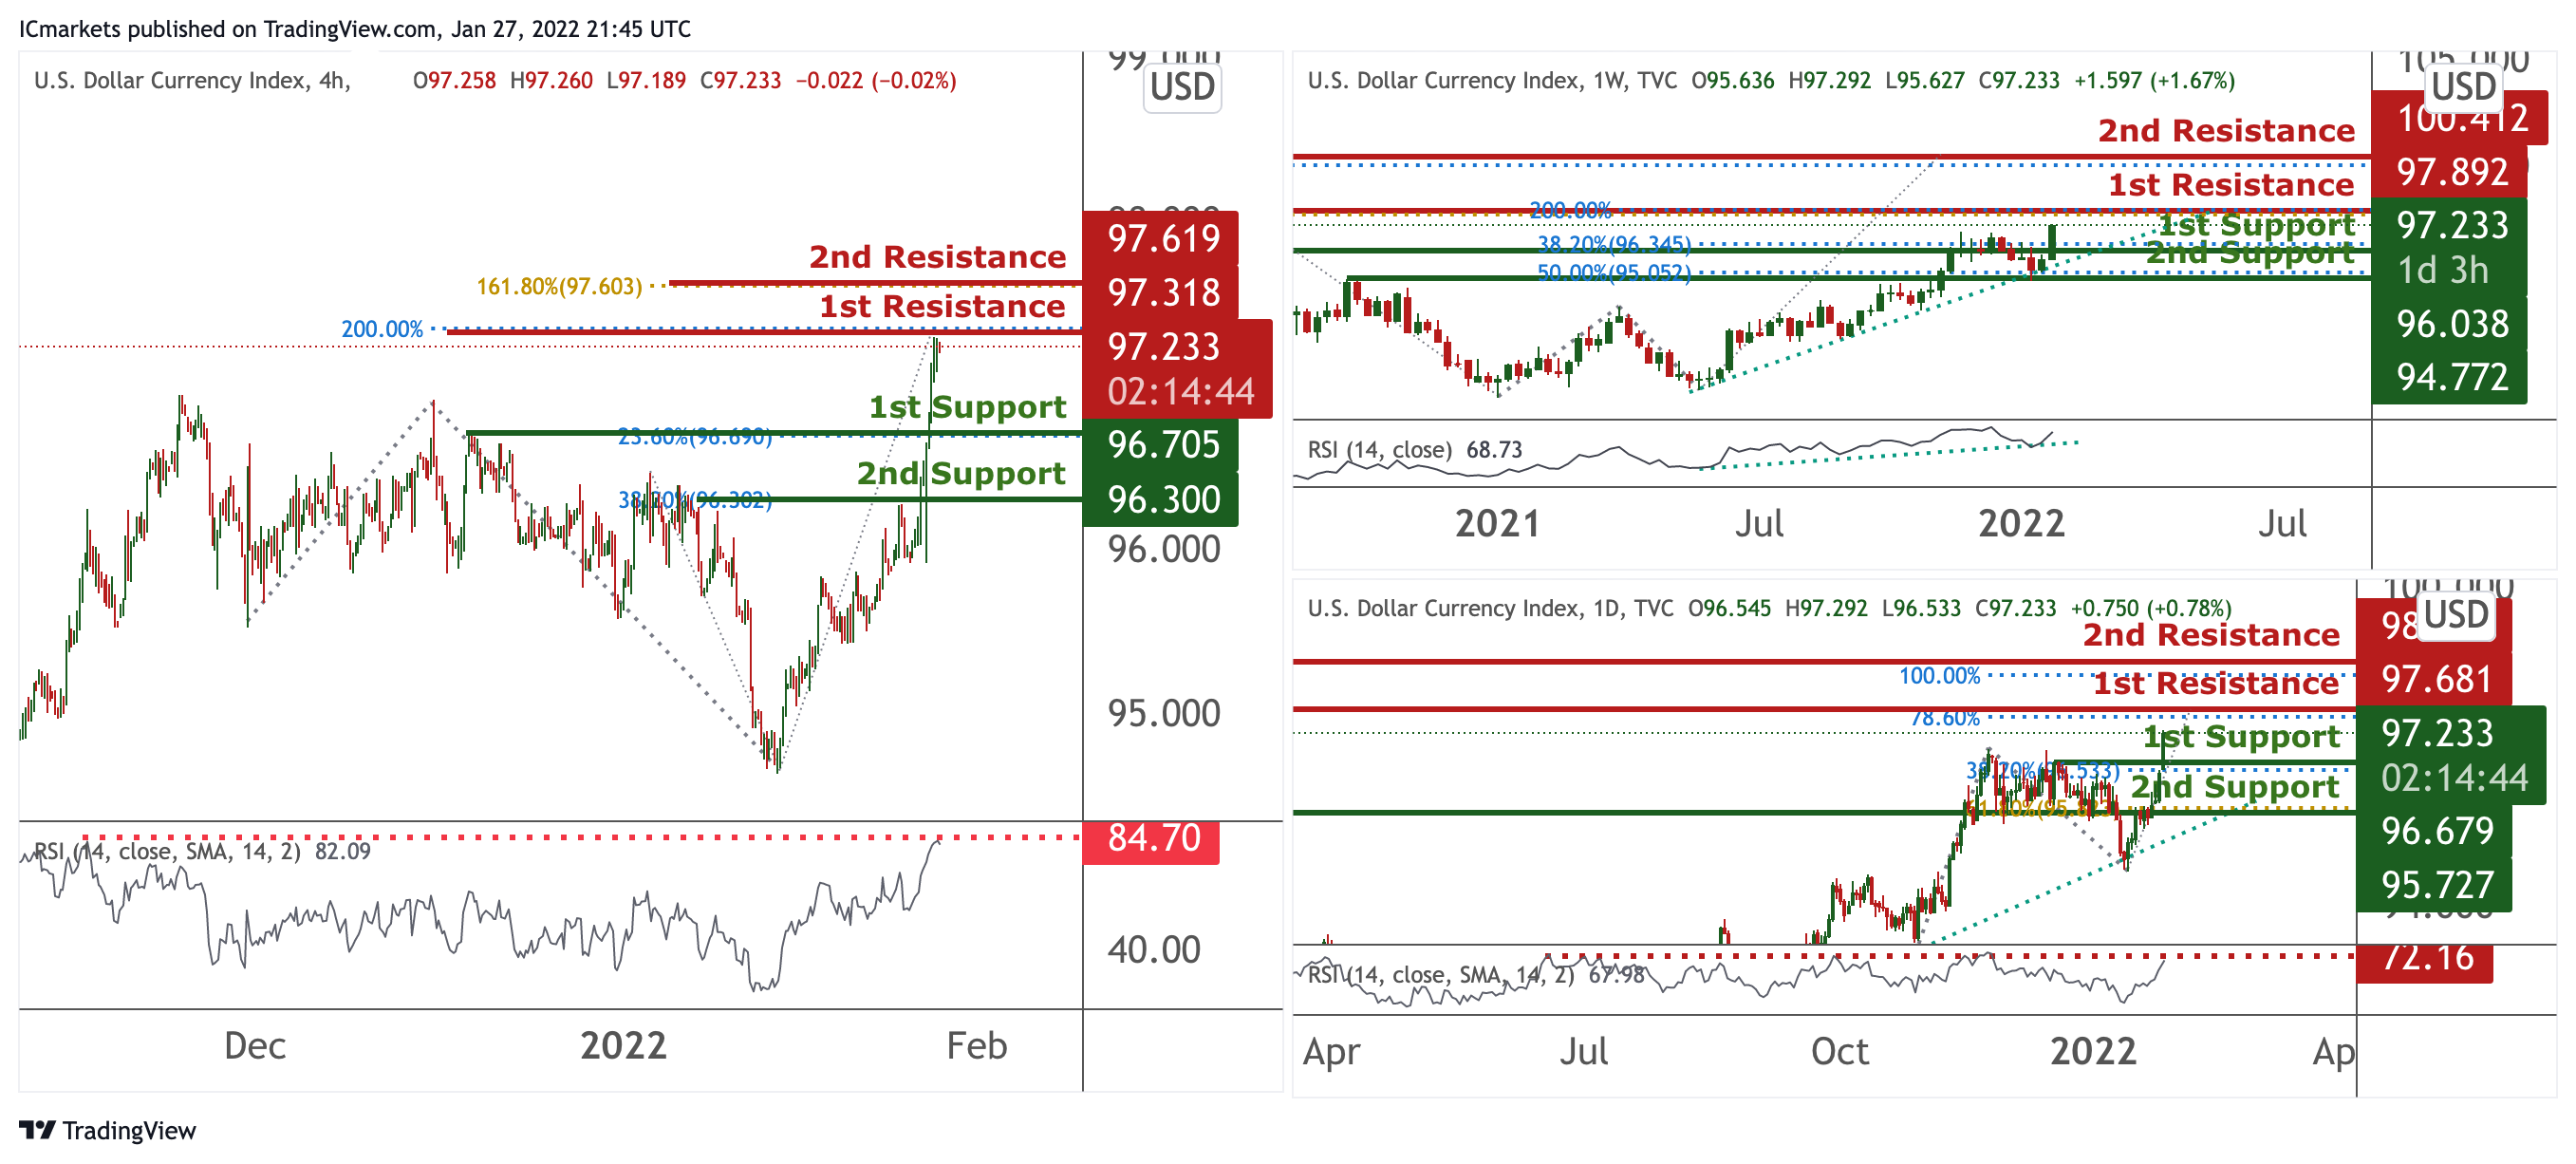
On the weekly timeframe, prices were on bullish momentum and abiding to our ascending trendline. We see the potential for a dip from our 1st resistance at 97.892 in line with 200% Fibonacci projection towards our 1st support at 97.233 in line with 38.2% Fibonacci retracement. RSI are at levels where dips previously occurred. On the daily timeframe, prices were on bullish momentum. We see the potential for further upside towards our 1st resistance at 97.681 in line with 78.6% Fibonacci extension towards our 1st support at 96.679 in line with 38.2% Fibonacci retracement. RSI are at levels where dips previously occurred.
On the H4 timeframe, prices are on bullish momentum and have reached an all time high. We would expect potentially a dip from our 1st resistance at 97.319 in line with 200% Fibonacci projection towards our 1st support at 96.705 in line with 23.6% Fibonacci retracement. RSI are at oversold extremes, further supporting our bearish bias.
Areas of consideration:
- H4 time frame, 1st resistance at 97.318
- H4 time frame, 1st support at 96.705
XAU/USD (GOLD):
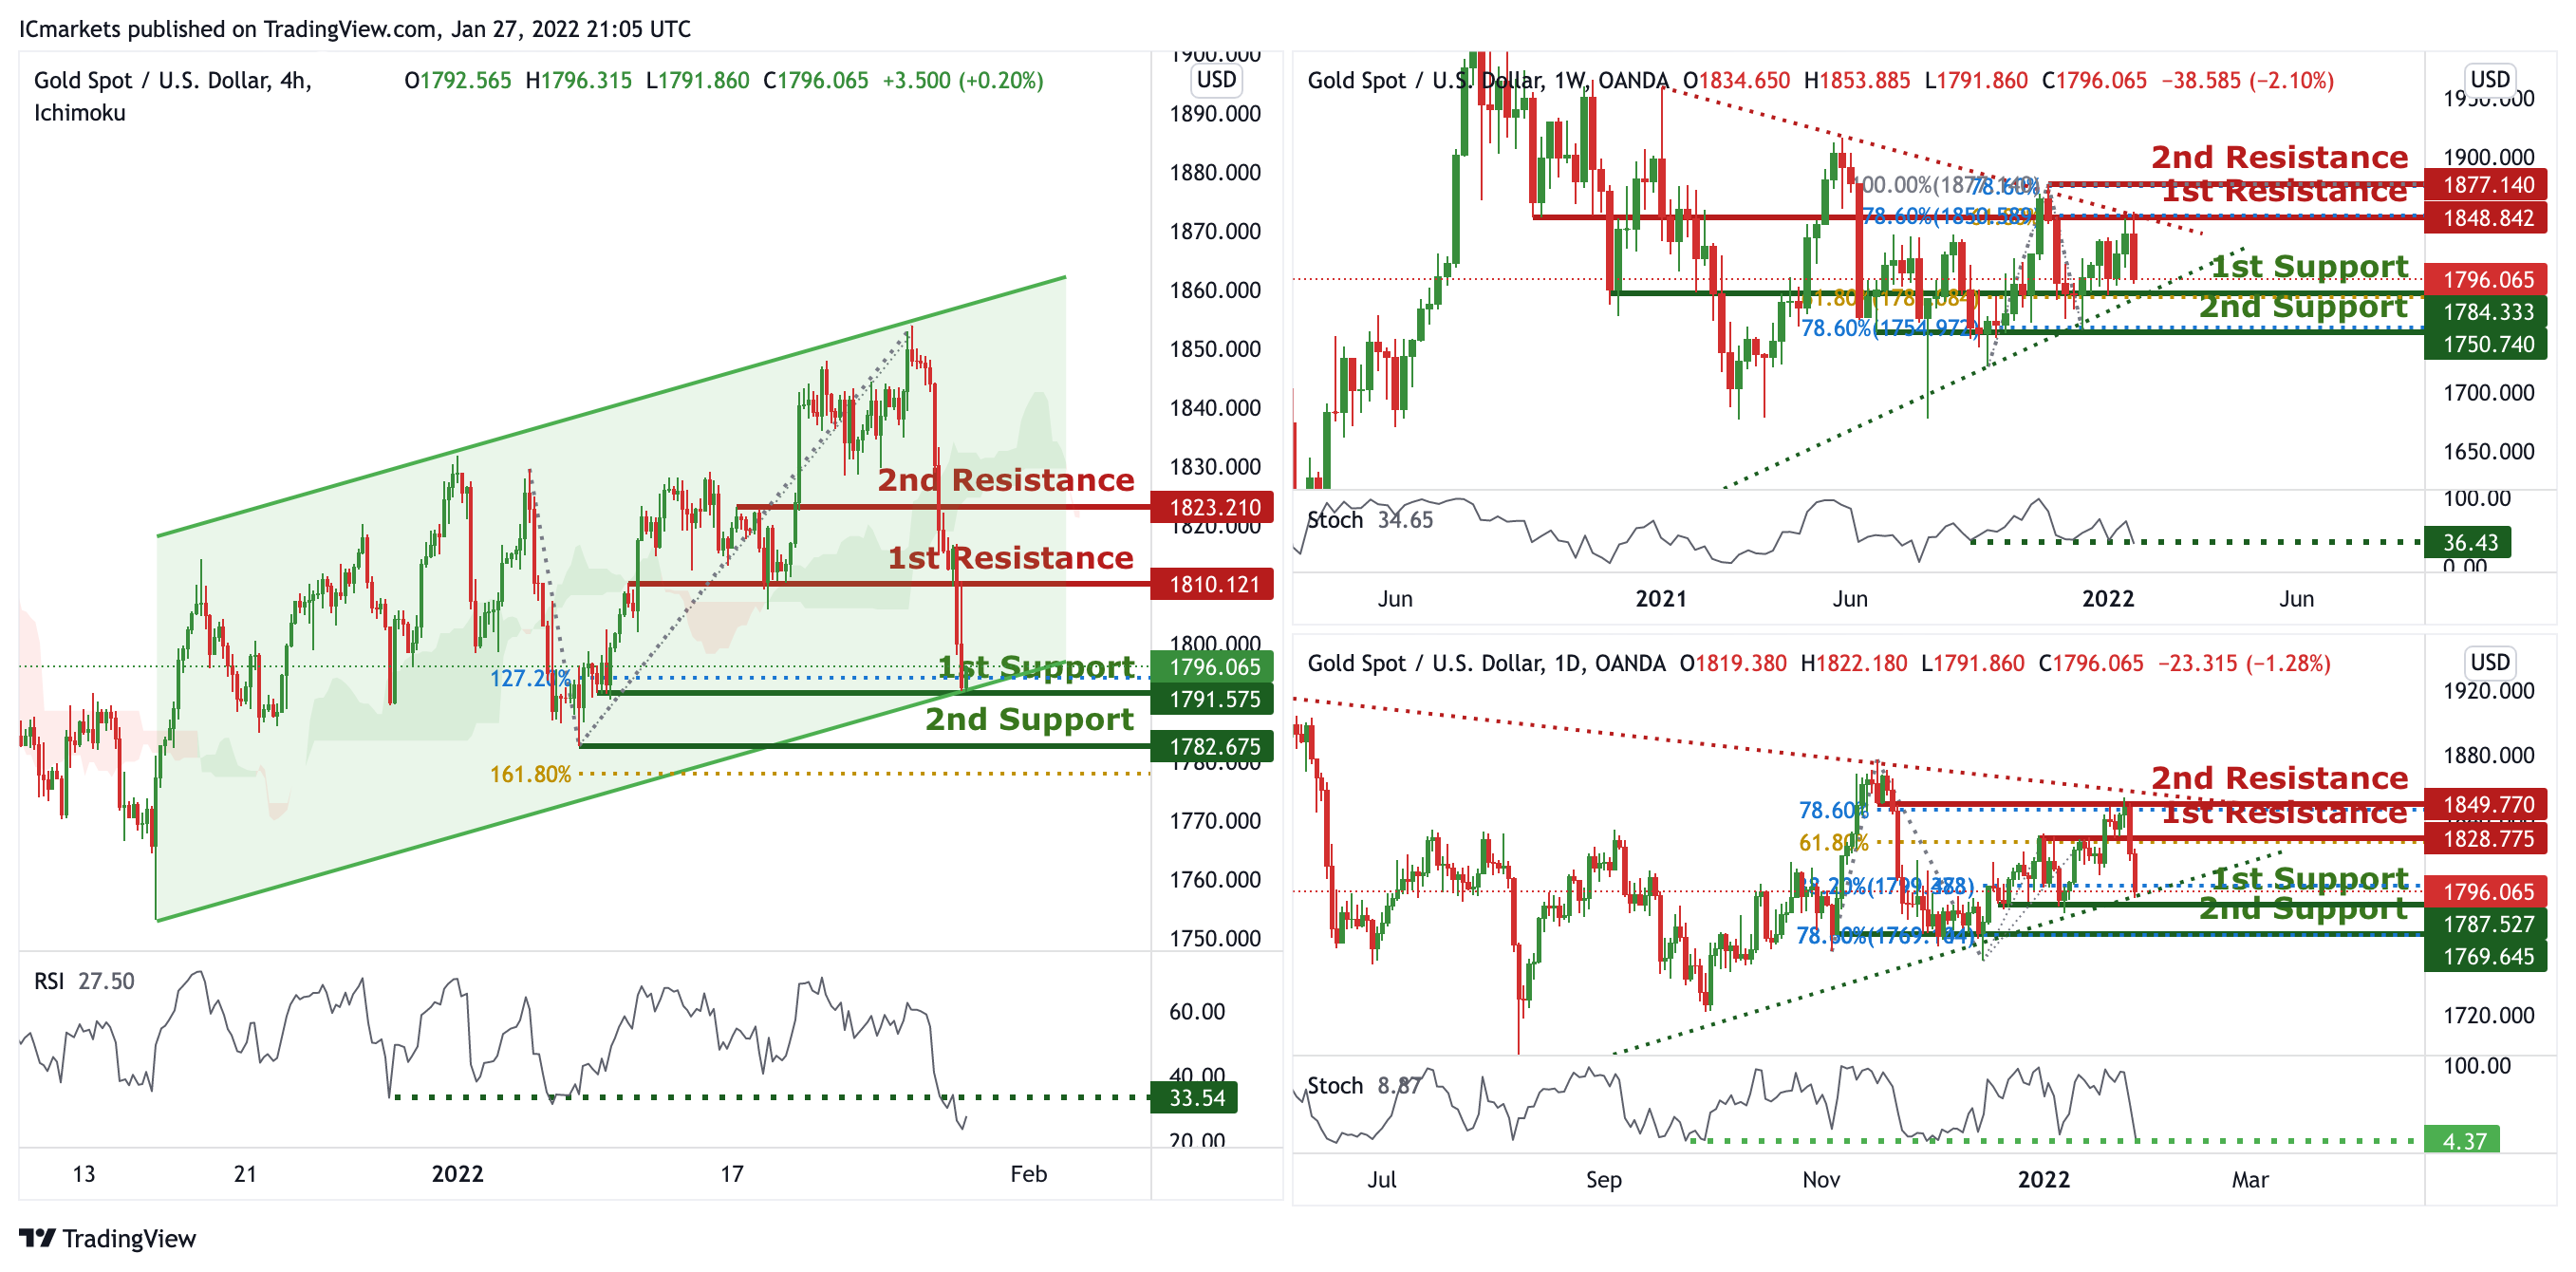
On the weekly, prices are consolidating in a triangle and are approaching our 1st support. We see the potential for a bounce from our 1st support at 1784.333 in line with 61.8% Fibonacci retracement towards our 1st resistance at 1848.842 in line with 78.6% Fibonacci retracement. RSI are at levels where bounces previously occurred. On the daily, prices are consolidating in a triangle and are approaching our 1st support. We see the potential for a bounce from our 1st support at 1787.527 in line with 38.2% Fibonacci retracement towards our 1st resistance at 1828.775 in line with 61.8% Fibonacci extension. RSI are at levels where bounces previously occurred.
On the H4 chart, prices are on bullish momentum and consolidating in a parallel channel. We see a potential for a bounce from our 1st support at 1791.575 in line with 127.2% Fibonacci extension towards our 1st resistance at 1810.121 which is a graphical overlap. RSI are at overbought extremes, further supporting our bullish bias.
Areas of consideration:
- 4h 1st support at 1791.575
- 4h 1st resistance at 1810.121
GBP/USD
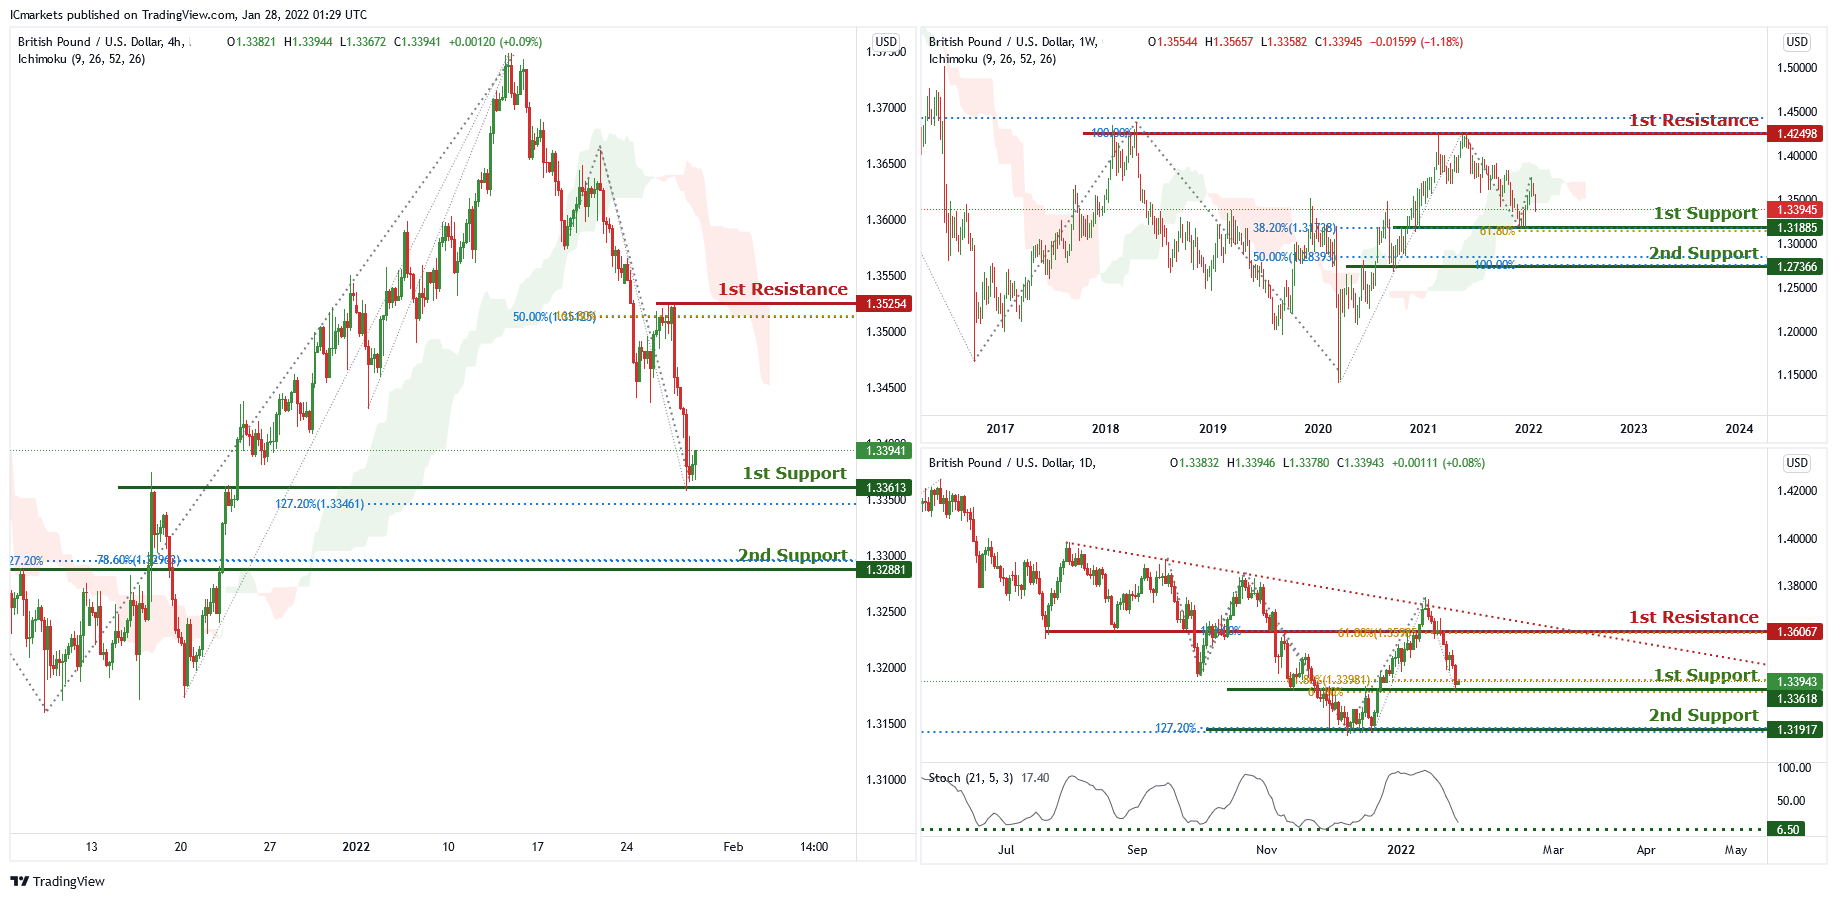
On the weekly chart , price is near 1st support level of 1.31885 which is also 61.8% Fibonacci projection and 38.2% Fibonacci retracement. Price can potentially go to the 1st resistance level of 1.42498 which is also 100% Fibonacci projection and 50% Fibonacci retracement. Our bullish bias is supported by the ichimoku cloud indicator.
On the daily chart , price is abiding by the descending trendline and near 1st support level of 1.33618 which is also 61.8% Fibonacci retracement and 61.8% Fibonacci projection. Price can potentially experience a short bounce to the 1st resistance level of 1.36067 which is also 61.8% Fibonacci retracement and 100% Fibonacci projection. Our bullish bias is supported by the stochastic indicator as it is near support level.
On the H4 chart price is near 1st support level of 1.33613 which is also 127.2% Fibonacci retracement. Price can potentially bounce to the 1st resistance level of 1.35254 which is also 50% Fibonacci retracement and 161.8% Fibonacci projection. Our bullish bias is supported by the stochastic indicator as it is at support level.
Areas of consideration:
- H4 1st resistance 1.35254
- H4 1st support 1.33613
USD/CHF:
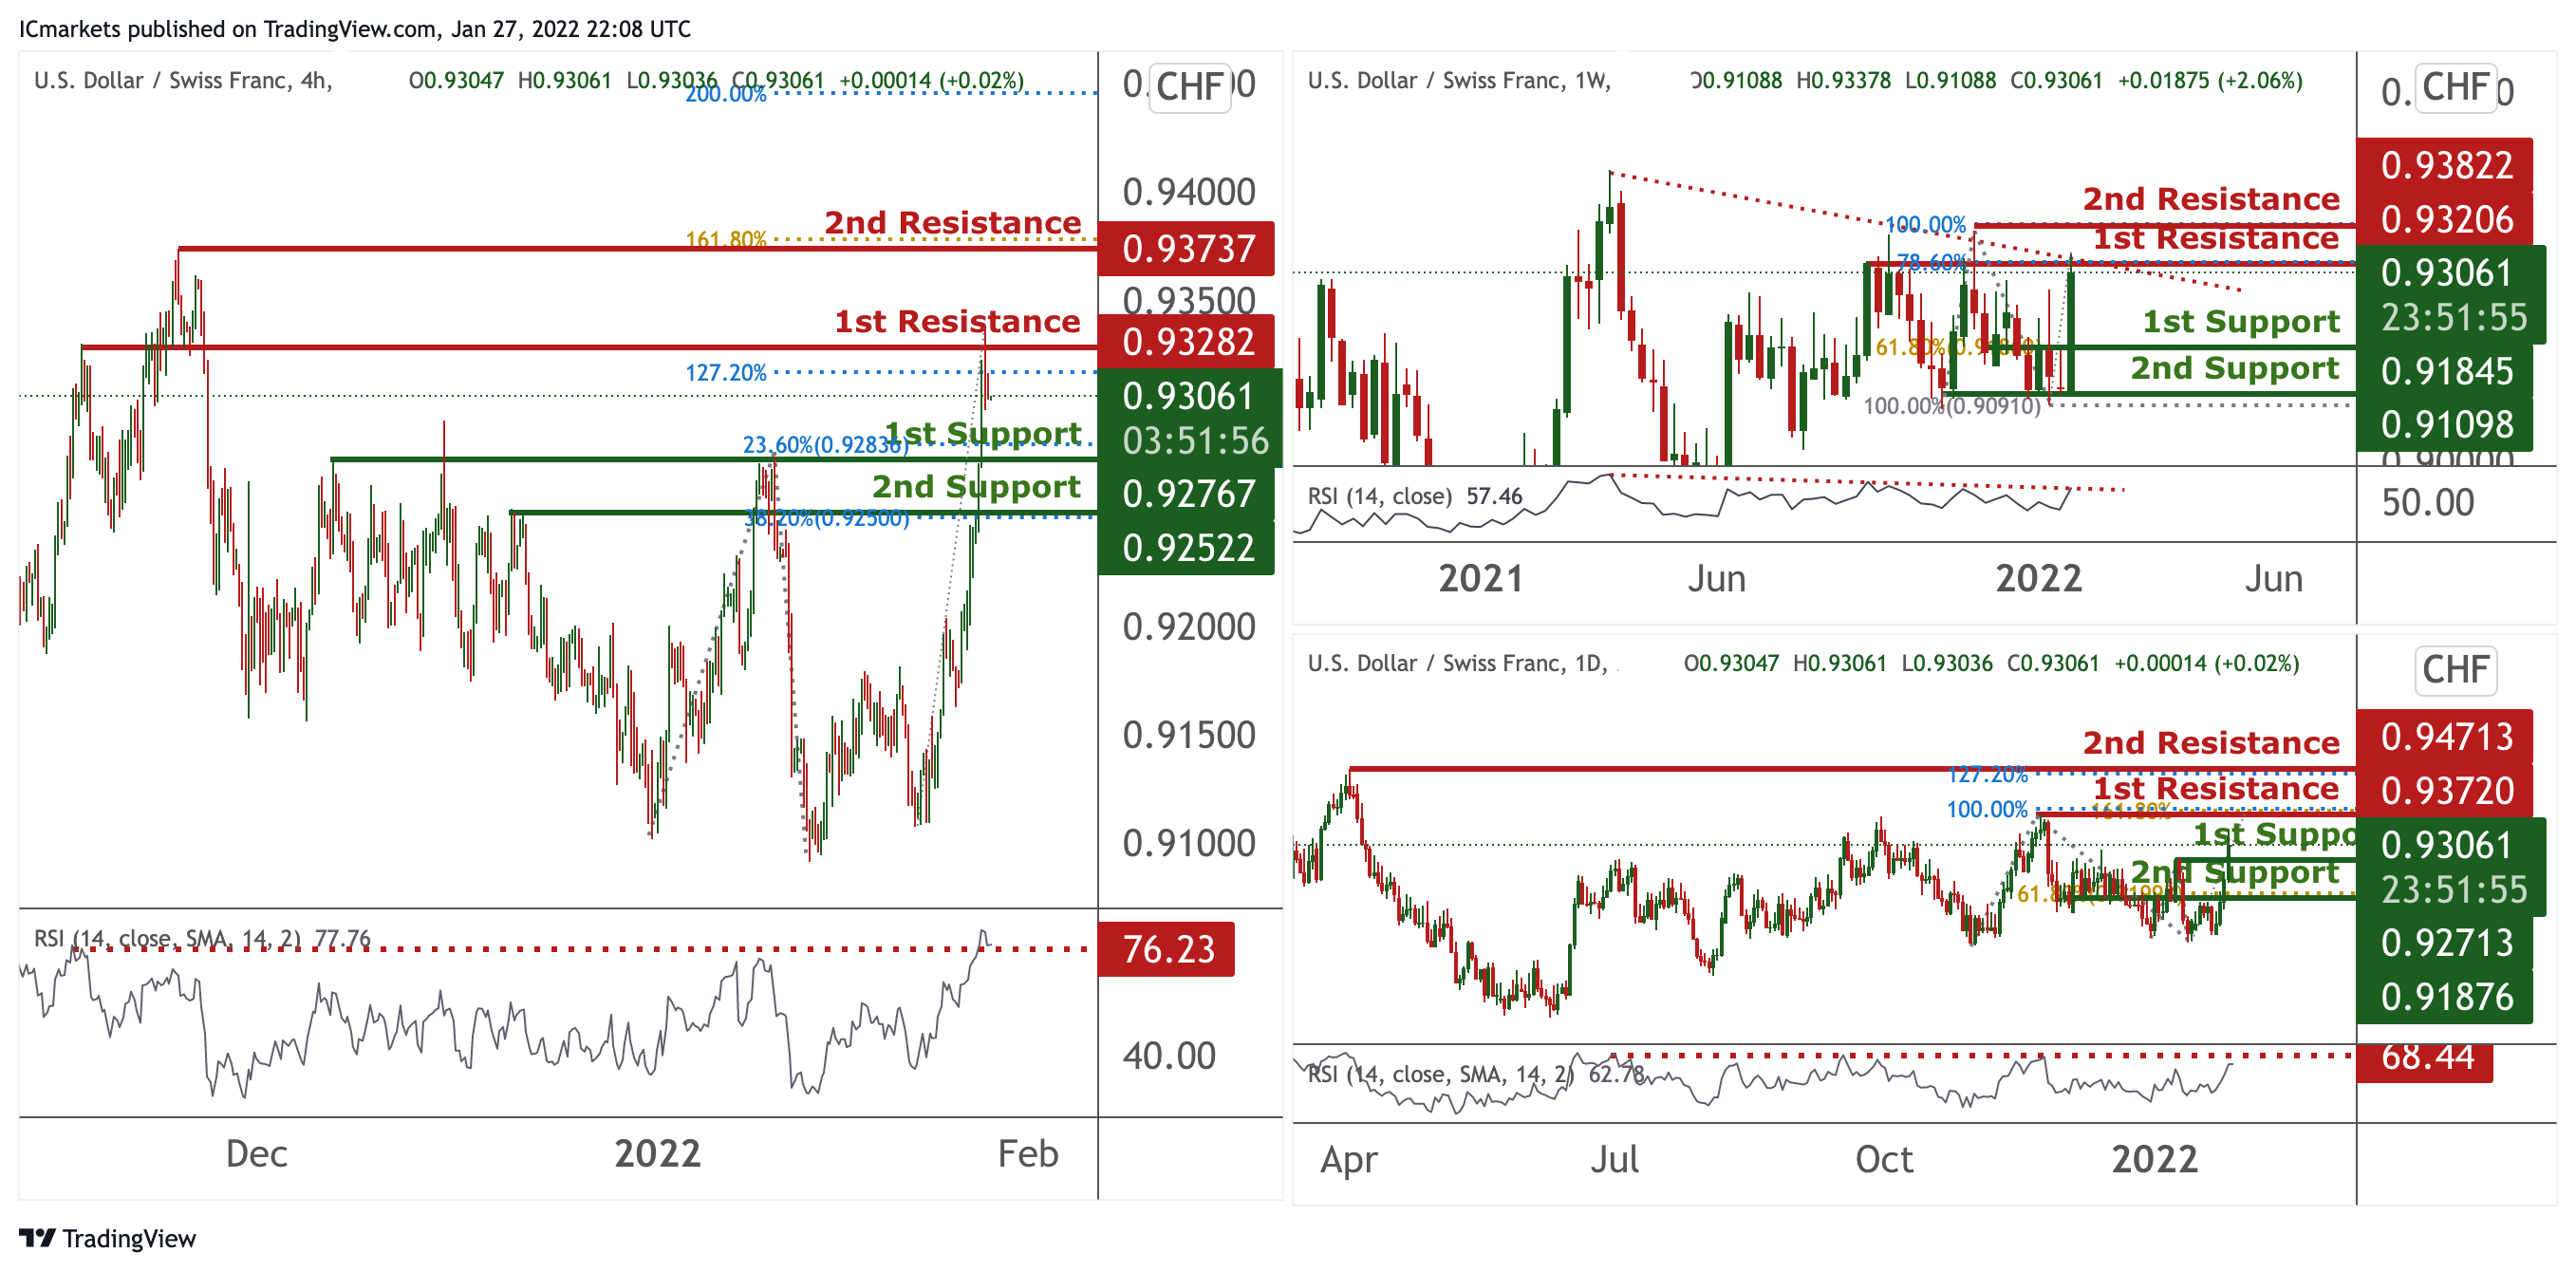
On the weekly, prices are on bearish momentum and abiding to our descending trendline. We see the potential for a dip from our 1st resistance at 0.93206 in line with 78.6% Fibonacci extension towards our 1st support at 0.91845 in line with 61.8% Fibonacci retracement. RSI is showing bearish momentum. On the daily chart, prices are hovering in between 2 levels. We see the potential for a dip if prices approaches our 1st resistance at 0.93720 in line with 100% Fibonacci extension towards our 1st support at 0.92713 which is a graphical overlap. RSI are at levels where dips previously occurred.
On the H4 timeframe, prices were on bullish momentum and are at a pivot. We see the potential for a dip from our 1st resistance at 0.93282 in line with 127.2% Fibonacci extension towards our 1st support at 0.92767 in line with 23.6% Fibonacci retracement. RSI is at levels where dips previously occurred.
Areas of consideration:
- Watch 1st Support at 0.90961
- Watch 1st Resistance at 0.91967
EUR/USD:
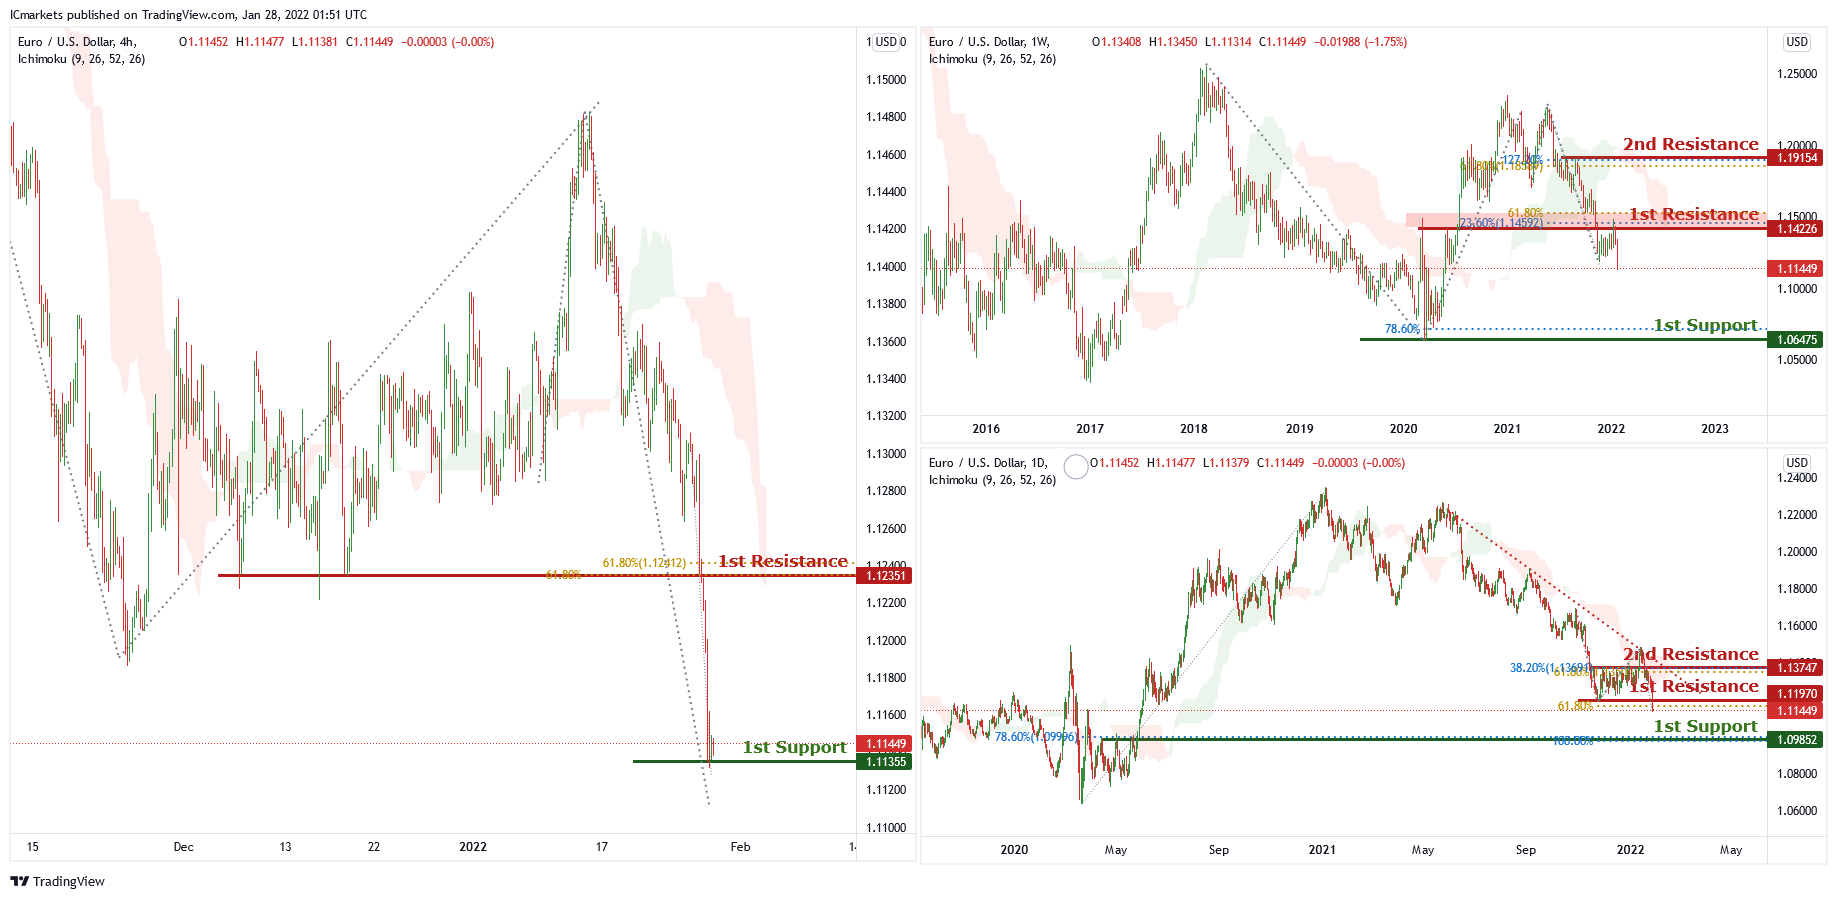
On the weekly chart , price is near 1st resistance level of 1.14226 which is also 23.6% Fibonacci retracement and 61.8% Fibonacci projection. Price can potentially dip to the 1st support level of 1.06475 which is also 78.6% Fibonacci projection and graphical swing low. Our bearish bias is supported by the ichimoku cloud indicator as price is trading below it.
On the daily chart, price is near 1st resistance level of 1.11970 which is also 61.8% Fibonacci projection. Price can potentially dip to the 1st support level of 1.09852 which is also 100% Fibonacci projection and 78.6% Fibonacci retracement. Our bearish bias is supported by the ichimoku cloud indicator as price is trading below it.
On the H4 chart price is near 1st support level of 1.11355 which is the graphical swing low. Price can potentially bounce to the 1st resistance level of 1.12351 which is also 61.8% Fibonacci projection and 61.8% Fibonacci retracement. Our bullish bias is supported by technical indicators.
Areas of consideration :
- H4 1st resistance at 1.12351
- H4 1st support at 1.11355
USD/JPY
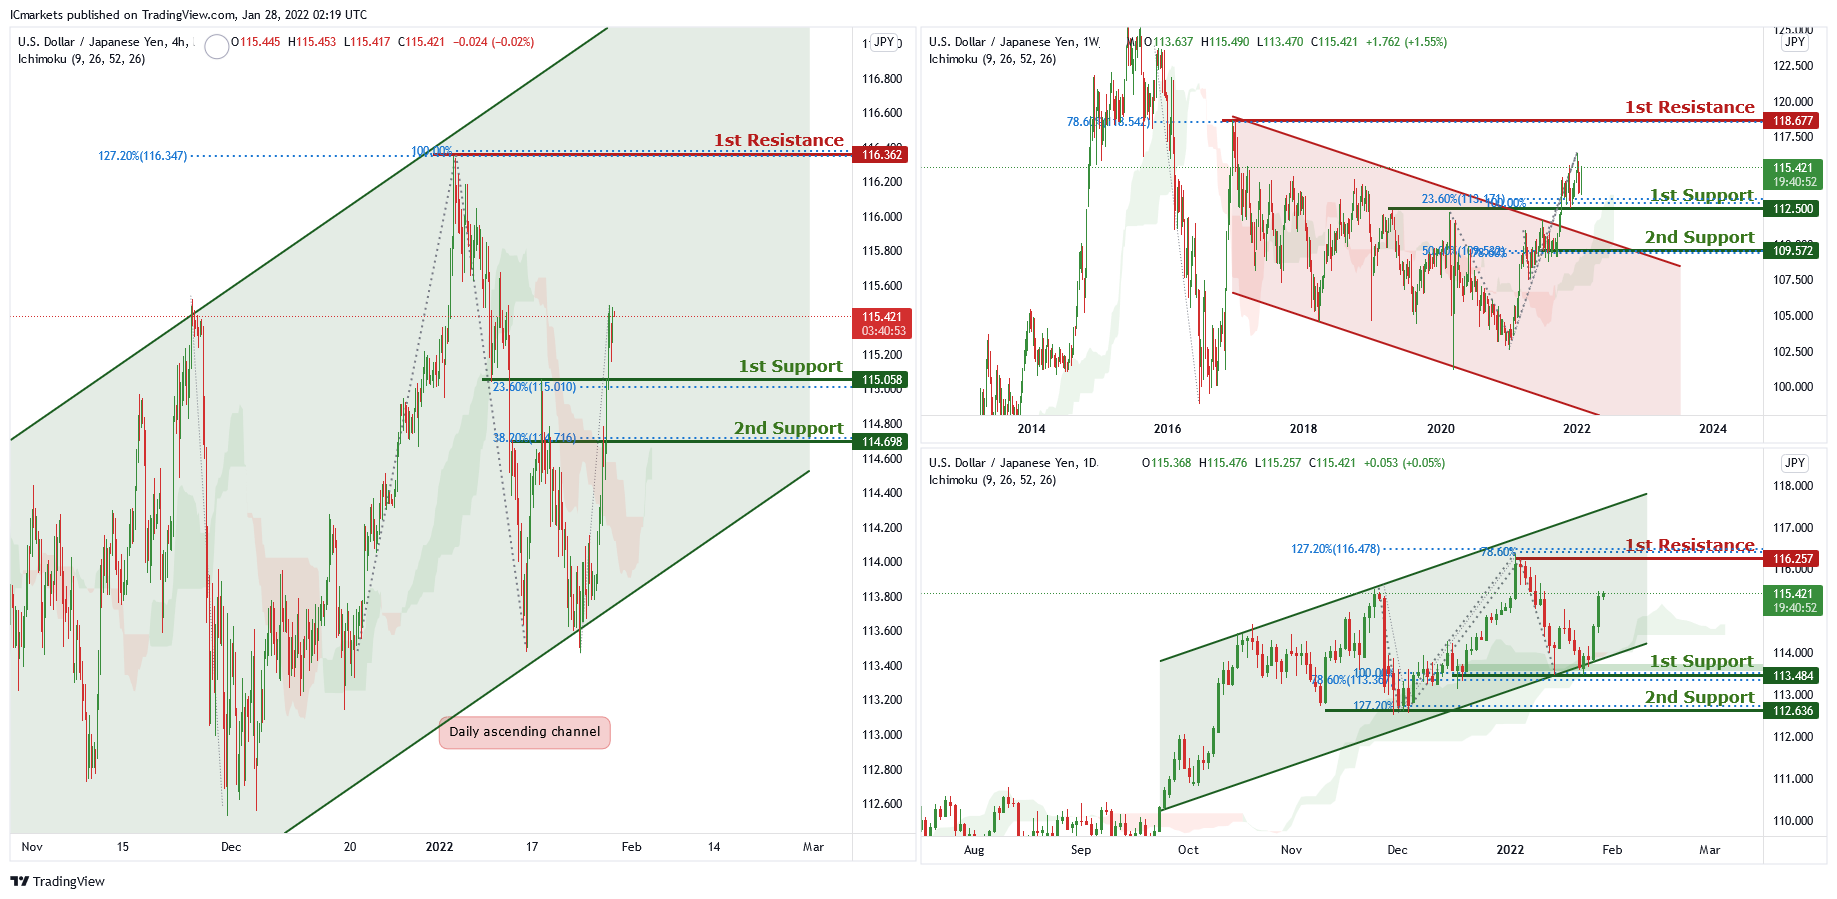
On the weekly chart, price has broken out of the descending channel and near support level of 112.500 which is also 23.6% Fibonacci retracement and 100% Fibonacci projection. Price can potentially go to the 1st resistance level of 118.677 which is also 78.6% Fibonacci retracement. Our bullish bias is supported by the ichimoku cloud indicator as price is trading above it.
On the daily chart price is trading in an ascending channel and is between 1st resistance of 116.257 which is also 127.2% Fibonacci retracement , 78.6% Fibonacci projection and 1st support of 113.484 which is also 100% Fibonacci projection and 78.6% Fibonacci retracement. Our bullish bias is supported by the ichimoku cloud indicator as price is trading above it.
On the H4 chart, price is trading in an ascending channel and is near 1st support level of 115.058 which is also 23.6% Fibonacci retracement. Price can potentially go to the 1st resistance level of 116.362 which is also 100% Fibonacci projection and 127.2% Fibonacci retracement. Our bullish bias is supported by the ichimoku cloud indicator as price is trading above it.
Areas of consideration:
- H4 1st support at 115.058
- H4 1st resistance at 116.362
AUD/USD:
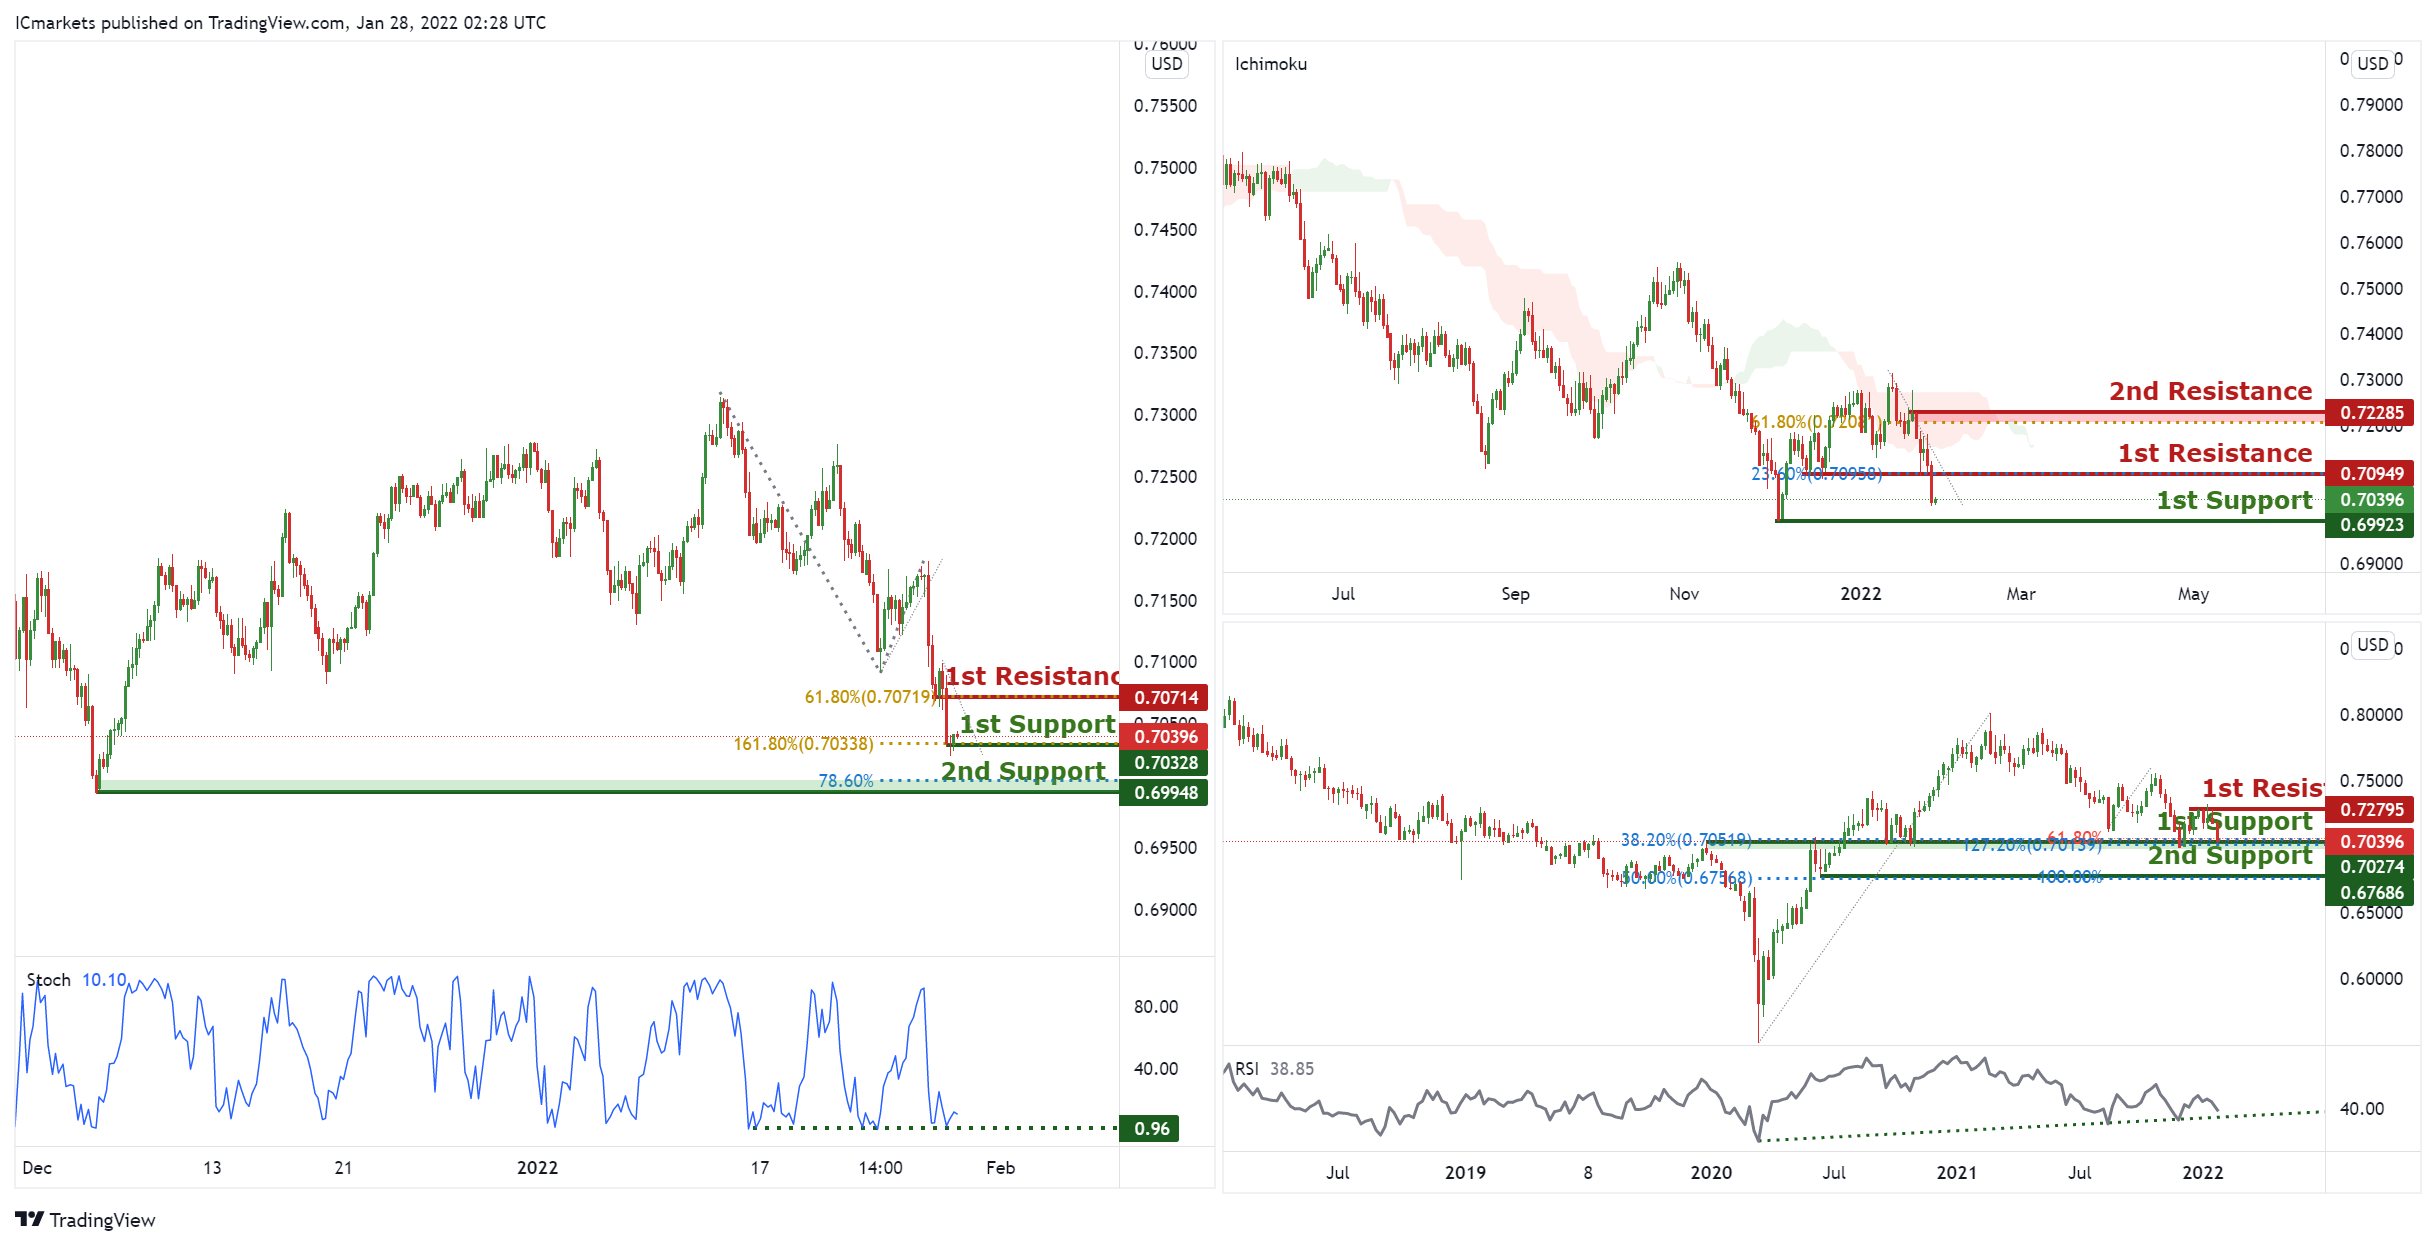
On the Weekly, with price moving below the ichimoku cloud, signifying an overall bearish momentum. We can expect price to drop from our 1st resistance at 0.70949 in line horizontal graphical overlap and 23.6% Fibonacci retracement towards 1st support in line with horizontal swing low support at 0.69923. Alternatively, price may break 1st resistance structure and head for 2nd resistance, which coincides with 61.8% Fibonacci retracement at 0.72285.
On the Daily, we expect a potential bounce from our 1st support at 0.70274 where there is a confluence of the 38.2% Fibonacci retracement, 61.8% Fibonacci retracement and 127.2% Fibonacci extension towards our 1st resistance at 0.72795 in line with the swing high resistance. Alternatively, price may break 1st support structure and head for 2nd support at 0.67686 in line with the 100% Fibonacci projection and 50% Fibonacci retracement. Our bullish bias is further supported by how price is expected to bounce off the stochastics support level.
On the Weekly, we expect a potential bounce from our 1st support at 0.70328 which is in line with the 161.8% Fibonacci extension towards our 1st resistance at 0.70714 in line with the horizontal overlap resistance and 61.8% Fibonacci retracement. Alternatively, price may break 1st support structure and head for 2nd support at 0.69948 in line with the 78.6% Fibonacci retracement. Our bullish bias is further supported by how price is expected to bounce off the stochastics support level.
Areas of consideration:
- H4 1st Support level 0.70328
- H4 1st resistance level 0.70714
NZD/USD:
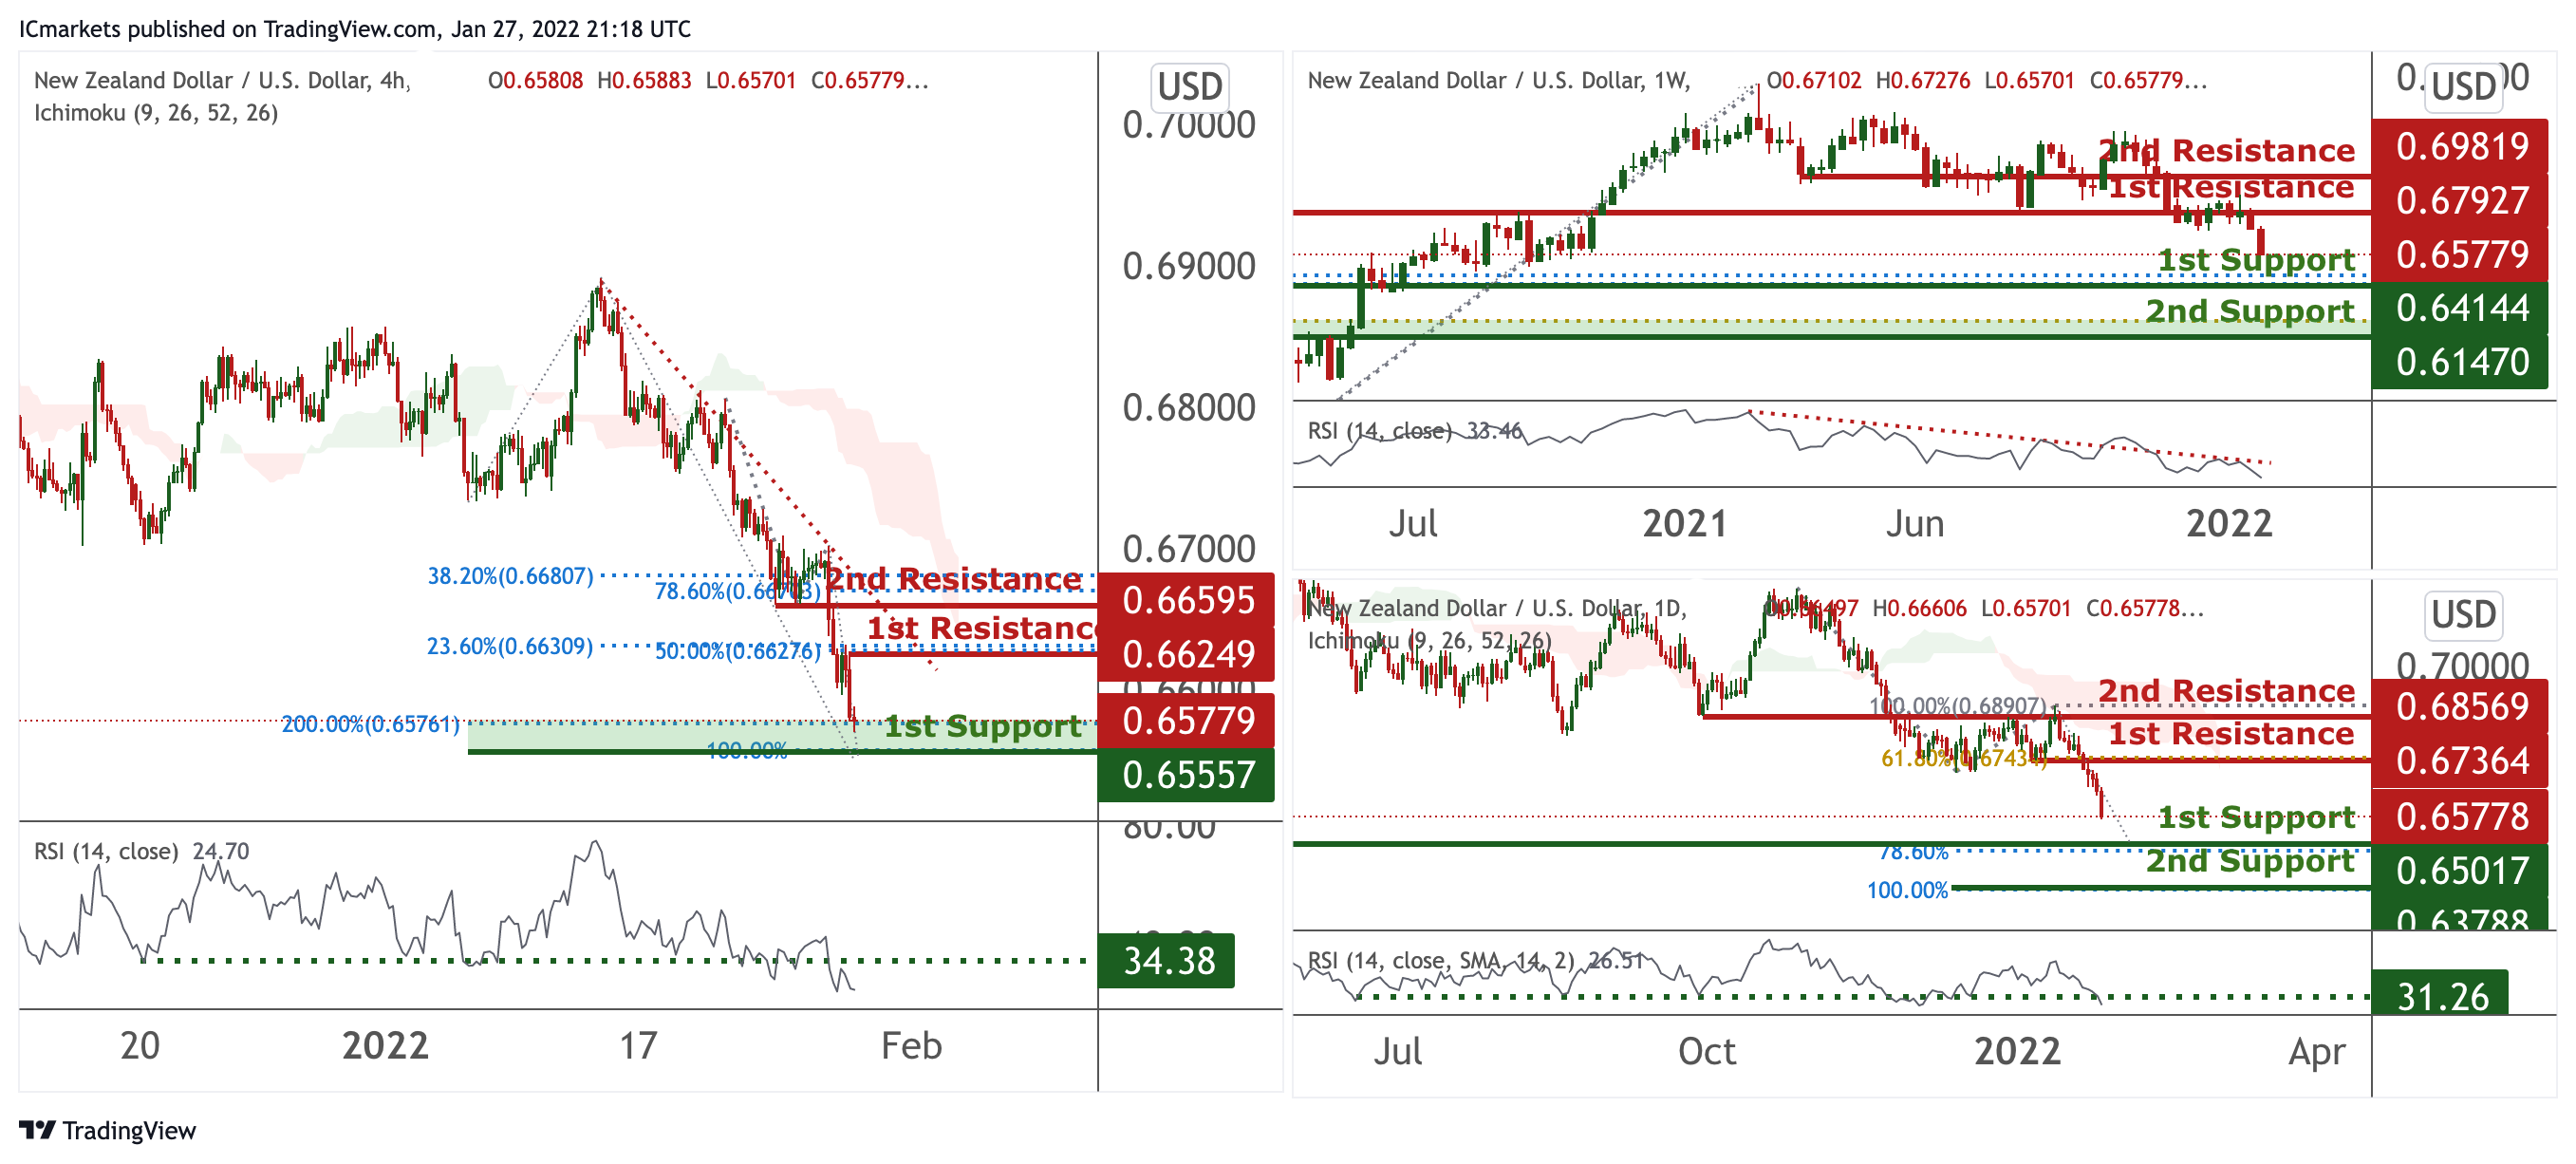
On the weekly timeframe, prices on downtrend. We see the potential for a reaction from 1st support at 0.64144 in line with 38.2% Fibonacci retracement towards our 1st resistance at 0.67927 which is a graphical overlap. RSI are at levels where bounces previously occurred. On the daily, prices are on bearish momentum. We see the potential for further bearish continuation from our 1st resistance at 0.67364 in line with 61.8% Fibonacci retracement towards our 1st support at 0.65778 in line with 78.6% Fibonacci extension. RSI are at levels where bounces previously occurred.
On the H4, prices are on bearish momentum and abiding to our bearish trendline. We see the potential for a short bounce from our 1st support at 0.65557 in line with 200% Fibonacci projection and 100% Fibonacci extension towards our 1st resistance at 0.66249 in line with 23.6% Fibonacci retracement and 50% Fibonacci retracement. RSI is at a level where bounces occurred previously.
Areas of consideration:
- H4 time frame, 1st resistance at 0.66249
- H4 time frame, 1st support at 0.65557
USD/CAD:
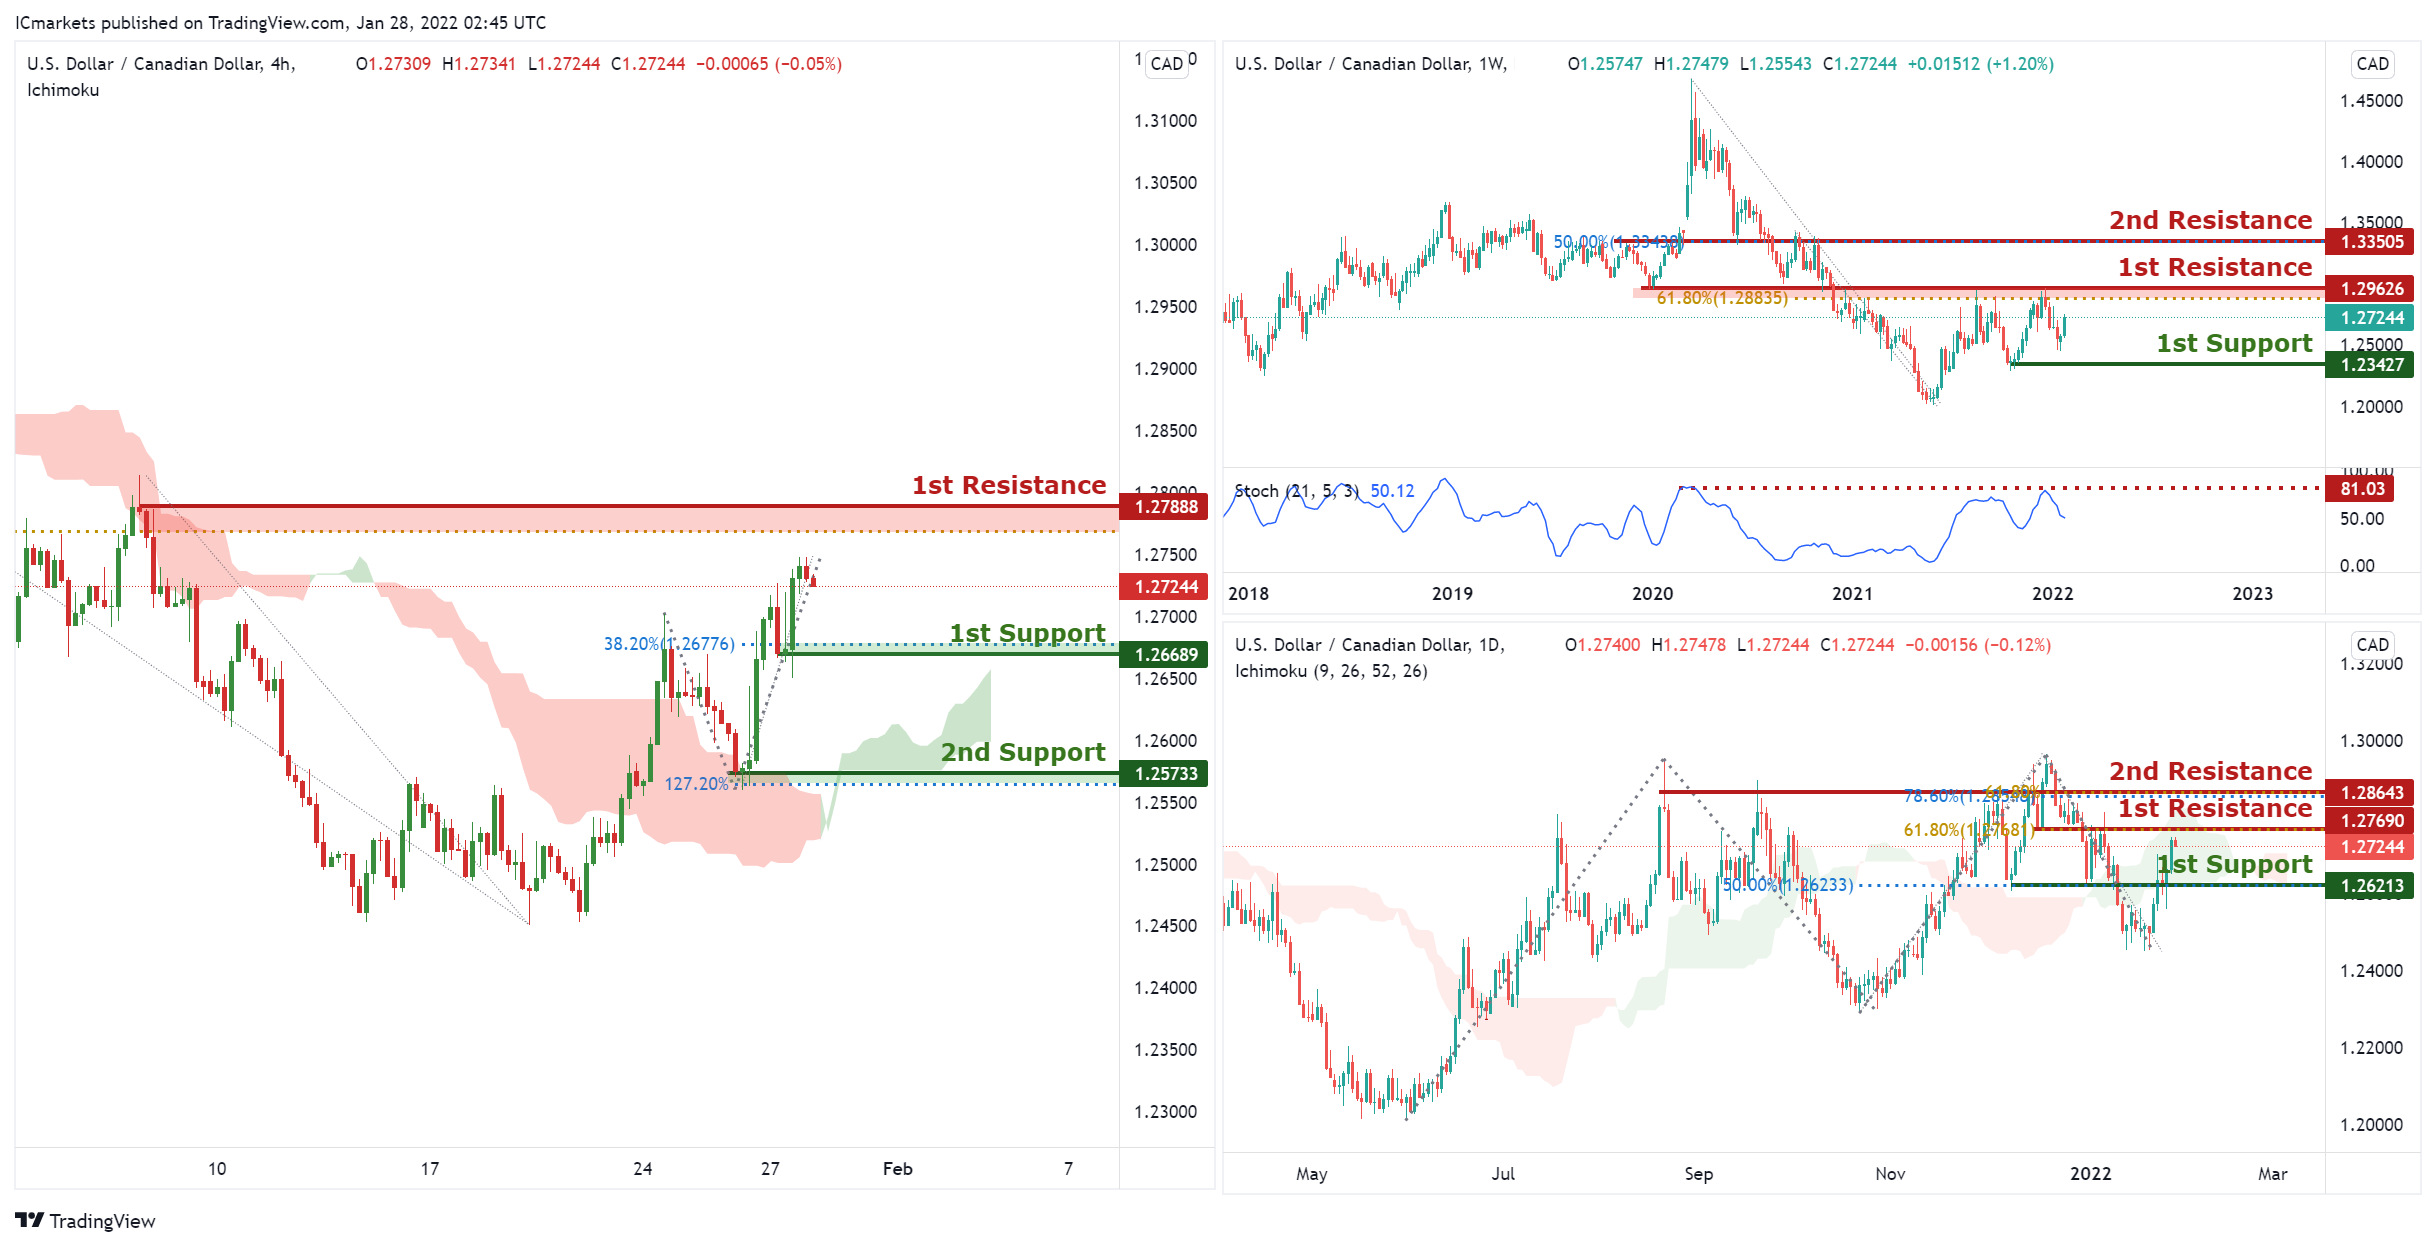
On the Weekly, with price respecting our resistance on the stochastics, signifying an bearish momentum. We can expect price to drop from our 1st resistance at 1.29626 in line horizontal graphical overlap and 61.8% Fibonacci retracement towards 1st support in line with horizontal swing low support at 1.23427. Alternatively, price may break 1st resistance structure and head for 2nd resistance, which coincides with 50% Fibonacci retracement at 1.33505. Traders should wait for price to swing higher or lower before entering.
On the Daily, with price approaching the resistance of the ichimoku cloud, we are expecting a bearish momentum from our 1st resistance at 1.27690 in line horizontal graphical overlap, the resistance of the ichimoku and 61.8% Fibonacci retracement towards 1st support in line with horizontal overlap support ,50% Fibonacci retracement level at 1.26213. Alternatively, price may break 1st resistance structure and head for 2nd resistance, which coincides with 78.6% Fibonacci retracement at 1.26643. On the H4, with prices moving above the ichimoku cloud, we see the potential for a bounce from our 1st support at 1.26689 in line with Horizontal swing low support and 38.2% Fibonacci retracement towards our 1st resistance at 1.27888 in line with horizontal swing high resistance and 61.8% Fibonacci retracement. Alternatively, price may break 1st support structure and head for 2nd support at 1.25733, in line with 127.2% Fibonacci extension and horizontal swing low support.
Areas of consideration:
- H4 time frame, 1st support at 1.26689
- H4 time frame, 1st resistance at 1.27888
OIL:
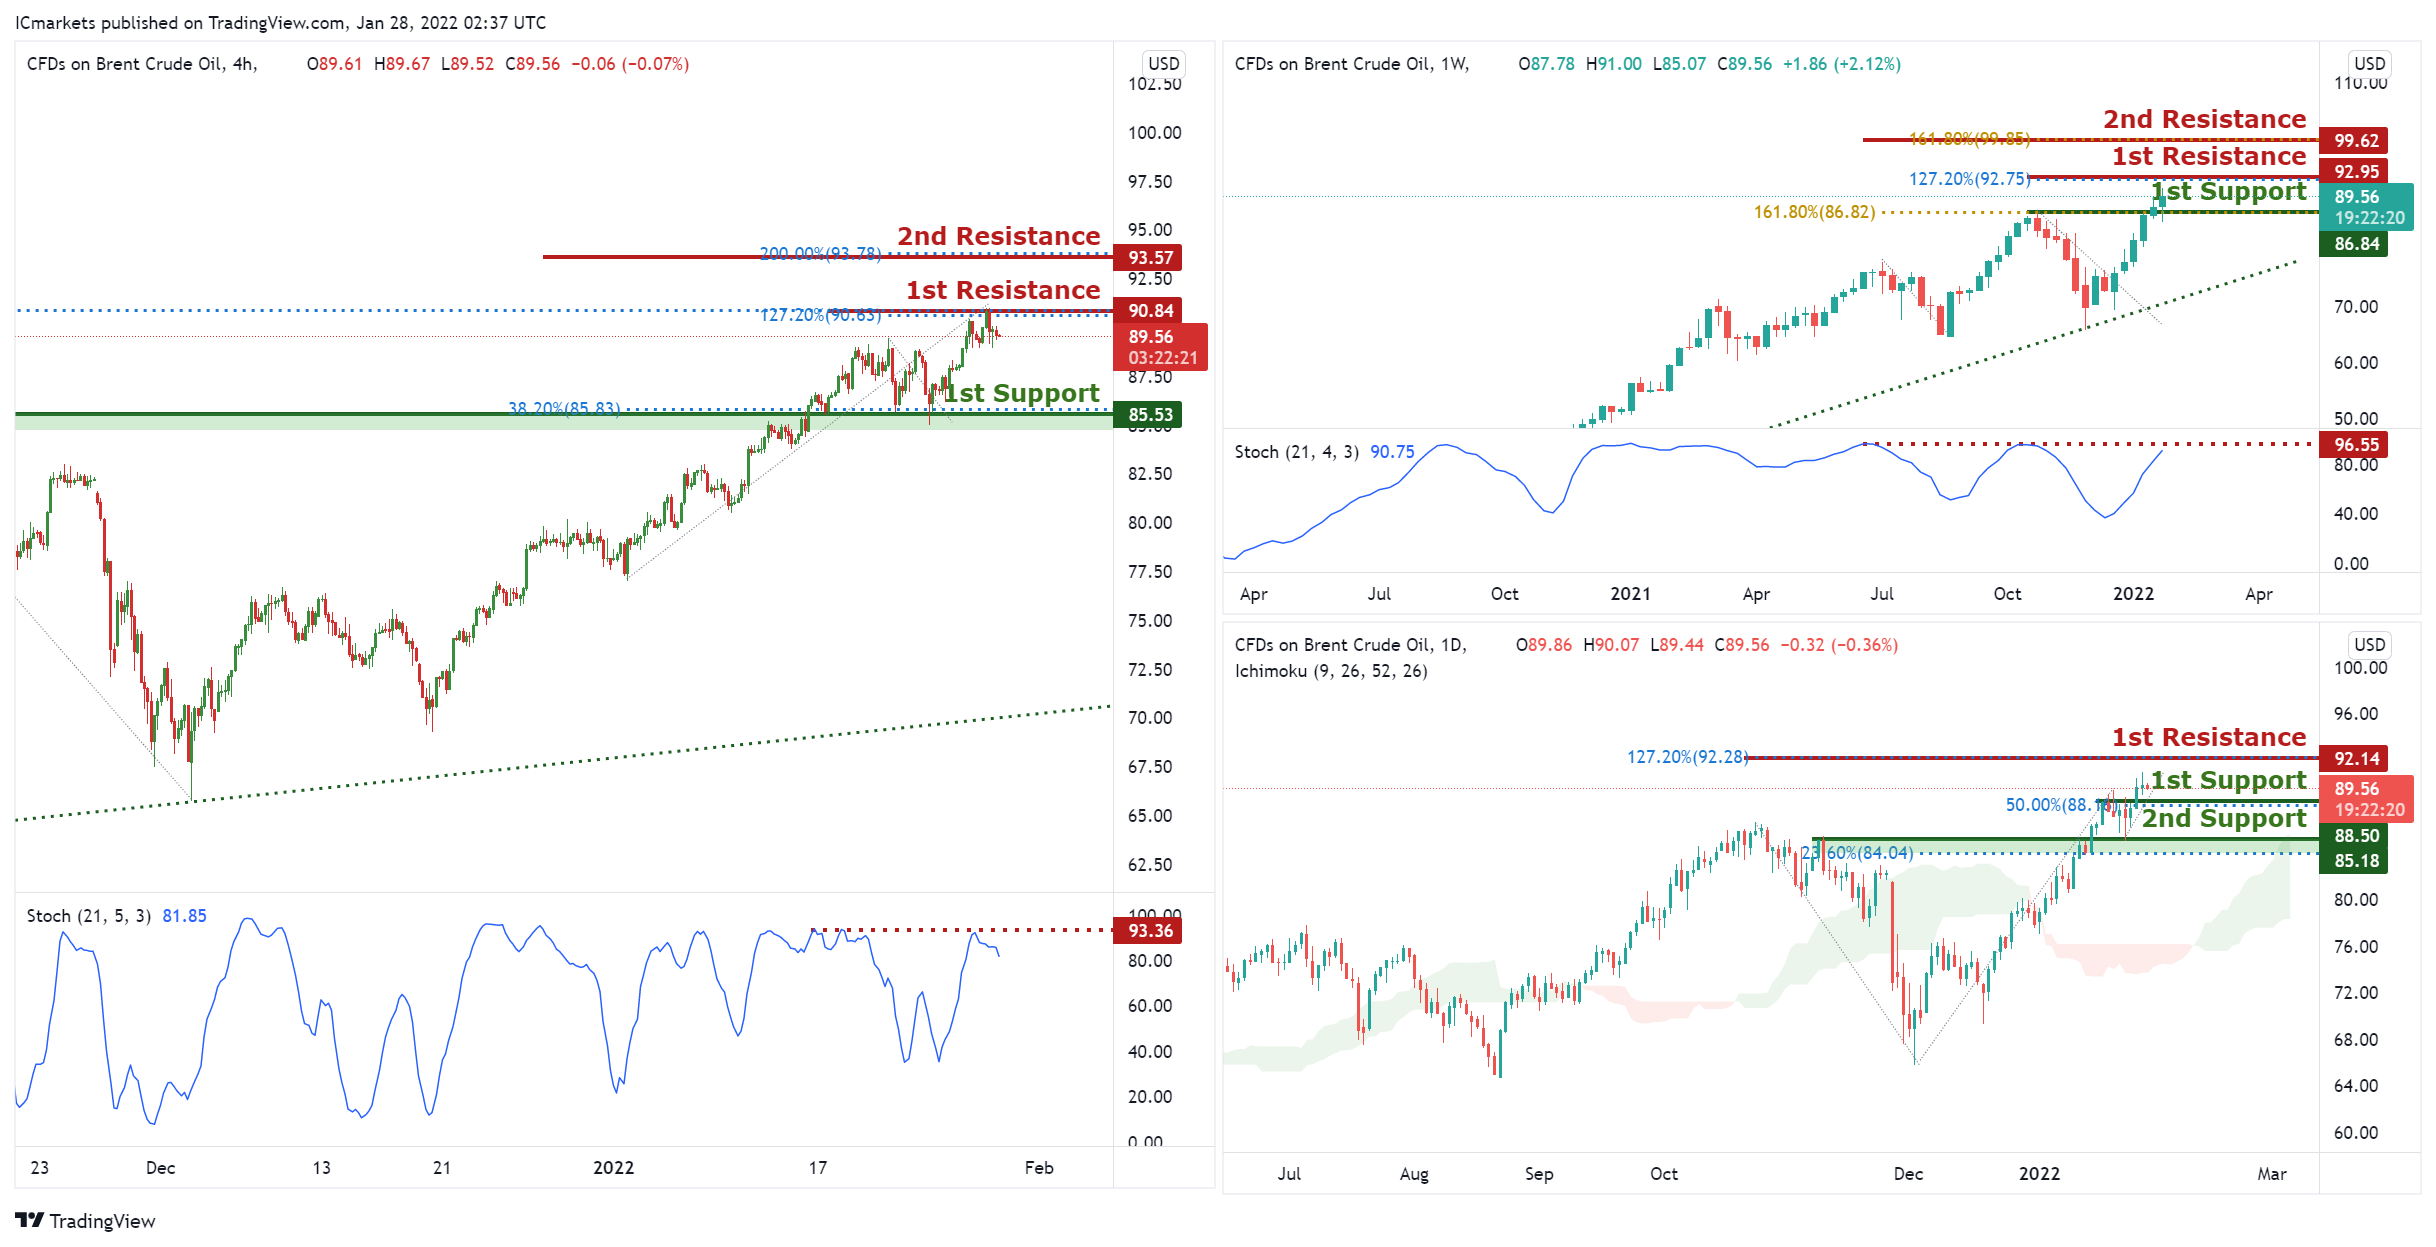
On the Weekly, with price approaching the resistance of the stochastics indicator, signifying an upcoming bearish momentum. We can expect price to drop from our 1st resistance at 92.95 in line horizontal graphical overlap and 127.2% Fibonacci extension towards 1st support in line with horizontal overlap support ,161.8% Fibonacci extension level at 86.84. Alternatively, price may break 1st resistance structure and head for 2nd resistance, which coincides with 161.8% Fibonacci extension at 99.62.
On the Daily, we expect a potential bounce from our 1st support at 88.50 in line with 50% Fibonacci retracement towards our 1st resistance at 92.14 in line with 127.2% Fibonacci projection. Alternatively, price may break 1st support structure and head for 2nd support at 85.18 in line with the 23.6% Fibonacci retracement level. Prices are trading above our ichimoku clouds, further supporting our bullish bias.
On the H4, with price reversing off the resistance on the stochastics indicator, signifying an overall bearish momentum. We can expect price to drop from our 1st resistance at 90.84 in line horizontal graphical swing high resistance and 127.2% Fibonacci extension towards 1st support in line with horizontal overlap support ,38.2% Fibonacci retracement level at 85.53. Alternatively, price may break 1st resistance structure and head for 2nd resistance, which coincides with 200% Fibonacci extension level at 93.57.
Areas of consideration:
- H4 time frame, 1st resistance of 90.84
- H4 time frame, 1st support of 85.53
Dow Jones Industrial Average:
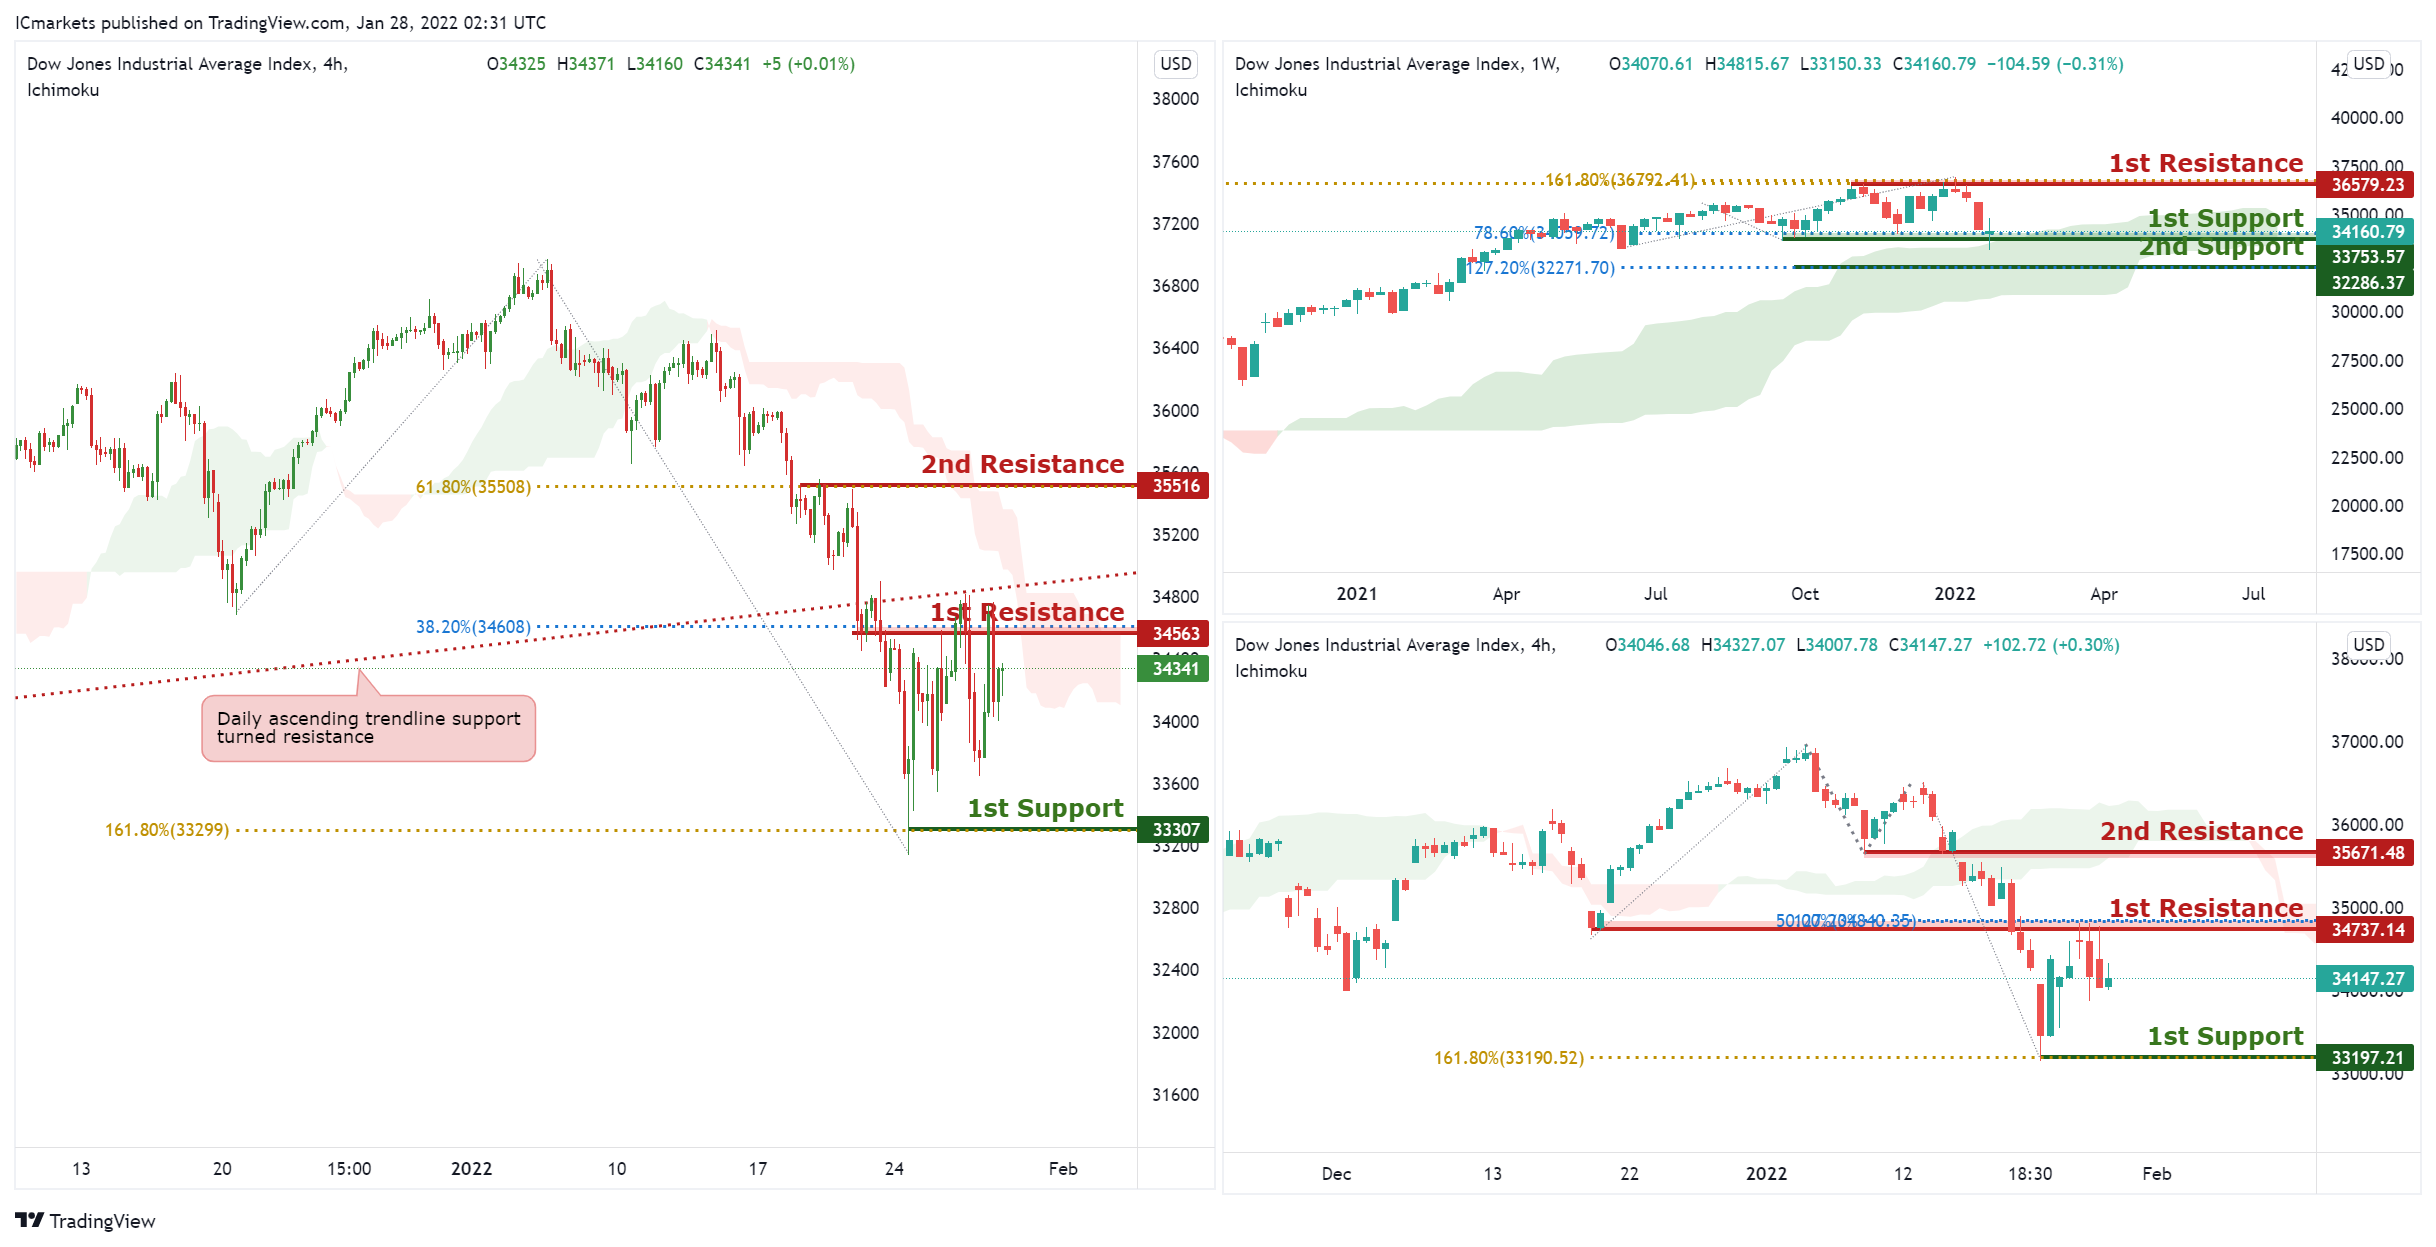
On the Weekly, are on bullish momentum and abiding to our ascending trendline support. We expect a potential bounce from our 1st support at 33753 in line with 78.6% Fibonacci retracement towards our 1st resistance at 36579 in line with 161.8% Fibonacci projection. Prices are trading above our ichimoku clouds, further supporting our bullish bias. Traders should wait for price to swing higher or lower before entering.
On the Daily, with price moving below the ichimoku cloud, signifying an overall bearish momentum. We can expect price to drop from our 1st resistance at 34737 in line horizontal graphical overlap and 50% Fibonacci retracement towards 1st support in line with horizontal overlap support ,161.8% Fibonacci extension level at 33197. Alternatively, price may break 1st resistance structure and head for 2nd resistance, which coincides with horizontal overlap resistance at 35671.
On the H4, with price moving below the ichimoku cloud, signifying an overall bearish momentum. We can expect price to drop from our 1st resistance at 34563 in line horizontal graphical overlap and 38.2% Fibonacci retracement towards 1st support in line with horizontal overlap support ,161.8% Fibonacci extension level at 33307. Alternatively, price may break 1st resistance structure and head for 2nd resistance, which coincides with 61.8% Fibonacci retracement at 35516. Traders should wait for price to swing higher or lower before entering.
Areas of consideration:
- H4 time frame, 1st resistance of 34563
- H4 time frame, 1st support of 33307
EUR/GBP Daily Outlook
Daily Pivots: (S1) 0.8313; (P) 0.8336; (R1) 0.8350; More...
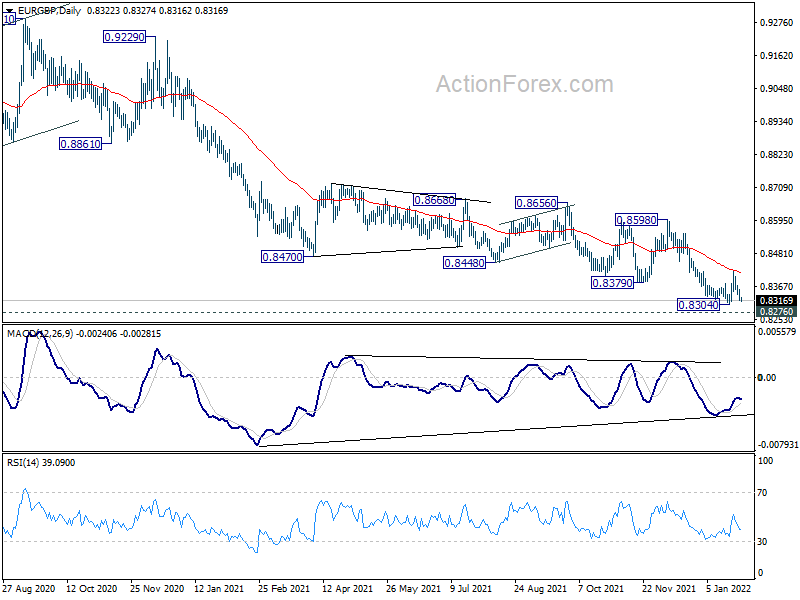
Intraday bias in EUR/GBP remains on the downside for 0.8304 support first. Break there will remain larger down trend and target 0.8276 long term support next. On the upside, above 0.8366 minor resistance will turn bias back to the upside for 0.8421 resistance first. Break of 0.8421 will resume the rebound towards 0.8598 key structural resistance.
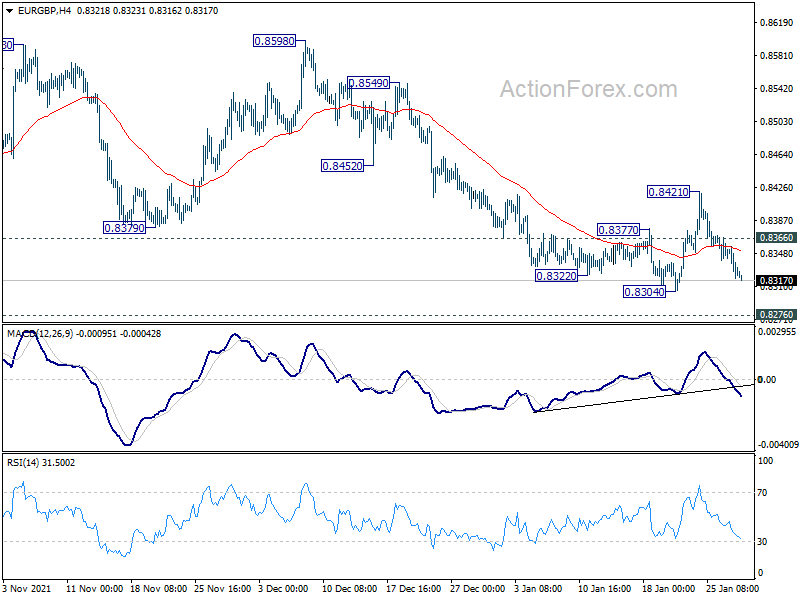
In the bigger picture, price actions from 0.9499 (2020 high) are still seen as developing into a corrective pattern. Deeper fall could be seen as long as 0.8598 resistance holds, towards long term support at 0.8276. We'd look for bottoming signal around there to bring reversal. Meanwhile, firm break of 0.8598 will now be an early sign of medium term bottoming and bring stronger rebound. However, sustained break of 0.8276 will argue that the long term trend has reversed.
Dollar Staying Strong, Sterling Trying to Catch Up
Dollar remains overwhelmingly the strongest one for the week, as boosted by intensified Fed hike expectations. Sterling is trying to catch and trading as the next stronger, with special help from buying against Euro. Australian and New Zealand Dollar are taking turns to be the worst performer. Euro and Swiss Franc are not too far away. Canadian Dollar is just mixed, as support by oil prices.
Technically, Yen is displaying some weakness with USD/JPY breaking through 115.05 resistance firmly yesterday. But rally in USD/JPY might not translate into rebound in other Yen crosses. Selling in Yen crosses could come back any time, in particular if risk sentiment turns sour again. The levels to watch include 129.76 in EUR/JPY, 155.38 in GBP/JPY, and 82.13 in AUD/JPY. As long as these levels hold, more downside is still in favor in Yen crosses in general, except USD/JPY.
In Asia, at the time of writing, Nikkei is up 2.18%. Hong Kong HSI is down -0.84%. China Shanghai SSE is up 0.05%. Singapore Strait Times is up 0.25%. Japan 10-year JGB yield is up 0.0100 at 0.169. Overnight, DOW dropped -0.02%. S&P 500 dropped -0.54%. NASDAQ dropped -1.40%. 10-year yield dropped -0.041 to 1.807.
IMF: BoJ's commitment to prolonged monetary accommodation appropriate
IMF said in a report that BoJ's commitment to maintaining prolonged monetary accommodation remains "appropriate". It expects that a "prolonged period of monetary policy accommodation, flexible fiscal policy, and inclusive growth-oriented reforms will be required to durably lift inflation expectations and inflation to the target."
Further measures could be considered for making monetary support "more sustainable". On option could be to "steepen the yield curve by shifting the yield target from the 10-year to a shorter maturity". This could help "mitigate the impact of prolonged monetary accommodation on financial institutions' profitability". If underlying inflation momentum remains weak, "cutting the policy rate should be the first option".
Gold breaks 1800, more downside ahead with Silver
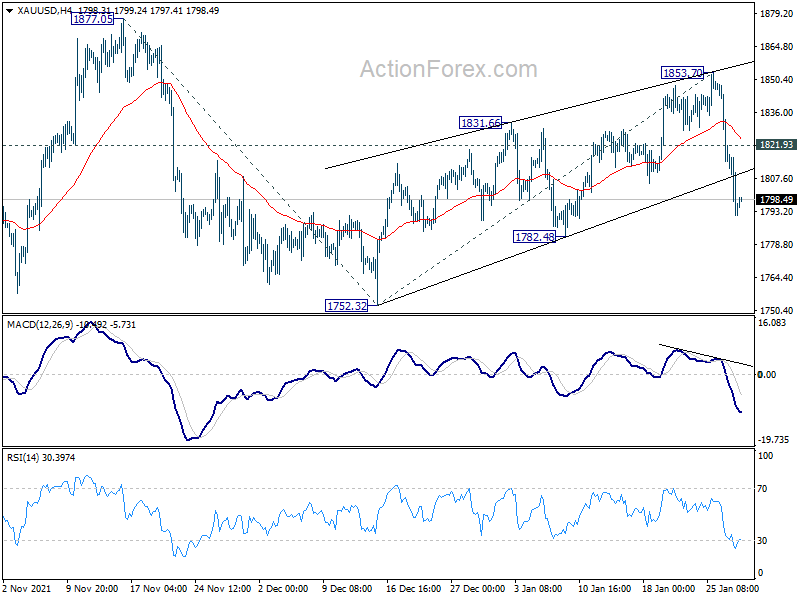
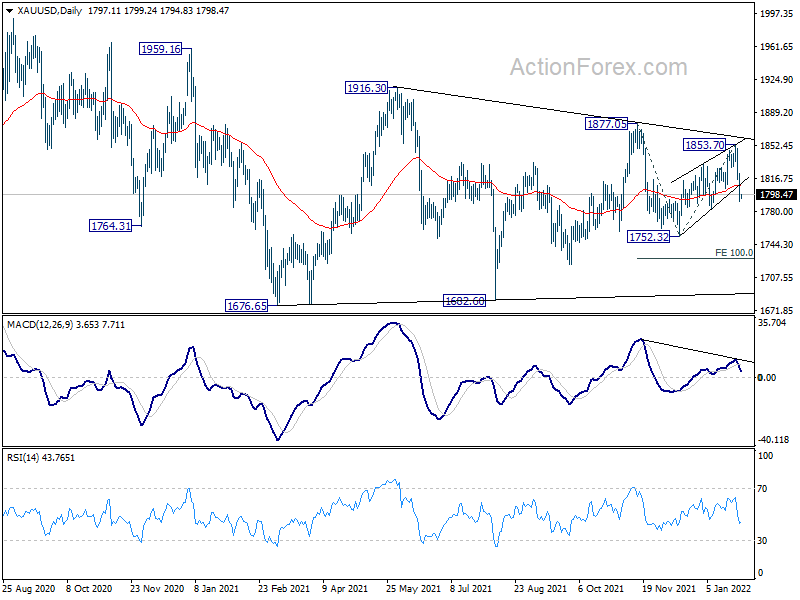
Gold is now back below 1800 handle as fall from 1853.70 extends. The development further affirms the case that rebound from 1752.32 has completed with three waves up to 1853.70. Deeper decline is expected as long as 1821.93 minor resistance holds. Current fall from 1853.70 is see as part of the pattern from 1877.05, which is a down leg inside the medium term range pattern from 1676.65. Break of 1782.48 support will add further credence to this case, and would set the stage for deeper decline through 1752.32 low to 100% projection of 1877.05 to 1752.32 from 1853.70 at 1728.97 eventually.
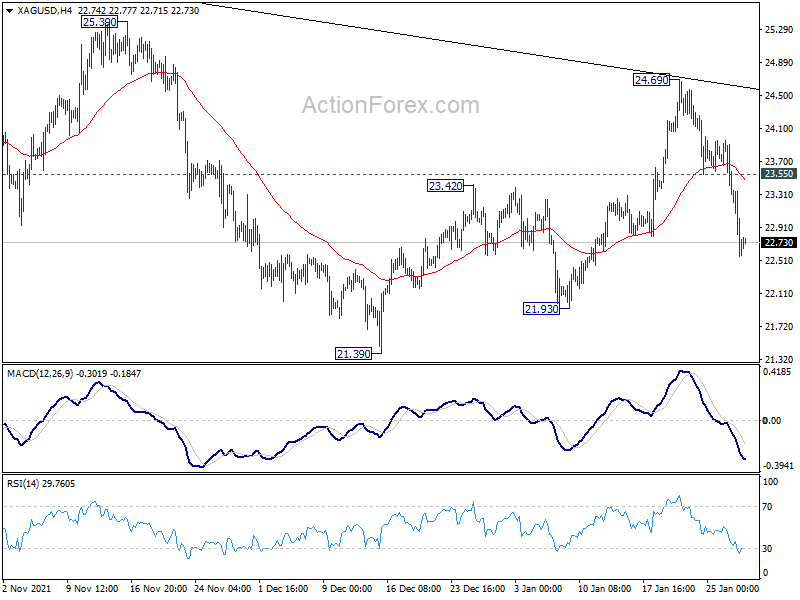
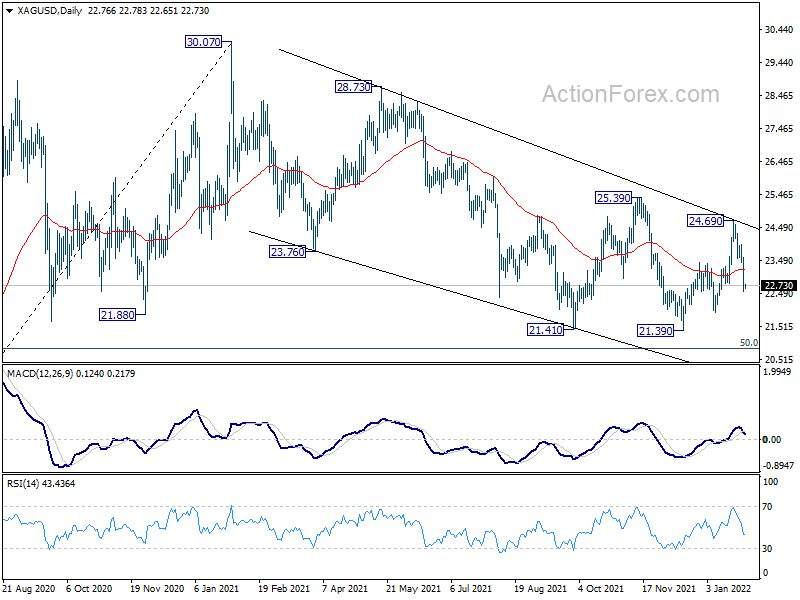
Silver's development is also inline with gold. Rebound from 21.39 should have completed with three waves up to 84.69. Deeper decline is expected as long as 23.55 minor resistance holds, to 21.93 support first. Such fall from 24.69 is seen as a leg inside the medium term falling wedge pattern from 30.07. Break of 24.69 would send silver through 21.39 low, to 50% retracement of 11.67 to 30.7 at 20.87 next.
Bitcoin trading sideway, risk still on the downside
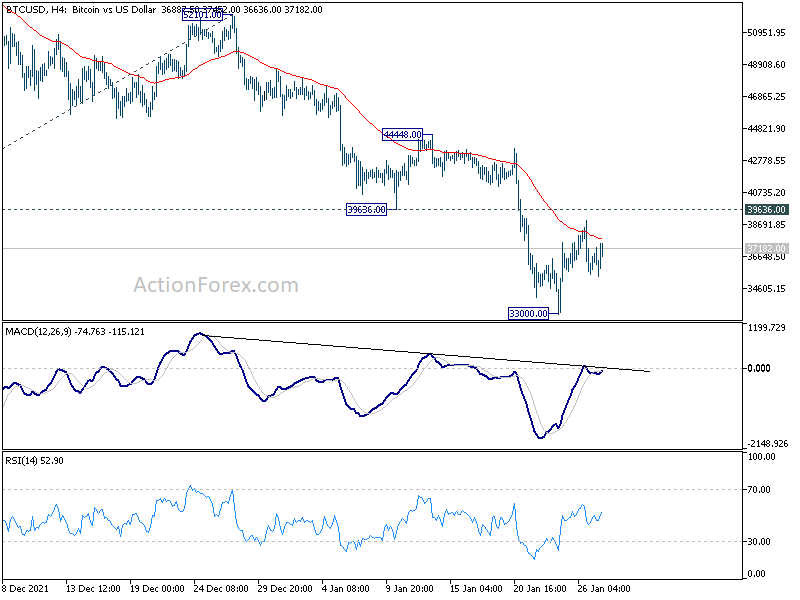
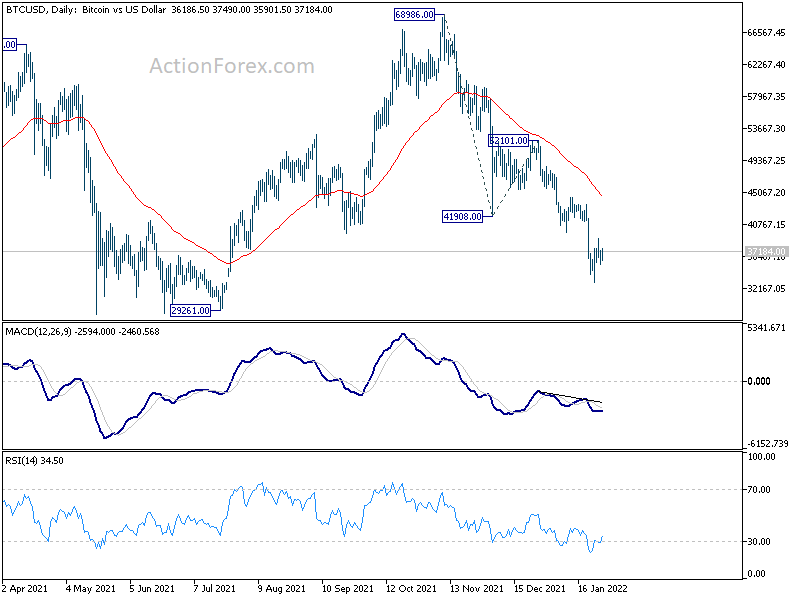
Bitcoin stabilized after hitting 33000 and turned sideway. But risk is still staying heavily on the downside with 39636 support turned resistance intact. Current down trend from 68986 could extend with another falling leg, towards 29261 support, which is close to 30k psychological level too. We'd look for bottoming signal around there.
Meanwhile, on the upside, firm break of 39639 will argue that bitcoin has bottomed earlier than expected and bring rebound back towards 55 day EMA (now at 44839). Failure to defend 30k handle will indicate that the larger down trend is still in force for 100% projection of 68986 to 41908 from 52101 at 25023.
On the data front
Japan Tokyo CPI core slowed to 0.2% yoy in January, below expectation of 0.3% yoy. Australia PPI rose 1.3% qoq, 3.7% yoy in Q4, above expectation of 0.9% qoq, 2.7% yoy.
GDP from France and Germany will be the main focuses in European session. France will release consumer spending too while Germany will release import price index. Swiss will release KOF economic barometer while Eurozone will release economic sentiment indicator and M3 money supply.
Later in the day, US personal income and spending, with PCE inflation will be the main focus.
EUR/GBP Daily Outlook
Daily Pivots: (S1) 0.8313; (P) 0.8336; (R1) 0.8350; More...
Intraday bias in EUR/GBP remains on the downside for 0.8304 support first. Break there will remain larger down trend and target 0.8276 long term support next. On the upside, above 0.8366 minor resistance will turn bias back to the upside for 0.8421 resistance first. Break of 0.8421 will resume the rebound towards 0.8598 key structural resistance.
In the bigger picture, price actions from 0.9499 (2020 high) are still seen as developing into a corrective pattern. Deeper fall could be seen as long as 0.8598 resistance holds, towards long term support at 0.8276. We'd look for bottoming signal around there to bring reversal. Meanwhile, firm break of 0.8598 will now be an early sign of medium term bottoming and bring stronger rebound. However, sustained break of 0.8276 will argue that the long term trend has reversed.
Economic Indicators Update
| GMT | Ccy | Events | Actual | Forecast | Previous | Revised |
|---|---|---|---|---|---|---|
| 23:30 | JPY | Tokyo CPI Core Y/Y Jan | 0.20% | 0.30% | 0.50% | |
| 00:30 | AUD | PPI Q/Q Q4 | 1.30% | 0.90% | 1.10% | |
| 00:30 | AUD | PPI Y/Y Q4 | 3.70% | 2.70% | 2.90% | |
| 06:30 | EUR | France Consumer Spending M/M Dec | 0.20% | 0.80% | ||
| 06:30 | EUR | France GDP Q/Q Q4 P | 0.50% | 3.00% | ||
| 07:00 | EUR | Germany Import Price Index M/M Dec | 1.80% | 3.00% | ||
| 08:00 | CHF | KOF Economic Barometer Jan | 106 | 107 | ||
| 09:00 | EUR | Germany GDP Q/Q Q4 P | -0.20% | 1.70% | ||
| 09:00 | EUR | Eurozone M3 Money Supply Y/Y Dec | 6.90% | 7.30% | ||
| 10:00 | EUR | Eurozone Economic Sentiment Indicator Jan | 114.5 | 115.3 | ||
| 10:00 | EUR | Eurozone Services Sentiment Jan | 14.9 | 11.2 | ||
| 10:00 | EUR | Eurozone Industrial Confidence Jan | 15 | 14.9 | ||
| 10:00 | EUR | Eurozone Consumer Confidence Jan F | -8.5 | |||
| 13:30 | USD | Personal Income M/M Dec | 0.50% | 0.40% | ||
| 13:30 | USD | Personal Spending Dec | -0.60% | 0.60% | ||
| 13:30 | USD | PCE Price Index M/M Dec | 0.50% | 0.60% | ||
| 13:30 | USD | PCE Price Index Y/Y Dec | 6.10% | 5.70% | ||
| 13:30 | USD | Core PCE Price Index M/M Dec | 0.50% | 0.50% | ||
| 13:30 | USD | Core PCE Price Index Y/Y Dec | 4.80% | 4.70% | ||
| 13:30 | USD | Employment Cost Index Q4 | 1.20% | 1.30% | ||
| 15:00 | USD | Michigan Consumer Sentiment Index Jan F | 68.6 | 68.8 |
Bitcoin trading sideway, risk still on the downside
Bitcoin stabilized after hitting 33000 and turned sideway. But risk is still staying heavily on the downside with 39636 support turned resistance intact. Current down trend from 68986 could extend with another falling leg, towards 29261 support, which is close to 30k psychological level too. We'd look for bottoming signal around there.
Meanwhile, on the upside, firm break of 39639 will argue that bitcoin has bottomed earlier than expected and bring rebound back towards 55 day EMA (now at 44839). Failure to defend 30k handle will indicate that the larger down trend is still in force for 100% projection of 68986 to 41908 from 52101 at 25023.