Sample Category Title
GBPJPY Chases Soft Gains; Short-Term Outlook Somewhat Gloomy
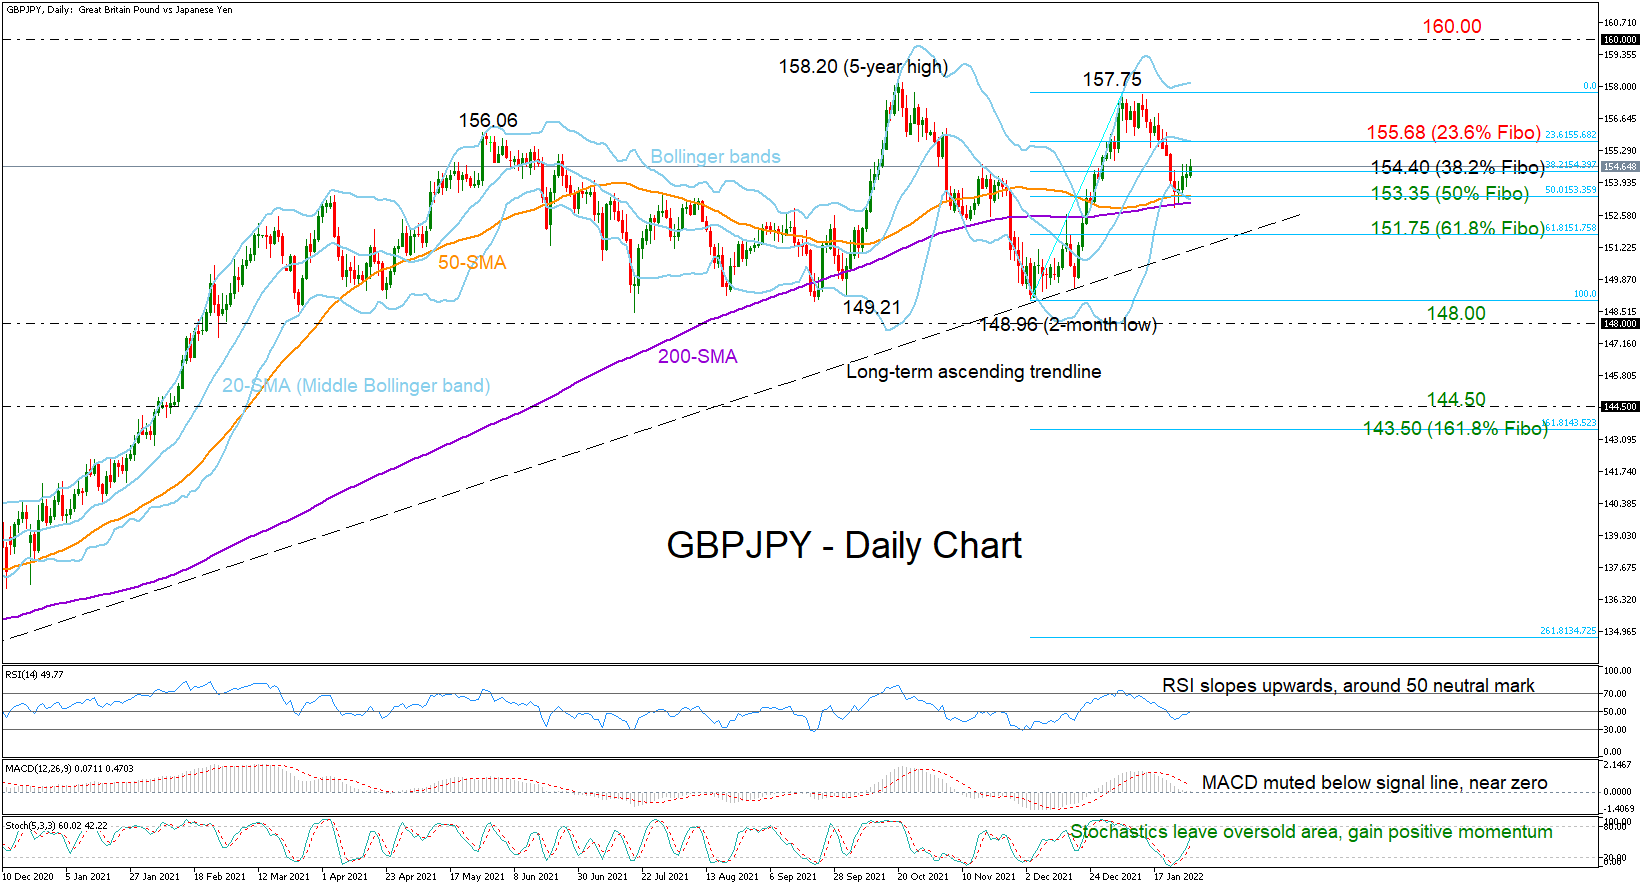
GBPJPY found strong footing around its longer-term 50- and 200-day simple moving averages (SMAs) this week, but the price could only gradually strengthen to 154.80 since then, unable to recoup January's losses.
While the 50- and 200-day SMAs have escaped a bearish crossover, feeding speculation that the broad uptrend has not finished yet, the short-term outlook is still looking cloudy. Despite today’s buying appetite, the price continues to trade below its 20-day SMA at 155.68 and within the lower bearish Bollinger area. Moreover, the RSI has yet to climb above its 50 neutral mark despite its ongoing positive momentum, whilst the MACD remains muted below its signal line and around zero.
The 38.2% Fibonacci retracement of the 148.96 – 157.75 up leg has been capping upside movements the past two days at 154.40. Should the pair sustain its positive momentum above it, the 20-day SMA (middle Bollinger band) and the 23.6% Fibonacci of 155.68 could immediately constrain the bullish action. If not, the rebound could stretch towards the uptrend’s top surface of 157.75 – 158.20. The 160.00 psychological mark, last seen in 2016, could be the next target.
On the downside, a step below the longer-term SMAs and the 50% Fibonacci both at 153.35, would shift all eyes towards the strict ascending trendline, which connects the 2020 lows with December’s trough of 148.96 and intersects the 61.8% Fibonacci of 151.75. A close lower from here could easily drive the price towards the 148.96 bottom. A step beneath 148.00 could activate a steeper decline towards the 144.50 region and the 161.8% Fibonacci extension of 143.52.
To summarize, GBPJPY is fighting for a soft positive weekly close as downside risks keep lingering in the background. An extension above 155.68 could eliminate any anxiety.
US 30 Index Remains Negative in Short-Term; SMAs Post Bearish Cross
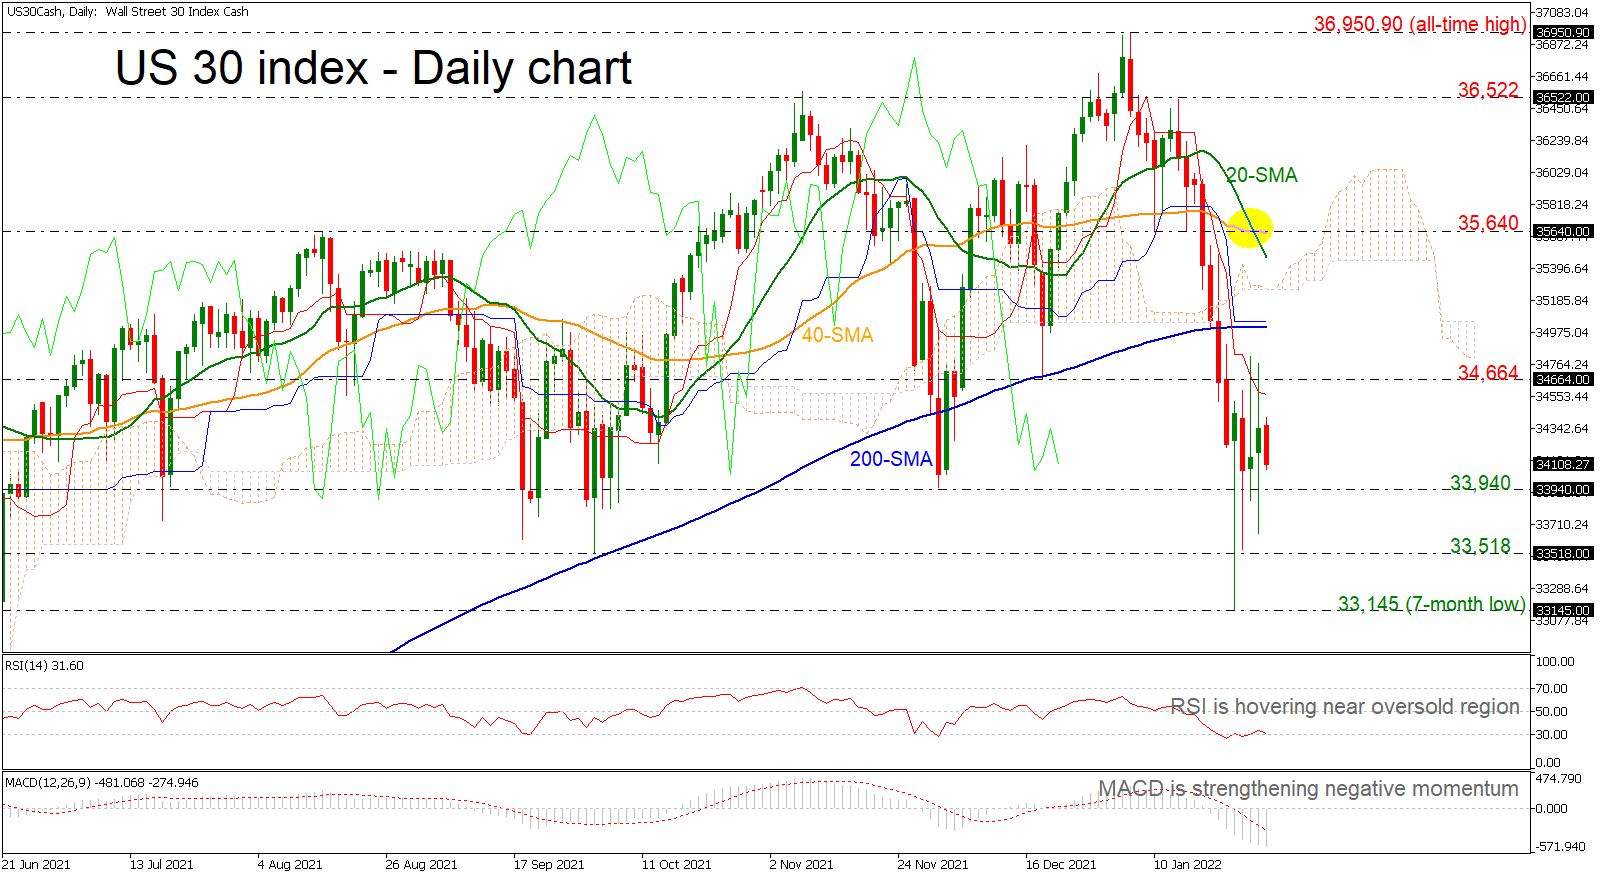
The US 30 (Cash) index rebounded off the seven-month low of 33,145, gaining some momentum, but the short-term simple moving averages (SMAs) posted a bearish crossover. The RSI indicator is flattening near the oversold zone, while the MACD oscillator is losing ground below its trigger and zero lines.
If price action remains above 33,940, there is scope to test 34,664, which the index failed to surpass in the previous day. Clearing this key level would see additional gains towards the 200-day SMA at 35,010 ahead of the lower boundary of the Ichimoku cloud at 35,240. Rising above those levels would see prices re-test the 20- and 40-day SMAs at 35,473 and 35,640 respectively.
If the 33,940 support fails, then the focus would shift to the downside again towards 33,518, which if breached, would increase downside pressure and possibly meet 33,145. From here, the price would be on the path towards the 32,000 low, which may act as a turning point.
Overall, the index has been negative in the short-term timeframe, but in the longer-term, the price is still strongly bullish and only a notable downside move may change this outlook.
Daily Technical Analysis
EUR/USD
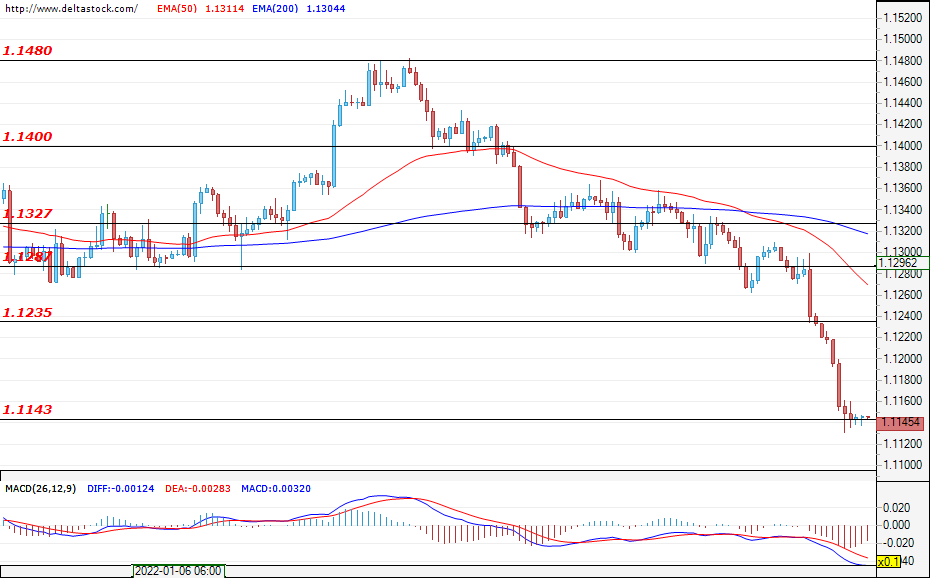
After the successful breach of the support zone at 1.1235, the European common currency lost quite a bit of ground against the U.S. dollar. During the early hours of today`s session, the pair is trading at around the zone of 1.1145 and if the bearish attack continues, then a violation of the mentioned support will most likely lead to even more losses and deepen the decline towards the level at 1.1065. If the bulls take control, their first target would be the zone at 1.1235, which is now acting as resistance, followed by the level at 1.1287.
USD/JPY
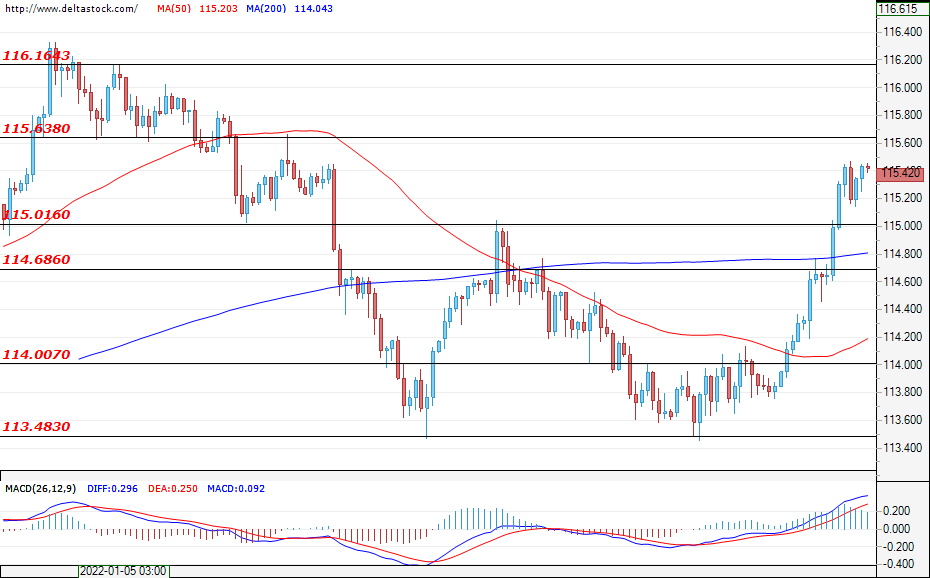
The dollar continues to gain ground against the yen and the Ninja is currently headed for a test of the resistance zone at 115.63. A successful breach here would strengthen the positive expectations for the future path of the currency pair and could help form a rally towards the level at 116.16. If the bullish momentum fades and a correction develops, then it will most likely be limited to the support zone at 114.40. However, if the mentioned level does not hold, then this rally could easily end.
GBP/USD
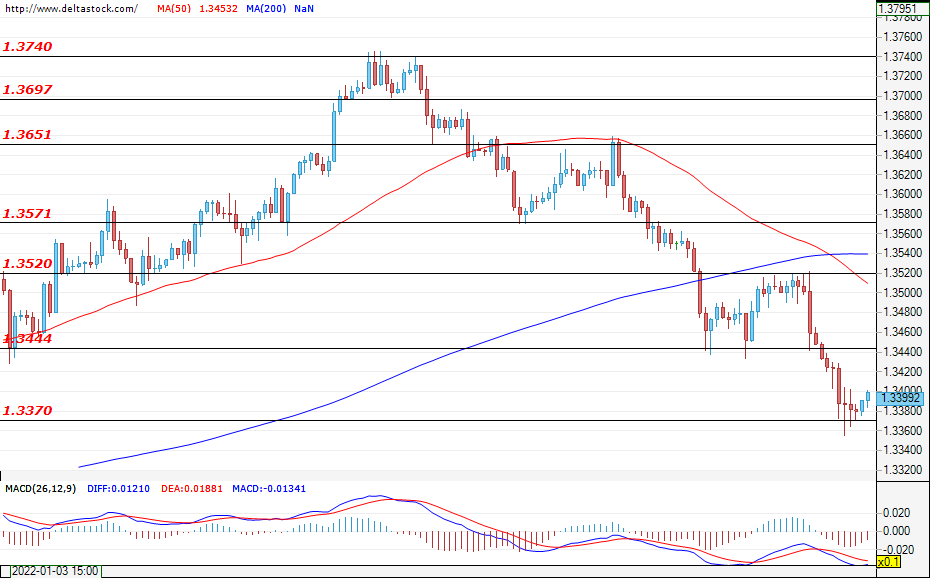
Similar to the other pairs involving the greenback, here the dollar also appreciated and the pair tested the support zone at 1.3370 from the higher time frames. A successful violation here could lead to new losses for the GBP/USD and lead to a move towards the next target at 1.3340. If the bulls enter the market, then they would most likely attack the zone at 1.3444. A breach of the next level at 1.3520 could lead to a change in the current sentiment of market participants.
EUGERMANY40
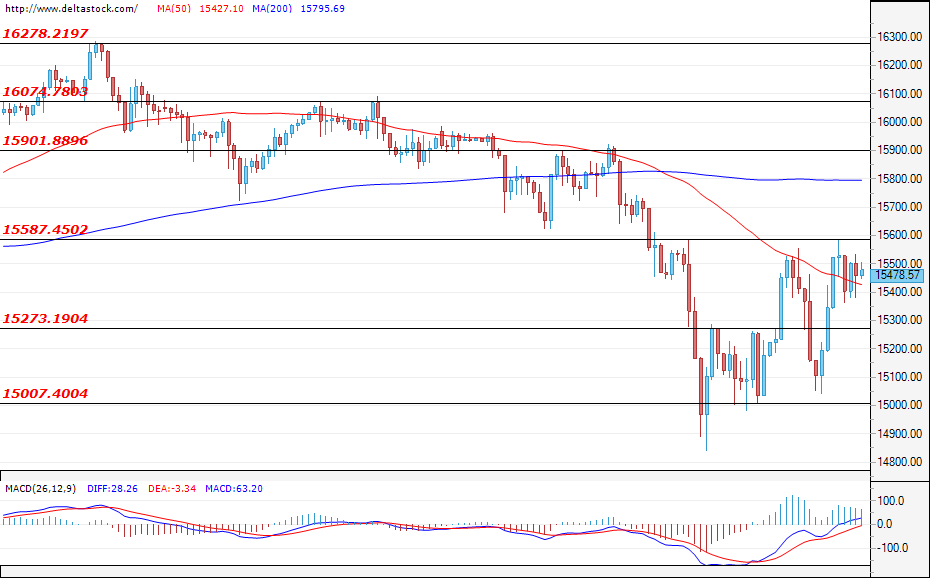
The German index regained some of its recent losses and, during the early hours of today`s session, the EUGERMANY40 is trading close to the resistance zone at 15587. A breach of the mentioned resistance would aid the recovery and should pave the way for a test of the next target at 15901. If the bears prevail, then a successful test of the support at 15273 could easily deepen the sell-off towards the support level at 15000.
US30
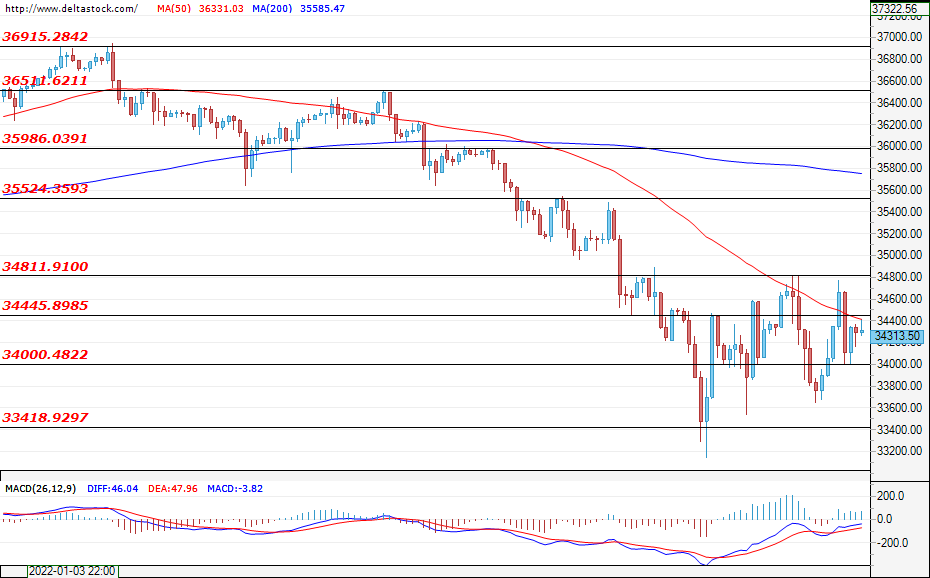
Trading remained locked in the zone between 34000 and 34445, and at the time of writing the analysis, the US30 is hovering close to the upper border at 34445. Only a successful breach of this border, followed by a violation of the next target at 34811, could lead to a more sustained rally and a move towards the zone at 35524. In the opposite direction, the bears could test the support at 34000, and if they are successful, then the most likely scenario would be for the decline to deepen towards 33418.
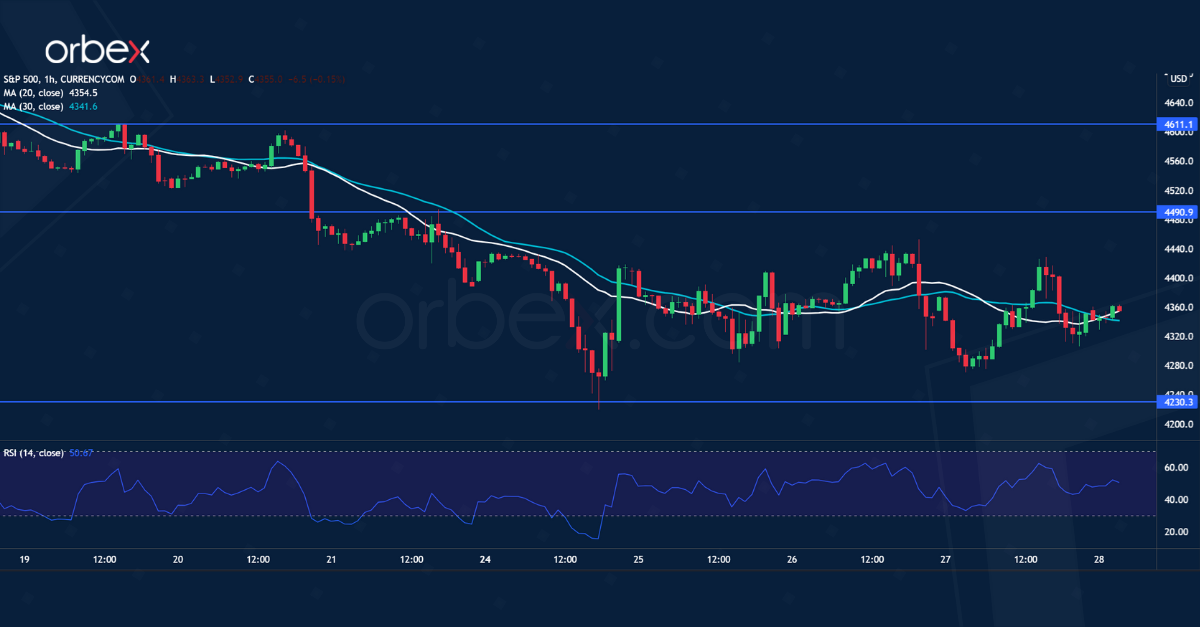
SPX 500 Struggles for Support
Upcoming US rate hike still weighs on equity markets. A tentative break below last October’s low (4300) has put the S&P 500 on the defense.
A bearish MA cross on the daily chart shows that sentiment could be deteriorating as price action struggles to stabilize. An oversold RSI led to a limited rebound as intraday sellers took profit.
Nonetheless, buyers should be wary of catching a falling knife, leaving the index vulnerable to another sell-off if it drops below 4230. 4490 is the first resistance to clear to initiate a recovery.
US Oil Breaks to New High
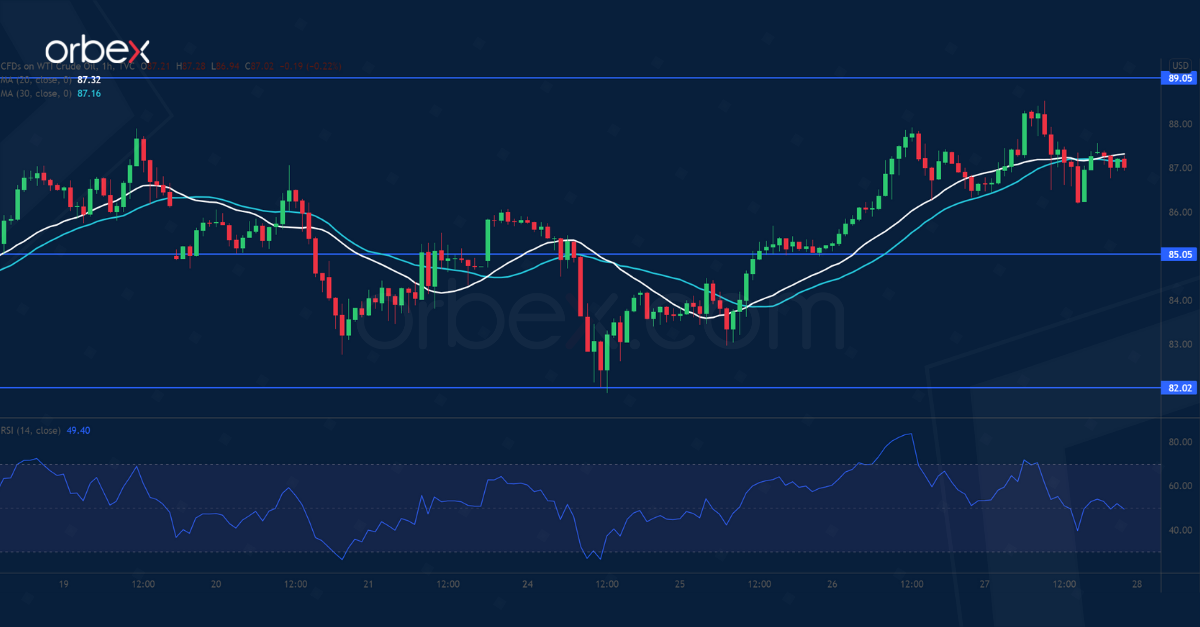
Oil climbed amid fears of disruption as tensions between Russia and the West grew.
After a short-lived pause, WTI crude saw bids near a previous low at 82.00 which lies on the 20-day moving average. A break above the January peak at 87.80 indicates solid interest in keeping the rally in shape.
As the bulls’ run continued, more trend-followers would push the price to 89.00. An overbought RSI temporarily restrained the fever, and buyers could see a pullback towards 85.00 as an opportunity.
USD/JPY Tests Major Resistance
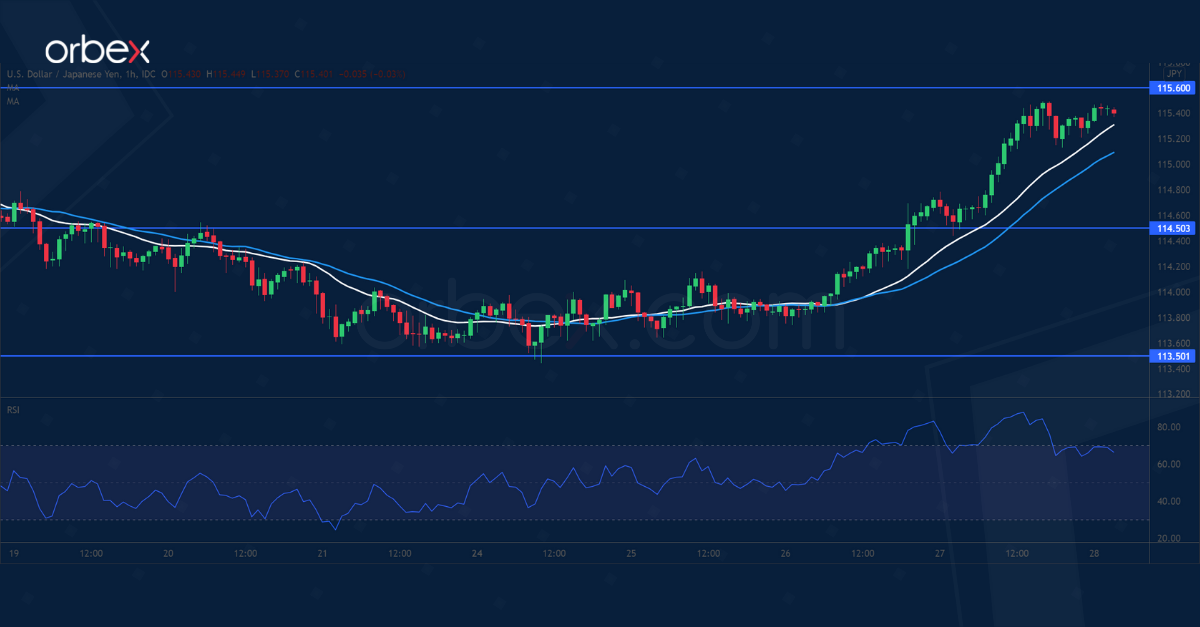
The Japanese yen inched higher after January’s Tokyo CPI beat expectations.
The US dollar found support in the daily demand zone around 113.50. And that is a sign that upbeat sentiment in the medium-term remains intact.
A close above the psychological level of 115.00 attracted momentum traders and sped up the rebound. 115.60 at the origin of the January liquidation is key resistance. In fact, its breach could put the uptrend back on track.
The RSI’s overextension may cause a limited pullback with 114.50 as the closest support.
Today’s Stock Market Session Could be Important to Guide Short Term Risk Sentiment
Markets
We retain from the day after the hawkish FOMC meeting that the greenback pushed towards fresh recovery highs. The trade-weighted DXY crossed above 96.94 to close at 97.26. Next important resistance stands at 97.72 which is 62% retracement on the 2020 dollar slide. EUR/USD fell below 1.1186 to close at 1.1145. Next support in this pair comes in at 1.1040 which is already 76% retracement on the 2020 EUR/USD-rally. The US yield curve flattened yesterday with longer-term bond yields undoing their post-Fed move. The main intraday move occurred after a decent WS opening. US Treasuries eventually did manage to hold on to those intraday gains, even if sentiment on Wall Street soured again later on. Main US indices lost up to 1.4% for Nasdaq. Daily changes on the US yield curve ranged between +3.7 bps (2-yr) and -7.3 bps (30-yr). The German yield curve flattened as well with the front end of the curve adding up to 3.7 bps (4-yr) and the very long end 1.8 bps (30-yr) lower. European investors concluded after the hawkish Fed signal that also the ECB over the course of the coming months will have to make a U-turn with regard to its inflation views and its very accommodative monetary policy. We believe that risks are building for an accelerated taper announcement later this year with aim of freeing space to kickstart an upward rate cycle before the end of 2022. Most Asian stock markets eke out some gains this morning, as do US equity futures. Nasdaq futures outperform following strong Q4 apple earnings. Today’s stock market session could be important to guide short term risk sentiment. US stock markets didn’t revisit the pre-Fed sell-off lows yet even though sentiment remained extremely shaky on Wednesday and yesterday. A decent session today might be seen as constructive for the next sessions. Short term geopolitical developments suggest to err on the side of caution ahead of the weekend. Longer term, we remain skeptical towards risky assets as well given surging (US) real yields. Today’s eco calendar contains January EC confidence data and US PCE deflators. Consensus expects both headline and core deflators to rise slightly further, to 5.8% Y/Y and 4.8% Y/Y respectively. We don’t expect the numbers to influence trading after this week’s signal from the Fed. There’s no reason to question ruling market trends.
News Headlines
In its quarterly inflation report, the Central Bank of Turkey (CBRT) forecasts inflation to decline to 23.2% (11.8% in October) at the end of this year after it will reach peaks near 50%/55% the first half of the year. The CBRT projects inflation easing further to 8.2% end 2023 an return to the 5.0% target in 2024. The CBRT sees an increased use of the lira in the financial system and the economy as key to address higher inflation and will continue to support measures encouraging domestic investors to convert foreign currency to lira. CBRT governor Kavcioglu repeated that the decline of the lira didn’t have anything to do the with the CBRT cutting the interest rate 500 bps to 14% last year. Turkey’s December headline inflation was 36.03% Y/Y. The January figure will be published Thursday next week. The lira yesterday lost modest ground to close near USD/TRY 13.61. The Reserve Bank of South Africa raised its policy rate by 0.25 ppt to 4.0%, after a first rate hike in November. Headline CPI in South Africa accelerated to 5.9% Y/Y in December. Despite upside risks to inflation, the SARB believes a gradual rise in the repo rate will be sufficient to keep inflation expectations well anchored and moderate the future path of interest rates. The central bank sees inflation at an average 4.9% this year and it expects it to return close to the 4.5% mid-point at the end of the policy horizon in 2024. At that time the SARB indicates the policy rate could be 6.5%, (downwardly revised from 6.75% guidance in November). Economic growth is expected to slow down from an estimated 4.8% in 2021 to 1.7% and 1.8% in 2022 and 2023 respectively. The rand was well bid going in the SARB policy decision, but dropped after the announcement to close at USD/ZAR 15.46.
Gold Prices Tumble as Higher Interest Rate Concerns Remain
American equities jumped sharply on Thursday after the strong economic data from the United States. The Dow Jones rose by more than 400 points while the S&P 500 and Nasdaq 100 indices rose by 45 and 70 points, respectively. The performance happened after the US published strong GDP numbers. The data revealed that the country’s GDP jumped from 2.3% in the third quarter to 6.9% in the fourth quarter. That increase was better than the median estimate of 5.5%. As a result, the economy recorded its fastest growth in a few decades. These numbers came a day after the Federal Reserve made a hawkish interest rate decision.
The euro continued to decline against the US dollar as investors priced in more divergence between the Federal Reserve and the ECB. In its interest rate decision, the Fed hinted that it will implement about three interest rate hikes this year. Jerome Powell did not rule out implementing more rate hikes in a bid to lower the stubbornly high inflation. On the other hand, the ECB appears committed about leaving interest rates low this year. Analysts expect that it will hike interest rates possibly in the third or fourth quarter. Later today, the euro will react to the latest business climate and consumer confidence data from the Eurozone.
The US dollar continued its bullish momentum while gold and silver declined after the Fed decision. The strong US GDP data also provided a catalyst for the US dollar. Later today, the US dollar and gold will react to the latest personal consumer expenditure (PCE) data from the US. Economists expect the data to show that the PCE increased to over 6% in December. This is important economic data since it is one of the Fed’s favourite inflation metrics. The US will also publish the latest consumer sentiment data.
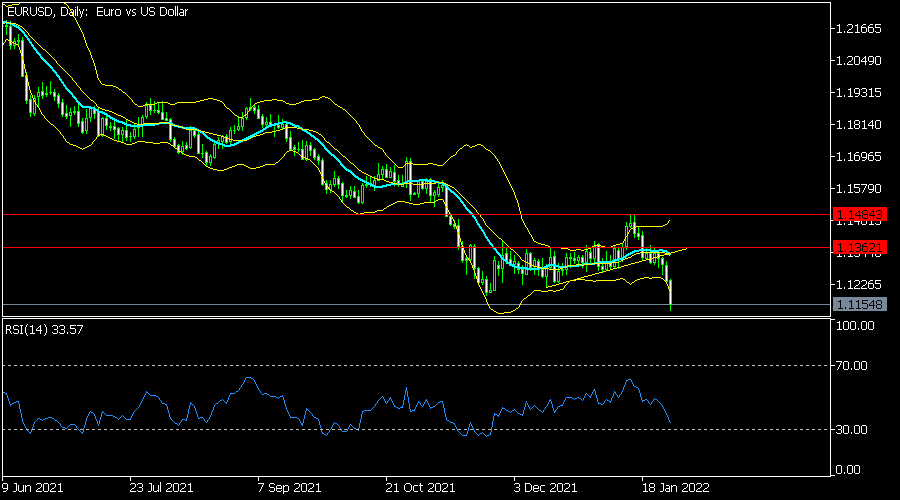
EURUSD
The EURUSD pair continued its bearish momentum in the overnight session as investors reacted to the divergence between the Fed and ECB. the pair declined to a low of 1.1135, which was the lowest level since May 2020. The pair moved below the 25-day and 50-day moving averages on the daily chart. It also moved below the 61.8% Fibonacci retracement level while the MACD is moving towards the oversold level. Therefore, the pair will likely continue dropping as bears target the next key support at 1.1050.
XAUUSD
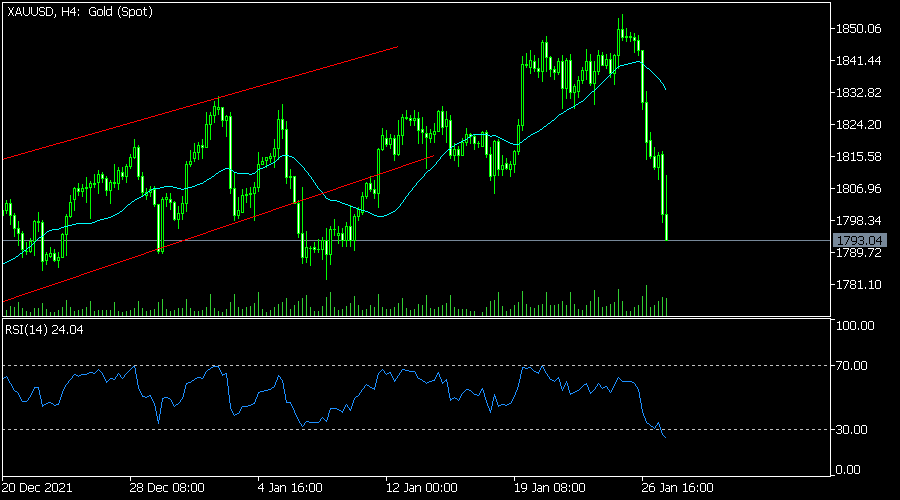
The XAUSD pair declined sharply during the American and Asian sessions. The pair is trading at 1,795, which was the lowest level since January 10. It even moved below the lower side of the ascending channel that is shown in red. It also dropped below the 38.2% Fibonacci retracement level and the 25-day and 50-day moving averages. Therefore, the pair will likely keep falling as bears target the next key support at 1,750.
USDCAD
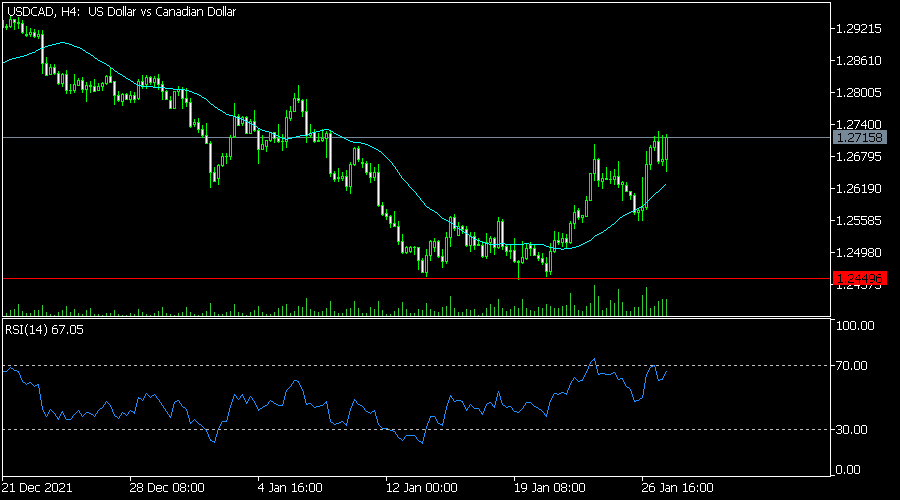
The USDCAD pair tilted upwards as the US dollar strength continued. It is trading at 1.2720, which was the highest level since January 7th. It moved above the 25-day and 50-day moving average and the 38.2% Fibonacci retracement level. Therefore, the pair will likely keep rising in the near term.
Swiss KOF economic barometer rose to 107.8, various subgroups developing unevenly
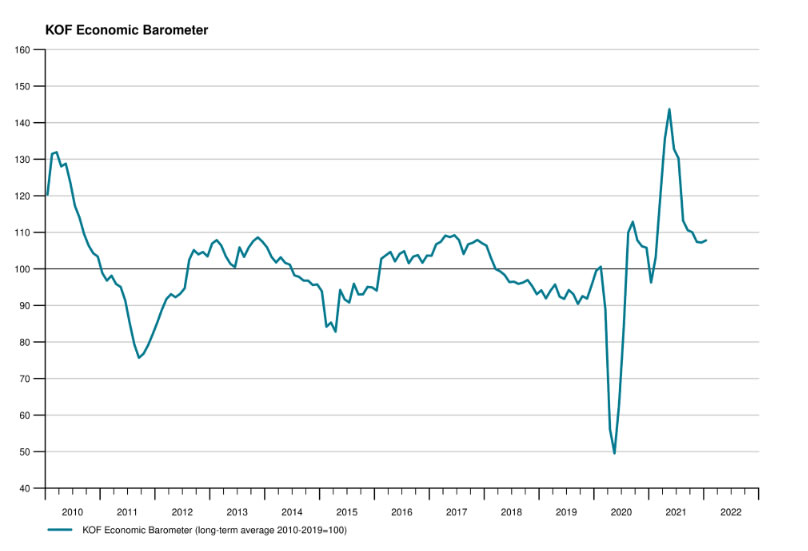
Swiss KOF Economic Barometer rose from 107.2 to 107.8 in January, above expectation of 106.0. KOF said the "various subgroups of the barometer are developing unevenly."
Outlook has improved for consumer spending and for financial and insurance service providers. The outlook also tends to brighten for the accommodation and food service activities. However, in the goods production sector (manufacturing and construction), indicators for almost all sub-aspects of business activity are weakening, especially for profit development, production activity and capacity utilisation.
EUR/USD Daily Outlook
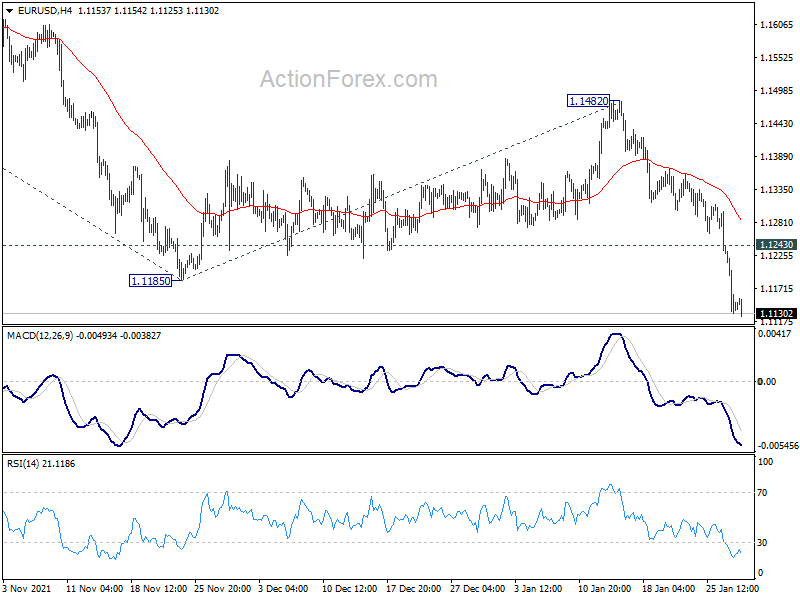
Daily Pivots: (S1) 1.1103; (P) 1.1173; (R1) 1.1214; More...
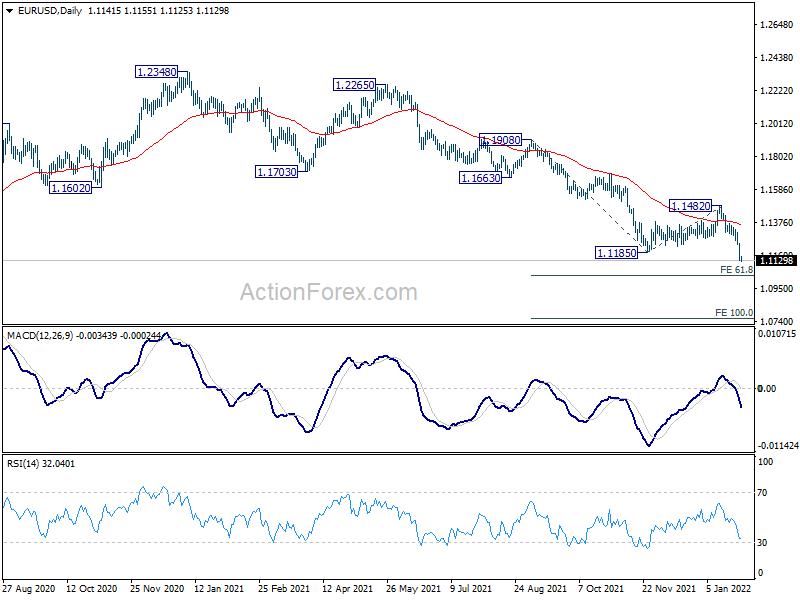
Intraday bias in EUR/USD remains on the downside for the moment. Larger down trend from 1.238 has just resumed. Deeper fall should be seen to 61.8% projection of 1.1908 to 1.1185 from 1.1482 at 1.1035. Break will target 100% projection at 1.0759. On the upside, above 1.1243 minor resistance will turn intraday bias neutral first. but recovery should be limited well below 1.1482 resistance to bring down trend resumption.
In the bigger picture, there are various ways of interpreting the fall from 1.2348 (2021 high). It could be a correction to rise from 1.0635 (2020 low), the fourth leg of a sideway pattern from 1.0339 (2017 low), or resuming long term down trend. In any case, outlook will now stay bearish as long as 1.1482 resistance holds. Next target would be 1.0635 low.