

Sample Category Title
USD/JPY Daily Outlook
Daily Pivots: (S1) 115.39; (P) 115.71; (R1) 115.89; More...
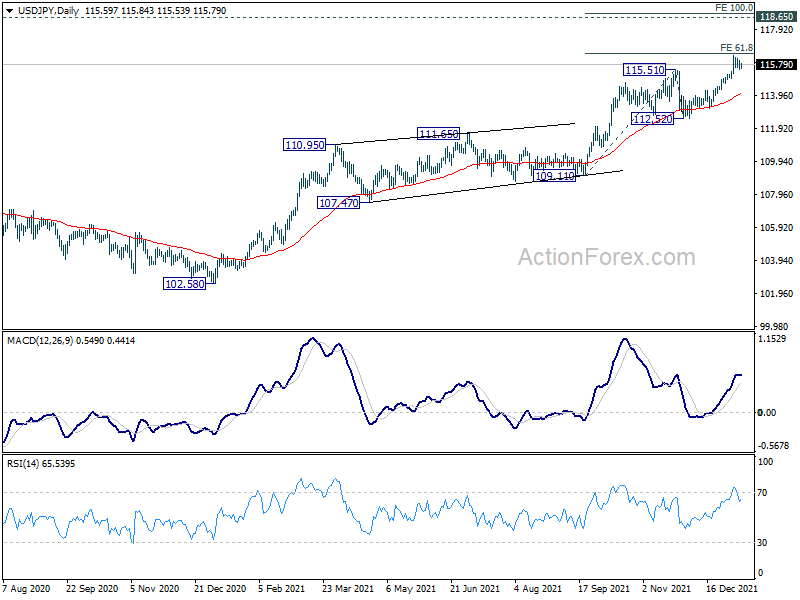
Intraday bias in USD/JPY remains neutral for consolidation below 116.34 temporary top. Downside of retreat should be contained well well above 114.26 resistance turned support to bring rally resumption. On the upside, firm break of 61.8% projection of 109.11 to 115.51 from 112.52 at 116.47 will pave the way to 100% projection at 118.90, which is close to 118.65 long term resistance.
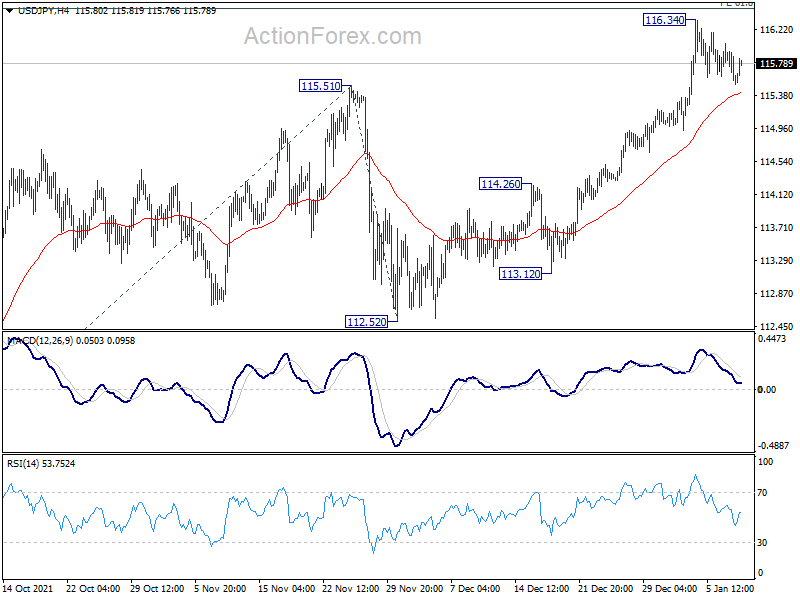
In the bigger picture, no change in the view that rise from 102.58 is the third leg of the up trend from 101.18 (2020 low). Such rally should target a test on 118.65 (2016 high). Sustained break there will pave the way to 120.85 (2015 high) and raise the chance of long term up trend resumption. For now, this will remain the favored case as long as 112.52 support holds, in case of deep pull back.
USD/CAD Daily Outlook
Daily Pivots: (S1) 1.2607; (P) 1.2669; (R1) 1.2706; More...
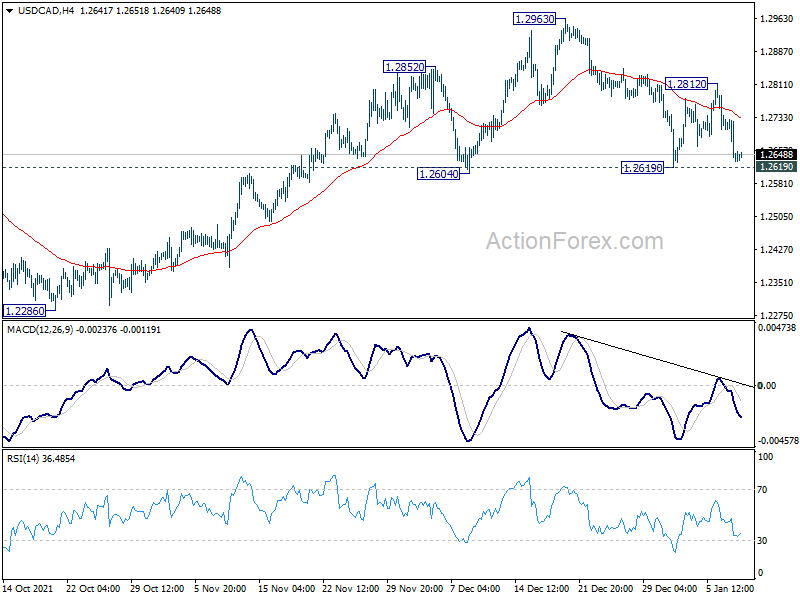
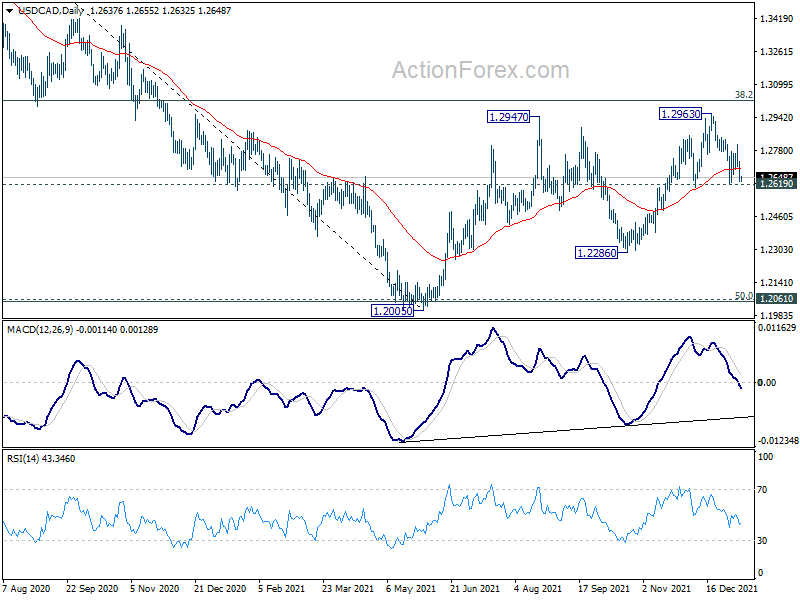
Intraday bias in USD/CAD remains neutral at this point. On the downside, firm break of 1.2619 support will complete a head and should top pattern (ls: 1.2852, h: 1.2963, rs: 1.2812). That would also argue that whole pattern from 1.2005 has completed with three waves to 1.2963. Intraday bias will be back to the downside for 1.2286 support, and possibly further to 1.2005 low. On the upside, though, break of 1.2812 minor resistance will retain near term bullishness, and target 1.2963 and then 1.3022 fibonacci level.
In the bigger picture, focus will be on 38.2% retracement of 1.4667 (2020 high) to 1.2005 (2021 low) at 1.3022. Sustained break there should confirm that the down trend from 1.4667 has completed after defending 1.2061 long term cluster support. Further rise would then be seen towards 61.8% retracement at 1.3650. On the downside, however, break of 1.2286 will turn focus back to 1.2005 low again.
AUD/USD Daily Report
Daily Pivots: (S1) 0.7145; (P) 0.7167; (R1) 0.7203; More...
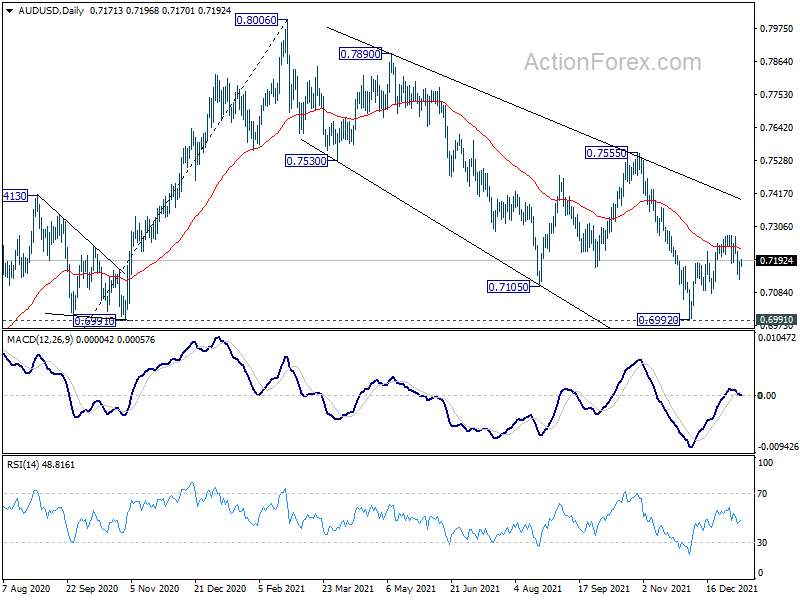
AUD/USD recovers mildly today but stays in range of 0.7081/7277. Intraday bias remains neutral for the moment. On the downside, break of 0.7081 support will indicate that corrective rebound from 0.6992 has completed with three waves up to 0.7277, after hitting 55 day EMA. Intraday bias will be back on the downside for retesting 0.6991/2 key support zone. Firm break there will resume larger down trend from 0.8006. On the upside, though, break of 0.7277 will turn bias to the upside to resume the rebound.
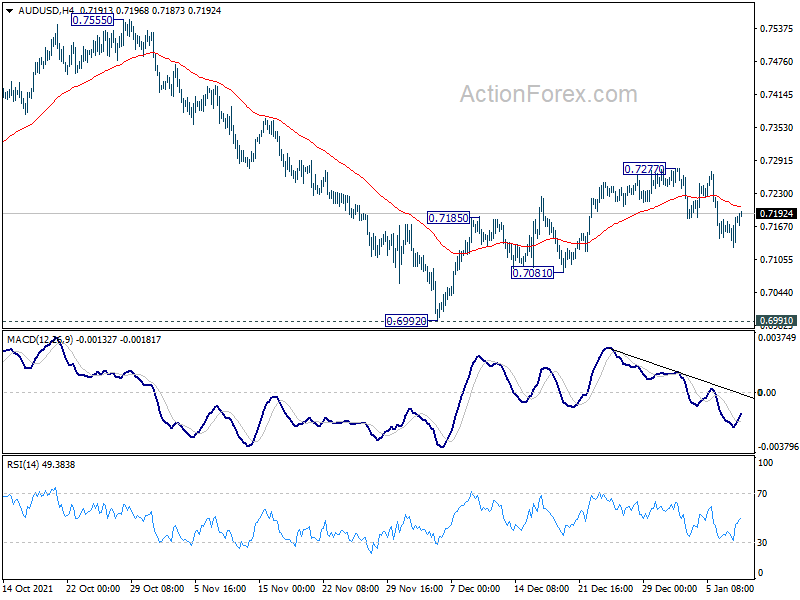
In the bigger picture, strong rebound from 0.6991 key structural support will retain medium term bullishness. That is, whole up trend from 0.5506 is still in progress. Firm break of 0.7555 resistance will target 0.8006 high and above. However, sustained break of 0.6991 will argue that the whole up trend from 0.5506 might be finished at 0.8006, after rejection by 0.8135 long term resistance. Deeper decline would then be seen back to 61.8% retracement of 0.5506 to 0.8006 at 0.6461.
Euro Softens in Quiet Trading, Aussie Ticking Up
Euro turns softer in a quiet Asian session together with Swiss Franc, but Yen is even weaker. On the other hand, Aussie is ticking up slightly together with Loonie and Dollar. Overall, trading is rather subdued with major Asian stock indexes treading water in tight range, and Japan is on holiday. Focuses will turn to Fed chair Jerome Powell's testimony, and US inflation data later in the week, which should bring the markets back to life.
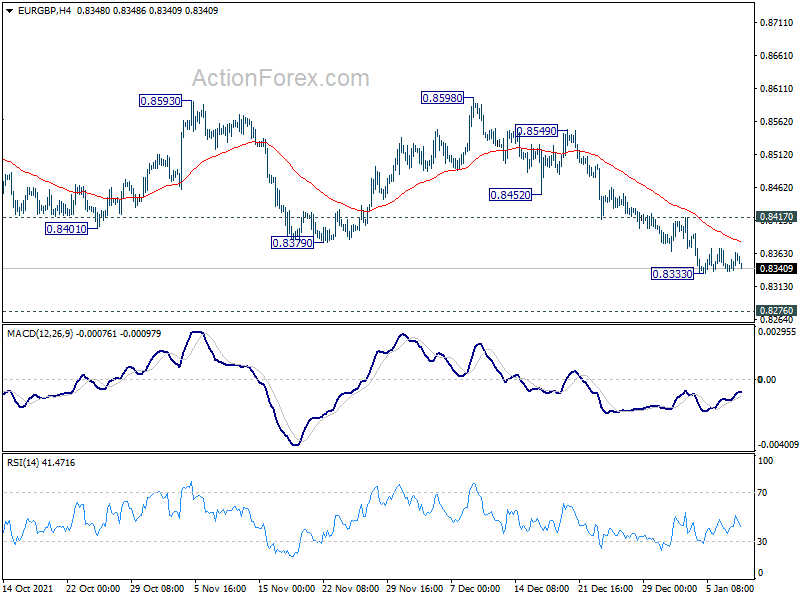
Technically, we'll keep an eye on Sterling. EUR/GBP is staying bearish, and it looks ready to resume the medium term down trend through 0.8333 temporary low any time. GBP/JPY is also still on track to retest 158.19 resistance, and resume larger up trend. Meanwhile, if GBP/USD could build up more momentum above 1.3570 support turned resistance, that would solidify the case of near term bullish reversal for 1.3833 resistance next.
In Asia, at the time of writing, Hong Kong HSI is up 0.71%. China Shanghai SSE is up 0.21%. Singapore Strait Times is up 0.78%. Japan is on holiday.
IMF Blog: Faster Fed hike could rattle financial markets
In an blog post, senior IMF officials said the continued to expect "robust US growth". Inflation will "likely moderate" late this year as supply disruptions ease and fiscal contraction weighs on demand. Fed's indication that it would raise interest rate more quickly "did not cause a substantial market reassessment of the economic outlook".
"Should policy rates rise and inflation moderate as expected, history shows that the effects for emerging markets are likely benign if tightening is gradual, well telegraphed, and in response to a strengthening recovery," the post noted.
However, "broad-based US wage inflation or sustained supply bottlenecks could boost prices more than anticipated and fuel expectations for more rapid inflation".
"Faster Fed rate increases in response could rattle financial markets and tighten financial conditions globally. These developments could come with a slowing of US demand and trade and may lead to capital outflows and currency depreciation in emerging markets."
ECB Schnabel: Rising energy prices may require a departure from a looking through policy
ECB Executive Board member Isabel Schnabel warned in a speech on Saturday, "monetary policy, for its part, cannot afford to look through energy price increases if they pose a risk to medium-term price stability."
"This could be the case if prospects of persistently rising energy prices contribute to a deanchoring of inflation expectations, or if underlying price pressures threaten to lift inflation above our 2% target as rising carbon prices and the associated shifts in economic activity boost rather than suppress growth, employment and aggregate demand over the medium term."
WTI oil back below 80 as Kazakhstan normalizes production
Oil prices dip mildly in Asian session as Kazakhstan's largest oil venture Tengizchevroil is gradually normalizing production. Some contractors had disrupted train lines in support of protests in the country last week.
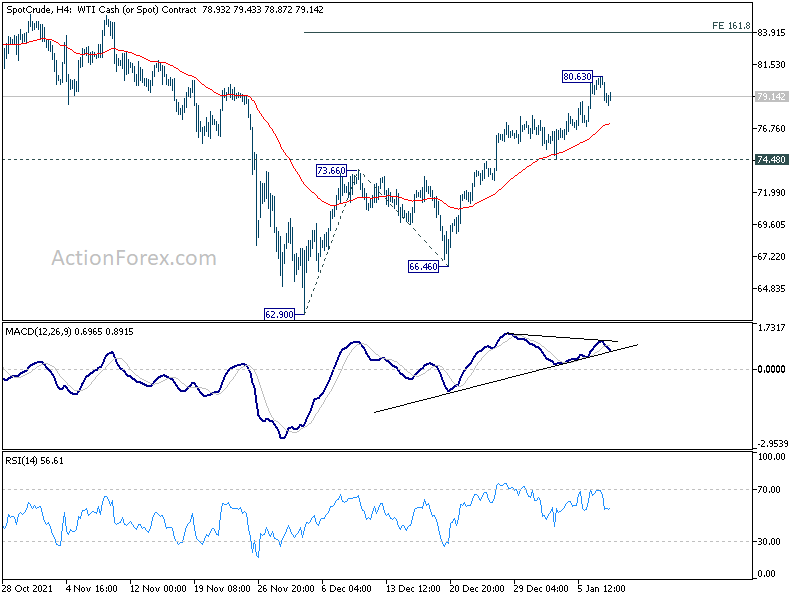
WTI crude oil hit as high as 80.63 last week but fails to sustain above 80 handle so far. Some consolidations could be seen first, but further rally is expected as long as 74.48 support holds. Rally from 62.90 should target 161.8% projection of 62.90 to 73.66 from 66.46 at 83.86, which is close to 85.92 high.
For now, we're not expecting a break of 85.92 yet. We'd expect at least one more down leg before the corrective pattern from there completes. Hence, we'd look for topping between 83.86/85.92.
Fed Powell testimony and US inflation to move the markets
Fed Chair Jerome Powell's testimony before Senate Banking committee will be a main focus of the week. Powell would likely be asked about his views on March rate hike, as well as the timing of off-loading the balance sheet. Additionally, CPI and PPI from the US would be equally market moving while retail sales will be featured. Elsewhere, a batch of data from China, UK and Australia will also catch some attention.
Here are some highlights for the week:
- Monday: Australia MI inflation gauge, building approvals; Eurozone Sentix investor confidence, unemployment rate.
- Tuesday: Australia retail sales, trade balance; Japan leading indicators; Fed chair Powell's testimony.
- Wednesday: Japan banking lending, current account, Eco watchers sentiment; China CPI, PPI; Eurozone industrial production; US CPI, Fed's Beige Book.
- Thursday: New Zealand building permits; Japan M2; ECB monthly bulletin; US PPI, jobless claims.
- Friday: China trade balance; Japan PPI; UK GDP, production, trade balance; Eurozone balance; US retail sales, import prices, industrial production, U of Michigan sentiment.
AUD/USD Daily Report
Daily Pivots: (S1) 0.7145; (P) 0.7167; (R1) 0.7203; More...
AUD/USD recovers mildly today but stays in range of 0.7081/7277. Intraday bias remains neutral for the moment. On the downside, break of 0.7081 support will indicate that corrective rebound from 0.6992 has completed with three waves up to 0.7277, after hitting 55 day EMA. Intraday bias will be back on the downside for retesting 0.6991/2 key support zone. Firm break there will resume larger down trend from 0.8006. On the upside, though, break of 0.7277 will turn bias to the upside to resume the rebound.
In the bigger picture, strong rebound from 0.6991 key structural support will retain medium term bullishness. That is, whole up trend from 0.5506 is still in progress. Firm break of 0.7555 resistance will target 0.8006 high and above. However, sustained break of 0.6991 will argue that the whole up trend from 0.5506 might be finished at 0.8006, after rejection by 0.8135 long term resistance. Deeper decline would then be seen back to 61.8% retracement of 0.5506 to 0.8006 at 0.6461.
Economic Indicators Update
| GMT | Ccy | Events | Actual | Forecast | Previous | Revised |
|---|---|---|---|---|---|---|
| 00:00 | AUD | TD Securities Inflation M/M Dec | 0.20% | 0.30% | ||
| 00:30 | AUD | Building Permits M/M Nov | 3.60% | 3.20% | -12.90% | |
| 09:30 | EUR | Eurozone Sentix Investor Confidence Jan | 12 | 13.5 | ||
| 10:00 | EUR | Eurozone Unemployment Rate Nov | 7.20% | 7.30% | ||
| 15:00 | USD | Wholesale Inventories Nov F | 1.20% | 1.20% |
IMF Blog: Faster Fed hike could rattle financial markets
In an blog post, senior IMF officials said the continued to expect "robust US growth". Inflation will "likely moderate" late this year as supply disruptions ease and fiscal contraction weighs on demand. Fed's indication that it would raise interest rate more quickly "did not cause a substantial market reassessment of the economic outlook".
"Should policy rates rise and inflation moderate as expected, history shows that the effects for emerging markets are likely benign if tightening is gradual, well telegraphed, and in response to a strengthening recovery," the post noted.
However, "broad-based US wage inflation or sustained supply bottlenecks could boost prices more than anticipated and fuel expectations for more rapid inflation".
"Faster Fed rate increases in response could rattle financial markets and tighten financial conditions globally. These developments could come with a slowing of US demand and trade and may lead to capital outflows and currency depreciation in emerging markets."
WTI oil back below 80 as Kazakhstan normalizes production
Oil prices dip mildly in Asian session as Kazakhstan's largest oil venture Tengizchevroil is gradually normalizing production. Some contractors had disrupted train lines in support of protests in the country last week.
WTI crude oil hit as high as 80.63 last week but fails to sustain above 80 handle so far. Some consolidations could be seen first, but further rally is expected as long as 74.48 support holds. Rally from 62.90 should target 161.8% projection of 62.90 to 73.66 from 66.46 at 83.86, which is close to 85.92 high.
For now, we're not expecting a break of 85.92 yet. We'd expect at least one more down leg before the corrective pattern from there completes. Hence, we'd look for topping between 83.86/85.92.
ECB Schnabel: Rising energy prices may require a departure from a looking through policy
ECB Executive Board member Isabel Schnabel warned in a speech on Saturday, "monetary policy, for its part, cannot afford to look through energy price increases if they pose a risk to medium-term price stability."
"This could be the case if prospects of persistently rising energy prices contribute to a deanchoring of inflation expectations, or if underlying price pressures threaten to lift inflation above our 2% target as rising carbon prices and the associated shifts in economic activity boost rather than suppress growth, employment and aggregate demand over the medium term."
AUDUSD Forecasting The Decline After Elliott Wave Double Three Pattern
Hello fellow traders. In this technical blog we’re going to take a quick look at the Elliott Wave charts of AUDUSD Forex Pair published in members area of the Elliottwave-Forecast . As our members know, AUDUSD s is showing lower low sequences in the cycle from the February 25th peak. Recently we got recovery which has unfolded as Elliott Wave Double Three pattern. In further text we’re going to explain the forecast and Elliott Wave Pattern and trading strategy.
Before we take a look at the real market example, let’s explain Elliott Wave Double Three pattern.
Elliott Wave Double Three Pattern
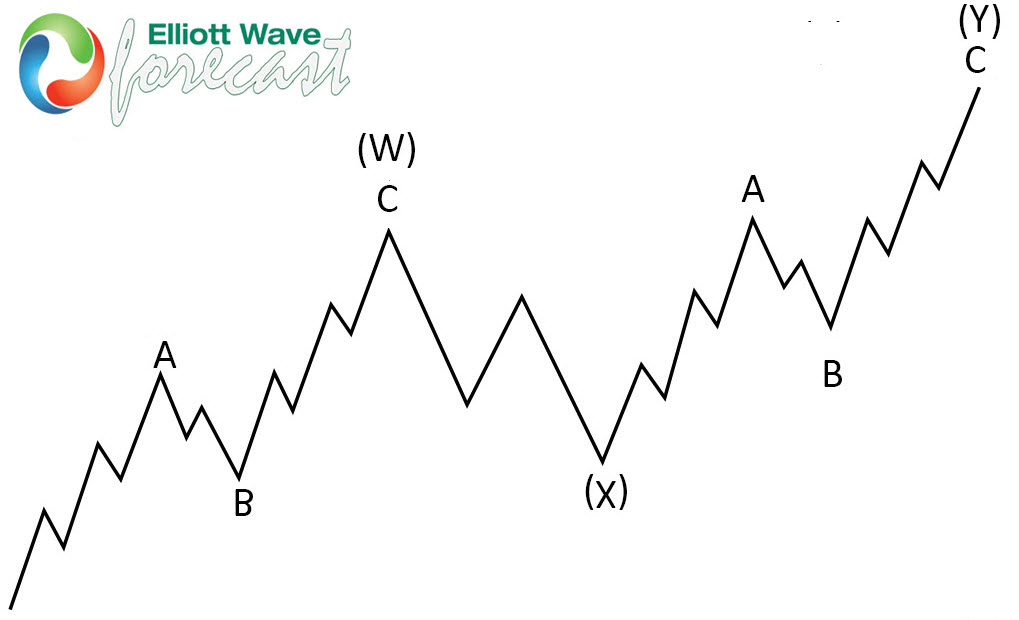
Double three is the common pattern in the market , also known as 7 swing structure. It’s a reliable pattern which is giving us good trading entries with clearly defined invalidation levels.
The picture below presents what Elliott Wave Double Three pattern looks like. It has (W),(X),(Y) labeling and 3,3,3 inner structure, which means all of these 3 legs are corrective sequences. Each (W) and (Y) are made of 3 swings , they’re having A,B,C structure in lower degree, or alternatively they can have W,X,Y labeling.
AUDUSD 4 Hour Elliott Wave Analysis 01.02.2022
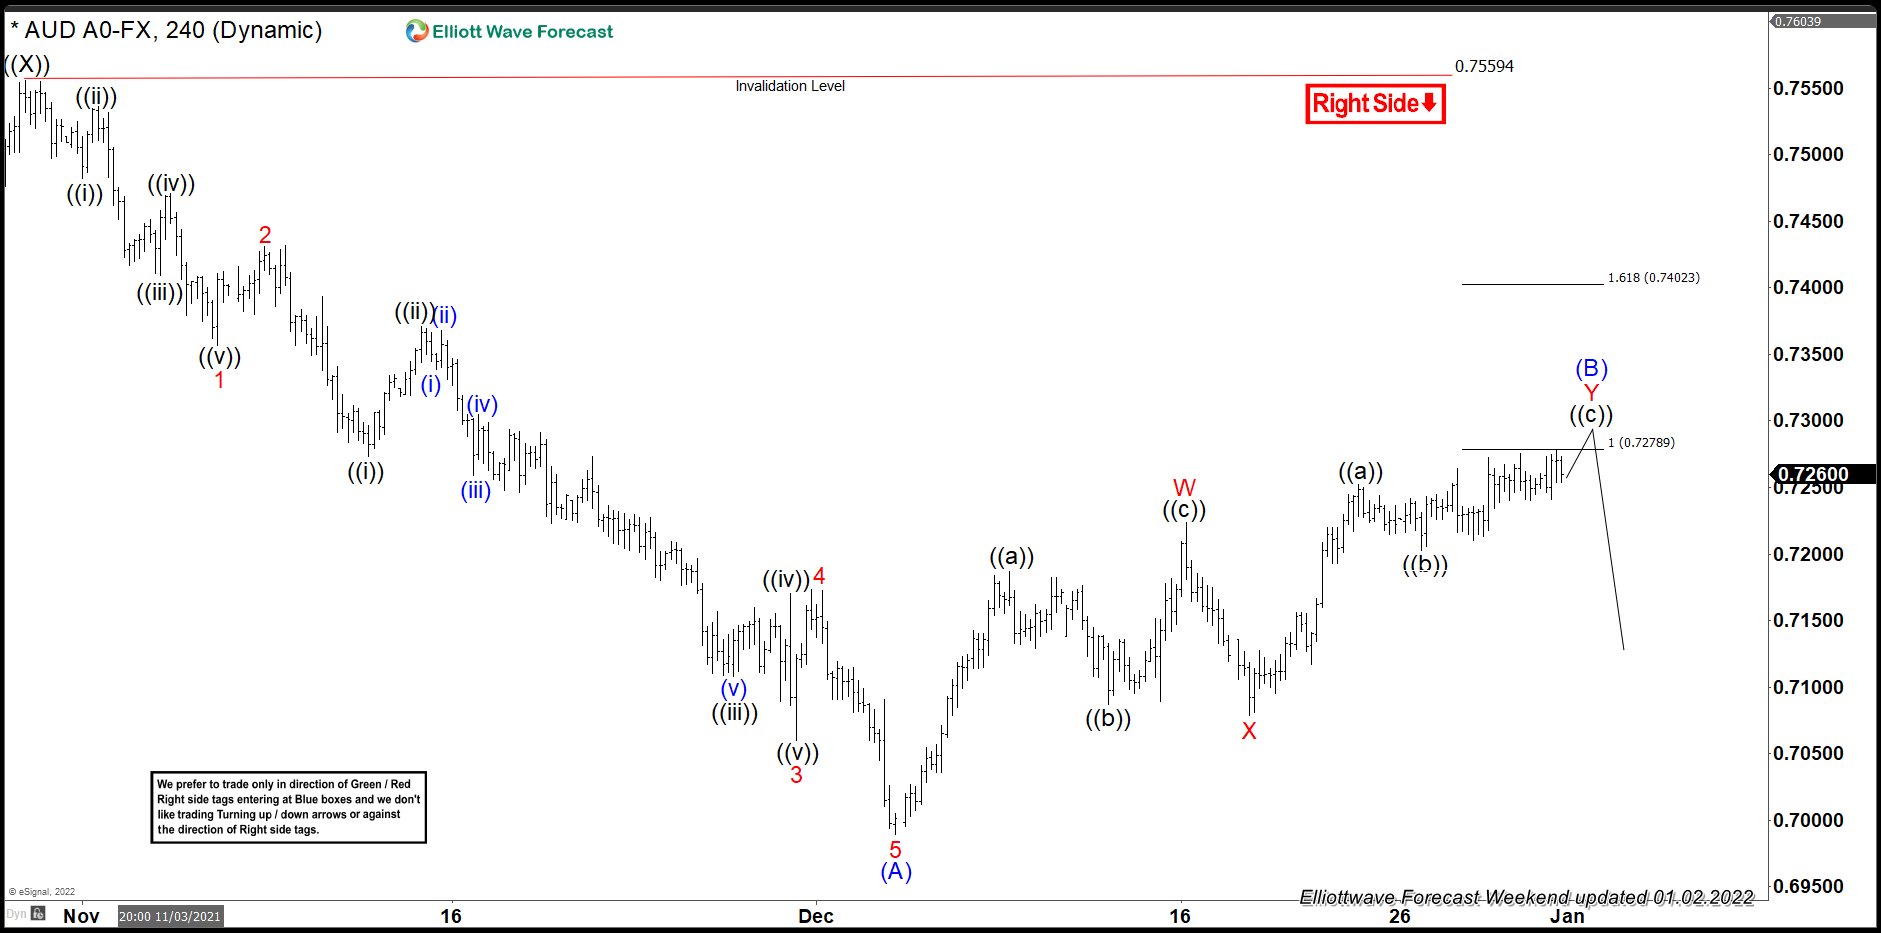
AUDUSD is giving us (B) blue recovery that is unfolding as Elliott Wave Double Three Pattern. It’s having WXY red inner labeling. The main characteristic of Double Three is that all 3 legs has corrective sequences. First leg Wave W has clear 3 waves structure , Zig Zag ((a))((b))((c)) that ended as trunaction. Then we got 3 waves pull back in ((x)) connector. Currently the pair is doing last leg up Y red h is also unfolding as Zig Zag Pattern. Recovery has already reached extremes at 0.7278 area , and turn can happen any moment. incomplete at the moment. We recommend members to avoid buying, while favoring the short side as far as the price holds below 1.618 fib ext 0.7402 level and as far as 0.7559 pivot holds.
AUDUSD 4 Hour Elliott Wave Analysis 01.08.2022
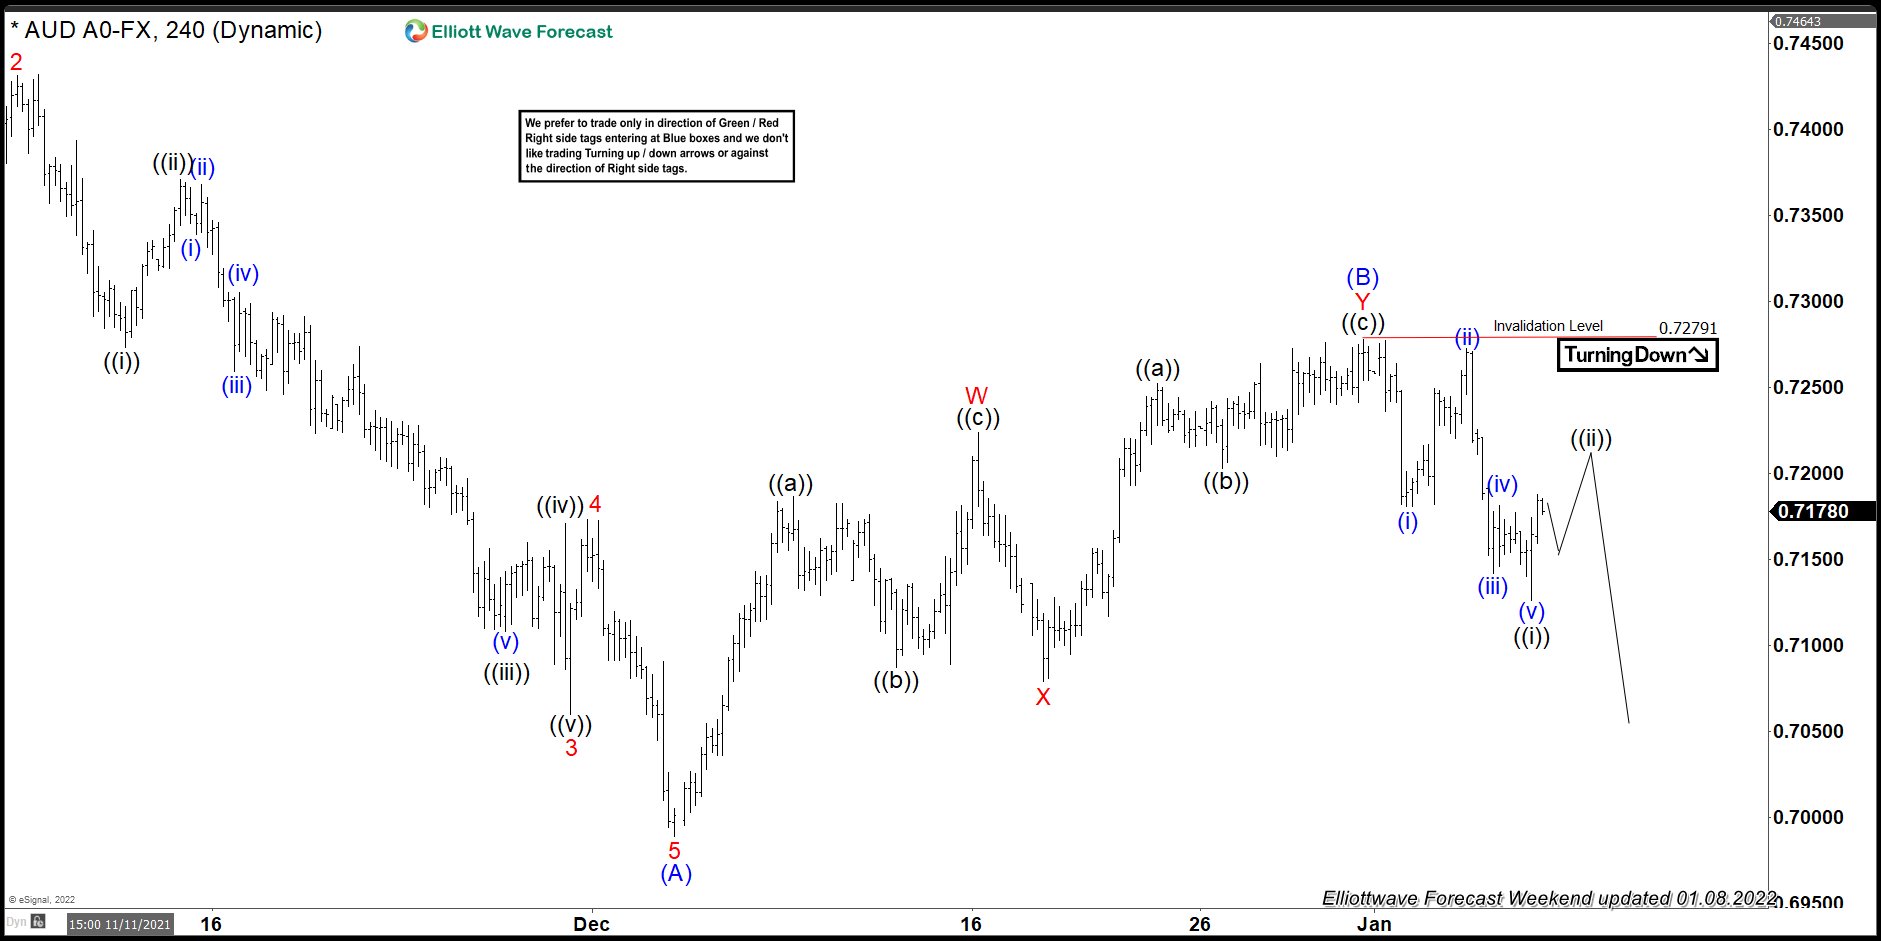
Sellers appeared at the equal legs area 0.72789 and we got good reaction from there. The decline from the blue box reached 50 fibs against the X connector, as a result members who took short positions should be enjoying profits in a Risk Free positions. At the moment we see wave (B) blue recovery completed at 0.7279. Decline from the 0.7279 high looks like 5 waves which increases chances next leg down is in progress. Currently we can be doing 3 waves bounce against the mentioned high. However if pivot at 0.7279 gives up we could see larger recovery.
Keep in mind that market is dynamic and presented view could have changed in the mean time. You can check most recent charts in the membership area of the site. Best instruments to trade are those having incomplete bullish or bearish swings sequences. We put them in Sequence Report and best among them are shown in the Live Trading Room.
Technical Outlook and Review
DXY:
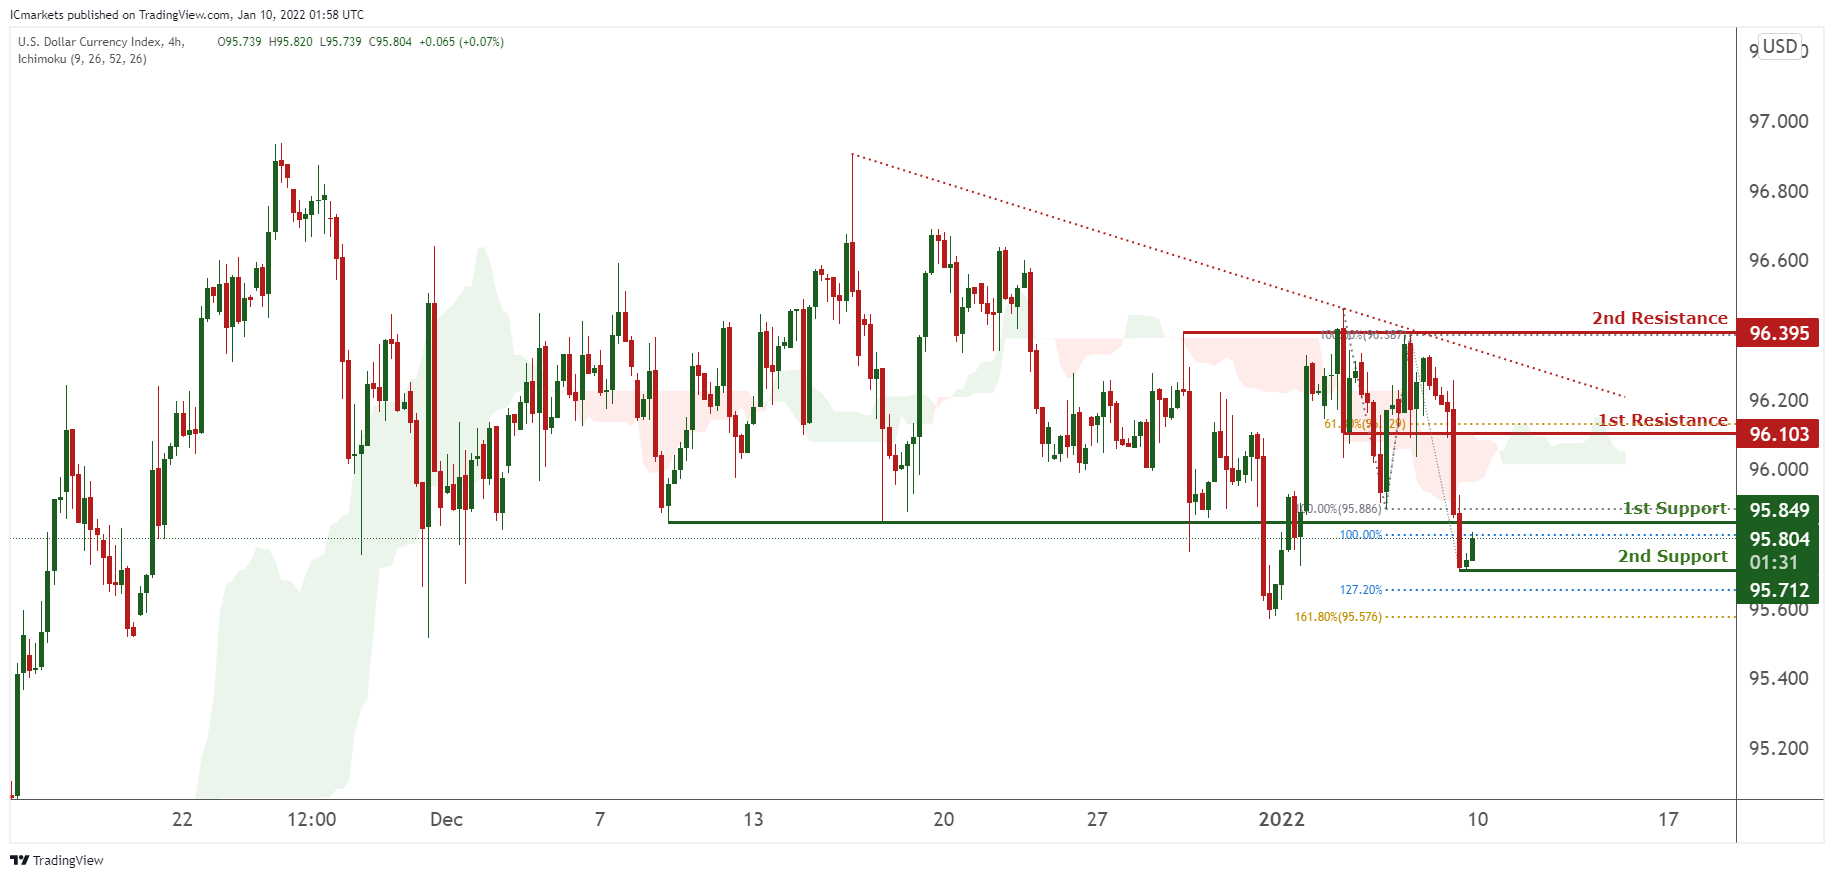
On the H4 timeframe, prices are on bearish momentum and abiding to our bearish trendline. We would expect a bounce from our 1st support at 95.804 in line with 100% Fibonacci extension and 100% Fibonacci retracement towards our 1st resistance at 96.103 in line with 61.8% Fibonacci extension. Ichimoku clouds are forecasting a bullish upward movement.
Areas of consideration:
H4 time frame, 1st resistance at 96.103
H4 time frame, 1st support at 95.804
XAU/USD (GOLD):
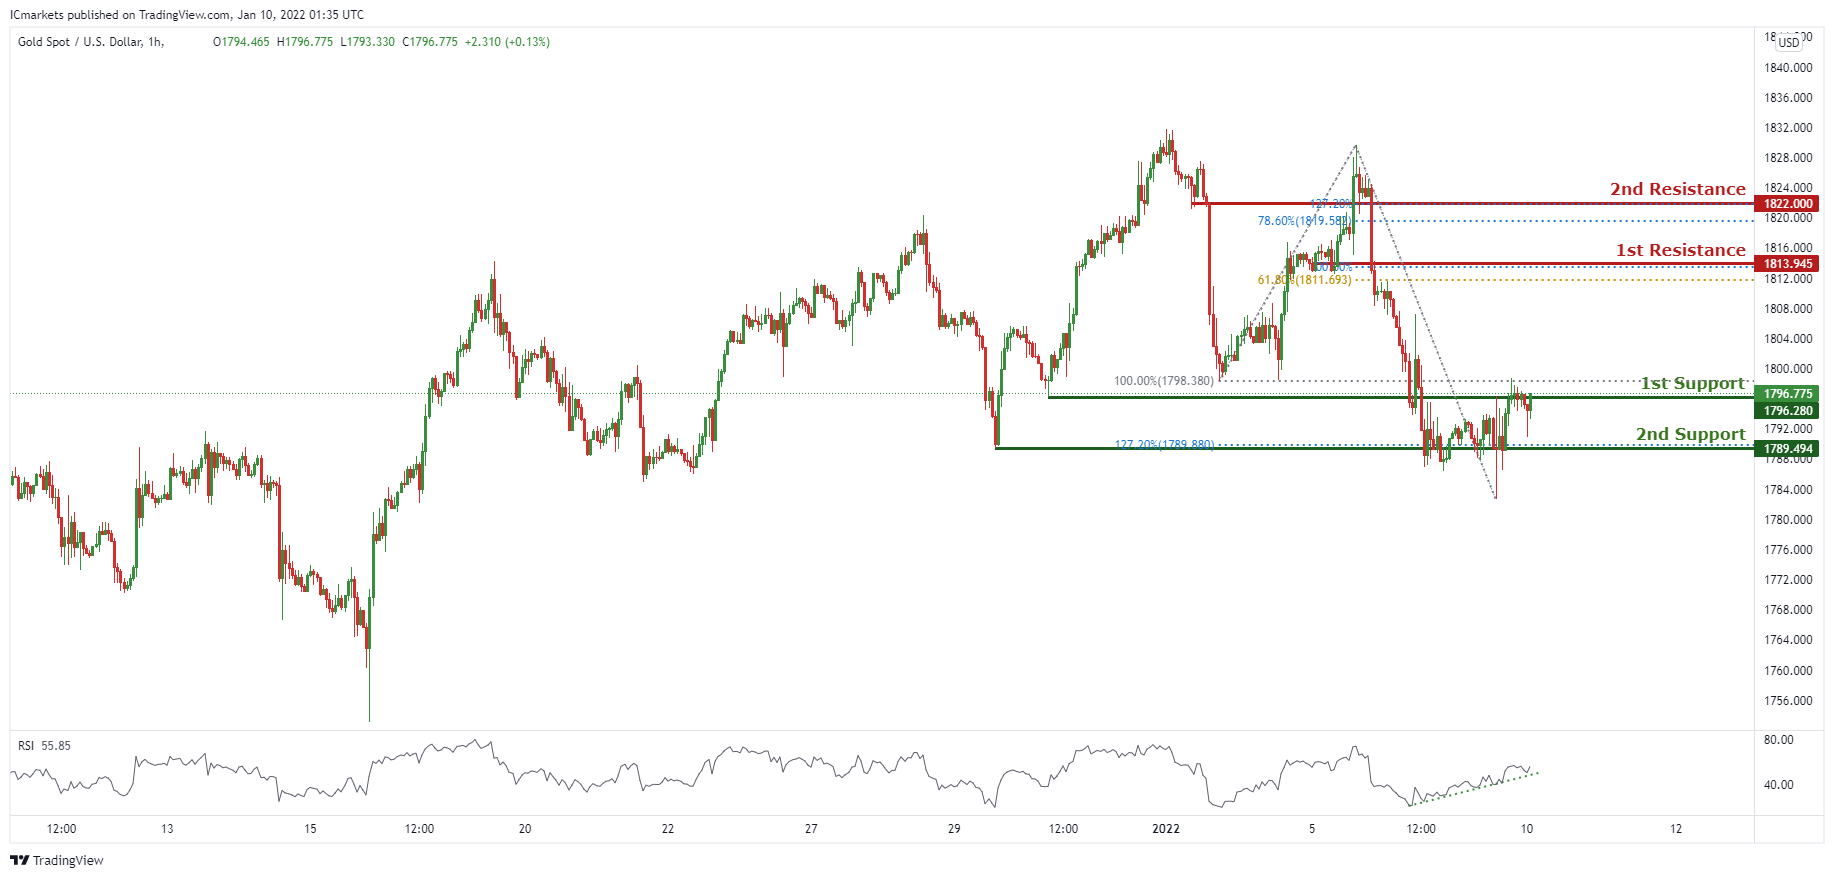
On the H4 chart, prices are consolidating sideways. We see potential for prices to climb from our 1st support at 1796.280 in line with 100% Fibonacci retracement towards our 1st resistance at 1813.945 in line with 100% Fibonacci extension and 61.8% Fibonacci retracement. RSI is also portraying bullish momentum. Alternatively, breaking our 1st support will find prices dipping towards our 2nd support at 1789.494 in line with 127.2% Fibonacci extension.
Areas of consideration:
H4 1st support at 1796.280
H4 1st resistance at 1813.945
GBP/USD
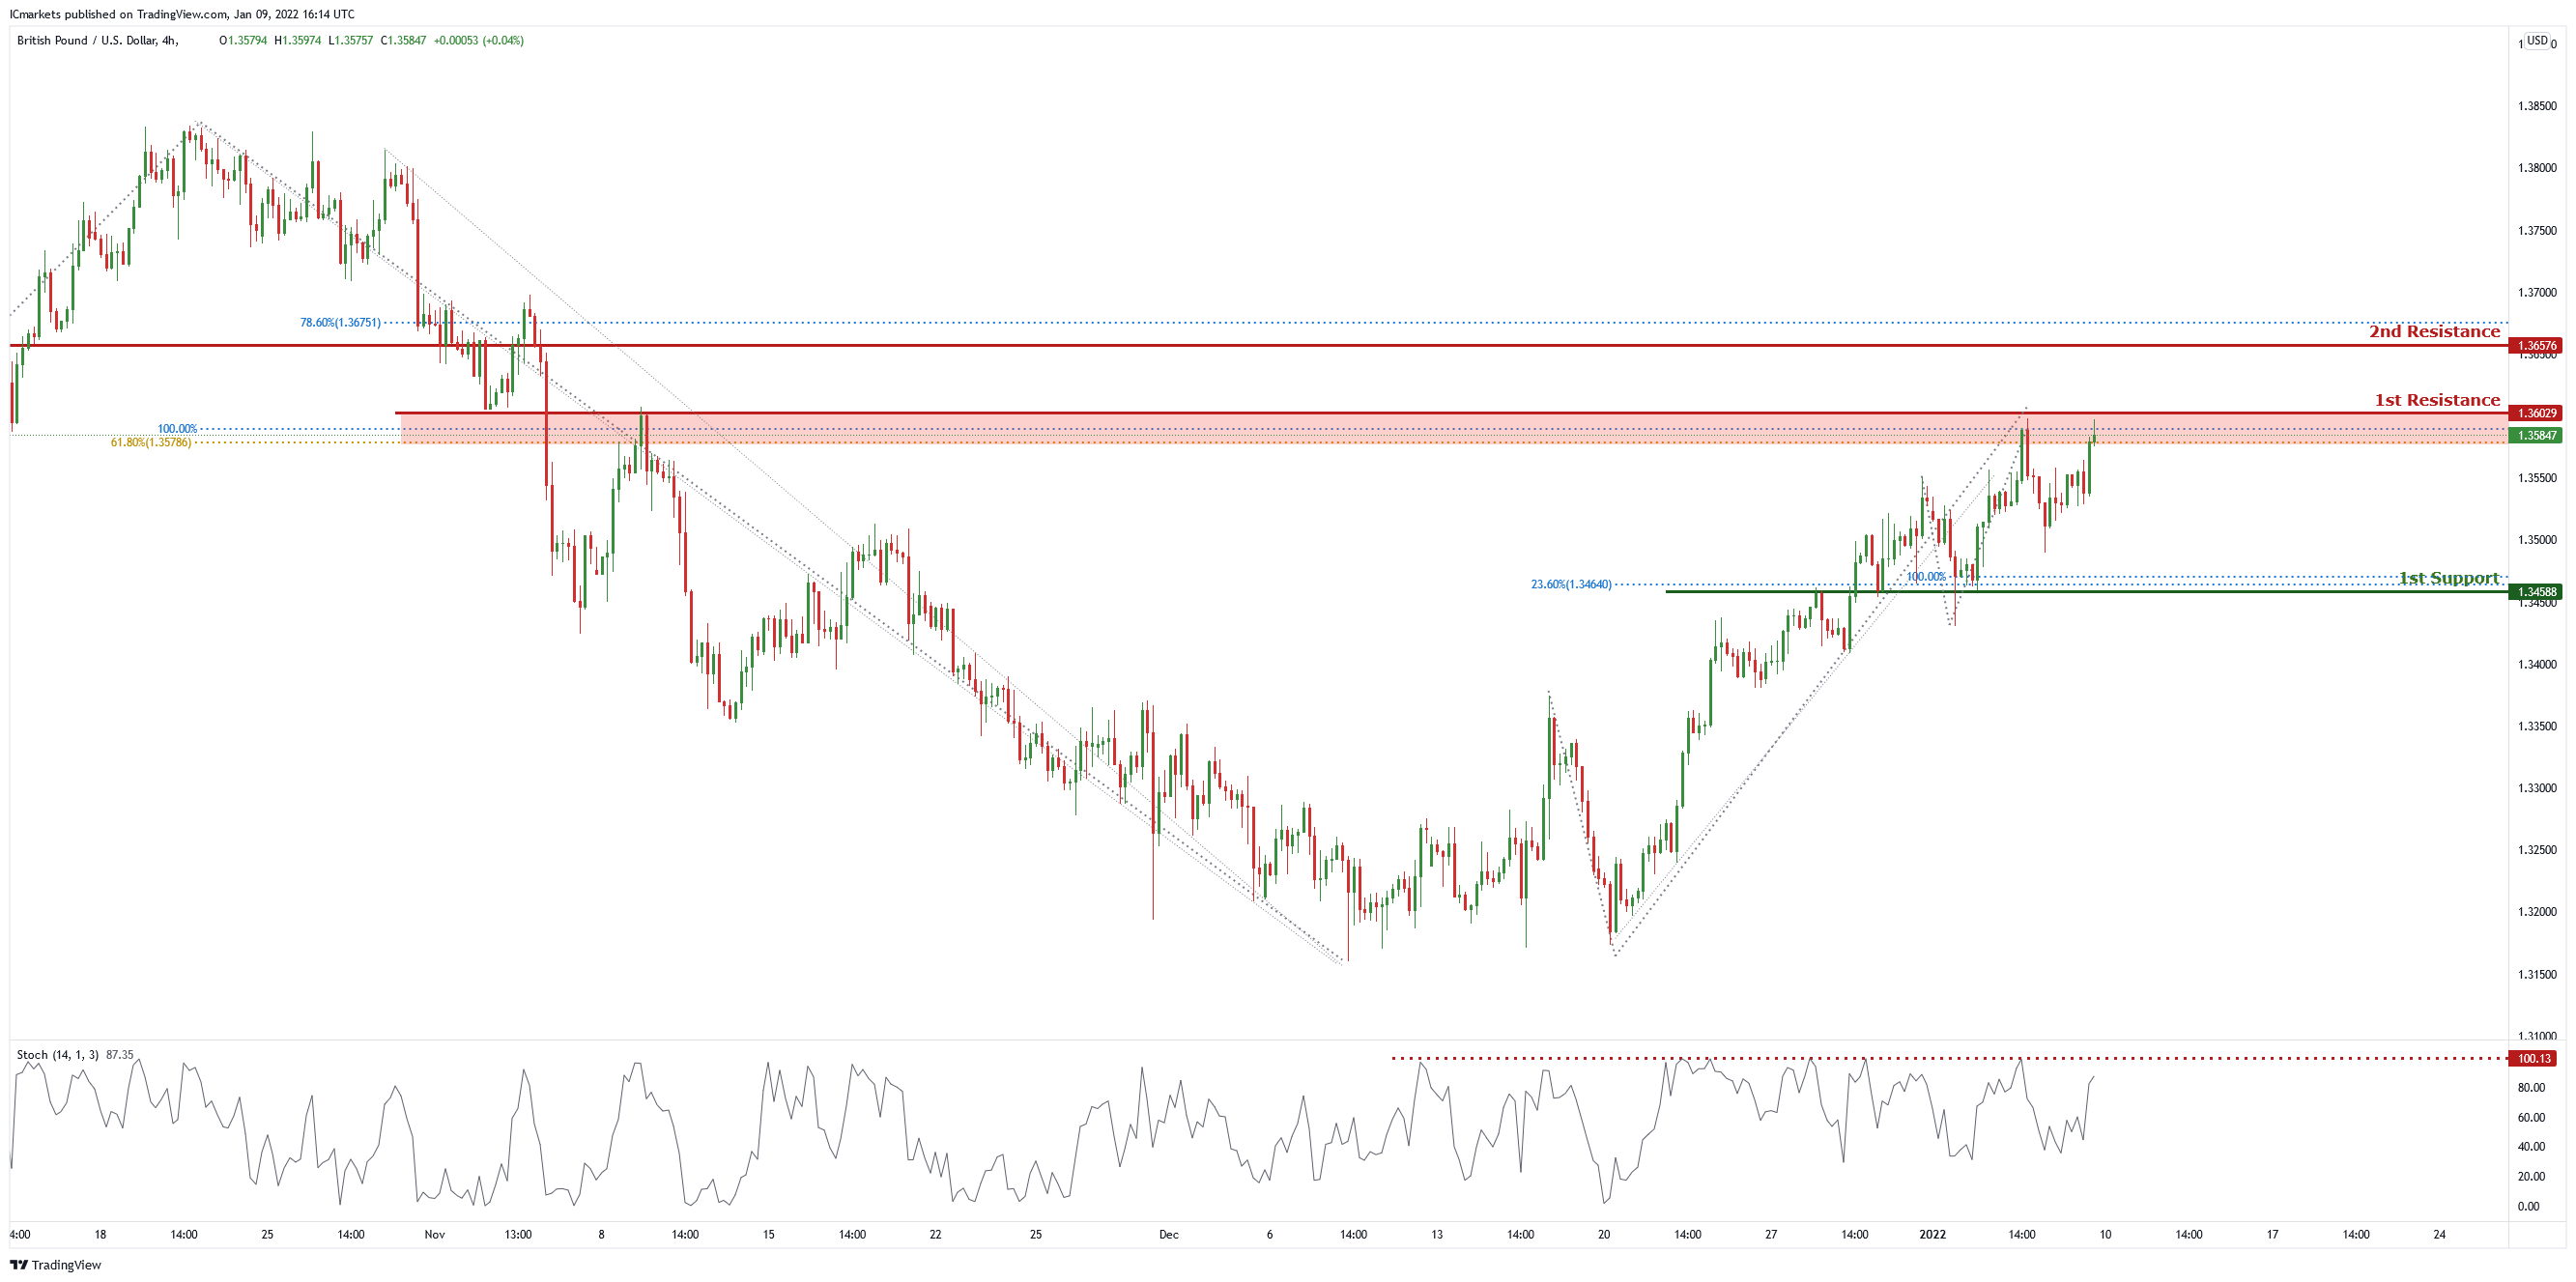
On the H4 chart, price is at the first resistance level of 1.36029 which is also 100% Fibonacci projection and 61.8% Fibonacci retracement. Price can potentially dip to the 1st support level of 1.34588 which is also 23.6% Fibonacci retracement and 100% Fibonacci projection. Our bearish bias is supported by the stochastic indicator as it is near resistance level.
Areas of consideration:
H4 1st resistance at 1.36029
H4 1st support 1.34588
USD/CHF
In reference to last week’s analysis, prices are on bearish momentum and abiding to our descending trendline and price is moving nicely to the 1st Support. .We can expect price to continue to drop from 1st Resistance in line with 38.2% Fibonacci retracement and graphical overlap resistance towards 1st Support in line with 61.8% Fibonacci retracement and 127.2% Fibonacci projection. Our bearish bias is further supported by the stochastic indicator where the %K line is at the resistance level.
Areas of consideration:
Watch 1st Support at 0.91409
Watch 1st Resistance at 0.91966

EUR/USD :
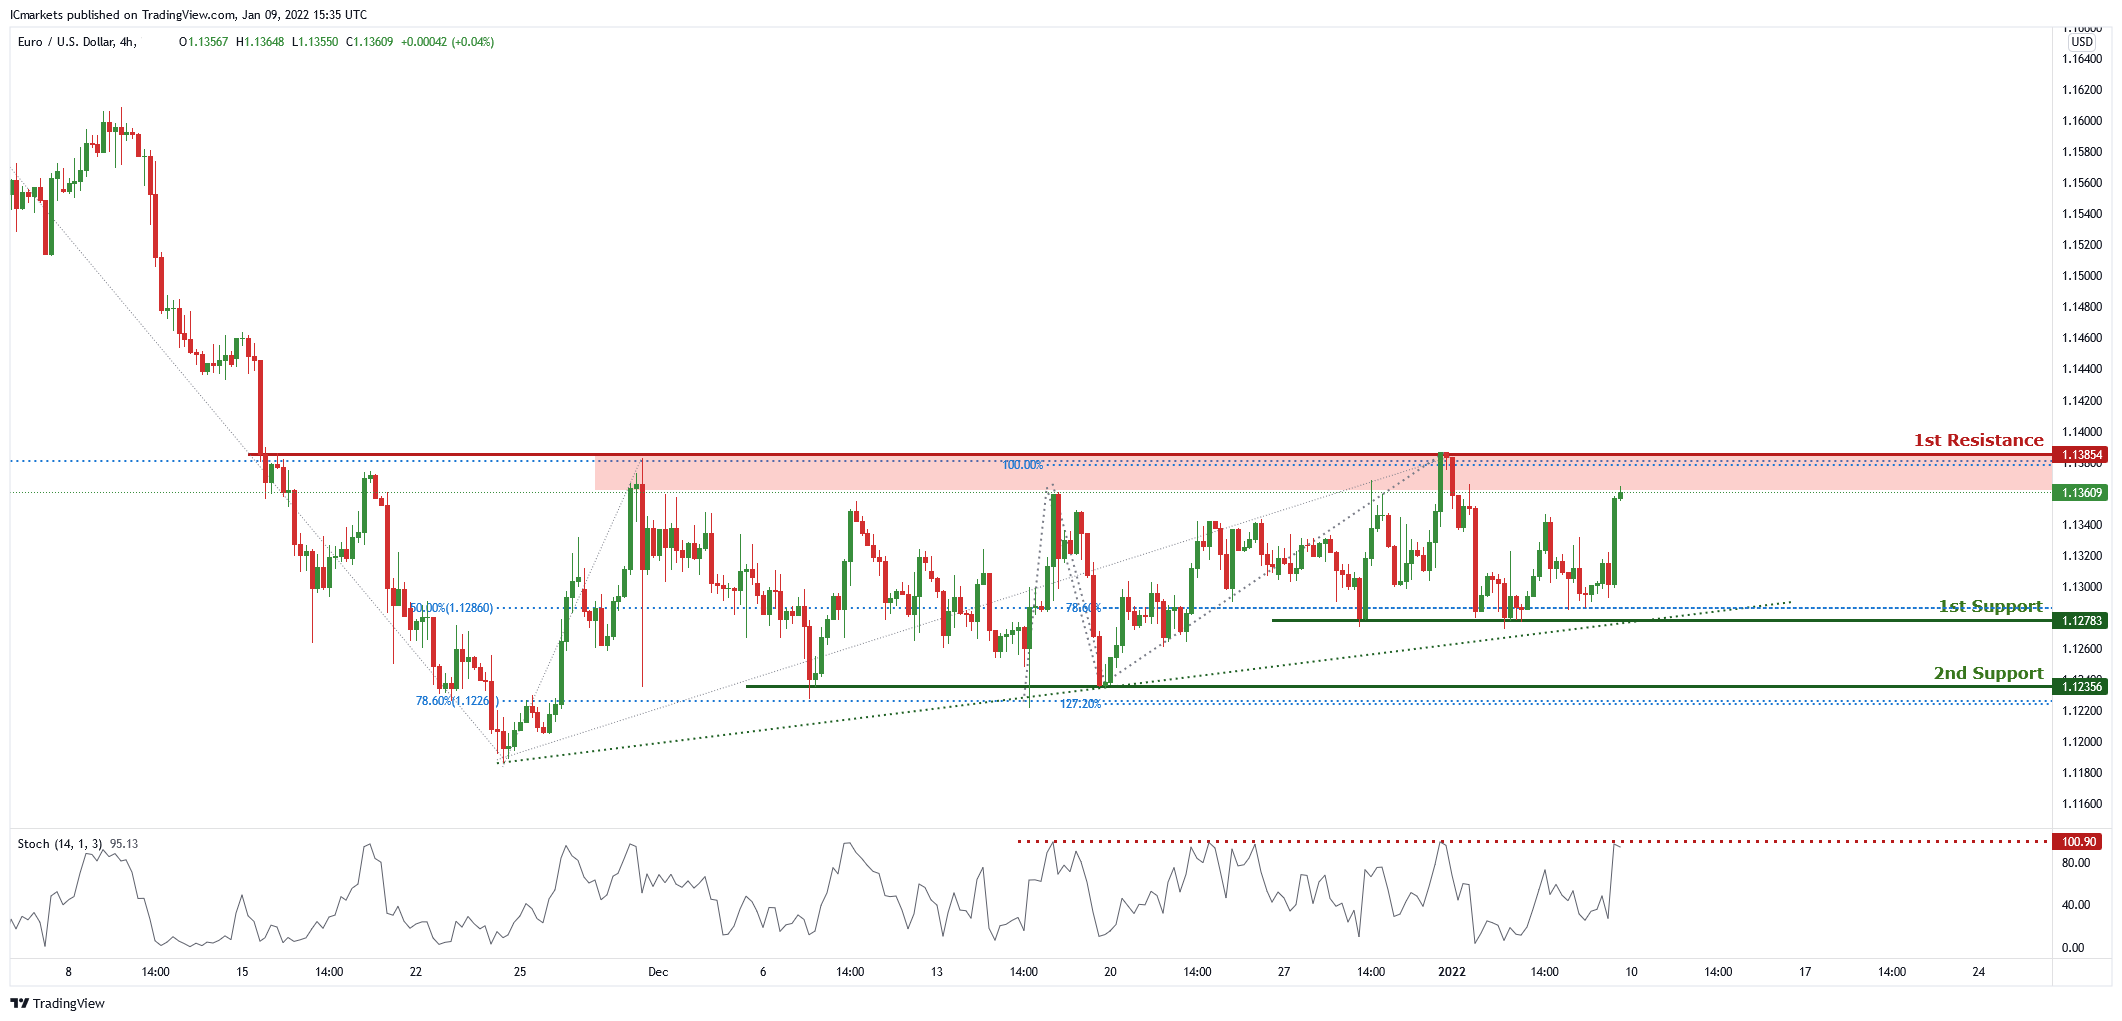
On the H4 chart, price is abiding by an ascending trendline and is near 1st resistance level of 1.13854 which is also 100% Fibonacci projection and 38.2% Fibonacci retracement. Price can potentially dip to the 1st support level of 1.12783 which is also 50% Fibonacci retracement and 78.6% Fibonacci projection. Our bearish bias is supported by the stochastic indicator as it is near resistance level.
Areas of consideration :
H4 1st support at 1.12783
H4 1st resistance at 1.13854
USD/JPY
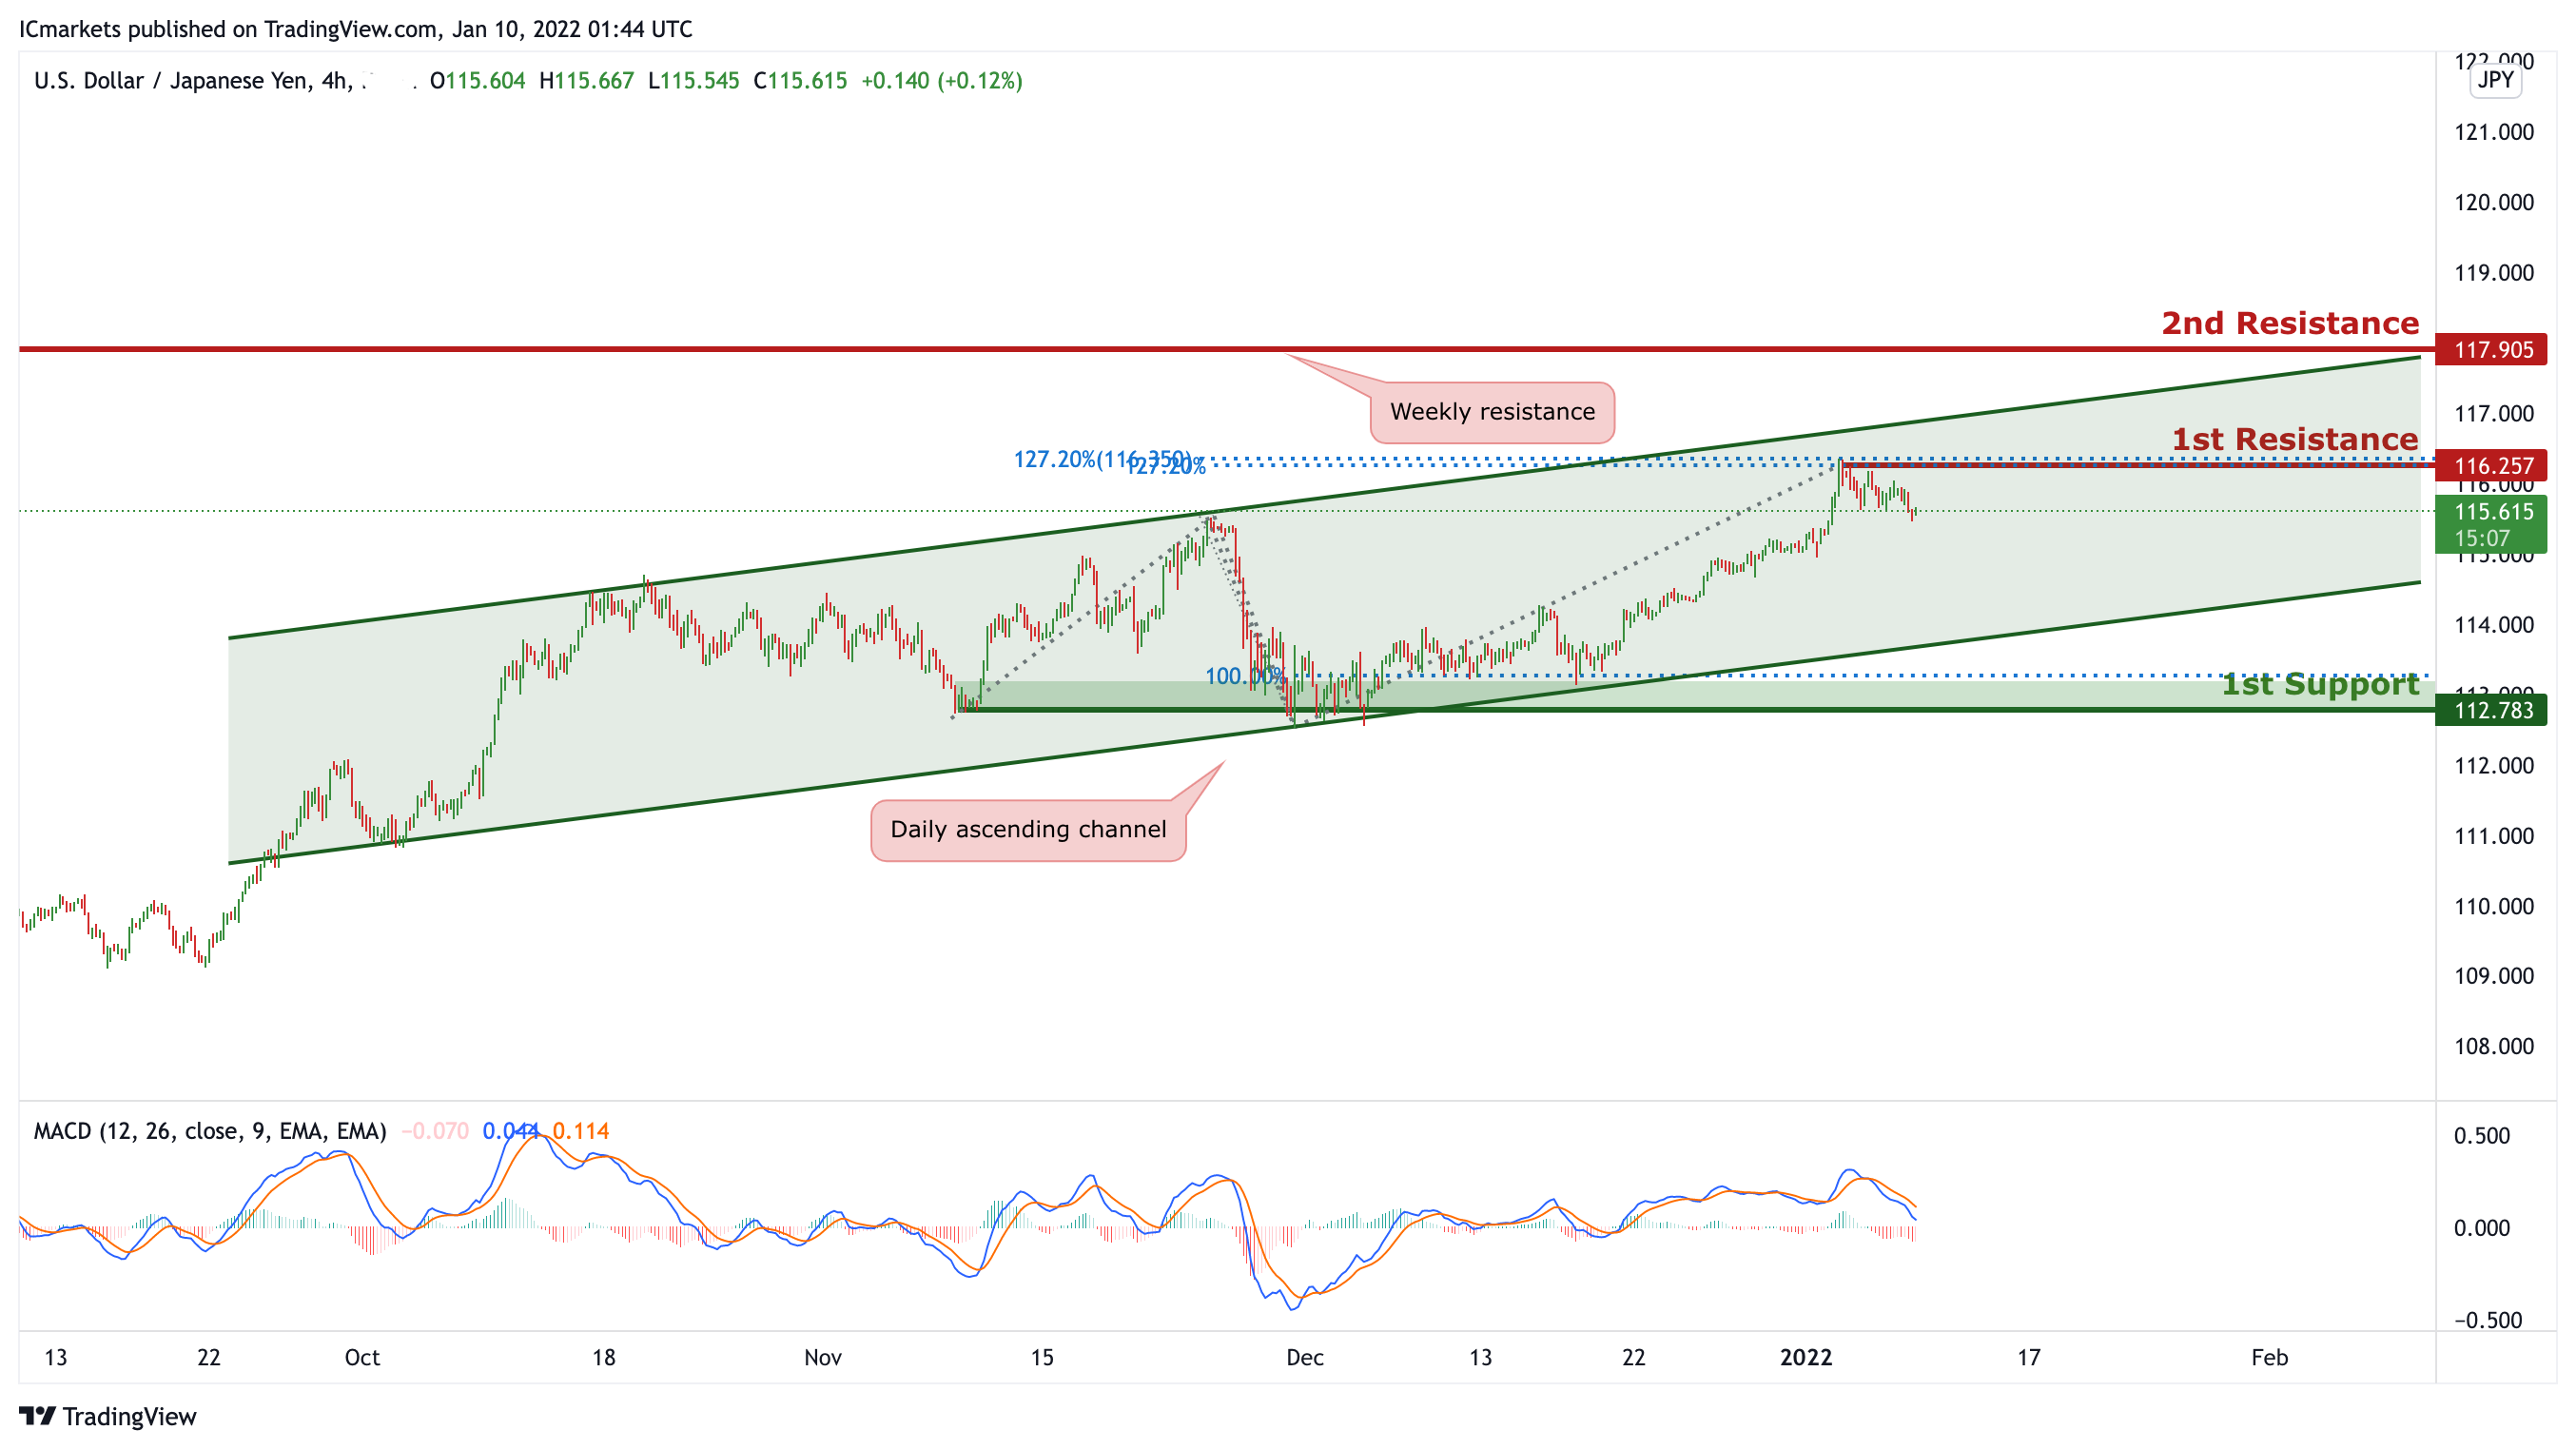
On the H4 timeframe, is abiding to the ascending channel on the daily, signifying an overall bullish momentum. However, we can expect price to make a short-term bearish drop from 1st Resistance in line with 127.2% Fibonacci projection and 127.2% Fibonacci extension towards 1st Support in line with 100% Fibonacci projection. Our short-term bearish bias is further supported by the MACD indicator where the signal line is above the MACD line.
Areas of consideration:
H4 1st resistance level 116.257
H4 1st support level 112.783
AUD/USD:
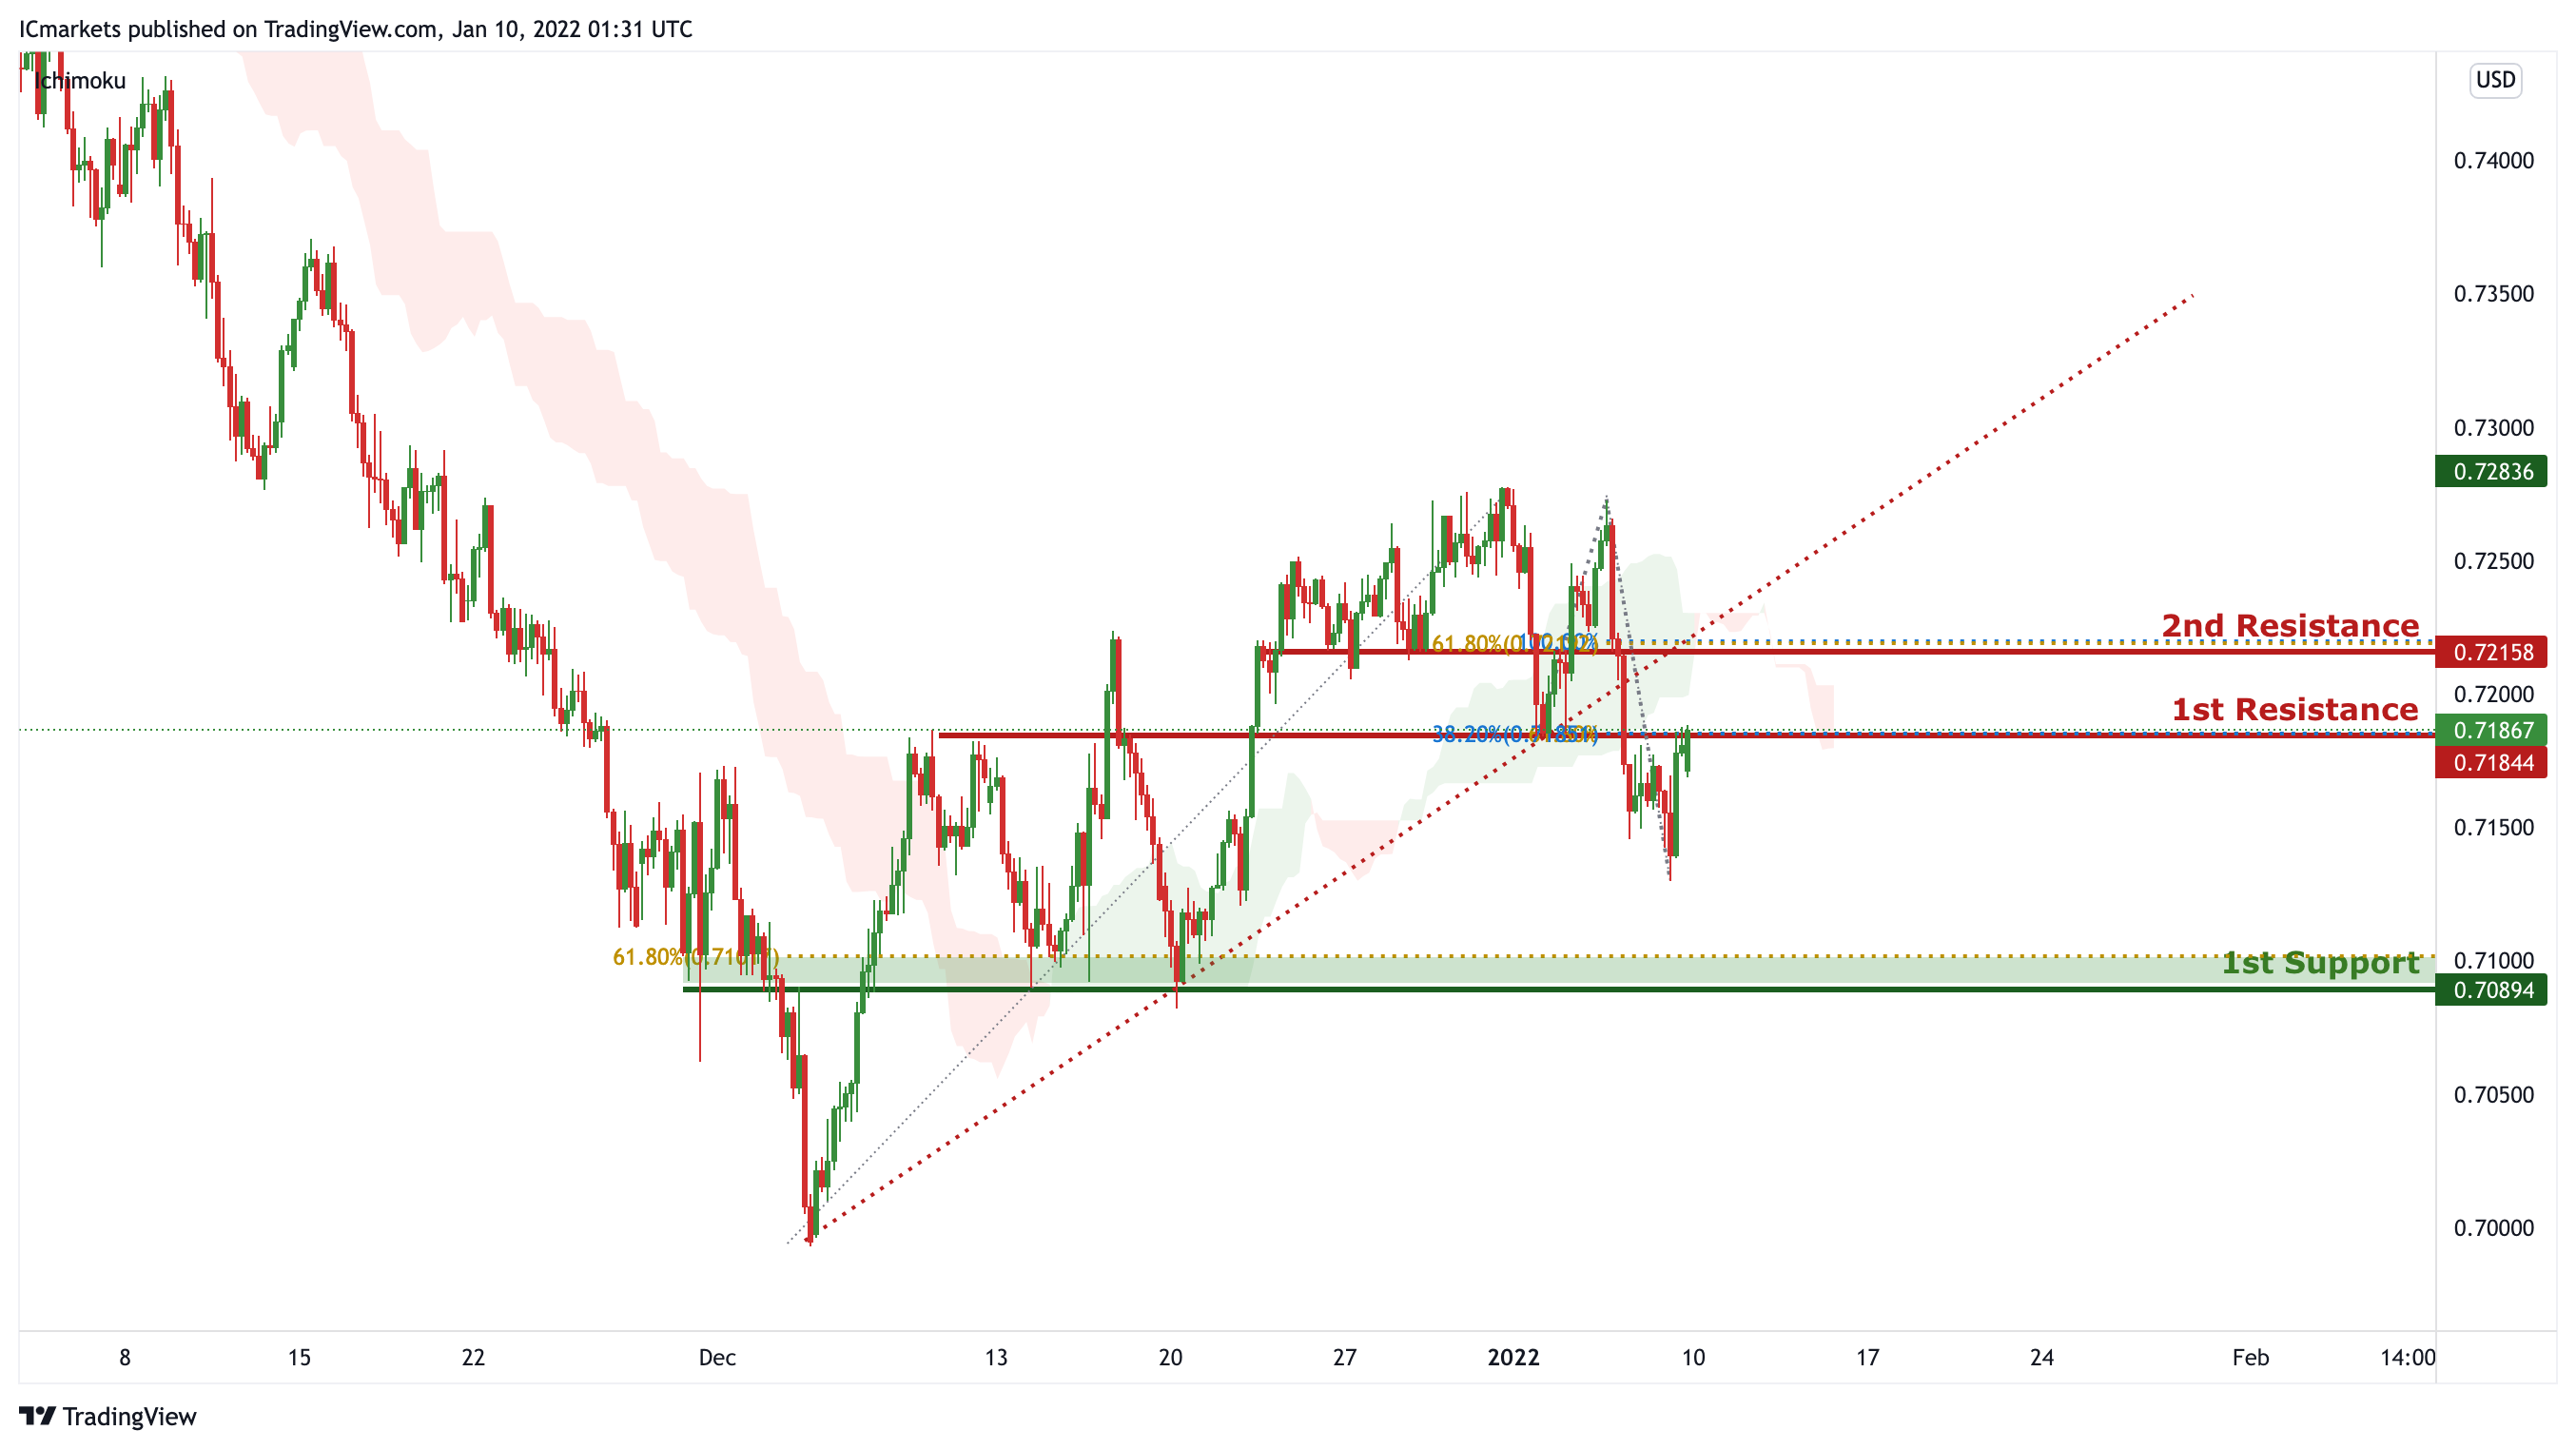
On the H4, orice broke out of the ascending trendline support, signifying a bearish momentum. We can expect price to drop from 1st Resistance in line with 38.2% Fibonacci retracement and 61.8% Fibonacci projection towards 1st Support in line with 61.8% Fibonacci retracement. Our bearish bias is further supported by the price holding below the Ichimoku cloud.
Areas of consideration:
H4 1st Support level 0.70894
H4 1st resistance level 0.71844
NZD/USD:
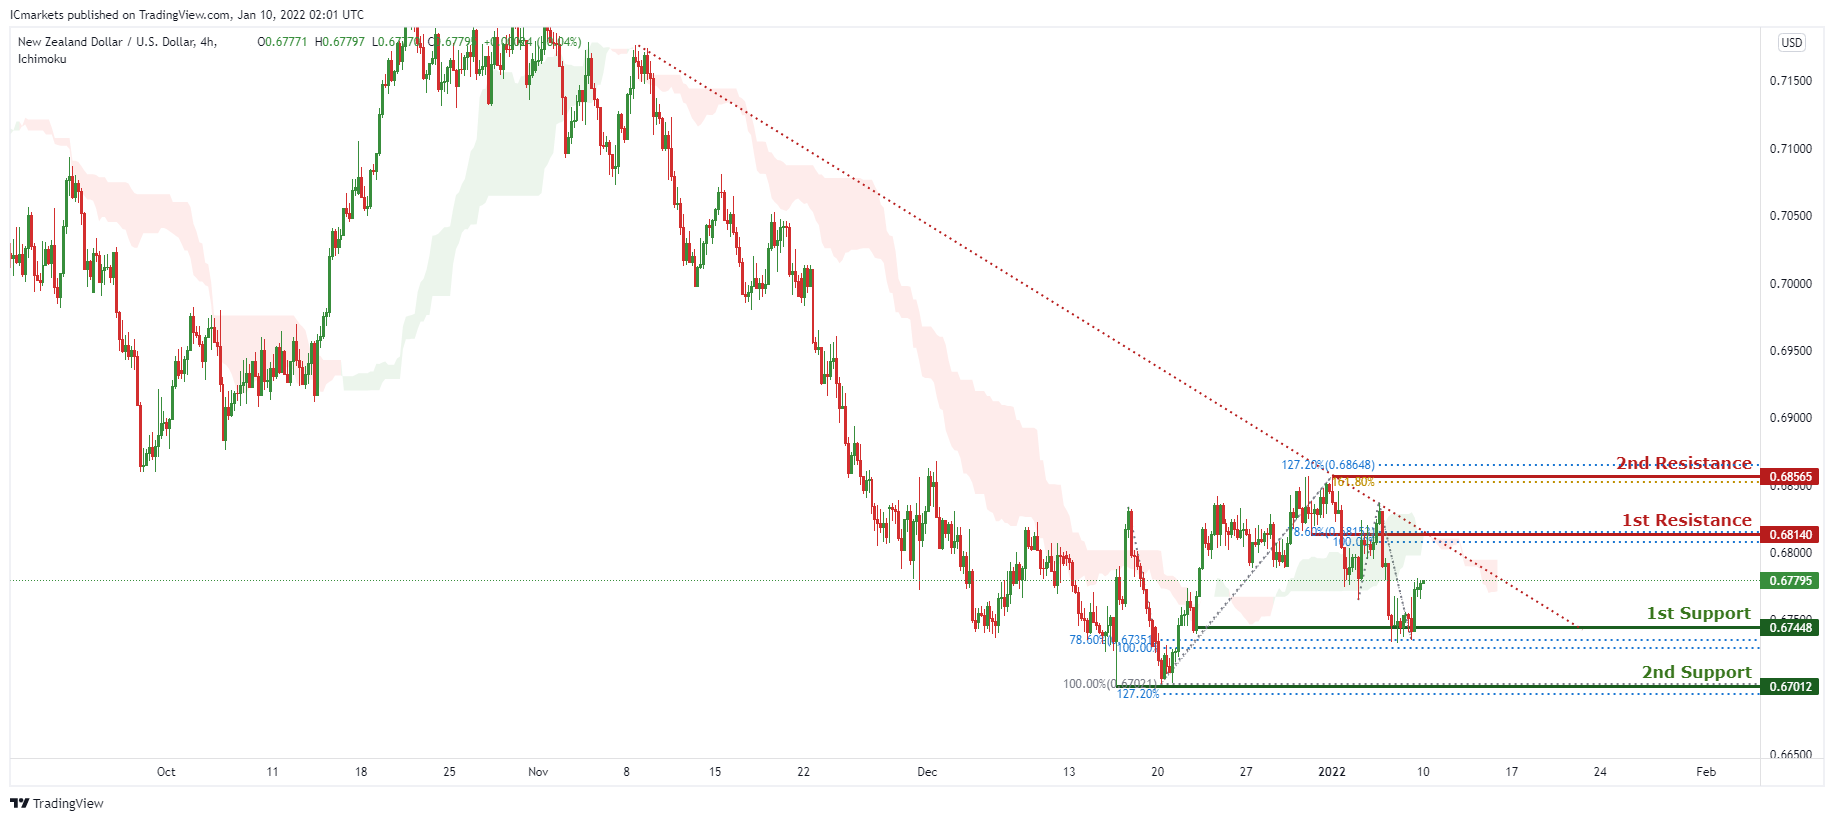
On the H4 timeframe, prices are on bearish momentum and abiding to our bearish trendline. We see potential for prices to bounce from our 1st resistance at 0.68140 in line with 100% Fibonacci extension and 78.6% Fibonacci retracement towards our 1st support at 0.67448 in line with 78.6% Fibonacci retracements and 100% Fibonacci extension. Our bias is further supported by ichimoku clouds forecasting the dip. If prices break our 1st support, prices can potentially dip towards our 2nd support at 0.67012 in line with 127.2% Fibonacci extensions and 100% Fibonacci retracement.
Areas of consideration:
H4 time frame, 1st resistance at 0.68140
H4 time frame, 1st support at 0.6744
USD/CAD:
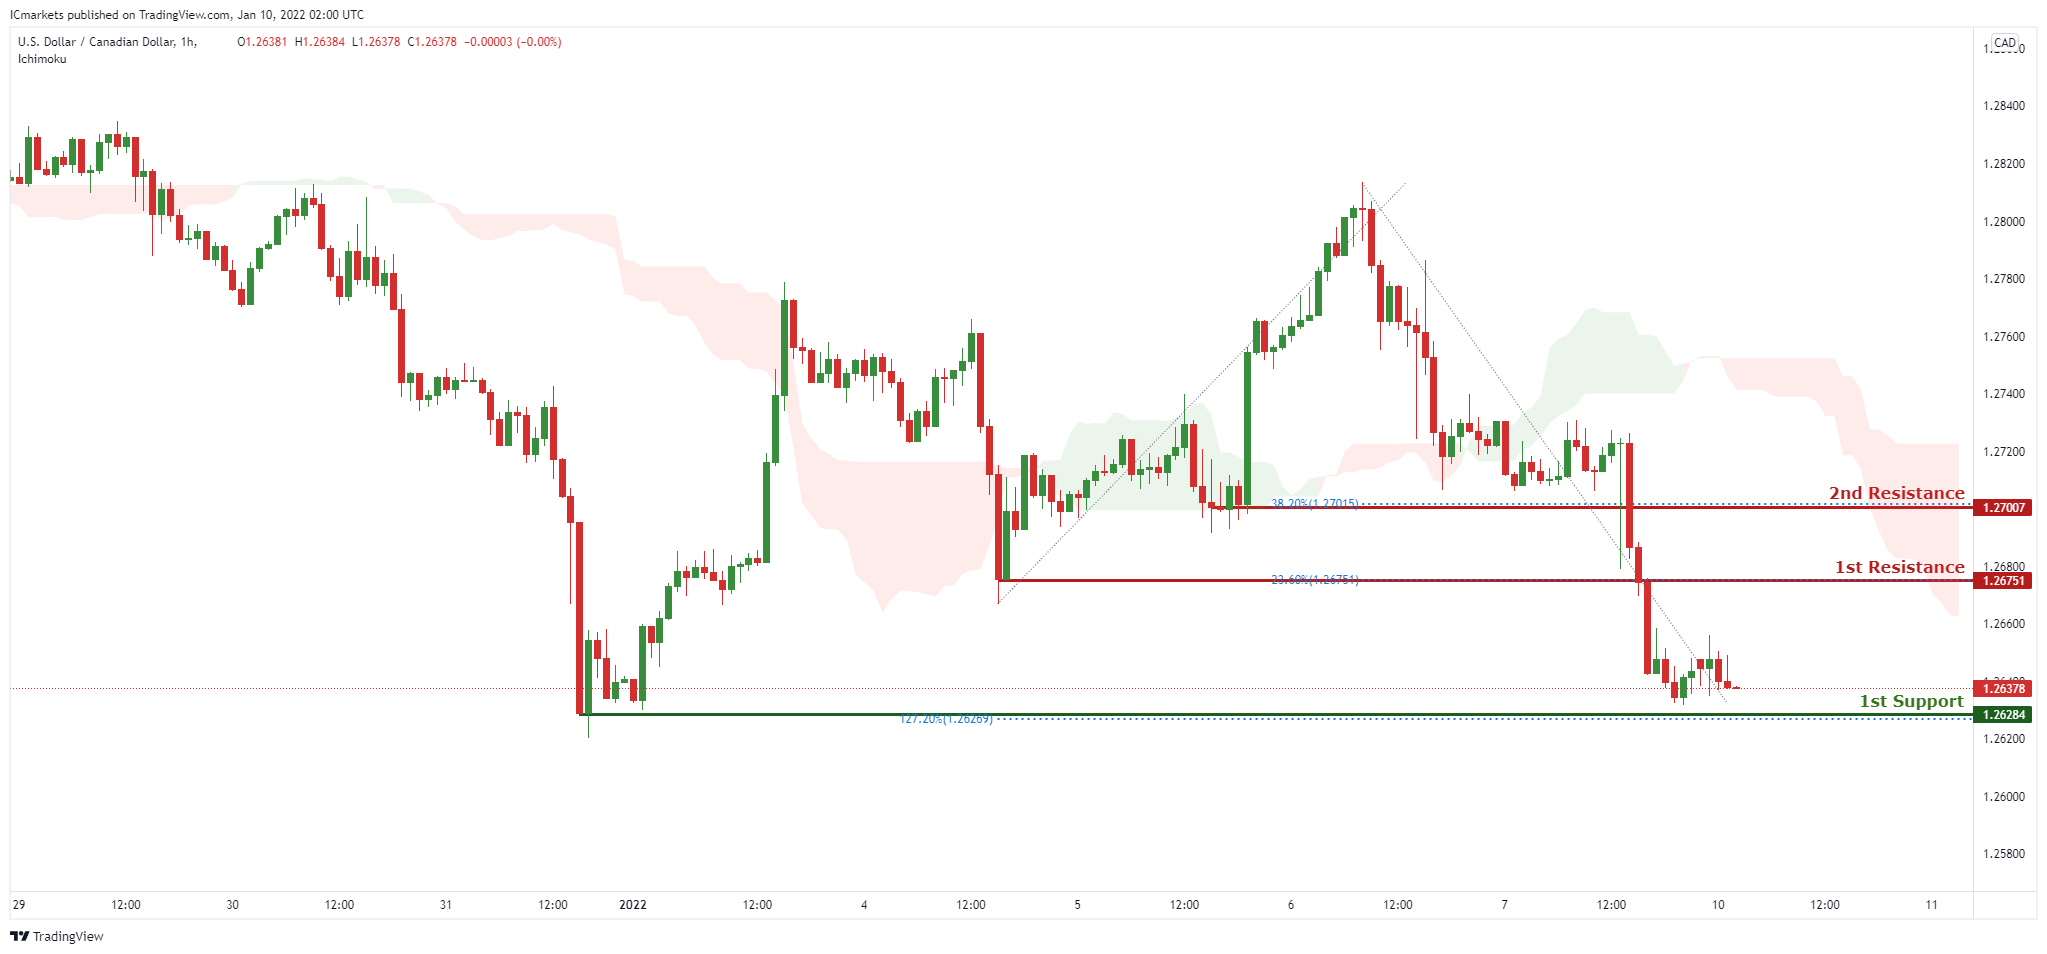
On the H1, with price moving below the ichimoku cloud, we have a bearish bias that price will drop from our 1st resistance at 1.26751 which is in line with horizontal overlap resistance and 23.6% Fibonacci retracement to 1st support at 1.26284, which is in line with horizontal swing low support and 127.2% fibonacci extension. Alternatively, price may break 1st resistance structure and head for 2nd resistance at 1.27007, which coincides with horizontal overlap resistance and 38.2% Fibonacci retracement.
Areas of consideration:
H4 time frame, 1st support at 1.26284
H4 time frame, 1st resistance at 1.26751
OIL:
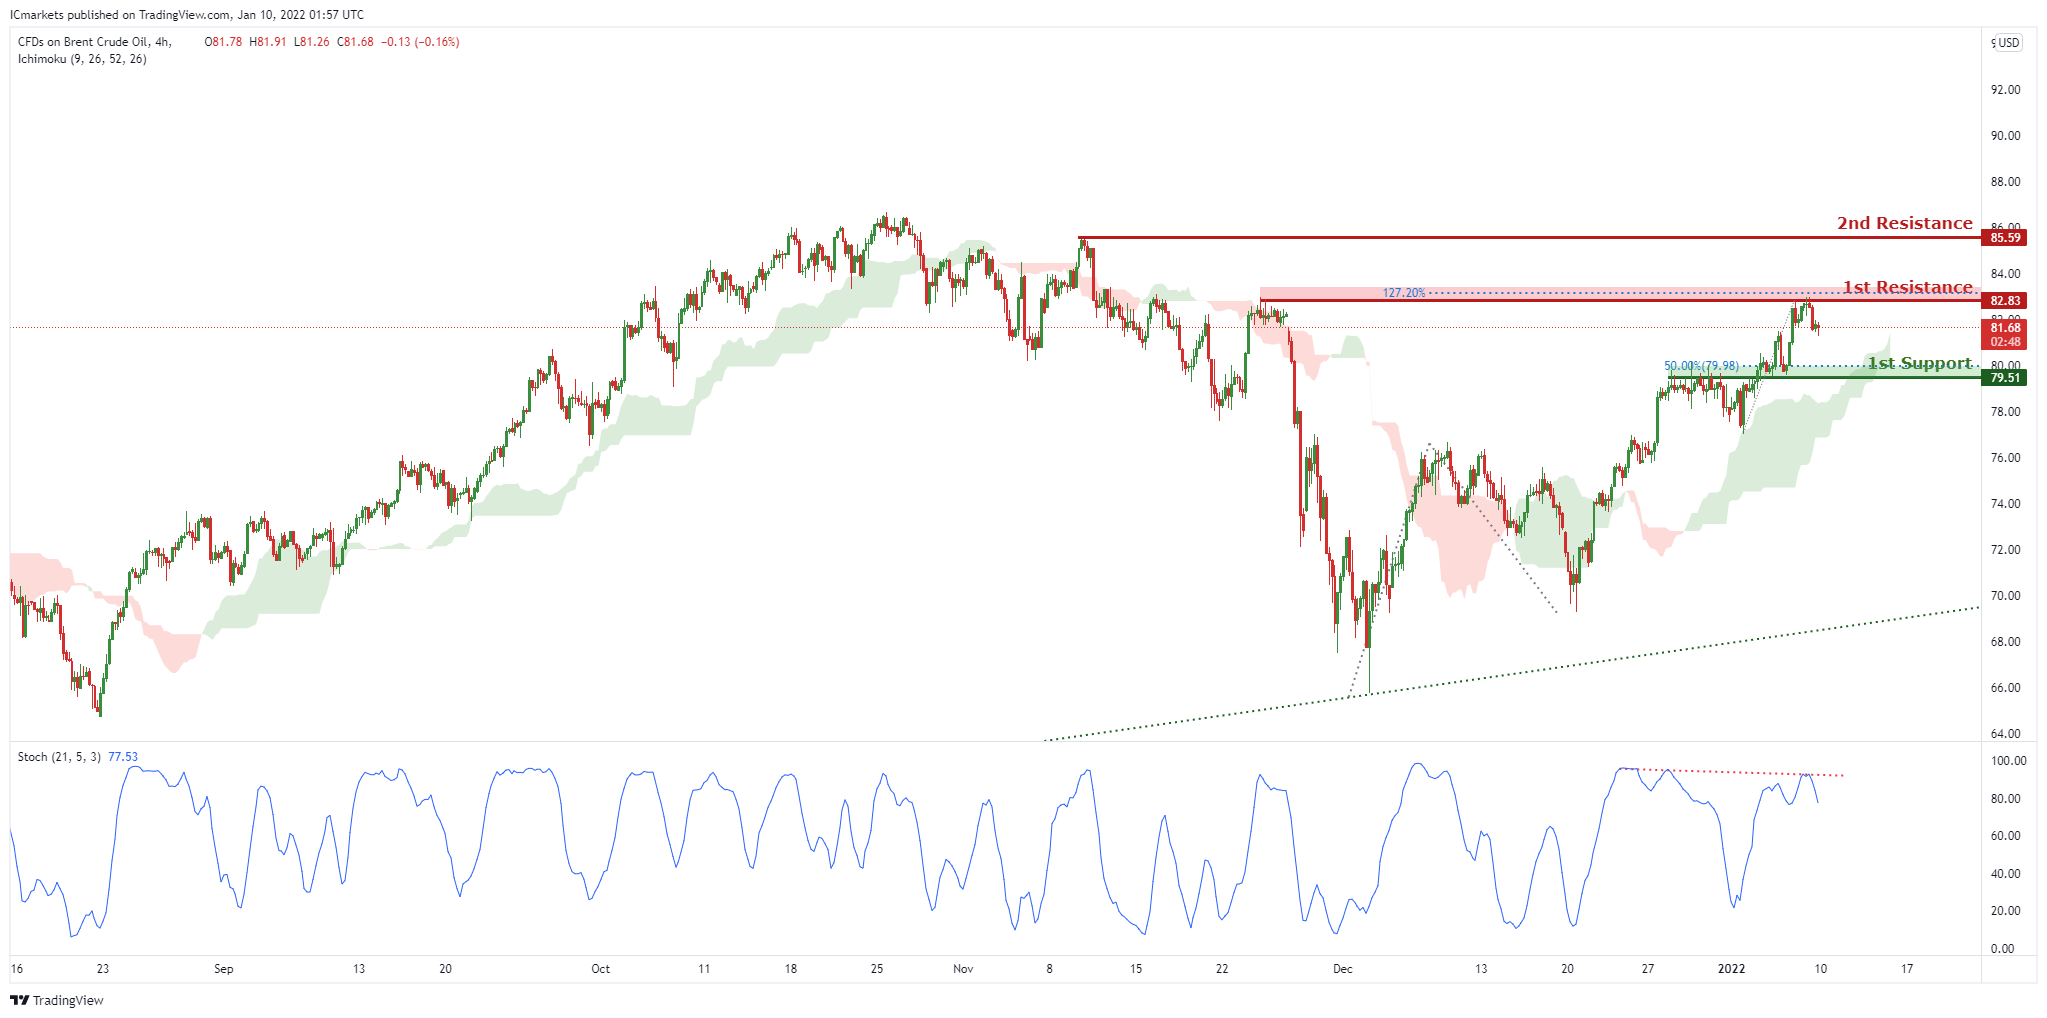
On the H4, with price at the resistance of stochastics, we have a bearish bias that price will drop from our 1st resistance at 82.83 which is in line with horizontal swing high resistance and 127.2% Fibonacci extension to 1st support at 79.51, which is in line with horizontal swing overlap support and 50% fibonacci retracement. This is also where the support of the ichimoku cloud is. Alternatively, price may break 1st resistance structure and head for 2nd resistance at 85.59, which coincides with horizontal swing high resistance.
Areas of consideration:
H4 time frame, 1st resistance of 82.83
H4 time frame, 1st support of 79.51
Dow Jones Industrial Average:
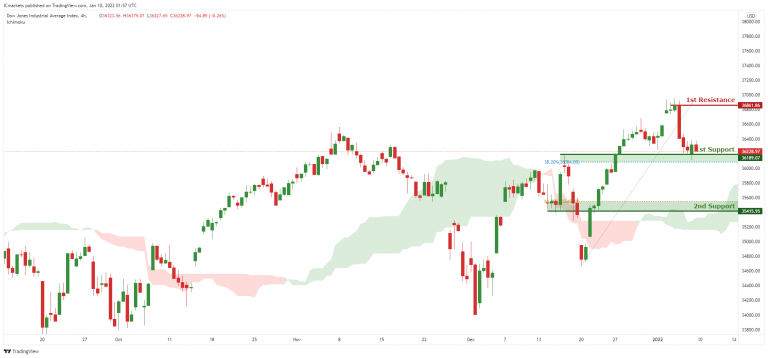
On the H4, with price moving above the ichimoku cloud, we have a bullish bias that price will rise to our 1st resistance at 36861 which is in line with horizontal swing high resistance from 1st support at 36189, which is in line with horizontal overlap support and 32.8% Fibonacci retracement level. Alternatively, price may break 1st support structure and head for 2nd support at 35415, which coincides with horizontal overlap support and 61.8% Fibonacci retracement level .
Area of consideration:
4H resistance at 36861
4H support at 36189
EUR/USD Aims Key Upside Break Above 1.1400
Key Highlights
- EUR/USD seems to be eyeing an upside break above the 1.1380 resistance.
- A key bullish trend line is forming with support near 1.1315 on the 4-hours chart.
- GBP/USD extended increase above the 1.3550 resistance zone.
- Gold price is struggling to stay above the $1,800 zone.
EUR/USD Technical Analysis
This past week, the Euro tried to clear the 1.1380 resistance zone against the US Dollar. However, EUR/USD failed and corrected lower below 1.1350.
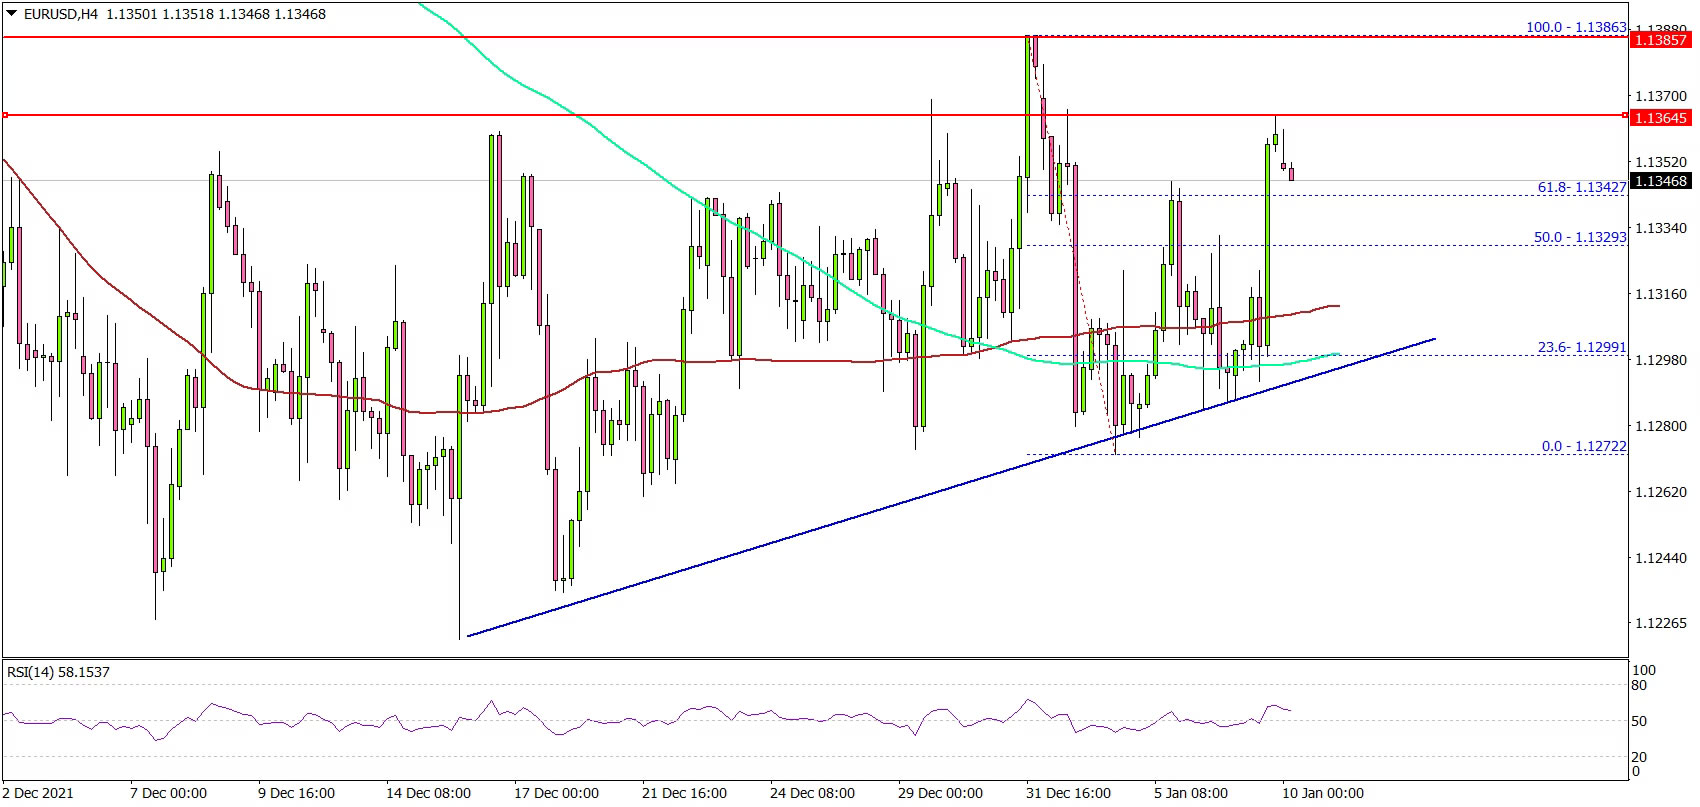
Looking at the 4-hours chart, the pair remained well bid above the 1.1250, the 100 simple moving average (red, 4-hours) and the 200 simple moving average (green, 4-hours).
The pair started a fresh increase above the 1.1300 level. There is also a key bullish trend line forming with support near 1.1315 on the same chart. On the upside, the pair is facing resistance near 1.1380 level.
The next major resistance is near the 1.1400 level. A close above 1.1400 could open the doors for a steady increase. If there is a fresh decline, the bulls might defend the trend line at 1.1315.
The next major support is near the 1.1300 level. Any more losses might send the pair towards the 1.1280 level. A downside break below 1.1280 could lead the pair towards the 1.1250 level.
Looking at GBP/USD, the pair gained pace for a move above the 1.3550 level. If the bulls remain in action, the pair could rise above 1.3620.
Economic Releases
- Euro Zone Sentix Investor Confidence for Jan 2022 - Forecast 12.0, versus 13.5 previous.
- Euro Zone Unemployment Rate for Nov 2021 - Forecast 7.2%, versus 7.3% previous.