Sample Category Title
Intraday Market Analysis: US Dollar Index Struggles for Support
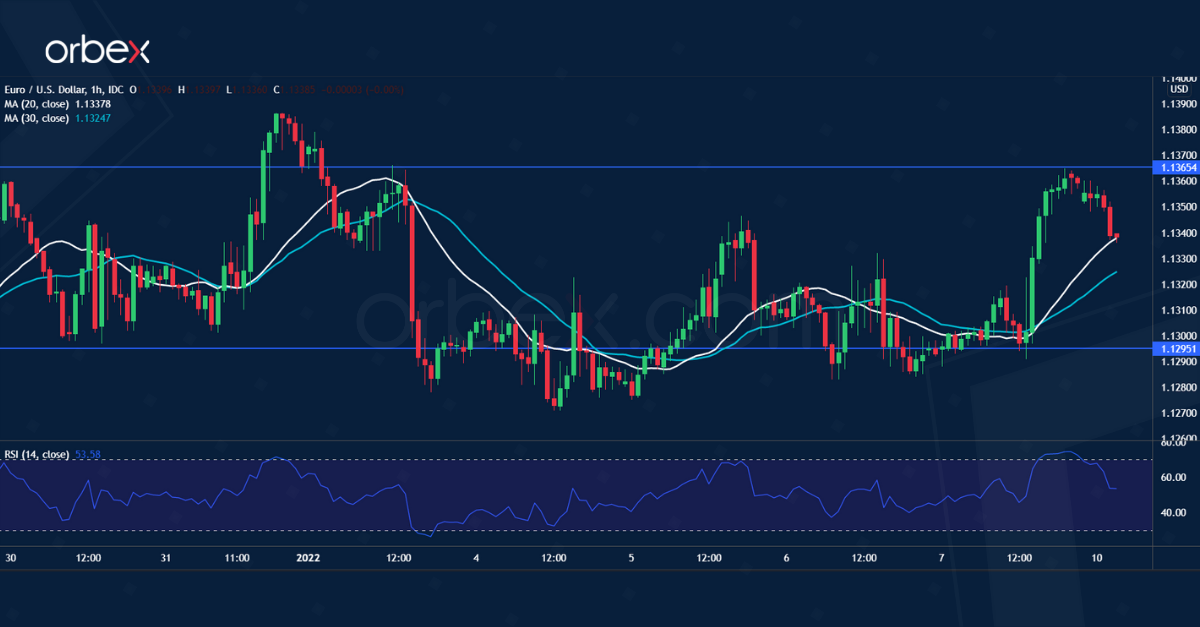
EUR/USD tests key resistance
The US dollar retreated after December’s Nonfarm Payrolls came in far below expectations. The pair has been in a narrowing range between 1.1270 and 1.1365.
The previous fall below 1.1280 added pressure on the buy side, though it turned out to be an opportunity for the bulls to accumulate at a bargain.
A break above the resistance could end the sideways action and trigger a runaway rally towards 1.1460. The RSI surged into the overbought area and may cause a brief pullback above 1.1295.
USD/CAD tests daily support
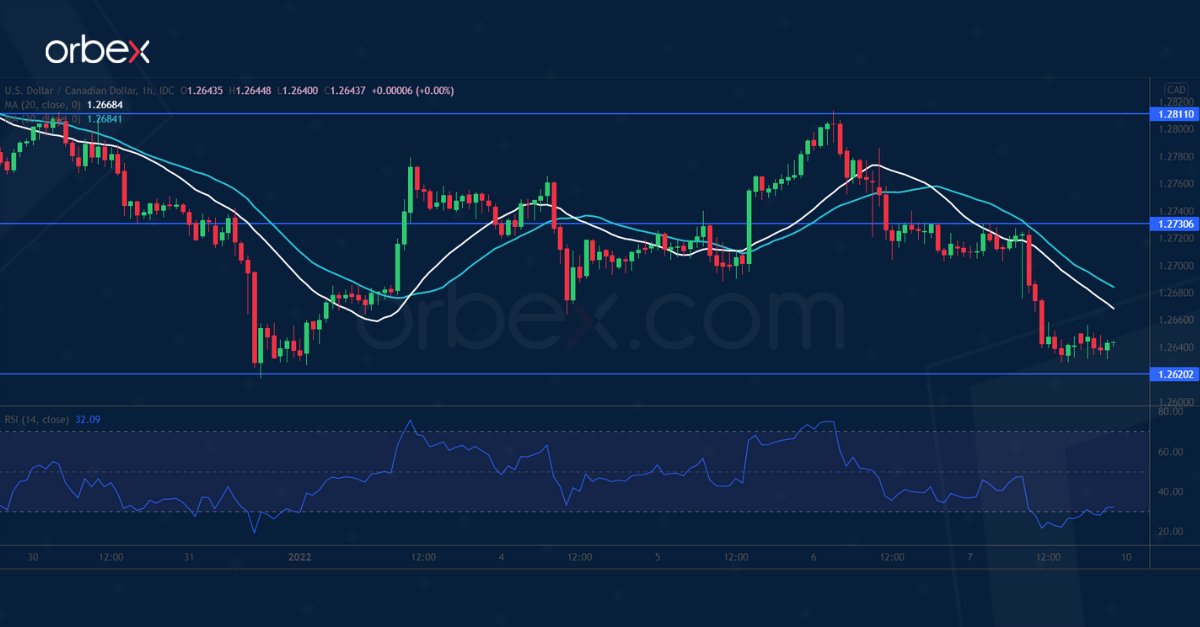
The loonie rallied after Canada added twice as many jobs as expected in December. The year-end sell-off met strong bids near the daily support at 1.2620.
But the rebound came to halt at the supply zone around 1.2810, which used to support from the previous consolidation. The RSI’s double top in the overbought zone has restrained the upward momentum.
1.2730 is a fresh resistance as price action is about to retest the critical level at 1.2620. A bearish breakout could trigger a plunge to 1.2540.
GER 40 seeks support
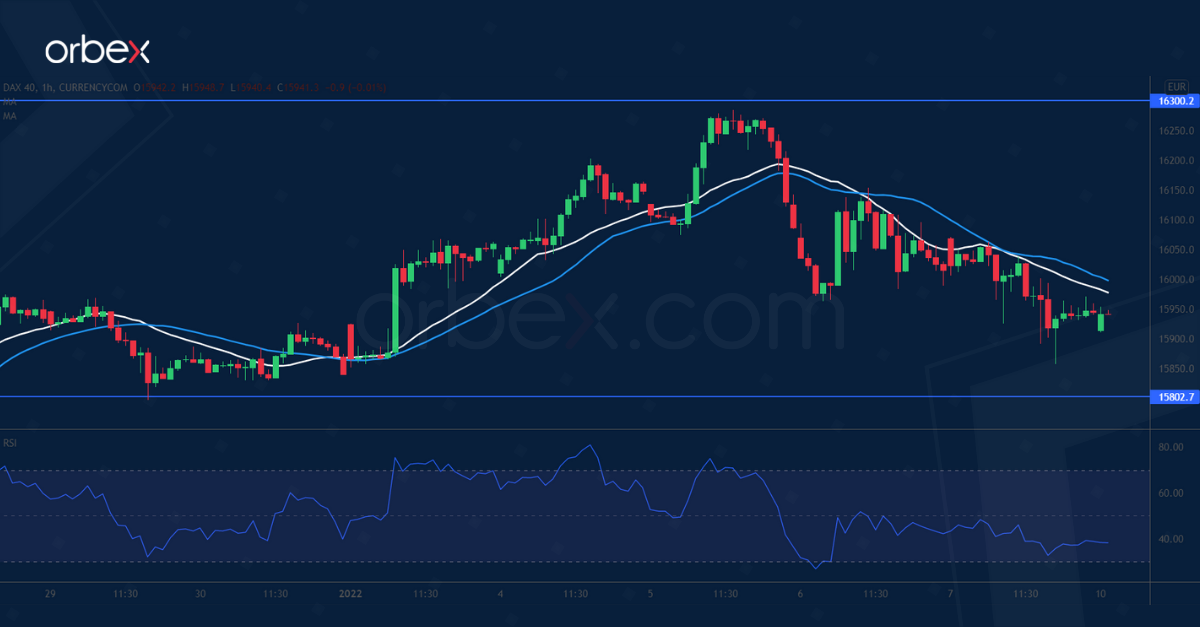
The Dax 40 edged lower as rising CPI in the eurozone argues in favor of tightening. The index saw stiff selling pressure right under the all-time high at 16300.
A bearish RSI divergence in this major supply area indicates a lack of commitment from the bulls as buying slows down. A combination of profit-taking and fresh selling has led to a drop below 16100, a warning sign for a steeper correction.
15800 is the next key support. A breakout could send the index to 15500 at the base of the latest rally.
Eurozone Sentix rose to 14.9 in Jan, fundamentally constructive outlook with an Achilles’ heel
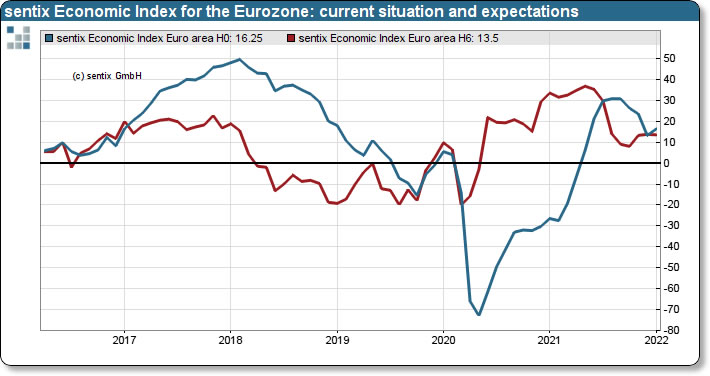
Eurozone Sentix Investor Confidence rose from 13.5 to 14.9 in January, above expectation of 12.0. Current Situation Index rose from 13.3 to 16.3. Expectations Index dropped slightly from 13.8 to 13.5.
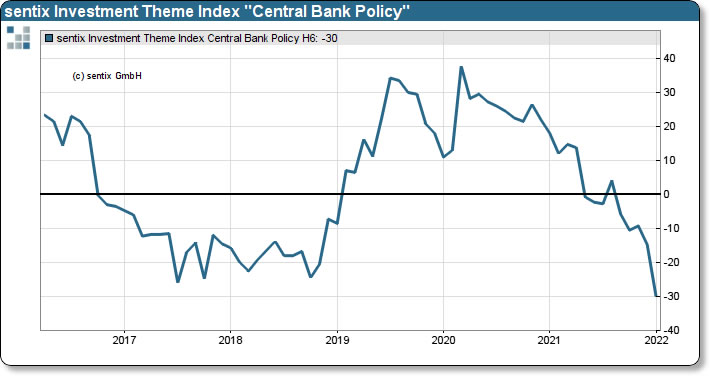
Sentix said, "our fundamentally constructive outlook for the economy in 2022 (especially the first half of the year) has an Achilles' heel: The support of expansive central banks is threatening to run out faster than expected.
"The sentix topic barometer 'Central Bank Policy' indicates an increasing burden for the bond market and thus for the real economy. The burden on this is estimated to be greater than in 2018, when the monetary guardians also adopted a more restrictive course.
"Fiscal balancing impulses must therefore be put in place swiftly to cushion the weakening monetary impetus from the central banks."
Gold Slips Back Below 1,800 But Trendless Bias Holds
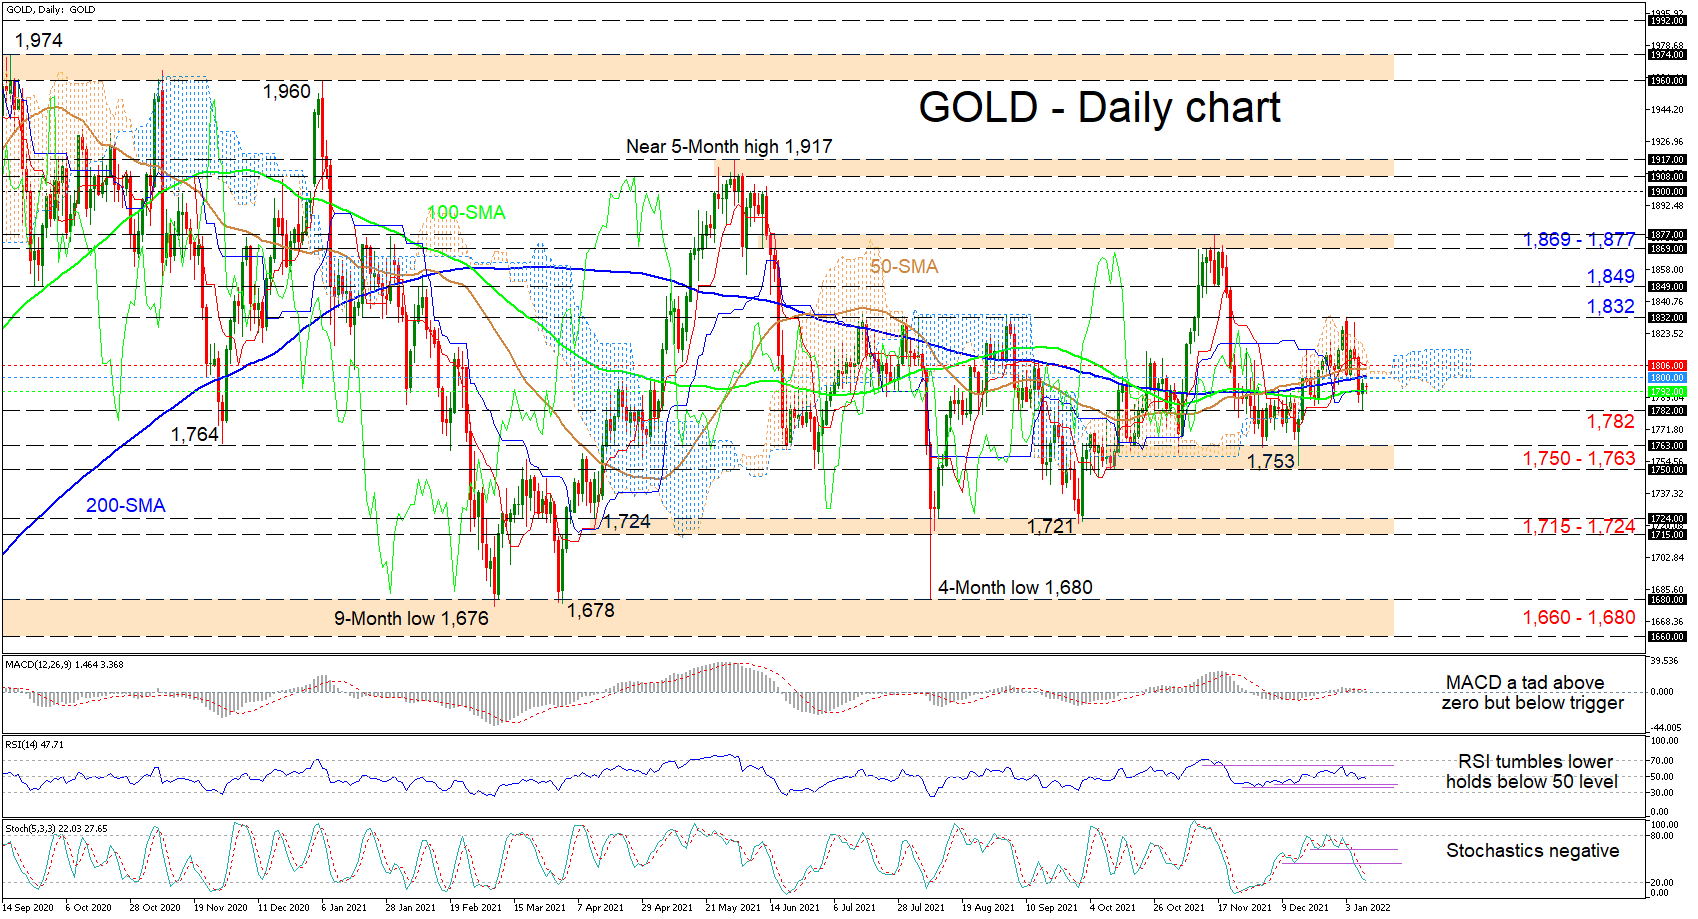
Gold’s downside forces have paused a tad beneath the 1,800 mark with the price resting on the 100-period simple moving average (SMA). A more neutral trajectory is being endorsed by the lack of trend in the SMAs.
The Ichimoku lines are not indicating a clear price direction especially after the price gains from the 1,753 trough, which have been relatively offset by the pullback in the commodity off the 1,832 recent high. The short-term oscillators are tilting a tad to the downside, but directional momentum remains weak. The MACD and the red trigger line have flatlined marginally above the zero threshold, while the RSI is pointing lower, slightly beneath the 50 level. The negatively charged stochastic oscillator is promoting further negative moves in the precious metal.
Maintaining the current price path, downward constraints could commence from the 100-day SMA at 1,792 ahead of the 1,782 nearby obstacle. Sliding lower, the bears may then confront the 1,750-1,763 support zone, which has taken shape from November 2021. If selling interest intensifies, the 1,715-1,724 support band could come under fire, while any further price impetus south may turn traders’ attention towards the key 1,660-1,680 barricade, which has defended the broader positive structure from June 2020.
On the other hand, an immediate fortified resistance section from the cloud’s lower band at 1,800 until the red Tenkan-sen line at 1,806 may impede buyers from reaching the 1,832 high. However, if the price successfully overcomes the 1,832 barrier, the bulls may jump towards the 1,849 obstacle before aiming for the 1,869-1,877 resistance border.
Summarizing, gold is oscillating around the 1,800 mark remaining confined between the 1,676 and 1,917 limits of a ten-month trading range.
Inflation and Rising Yields to Guide Investors
Stock investors across the globe are eagerly awaiting the next US inflation report due on Wednesday. Rising bond yields and earlier anticipation of stimulus withdrawal dragged US equities lower last week with the S&P 500 posting its worst start to a year since 2016. Tech stocks were dumped as US 10-year yields climbed 29 basis points in five trading days to reach 1.8% on Friday. Meanwhile, cyclical stocks were the primary beneficiary from rising rates, with the financial sector up more than 5%.
Investors have got used to low bond yields for years, so it's natural to see risk assets, especially those overvalued ones, being hit when rates suddenly climb higher. If US 10-year yields surge by a similar magnitude over the next few days, expect the selloff to worsen as most investors rush for the exit door.
Friday's US non-farm payroll headline number was disappointing. The 199,000 jobs added in December were significantly short of the market's estimate of 450,000, but that won't change the interest rate outlook. The unemployment rate dropped to 3.9%, fast approaching the five-decade low of 3.5%. The decline in unemployment came despite the labor force participation rate holding steady at 61.9%. But it's wages that should be of great concern. Average hourly earnings climbed 0.6% in December and were up 4.7% compared to a year ago. It's good to be paid more when prices increase, but higher wages also suggest that further inflationary pressures need to be controlled sooner rather than later.
The Omicron variant is probably less severe than previous ones, but it could still disrupt supply chains and this has been a significant factor in rising inflation. While these disruptions will eventually ease, prices will take longer to adjust, mainly due to economic behaviour. The longer prices remain elevated, the stickier they become.
Markets are anticipating another 40-year high for US CPI when the figure is released on Wednesday. Consumer prices are expected to have increased 0.4% in December compared to the previous month and 7.1% year-on-year. Another surprise to the upside will possibly put more pressure on bonds, sending yields higher.
Speeches from several Fed speakers this week will also be scrutinised closely for further clues on policy tightening, with Fed Chair Jerome Powell's hearing tomorrow under the spotlight.
A correction of 10% or more in stocks from the peak may occur anytime soon but given there's still a lot of cash on the sidelines and earnings are likely to remain robust, these factors will continue to lead equities higher in the medium term. However, investors need to be prepared for higher volatility ahead.ame.
EURUSD Indecisive but Some Patience Could be Exercised
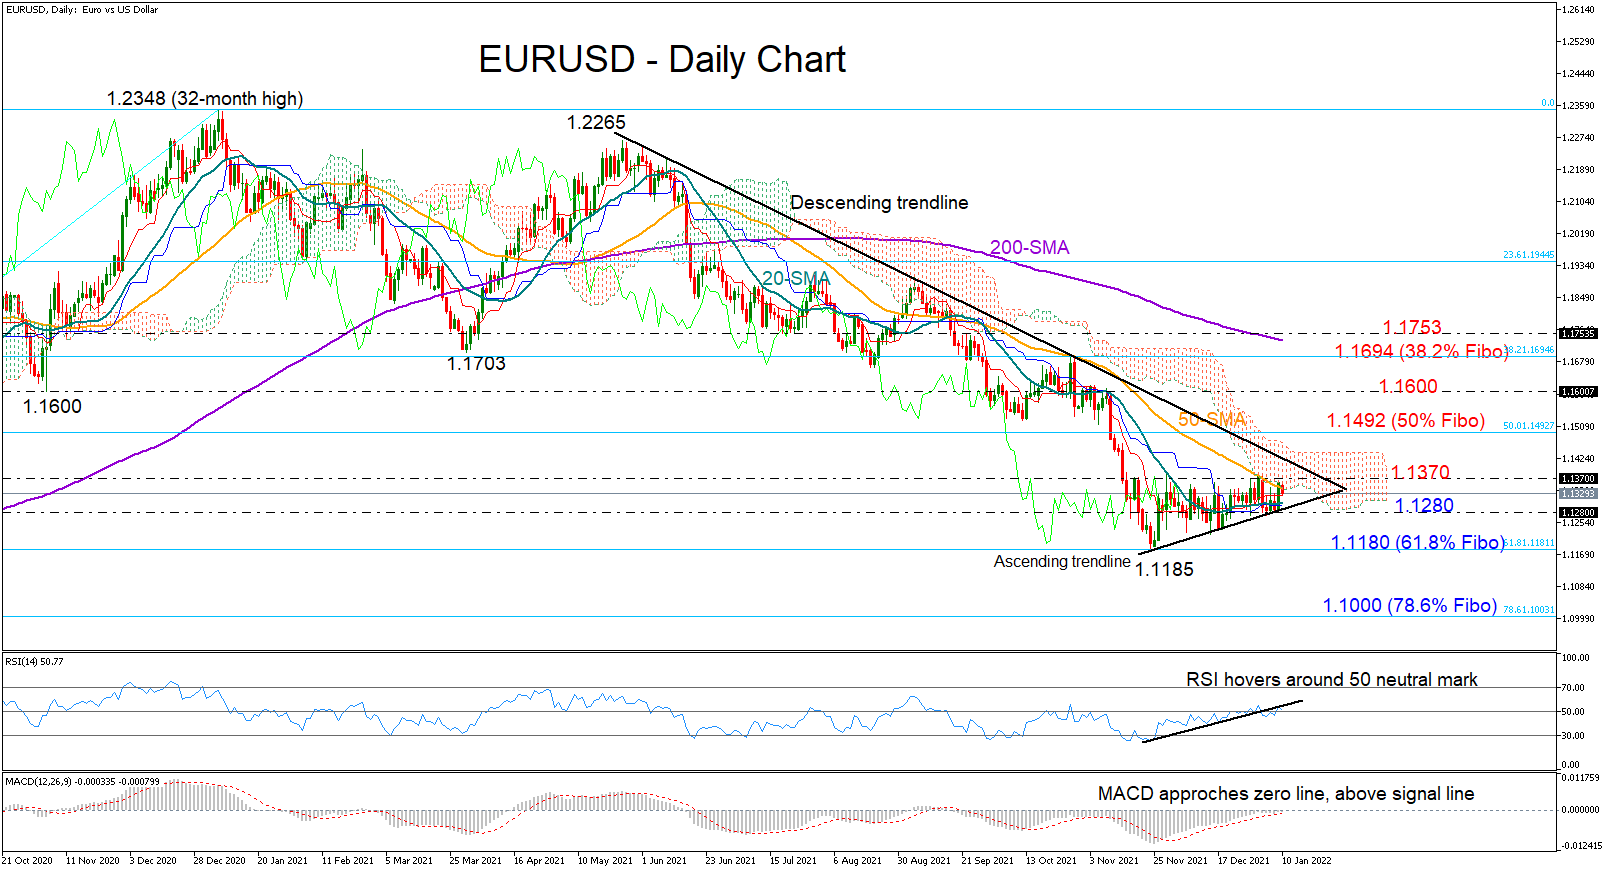
EURUSD resumed its negative momentum during Monday's early European trading hours after barely closing above the restrictive 50-day simple moving average (SMA) on Friday at 1.1359.
As long as the ascending trendline is building the soft upward trajectory in the short-term picture, the focus will remain on the upside. That said, the momentum indicators have not clarified strong bullish signals yet, suggesting that traders could keep behaving carefully for a bit longer. Particularly, the RSI continues to fluctuate around its 50 neutral mark, recently hitting a wall around the support-turned-resistance trendline, while the MACD is struggling to enter the positive territory.
A decisive close above the key 1.1370 – 1.1400 zone, which contains the tough descending trendline from the 1.2265 high could be the prerequisite for driving the price straight up to the 50% Fibonacci retracement of the 2020 rally (1.0636 -1.2348) at 1.1492. A steeper increase could examine the 1.1600 psychological level, a break of which would open the door for the 38.2% Fibonacci of 1.1694 and the 200-day SMA at 1.1753.
Alternatively, a step below the short-term supportive trendline at 1.1280 would dash any hopes for improvement, bringing the 1½-year low of 1.1185 back under the spotlight. Failure to bounce back here could activate fresh selling orders, likely sending the price forcefully towards the 78.6% Fibonacci of 1.1000. If downside pressures persist, the next potential pivot point could develop around the 1.0870 barrier, which has been effective during the end of 2019 to mid-2020.
All in all, although EURUSD is still displaying an unclear technical picture at the moment, the strong footing around the supportive trendline may keep buying interest intact during the coming sessions.
US 500 Index Slips after Posting All-Time High; Bias Bearish
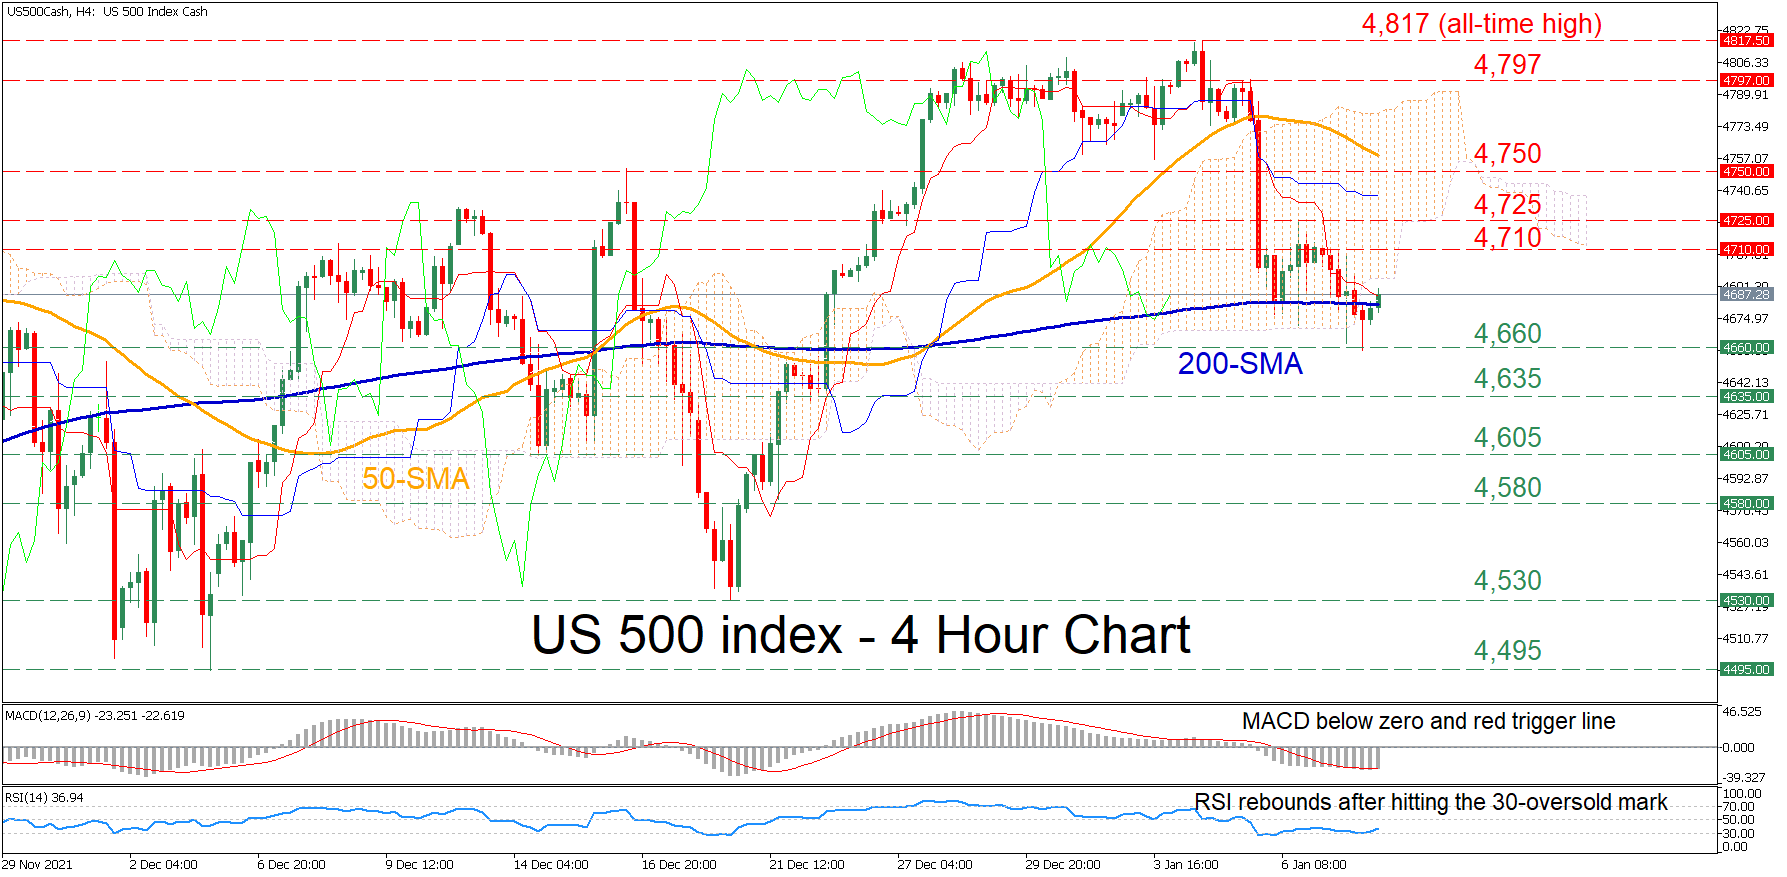
The US 500 stock index (cash) has been plummeting in the four-hour chart since its upside trajectory peaked at the all-time high of 4,817. Moreover, the price crossed beneath both its 50-period simple moving average (SMA) and the Ichimoku cloud, further reinforcing the index’s imminent bearish bias.
The recent pullback is likely to resume as the short-term oscillators indicate that selling forces have taken control. The MACD is found below its red signal line in the negative region, while the RSI is ticking slightly upwards well below its 50-neutral mark.
If the price continues to descend, immediate support might be encountered at the recent low of 4,660. Breaching this barrier, the bears could aim at the 4,635 region before the price dips towards the 4,605 level. Further downside pressure could send the price to test the 4,580 level.
On the flipside, should the dive halt and the price reverses upwards, buyers may meet initial resistance at the recent high of 4,710. Should the bulls conquer this barricade, the spotlight would turn to 4,725 or higher to the 4,750 region. Piercing through these hurdles, the price might charge higher to challenge the 4,797 obstacle.
Overall, the outlook for the US 500 stock index has turned negative in the short term, after the long-term upside move ceased at the record high of 4,817. For that bearish tone to reverse, the price needs to profoundly cross above the 4,797 region.
Daily Technical Analysis
EUR/USD
Current level - 1.1345
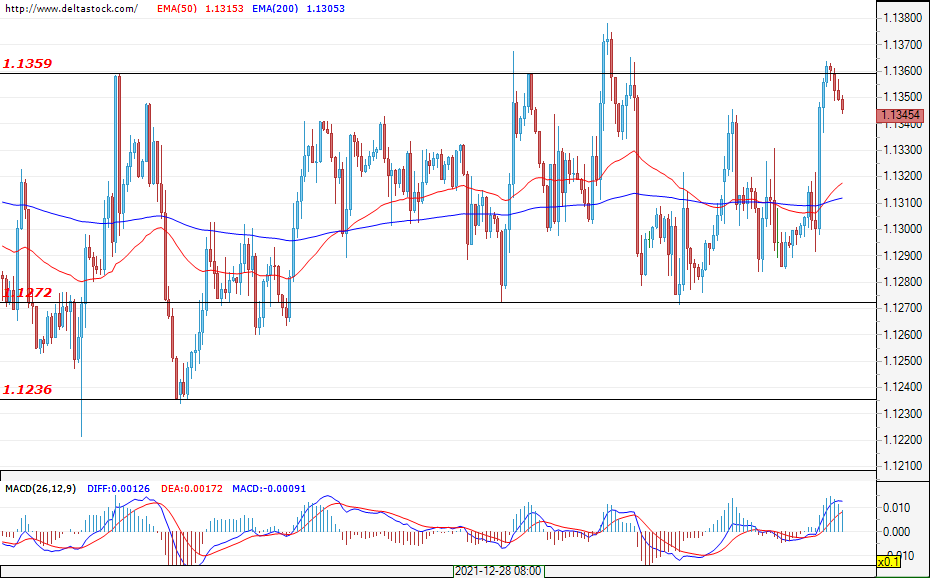
The pair is still in the range-bound movement that began in late November and it seems that neither party is ready to take the initiative. On the higher time frames, the trend is in a decline and this may continue to be the case after the consolidation. Such a prolonged compression implies the accumulation of large trading volumes and a strong directional movement. The current expectations are in favour of the bears, but if the 1.1360 resistance is breached in the short term, it is possible that the EUR/USD could move towards 1.1510. This would attract more liquidity for the bears and create better market entry levels. Their goal will then be to breach the support within the 1.1180-1.1236 zone and continue further down towards 1.1000. The seasonal data supports the movement towards 1.1510, and the macro environment with rising U.S. interest rates suggests a strong dollar that supports bearish scenarios. A change in the trend can be expected if prices remain above 1.1600. In the early hours of today, the bulls are again experiencing difficulties at around 1.1360 and it is possible for the consolidation to continue. The first daily support the bulls can expect at around 1.1320, followed by the more solid one at 1.1272. The market is clearly expecting a catalyst, which might become the inflation data for the United States coming out on Wednesday at 13:30 GMT. Other events that may increase trading activity are the data on unemployment in the euro area (today; 10:00 GMT), as well as the Congress hearing of Jerome Powell on Tuesday at 15:00 GMT.
USD/JPY
Current level - 115.74
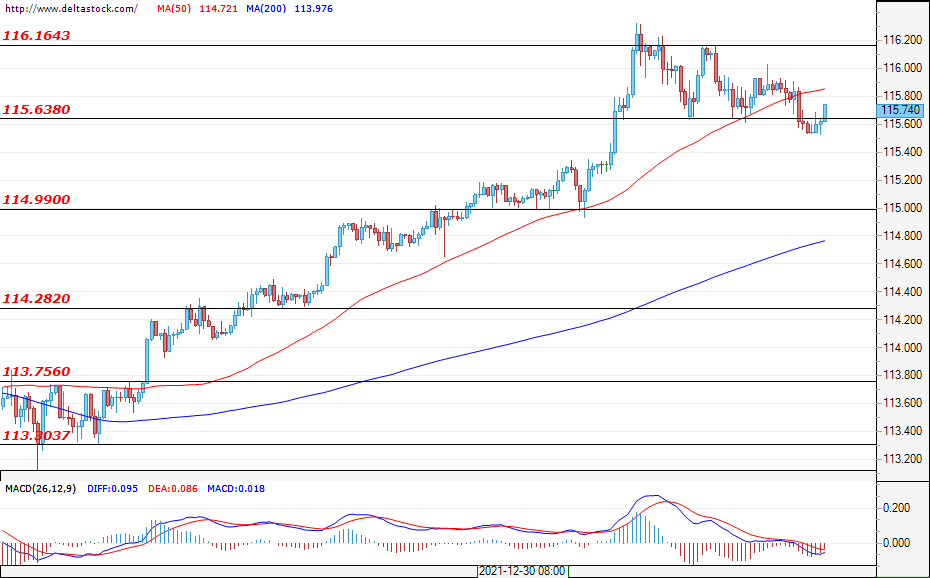
Last week, the uptrend entered a pullback and formed support at around 115.63. After the false breach of the zone, the upward momentum is expected to resume and the resistance at 116.16 is to be overtaken. In such a scenario, the target for the bulls would be the level at around 117.80. If the resistance at 116.16 is not violated, then it is likely for the market to enter a range phase. Possible bands for such a range could be the support at 114.30 and the resistance at 116.16.
GBP/USD
Current level - 1.3589
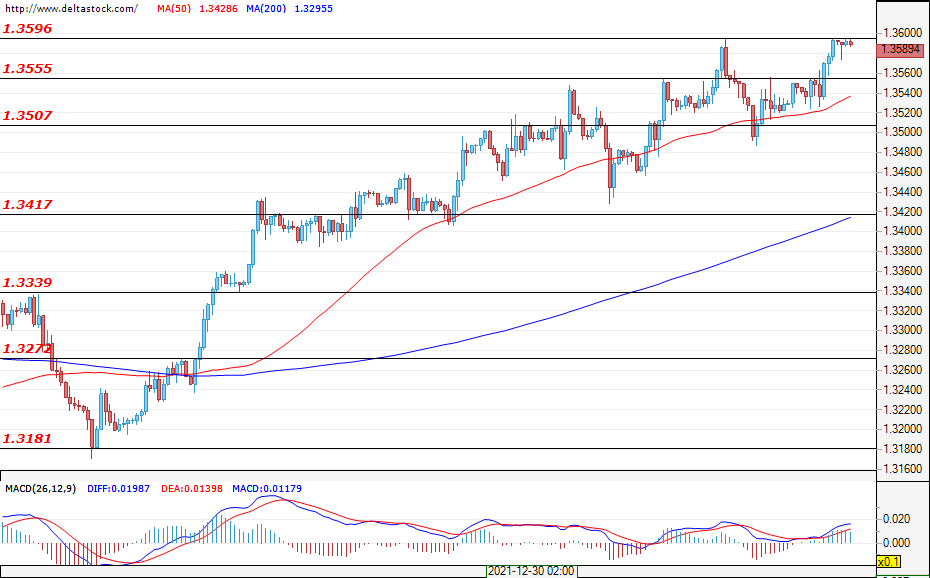
The gains of the sterling do not seem sustainable and bullish impulses are currently being followed by deep retracements. Looking at the higher time frames, the mood still looks bearish, and the area at around 1.3600 looks attractive to sellers. The market is expected to enter a range phase, after which it could roll over into a downtrend. These expectations would change if the resistance at 1.3800 is breached. The first support for the bulls is the level of 1.3555, followed by that of 1.3507, and the main one lies at 1.3417. First resistances are 1.3600 and 1.3700.
EUGERMANY40
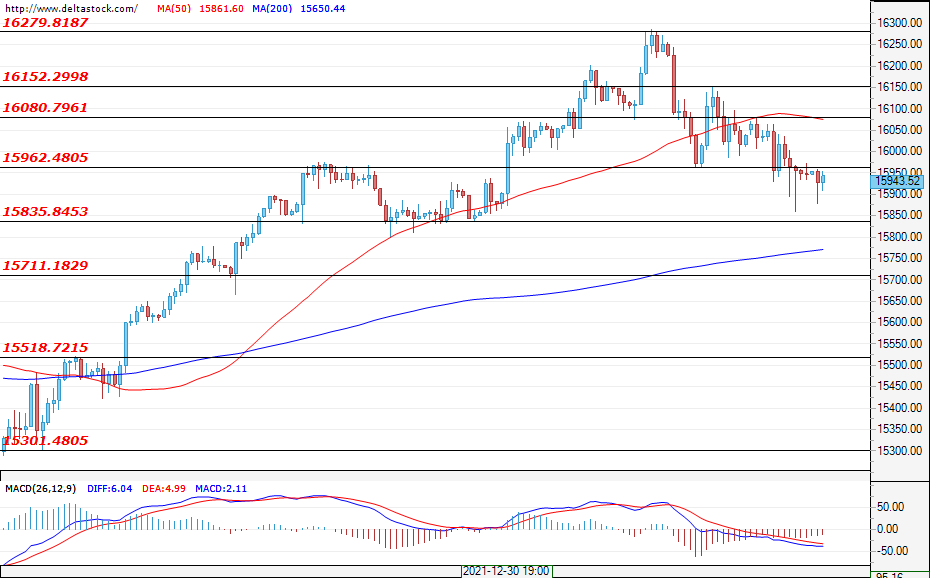
Current level - 15943
The first week of the year was extremely volatile for the German index and, after nearly reaching the record highs of around 16297, it sold out massively. The declines were not unexpected and are currently limited to a technical retracement. The area around 15835 provided solid support and sell offers were rejected above this level. Expectations remain positive, at least until the integrity of the 15835 zone is compromised. The first resistances for the bulls are 15960, 16080 and 16150. The seasonal data supports the bullish scenario and it is possible for buyers to once again attack the high of 16280.
USD30
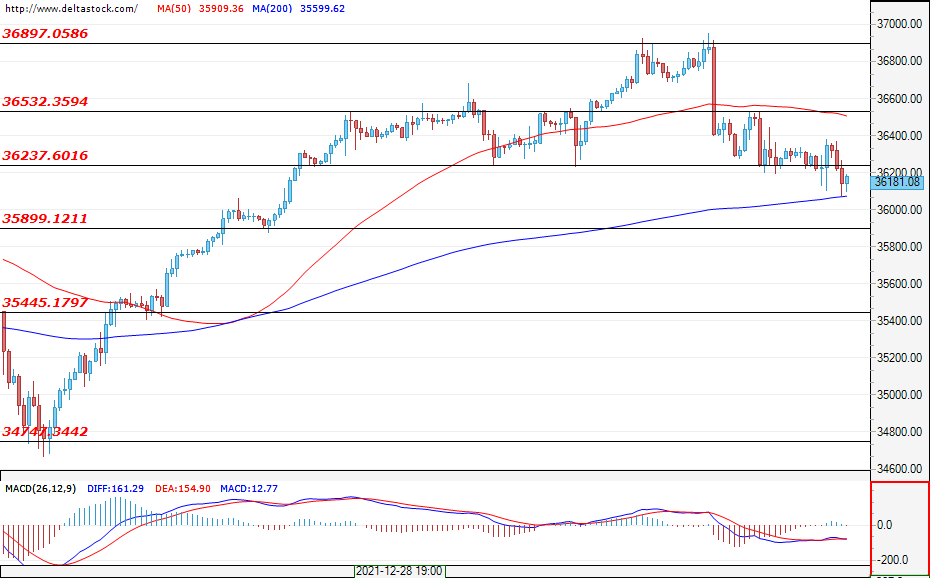
Current level - 36181
The Fed meeting minutes turned the week around for the U.S. markets and they were aggressively sold out after previously reaching new record highs. As a result, the breach of the key zone at 36237 is likely to be fake. If prices return above this level, then a renewal of the bullish momentum can be expected. The first resistance for the bulls is 36530, and the next one is the area around the record values at 36900. If the sell-off continues this week, the first support zones for the bulls would be 35900 and 35445.
EURUSD Rises as Bets of Tighter Fed Remain
The EURUSD pair soared to the highest level since January 3 as investors reacted to mixed US non-farm payrolls (NFP) data. Data published on Friday revealed that the American economy added just 199k jobs in December. That was significantly lower than the 422k analysts were expecting. The numbers also mean that the economy is yet to fill 3.2 million jobs that were lost during the pandemic. On the positive side, the unemployment rate declined to 3.9% while wages rose. Therefore, analysts expect that the Federal Reserve will maintain its hawkish stance in the coming meetings.
US futures wavered as investors started to refocus on the upcoming earnings season. The official season will start on Friday when big bank like Citigroup, JP Morgan, and Wells Fargo will publish their fourth-quarter results. Analysts expect that these banks will deliver record earnings and guidance thanks to hopes that the Fed will hike interest rates. Stocks have been under pressure in the first week of the year, with high-growth tech stocks seeing more weakness because of fears of the hawkish Fed. A bond sell-off has also happened, pushing the 10-year yield to the highest level since 2020.
The economic calendar will be muted today, with no major economic data scheduled. Therefore, investors will focus on the performance of key areas of the market. For example, the sell-off of cryptocurrencies continued during the weekend. Bitcoin declined to $41,000 while Ethereum is slightly above the key support at $3,000. Additionally, investors will position for a busy week, where the US will publish the latest inflation data and several Fed officials will talk.
EURUSD
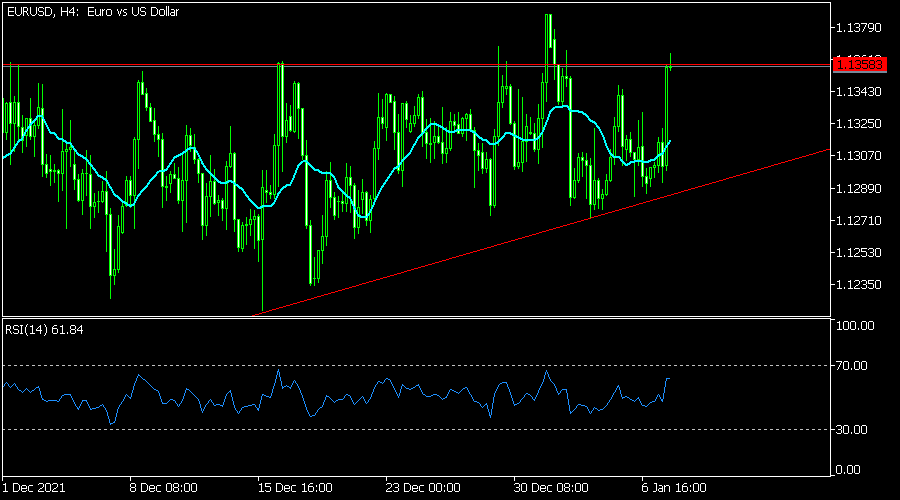
The EURUSD pair rose sharply after the latest American jobs numbers. It is trading at 1.1360, which is a few points above last week’s low at 1.1270. The pair is along a key resistance level, which it has struggled moving above before. It is also slightly above the 25-day and 50-day moving averages. A closer look also shows that it has formed a bearish flag pattern. Therefore, the pair will likely have a pullback later today.
XAUUSD
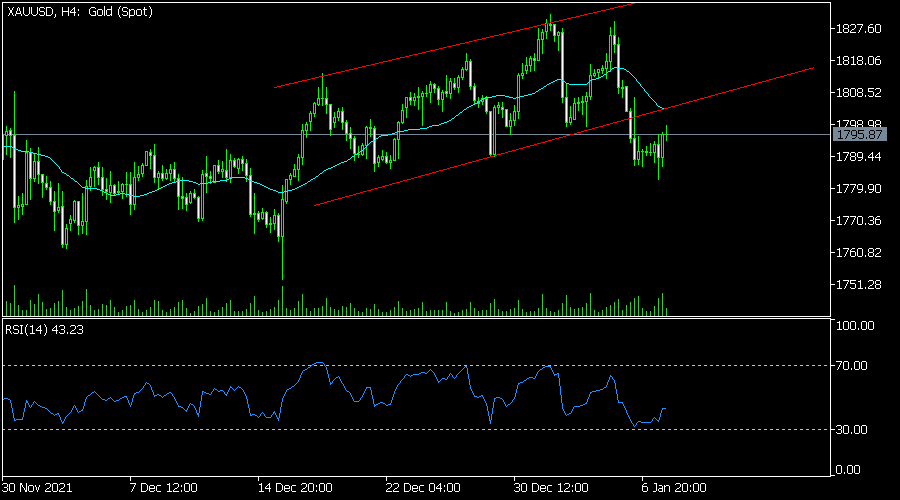
The XAUUSD pair held steady on Monday morning as the US dollar declined. It is trading at 1,795, which is slightly above last week’s low at 1,781. It is also slightly below the 25-day moving average while the Relative Strength Index (RSI) has tilted upwards. The price is also slightly below the ascending channel shown in red. Therefore, there is a likelihood that it will resume the bearish trend as investors wait for the upcoming inflation data.
USDCAD
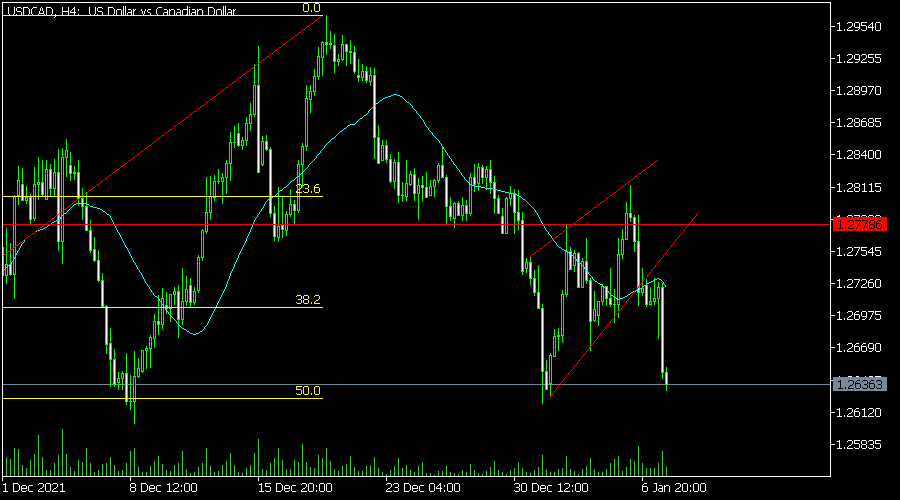
The USDCAD pair declined sharply after the latest US and Canadian jobs numbers. It declined to a low of 1.2636, which was the lowest level since Monday. It managed to move below the lower side of the ascending channel shown in red. Also, it is along the 50% Fibonacci retracement level and below the 25-day moving averages. Therefore, the pair will likely keep falling in the near term.
Stock Markets Trade Mixed
Markets
Friday’s trading session revolved around US payrolls and EMU inflation. The former showed below-consensus job creation but faster-than-expected wage increases (0.6% m/m). Armed with the separate, strong household survey (unemployment rate fell to 3.9%), markets concluded it’s enough to justify the Fed’s accelerated normalization pace. Wall Street’s choppy trading ended up with losses. The Nasdaq (-0.96%) underperformed. US bond yields rose 3 bps (5y) to 4.1 bps (10y). The 5y trades north of 1.5% for the first time since January 2020. The 10y tested resistance at 1.77% but didn’t confirm the technical break going into the weekend. Inflation in the eurozone unexpectedly rose from 4.9% to a record high of 5% but left few traces on markets. German yields rose 0.6 to 2.1 bps across the curve in a move inspired by the US post-payrolls. The German 10y yield closed at a new recovery high of -0.04%. Peripheral spreads widened a basis point or two. Greece hugely underperformed (+11 bps; anticipating supply?). The dollar once again failed to capitalize on UST underperformance. EUR/USD even jumped off 1.129 support to finish at 1.136. USD/JPY closed below 116. EUR/GBP copy pasted moves in EUR/USD. It gained marginally to end the week at 0.836. That said, the pair is still trading near a two-year low. Cable (GBP/USD) tested the 1.36 big figure.
Asian Pacific trading is so quiet you can hear a pin drop. Japanese markets are closed for Coming-of-age Day. Other stock markets trade mixed, lacking guidance. We do retain an interview by ECB Schnabel (see headline below) over the weekend. Core bonds open the week with new losses, building on the existing trends and suggesting a higher open for both US and German yields. It may set the tone for the remainder of the day given the empty economic calendar. The latter only gets moderately interesting this week with the US in focus. CPI (expected at 7%+ y/y) and the Fed’s Beige Book are due on Wednesday. Retail sales and consumer confidence (U. of Michigan) are up for release this Friday. In the meantime we’re watching two key rate levels: 1.77% for the US 10y and the (symbolic) 0% for the German variant. The USD is retracing some of it’s counterintuitive steps on Friday and strengthens vs most major peers. With the euro at the same time in a soft spot, EUR/USD eases to 1.133, confirming the weeks-long gridlock in the low 1.13 area. The UK receives an industrial update later this week but we doubt it will force a breakthrough in EUR/GBP. Sterling currently already discounts a 83% chance for a February back-to-back rate hike. The 0.8277 December ’19 low in any case is an important EUR/GBP support zone.
News headlines
The International Monetary Fund (IMF) published a blog post warning emerging economies to prepare for Fed policy tightening. The threat is especially there in case broad-base US wage inflation or sustained supply bottlenecks boost prices more than expected, triggering faster Fed rate increases and tighter global financial conditions. Such developments could come with a slowing of US demand and trade and may lead to capital outflows and currency depreciation in emerging markets. The IMF offers some policy advice especially for emerging markets with high public and private debt, FX exposures and lower current account balances. The tone of the message is clear: act now on inflation, strengthen policy frameworks and reduce vulnerabilities or risk having to face greater economic/financial turbulence later on.
ECB governing council member Schnabel warned that the greening of the economy poses measurable upside risks to the central bank’s baseline inflation projection over the medium term. She turns the argument around saying that there are instances in which central banks will need to break with the prevailing consensus that monetary policy should look through rising energy prices so as to secure price stability. Fossil fuel prices will not only stay elevated but might even keep on rising if the world steps up its fight against climate change in order to meet the goals of the Paris climate change. Scenarios which would trigger a faster ECB response are one where higher energy prices filter through in elevated inflation expectations and a create wage-price spiral and one where policies to tackle climate change (eg carbon tax and compensation measures) increase inflationary pressures.
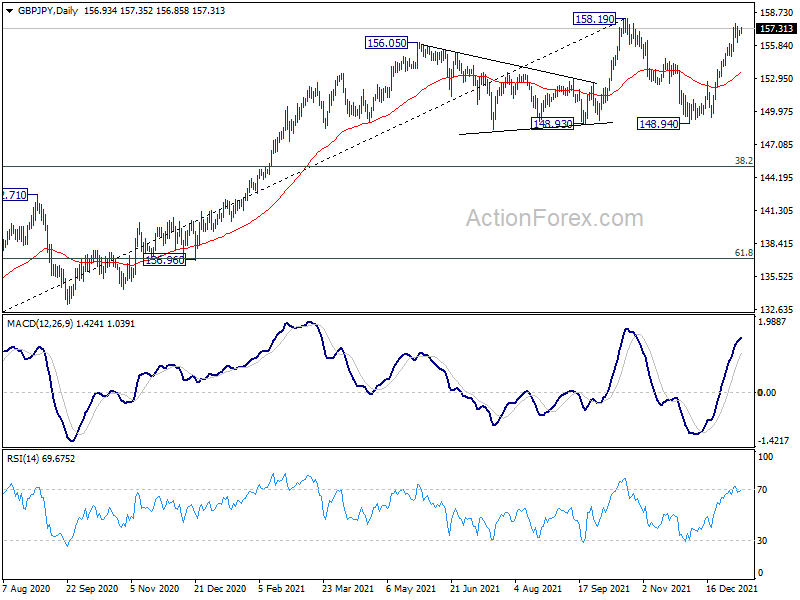
GBP/JPY Daily Outlook
Daily Pivots: (S1) 156.81; (P) 157.00; (R1) 157.26; More...
Intraday bias in GBP/JPY remains neutral as consolidation from 157.74 continues. Further rise is expected as long as 154.86 support holds. Decisive break of 158.19 high will resume larger up trend to 167.93 long term fibonacci level. On the downside, below 154.86 minor support will turn intraday bias back to the downside for deeper pull back.
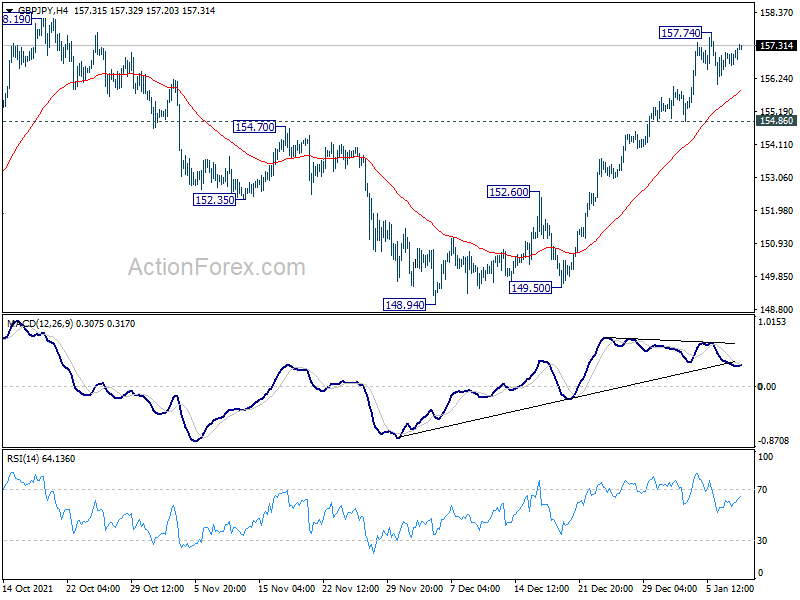
In the bigger picture, strong rebound from 148.93 key structural support retains medium term bullishness. Firm break of 158.19 high will resume whole up trend from 123.94 (2020 low), to 61.8% retracement of 195.86 to 122.75 at 167.93. Nevertheless, firm break of 148.93 will bring deeper correction to 38.2% retracement of 123.94 to 158.19 at 145.10, and possibly further lower, as a correction to up trend from 123.94 at least.