

Sample Category Title
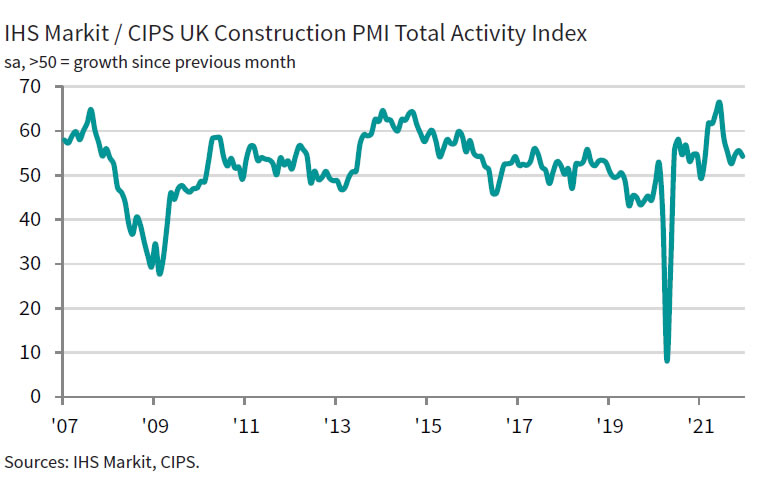
UK PMI construction dropped to 54.3, worst phase of supplier delays passed
UK PMI Construction dropped from 55.5 to 54.3 in December, above expectation of 53.9. Markit said weakness centered on commercial and civil engineering segments. House building regained its place as fastest-growing category. Suppliers delay were the least widespread since November 2020.
Tim Moore, Director at IHS Markit: "UK construction companies ended last year on a slightly weaker footing... The worst phase of supplier delays seems to have passed... Input cost inflation moved down another notch.... The latest rise in purchasing prices was far slower than the 24-year peak seen last June."
Yen Hovers Just Below 116
All eyes are on US nonfarm payrolls, perhaps the monthly highlight on the economic calendar. An interesting prelude to nonfarm payrolls was the ADP employment report on Wednesday. ADP is not a reliable indicator for the NFP, but it always garners a fair degree of attention, coming just before the nonfarm payrolls release.
The December ADP delivered a massive overperformance, to the tune of 807 thousand new jobs, crushing the forecast of 400 thousand. Such a miss to the upside could not be ignored, prompting Goldman Sachs to revise upwards its estimate for NFP from 450 thousand to 500 thousand. Still, the consensus is around 425 thousand, so unless it falls below 250 thousand or rises above 550 thousand, I don’t expect the markets to react and shake up the US dollar. A weak reading could delay a Fed rate hike and would drive a risk-on mood. Conversely, a strong release would support an earlier Fed hike and would be bullish for the US dollar.
Japan’s consumers hold tight to purse strings
In Japan, consumers cut back on spending in November. Household Spending declined by -1.3% y/y, the first drop in three months. With the economy showing signs of improvement, analysts had projected a 1.2% gain. The negative reading is particularly worrying as consumption fell before the rapid spread of Omicron in December. If consumer spending also fell in December, it will throw a wrench in the government’s plans to kickstart economic growth. The government is pushing companies to raise wages but businesses will be reluctant to do so if consumers hold tight to the purse strings.
The Japanese yen finds itself at 5-year lows against the greenback, courtesy of rising US Treasury yields. The 10-year yield, which finished 2021 above the 1.50% level, hasn’t missed a beat in the first week of 2022 and has risen to 1.73%. The widening US/Japan rate differential has been weighing on the yen, which is extremely sensitive to the rate differential. If US yields remain high, we could see USD/JPY break past the 118 mark over the coming weeks.
USD/JPY Technical
- USD/JPY continues to put pressure on resistance at 115.78. Above, there is resistance at 116.34
- There is support at 114.54 and 113.98

GBPJPY Bulls Hang in there Despite Minor Pullback to 157
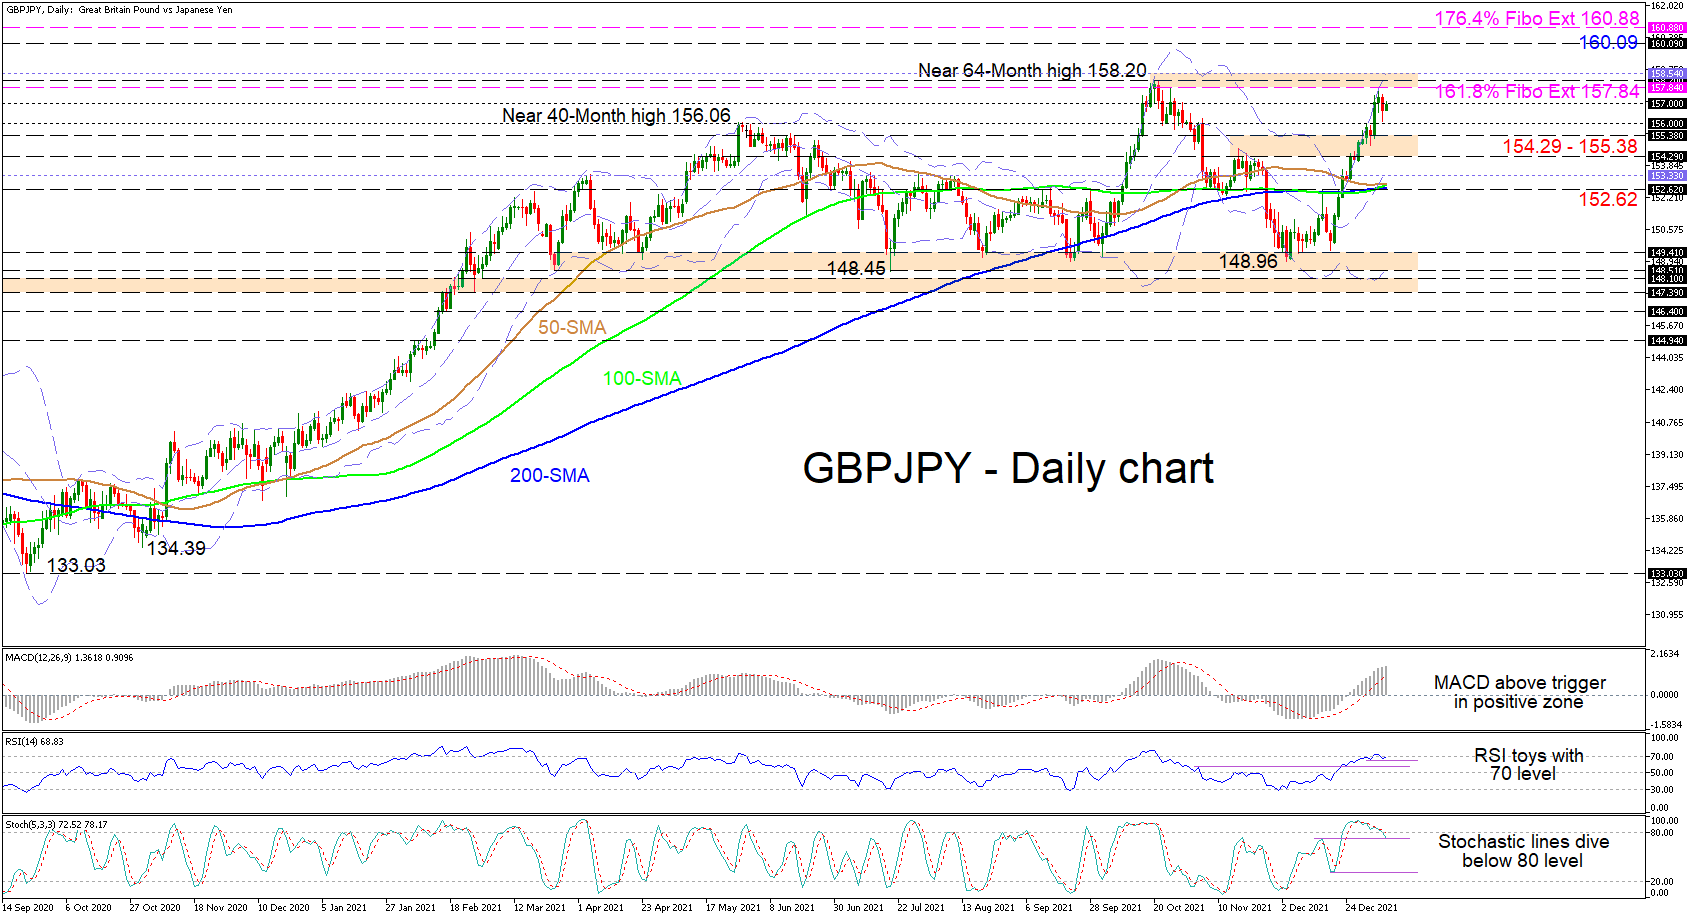
GBPJPY’s strong two-week rally, which began from 149.50 has lost steam just shy of the 157.84 level and the more than 5-year high of 158.20, the former being the 161.8% Fibonacci extension of the down leg from 144.94 until 124.00. The simple moving averages (SMAs) have flatlined, implying a more neutral bearing in the pair in the short-term timeframe.
The short-term oscillators are transmitting conflicting messages in directional momentum. The MACD, in the positive region, continues to strengthen above its red trigger line, while the RSI is flirting with the 70 overbought level. On the other hand, the stochastic oscillators’ bearish charge seems to be growing, which is promoting the pair’s recent negative impetus.
If sellers stay in control, downside friction could commence around the 156.00 handle ahead of the 154.29-155.38 support section. If the bears manage to drive the price beneath this key barrier, a deeper retracement could unfold with the price aiming for the fortified zone of support between the mid-Bollinger band at 153.33 and the 152.62 inside swing high.
Then again, if buying interest picks up, initial tough resistance could emanate from the 161.8% Fibo extension of 157.84 until the upper Bollinger band at 158.54, an area that also encompasses the more than 5-year high of 158.20. Successfully conquering this, the pair could propel for the critical 160.09 June peak of 2016, where the pair had previously collapsed, ahead of the 176.4% Fibo extension of 160.88.
Summarizing, GBPJPY’s neutral-to-bullish tone remains intact above the SMAs and the 148.96 trough. A jump above 158.20 could bolster bullish action, while a dip beneath the 154.29-155.38 support border could start to strengthen downside pressures.
US 30 Retreats from All-Time High as Bearish Forces Reign
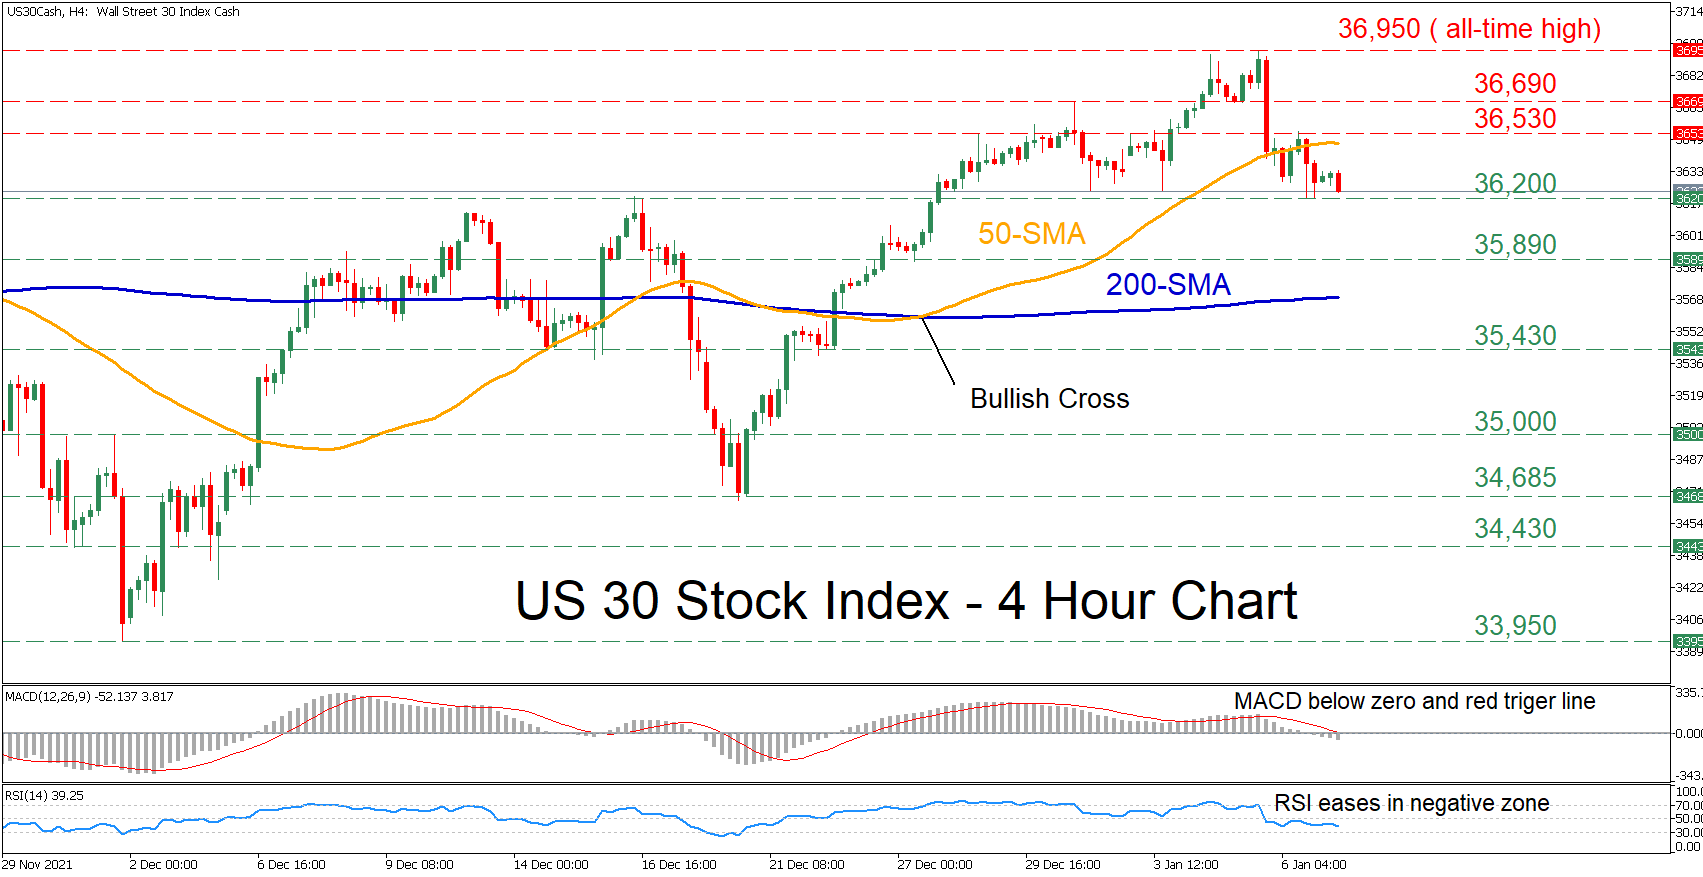
The US 30 stock index (cash) has been experiencing a minor pullback in the last few four-hour sessions since its long-term rally peaked at the all-time high of 36,950. Moreover, the price crossed below its 50-period simple moving average (SMA), reinforcing the index’s imminent bearish bias.
The recent retreat is likely to continue as the short-term oscillators confirm that sellers have gained the upper hand. The MACD is found below its red signal line in the negative region, while the RSI has flatlined well beneath its 50-neutral mark.
Should the selling pressure intensify further, immediate resistance could be encountered at the most recent low of 36,200. Piercing through this barrier, the price might dip towards 35,890 or lower to challenge the 35,430 hurdle. If the bears overcome these obstacles, the spotlight would turn to the 35,000 psychological mark.
Alternatively, if the bulls retake control, the 36,530 region could act as an initial resistance point for the price. Overcoming this barricade, the 36,690 obstacle could appear on the radar. Higher up, the price ascent might halt at the record high of 36,950, before it moves towards uncharted waters.
Overall, the US 30 stock index appears to have run out of steam after posting a new all-time high. However, a clear dive below 35,430 is needed to turn the medium-term outlook to negative.
USDCAD Finds Support at 1.2700 but Mood Still Gloomy
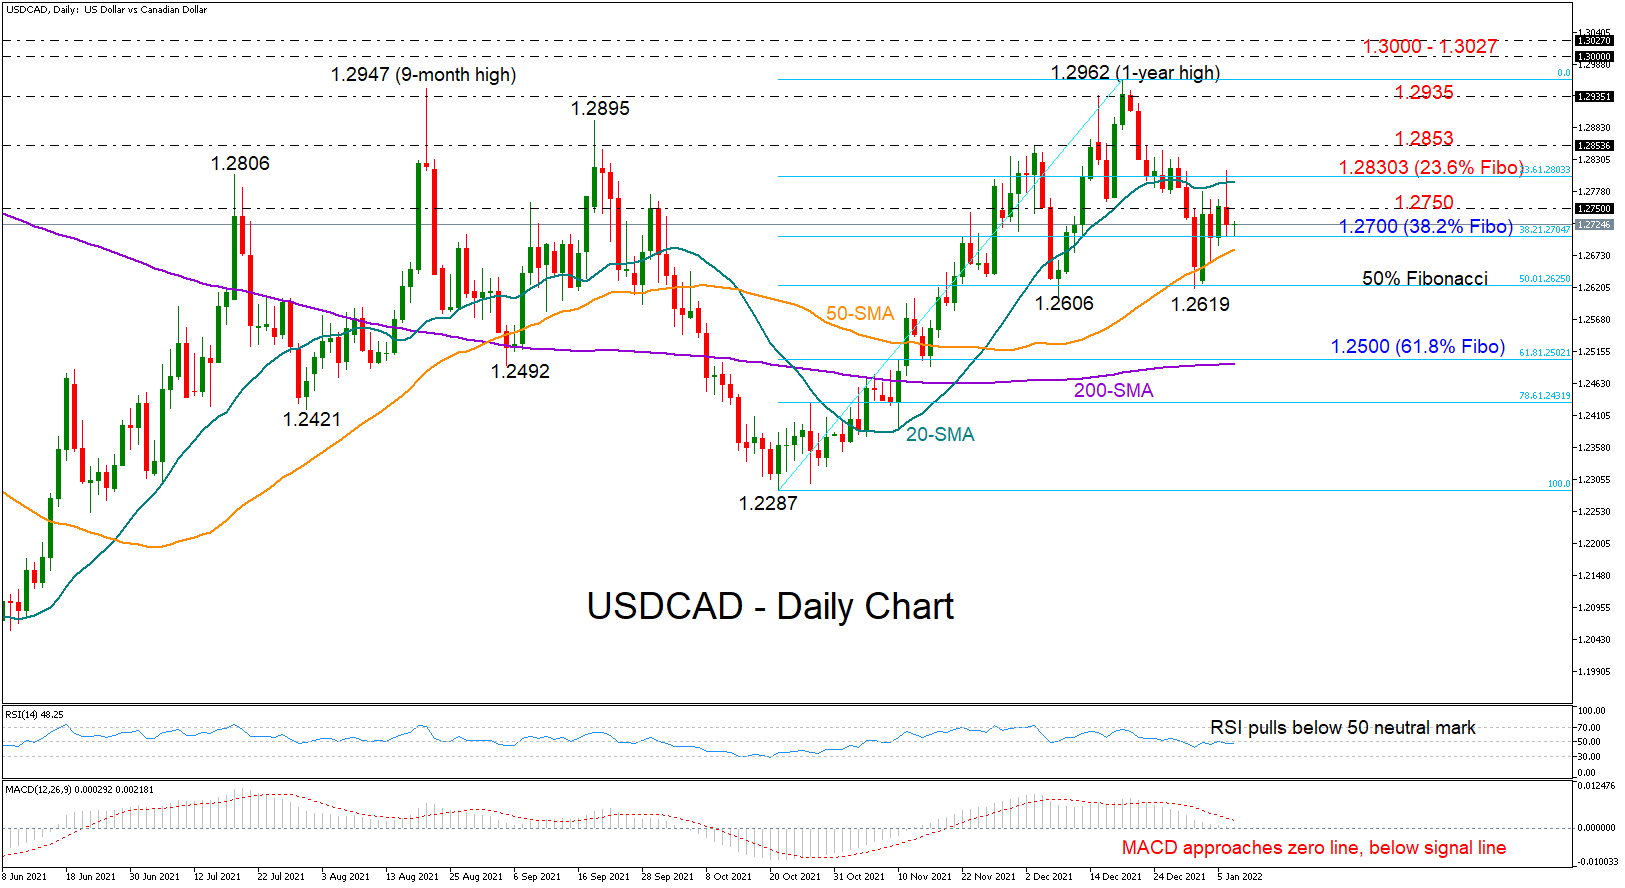
USDCAD is facing difficulties in extending Monday’s swift bullish correction, which helped the pair survive a trend deterioration below the previous low of 1.2606 in the short-term window.
Despite the flash pickup to 1.2812 yesterday, the price flipped back to maintain its weekly neutral trajectory within the 1.2700 – 1.2750 region, with the former representing the 38.2% Fibonacci retracement of the 1.2287 – 1.2962 upleg.
The technical signals are currently illustrating a gloomy mood among traders as the MACD has further distanced itself below its red signal line in the positive area and the RSI is looking powerless to cross above its 50 neutral mark.
Support at 1.2700 and the 50-day simple moving average (SMA) currently at 1.2685 are keeping some buying interest in play at the moment. If they fail to hold, all attention will shift back to the 1.2600 – 1.2619 floor, where any violation is expected to activate a sharp decline towards the 61.8% Fibonacci of 1.2500 and the 200-day SMA.
On the upside, a close above 1.2750 could bring the area around the 23.6% Fibonacci of 1.2800 back under examination. Climbing higher, the 1.2853 barrier could challenge the bulls ahead of the 1.2935 – 1.2962 resistance zone. Then, not far above, the 1.3000 – 1.3027 bar from August – November 2020 could be another tough obstacle.
In brief, although the short-term uptrend in USDCAD remains valid, negative risks continue to linger in the background. A clear move below 1.2700 – 1.2685 is expected to confirm a bearish bias.
USDCHF Powers Back, Crossing above its 50- and 200-SMA
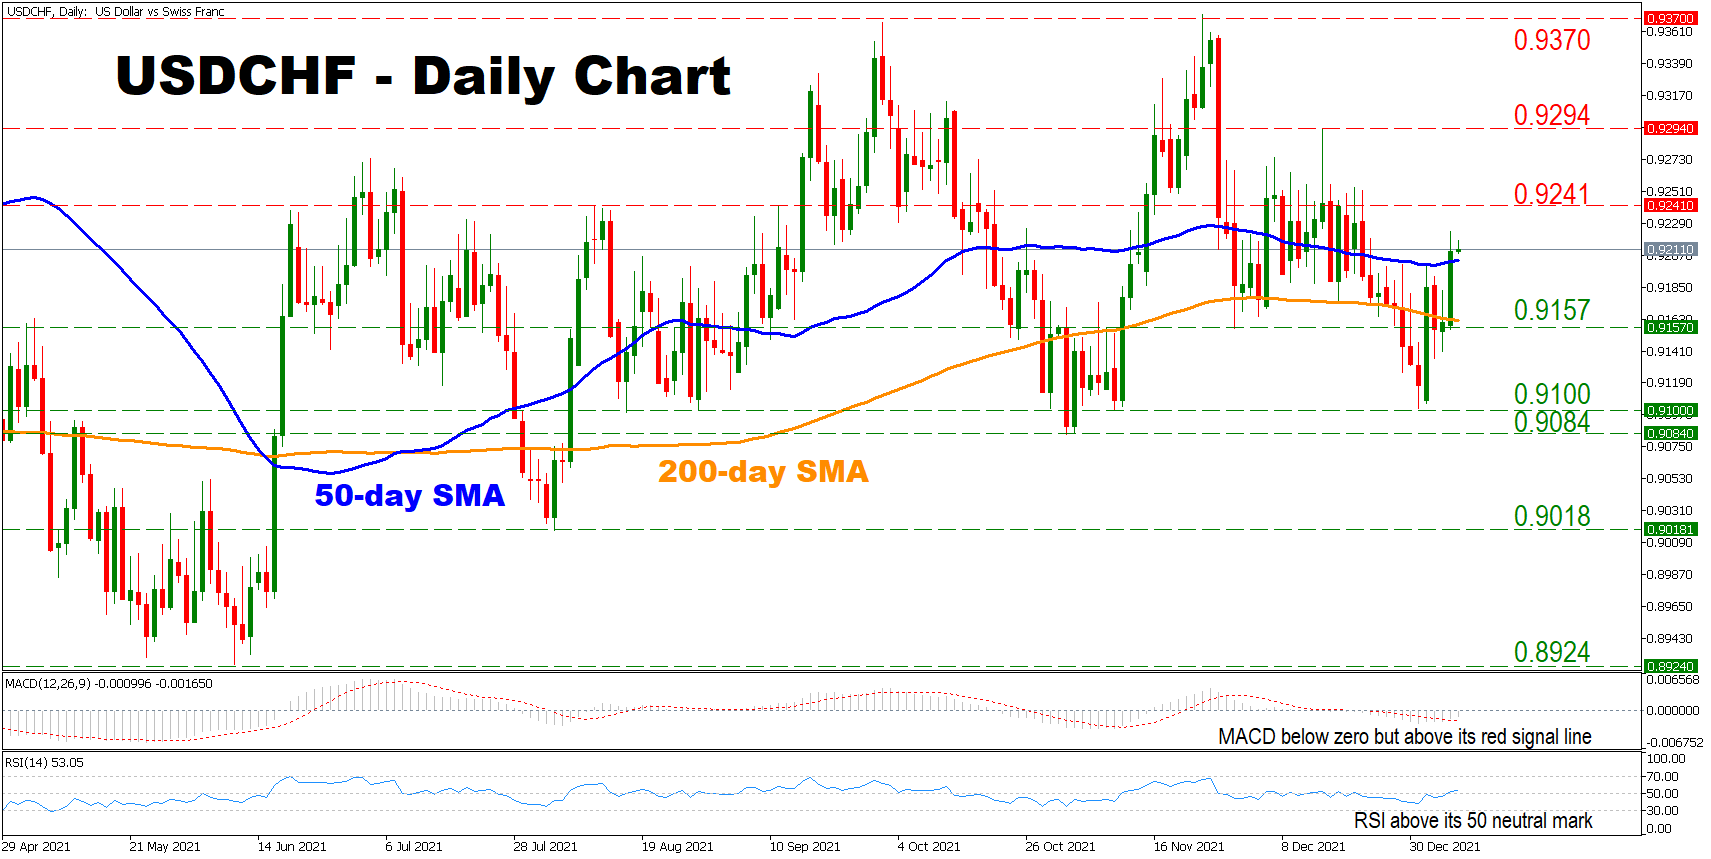
USDCHF powered back from its late December low, halting a five session losing streak and crossing above the 50- and 200-day simple moving average (SMA). The cautiously bullish outlook for the pair is maintained despite failing to mark yet another successive higher low in December.
Short-term momentum indicators are supporting a positive bias for the pair. The RSI is found above its 50 neutral mark, while the MACD is looking ready to cross above zero, which would be an encouraging signal of strengthening positive momentum.
Should the bulls maintain control, initial resistance might be found at the 0.9241 level. Surpassing that point could open the door towards the 0.9294 obstacle before buyers eye the 0.9370 barrier. A break above the latter could strengthen the pair's positive momentum, sending the price to test its April 2021 high of 0.9472.
On the flip side, if the price breaks below the 50-day SMA currently at 0.9203, sellers could shift their attention towards the region which consists of the 200-day SMA and the 0.9157 barrier. A break below that crucial point could pressure the price towards the congested region which encapsulates the 0.9100 and the 0.9084 hurdle.
In brief, despite losing its consecutive higher low streak, the pair’s outlook is still cautiously bullish. For sentiment to change, the bears would need to break below the 200-day SMA.
US Dollar Braces for Nonfarm Payrolls Test
- US employment report today could be critical for markets
- FX and stock markets quiet, but yield spike hurts gold
- Oil powers higher as supply disruptions get priced in
Conflicting signs for US jobs
The main event today will be the US employment report for December, which could be huge for the dollar and equities as rate traders are currently pricing in an 80% chance for the Fed to begin its hiking cycle in March. Nonfarm payrolls are forecast to have risen by 400k, pushing the unemployment rate down another tick to 4.1%.
Markets are likely positioned for an even stronger report after the private ADP report for the month clocked in at an impressive 807k. Another encouraging sign was that jobless claims fell substantially during the NFP survey week from a month ago.
That said, other labor market indicators were not so optimistic. The Markit PMI surveys showed that “employment growth slowed to only a marginal pace” while the ISM services report also hinted at a slowdown in jobs growth. These suggest that there is scope for disappointment today, especially in light of Omicron.
In the markets, a nonfarm payrolls number around 400k could take some air out of Fed bets and deal a minor blow to the dollar, although it would not be a game-changer. In contrast, stock markets could react positively to a minor disappointment, as we are in the stage where bad economic news is good news for equities.
Beyond the initial reaction though, what could decide the ultimate direction in the markets is wage growth, given the implications for inflation. That’s expected to have cooled in yearly terms but the Markit PMIs pointed to ‘soaring wage bills’, so we could have a report where jobs growth is on the softer side of expectations but wages aren’t.
FX and equity arenas calm
The currency market has been rather quiet in recent sessions. The dollar has traded sideways for most of the week despite the revelations in the latest Fed minutes, where the central bank opened the door for shrinking its balance sheet at a faster clip than the previous normalization cycle.
This means the Fed will allow maturing bonds to roll off its balance sheet, effectively sucking liquidity out of the financial system. Along with intensifying speculation for a rate increase in March, this is probably what has propelled Treasury yields so much higher.
It is therefore quite striking that the dollar hasn’t rocketed higher, even though rate differentials have widened in its favor against the euro for instance. This may reflect some caution ahead of today’s jobs report, with traders waiting for the risk event to pass before raising their exposure to the reserve currency.
The Fed’s balance sheet reduction plans are equally important for equities. Let’s not forget that the same strategy ultimately broke the stock market back in late 2018, forcing the Fed to reverse course and cut rates multiple times to calm nerves. On the bright side, this is a risk for the longer term. Liquidity will remain plentiful for a while after two years now of incredible injections.
Gold and oil go their separate ways
In the commodity sphere, gold prices suffered another drop yesterday. The untold story of this week was that real rates shot much higher, with the US 10-year inflation-protected yield reaching a six-month high.
Real yields are arguably the most important driver of gold, so it’s almost a miracle the metal didn’t get hit even harder. One element behind gold’s relative resilience may be geopolitical tensions, which have intensified lately with anti-government protests in Kazakhstan turning bloody.
These tensions may be what helped oil prices defy the gloomy mood in the markets this week, as Kazakhstan is a major crude producer. It is still unclear how much output will be lost, but oil traders seem to be in a ‘shoot first, ask questions later’ mode for now.
Bitcoin, Gold, Silver, and Stocks Sell-off Intensifies
US equities, cryptocurrencies, and precious metals declined on Thursday as investors started to adjust for the upcoming interest rate hikes. The Dow Jones declined by about 170 points while the Nasdaq 100 and S&P 500 rose marginally. This sell-off was mostly a reaction to the hawkish minutes by the Federal Reserve. The argument is that assets that did well in a period of low interest rates will lag when the Fed starts its hiking cycle. Meanwhile, data showed that the American services sector lagged in December as the Omicron variant spread. The ISM non-manufacturing PMI declined from 69.1 in November to 62.0 in December.
The US dollar held steady as investors waited for the upcoming American jobs numbers that will come out later today. Economists polled by Reuters expect the data to show that the country’s employers added about 400k jobs in December while the unemployment rate retreated to 4.1%. On Wednesday, data by ADP revealed that the country’s private sector added 800k jobs. On Thursday, the Labor Department said that initial jobless claims rose slightly to 207k last week. Strong jobs numbers will incentivize the Fed to start tapering.
The Canadian dollar strengthened against the US dollar after the latest Canadian trade numbers. According to the country’s commerce department, exports increased from C$56.42 billion in October to C$58.57 billion in November. In the same period, imports rose to C$55.44 billion, leading to an overall trade surplus of C$3.13 billion. These numbers show that the country’s economy is doing well. Later today, the statistics agency will publish the latest jobs data. Economists expect the data to show that the country’s unemployment rate declined from 6.0% to 5.9% in November.
EURUSD
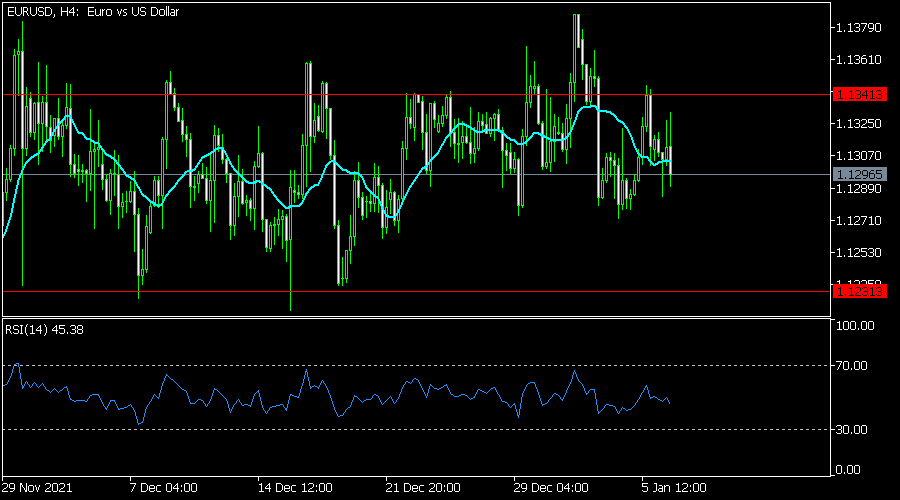
The EURUSD pair was little changed ahead of the latest Eurozone inflation and US NFP data. It is trading at 1.1296, where it has been in the past few days. This price is slightly below the upper side of the horizontal channel shown in red. It is also along the 25-day and 50-day moving averages and slightly below the 23.6% Fibonacci retracement level. Therefore, the pair will likely remain in this range ahead of the NFP data.
USDCAD
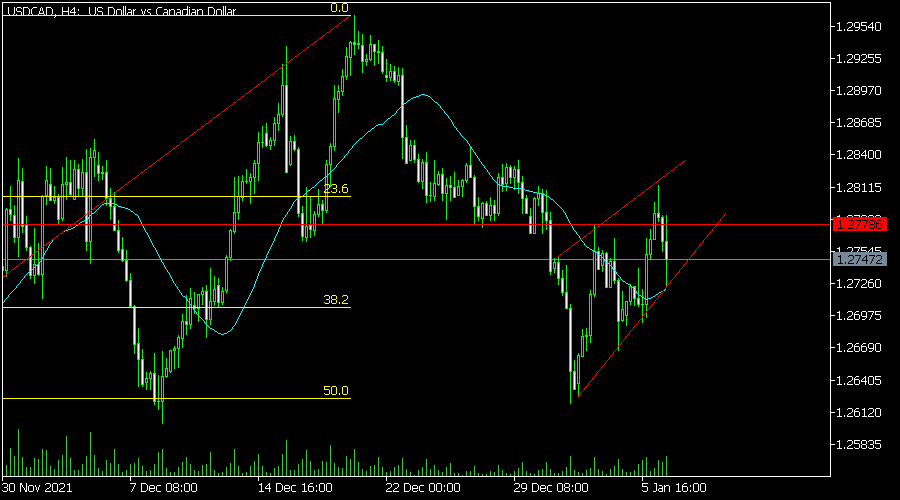
The USDCAD pair moved sideways ahead of the latest US and Canadian jobs numbers. It is trading at 1.2753, which is above this week’s low at 1.2620. The pair has also moved slightly above the 25-day and 50-day moving averages. It has formed an ascending channel that is shown in red. It has also formed a head and shoulders pattern. Therefore, there is a possibility that it will retreat and retest the support at 1.2620.
XTIUSD
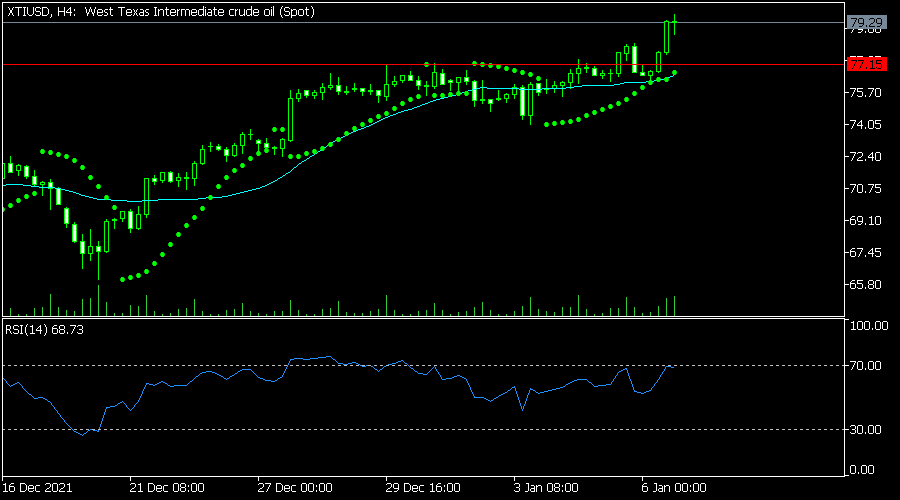
The XTIUSD pair rose to a high of 79, which was the highest level since November 17. It is also above the key support at 77.15 and the Parabolic SAR indicator. It has also risen above the 25-day moving average while the Relative Strength Index (RSI) is slightly below the overbought level of 70. Therefore, the pair will likely keep rising as bulls target the key resistance at 78.
Daily Technical Analysis
EUR/USD
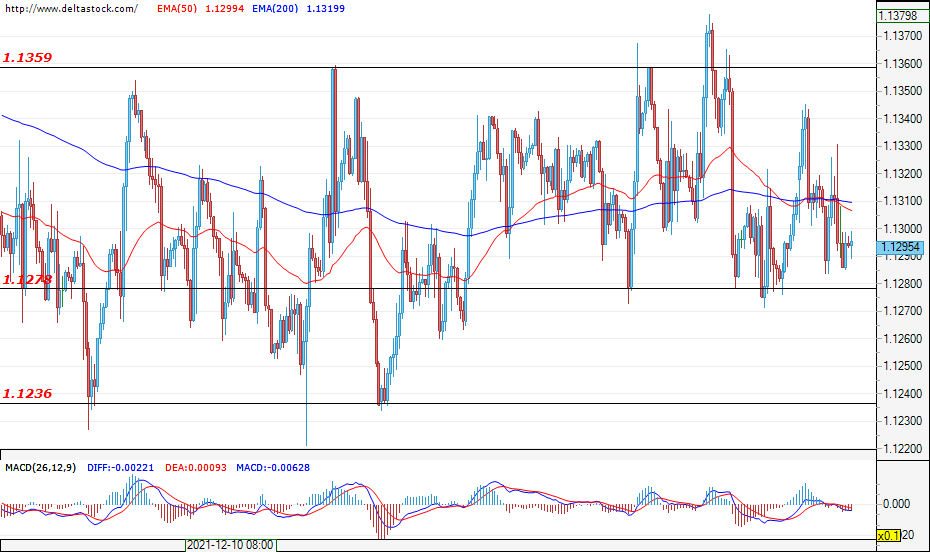
Current level - 1.1295
The market continues to trade without a clear direction and, at the time of writing this analysis, the single European currency is on the verge of testing the support zone at 1.1278, and a possible breach of this level could give the bears the necessary incentive to test the key support at 1.1236. On the other hand, if the trade stays above 1.1278, then it is possible that the bulls will try to attack the resistance at 1.1359. Today, investors will expect the monthly non-farm payrolls report for the United States, as well as the unemployment rate (13:30 GMT), and the expected increase in volatility could lead to an end of the consolidation phase and provide a signal for the future direction of the pair.
USD/JPY
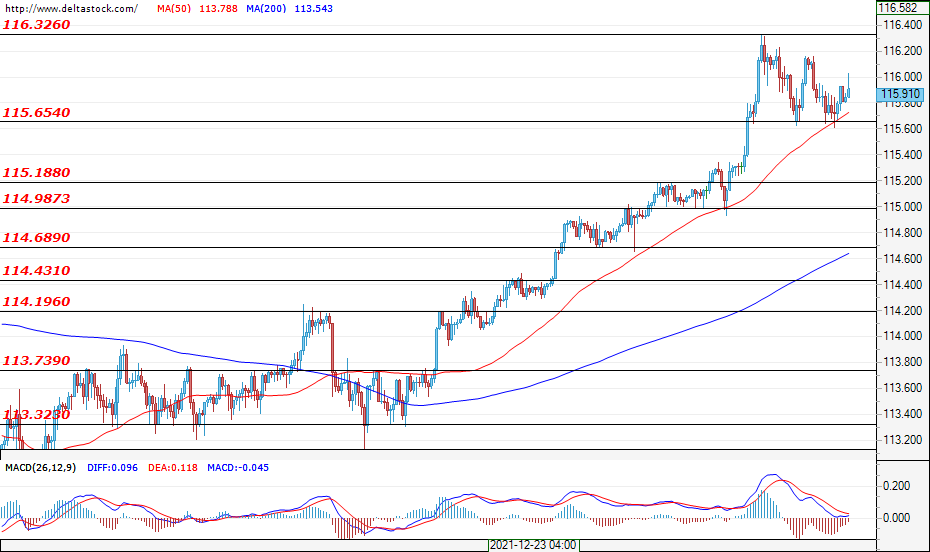
Current level - 115.91
The currency pair is in а consolidation phase in the range of 115.65 – 116.32 and the bears cannot yet gain enough momentum to breach the critical support at 115.65. The expectations are the bulls to re-enter the market and to attack the resistance at 116.32, where a successful breach may pave the way for the pair towards the next resistance zone at 117.00 coming from the higher time frames. In an alternative scenario in which the bears prevail, the market may test the support level at 115.18.
Forex Technical Analysis on USD/JPY
GBP/USD
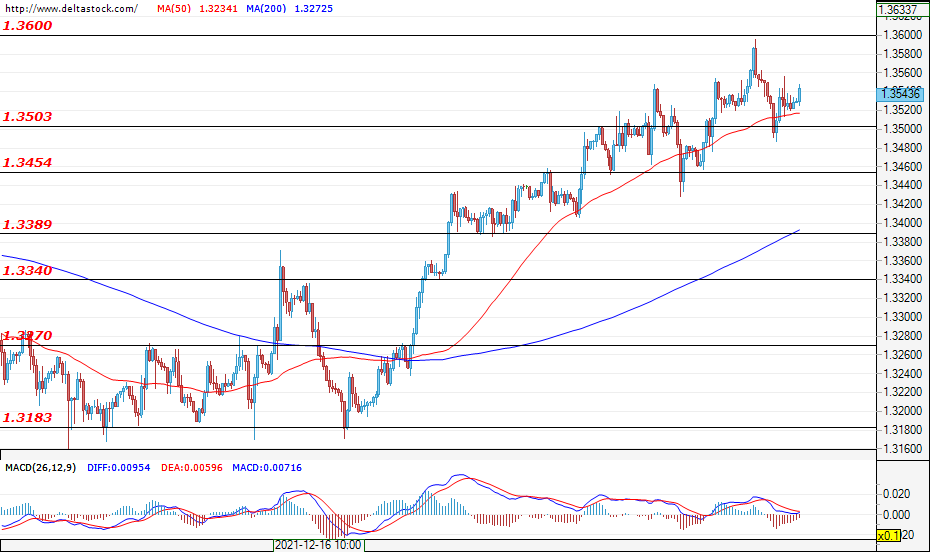
Current level - 1.3543
During yesterday’s trading session, the bears couldn’t violate the support at 1.3500 and the expectations for today’s trading session are for an eventual test of the psychological level at 1.3600. In case the bulls gain enough momentum and manage to violate the mentioned level, then this may be considered as a signal for a continuation of the uptrend and a consecutive appreciation of sterling against the U.S. dollar targeting the resistance at 1.3680. However, before a potential upward movement is to develop, the trade may first remain limited in the range of 1.3500 – 1.3600. In the opposite direction, a breach of the support at 1.3500 may give the bears an opportunity to attack the next support zone at 1.3454.
EUGERMANY40
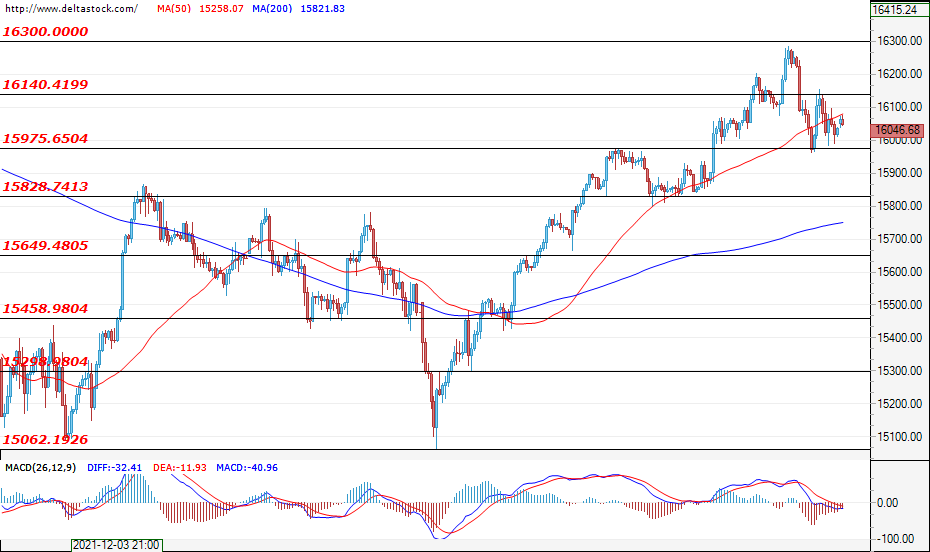
Current level - 16046
The corrective move after the unsuccessful test of the record level of 16300 was limited by the support zone at 15975 and, at the time of writing, the market is in a hesitant mood and the bears are struggling to overcome the mentioned level. The market sentiment remains positive – for an appreciation of the index and, if the bulls gain enough momentum to overcome the psychological level at 16300, then this would probably lead to an appreciation of the index towards new record highs. Conversely, if the bears re-enter the market, then sell-offs towards 15975 and 15828 would be a more likely scenario, which would also provide better entry levels for the buyers.
USD30
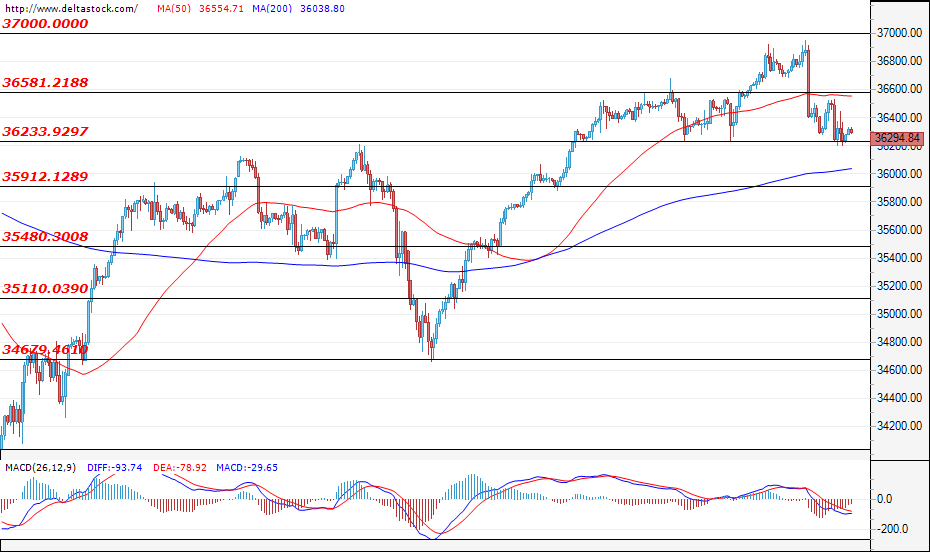
Current level - 36294
The bulls failed to hold their ground after the U.S. blue-chip stock index reached new record highs, which resulted in a decline and a consolidation just above the support area at 36233. A potential deepening of the sell-off during today's trading session could give the bears the necessary momentum needed to test the next major support area at 35912. If the bulls manage to keep the price of the index above the mentioned support and gain just enough momentum, then we may witness a further move towards the psychological level at 37000. Today, the news, mentioned in the EUR/USD analysis, could have an impact on the volatility of the index.
Dollar Still the Odd One Out in this Story
Markets
December FOMC Minutes still echoed through dealing rooms yesterday. Markets concluded that the US central bank could be on its way for a March rate hike with intentions to start winding down the $8.8tn balance sheet later this year. Voting regional Fed governor Bullard backed this scenario as did non-voting San Francisco Fed governor Daly. The latter emphasized strength on the US labour market as witnessed for example earlier this week in a very strong December ADP employment report. Today’ payrolls are expected to confirm this. Consensus expects a decent net job creation of 447k with the unemployment rate forecast to decline from 4.2% to 4.1%, which would be the lowest since February 2020 (3.5%). Average hourly earnings are forecast to remain robust at 0.4% M/M and 4.1% Y/Y. The key question is whether the data will still be able to influence main markets further following a volatile start (excl. FX) to the year. US yields already added 13.3 bps (2-yr) to 22.1 bps (7-yr) on those first four trading days with the US 10-yr yield for example approaching the 2021 high at 1.77%. Real yields are driving the move higher. In such a context it will probably take an extremely strong report to extend this week’s US Treasuries’ losses. US stock markets took a scare from this rate move with the Nasdaq for example down 3.6% YTD. The dollar is still the odd one out in this story, sticking near the beloved 1.13 big figure against the euro. Rising real rates and the risk-off environment tend to cancel each other out for the moment in this cross rate, but the greenback can’t really profit against the smaller currencies either. With the Fed’s cards out on the table, investors might be more interested in today’s EMU inflation numbers. Consensus expects the December print at 4.8% Y/Y, slightly down from 4.9% Y/Y in November, but we expect the first 5%(+?) reading in EMU history. Similar experiences in the US tended to spark sell-off in both bonds and stocks in such scenario. The same reasoning applies as for US Treasuries though. European bonds have been selling off ever since the December ECB meeting. The German 10-yr yield closes in on the -0.03% recovery high, while the EU 10y swap rate already passed its own technical reference (0.33%). The next mark to watch here is 0.4% which is 50% retracement on the 2018-2019 decline. Summarizing for today: EMU and US eco data will probably be negative for core bonds (and currently risk sentiment), but turn a little bit more cautious on the pace of the decline given strong moves since mid-December. EUR/USD remains deadlocked.
News headlines
Monetary policy normalization/tightening also continues in South America. Peru raised its policy rate by 50 bps to 3.0%. It was the sixth consecutive monthly rate hike since the cycle started in in August (from 0.25%). Inflation in Peru rose to 6.4% Y/Y in December. The central bank has an inflation target of 2.0% with a tolerance band of +/- 1.0%. Given solid economic growth, the bank no longer sees a need for an expansionary monetary policy stance. With the incoming information available, it now considers its ‘appropriate to continue with the normalization of monetary policy ion the coming months’. At the same time, the inflation problem in Argentina remains of a much different degree. The centrale bank yesterday raised its ‘leliq’ policy rate from 38% to 40% after it was left unchanged for more than a year. Inflation in Argentina is hovering around 50%. The IMF, in negotiations of a new schedule for the countries repayments to the Fund, asked Argentina to raise interest rates above the inflation rate.
Japanese eco data published this morning showed a mixed picture. The December Tokyo headline CPI, which is published well ahead of the national release, is gradually trading higher from 0.5% to 0.8%. The ‘core measure’ excluding fresh food also rose from 0.3% to 0.5%. At the same time, November spending data raised questions on any sustained reflationary dynamics. Even before the impact of the omicron variant hit activity, household spending unexpectedly declined 1.2% M/M in November. The spending was also 1.3% below the level recorded last year. Real cash earnings printed unchanged in November (0.0% Y/Y). Higher domestic spending supported by higher wages and an accommodative fiscal policy is an import component of the recovery strategy from the new government.