

Sample Category Title
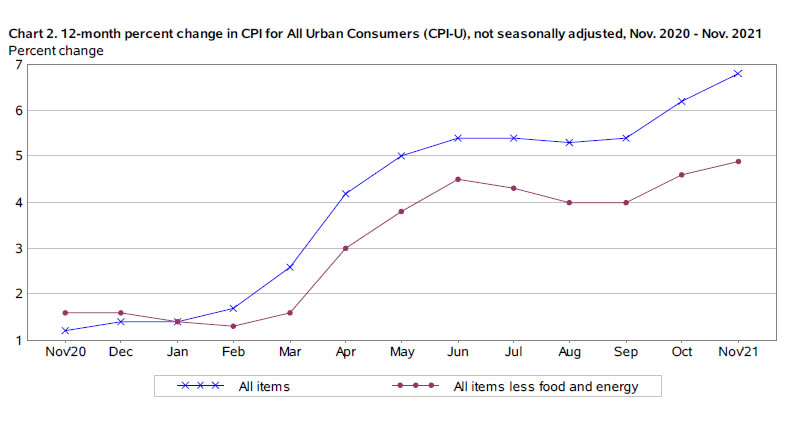
US CPI rose to 6.8% yoy, highest since 1982
US CPI rose 0.8% mom in November, above expectation of 0.7 % mom. For the 12-month period, CPI accelerated to 6.8% yoy, up from 6.2% yoy, matched expectations. That's the highest rate since June 1982.
CPI core rose 0.5% mom, matched expectations. CPI core accelerated to 4.9% yoy, up from 4.6% yoy, matched expectations. Energy index rose 33.3% yoy. Both are highest level in at least 13 years.
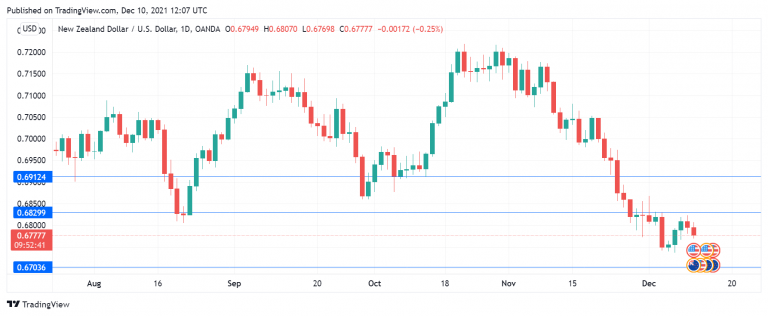
New Zealand Dollar Extends Losses
The New Zealand dollar is in negative territory for a second straight day. In the European session, NZD/USD is trading at 0.6778, down 0.23% on the day.
Soft manufacturing data weighs on NZD
This week’s New Zealand manufacturing data pointed to weaker growth in the manufacturing sector. Manufacturing Sales fell -2.2% in Q3, after two quarters of growth. The markets had forecast a strong gain of 4.2%. This was followed by the Manufacturing PMI for November, which slowed to 50.6, which indicates stagnation. The PMI fell from 54.2 in October. Manufacturing continues to be hampered by supply shortages, which could make for soft manufacturing numbers in the fourth quarter.
US CPI projected to hit 7.0%
All eyes will be on today’s US inflation report for November. The consensus is that CPI will accelerate to 7.0% y/y, which would be up from the October rate of 6.2%. If CPI hits the 7-mark or higher, it would reinforce expectations that the Fed will double its taper at the January meeting to USD 30 billion/mth. This means that the Fed’s bond purchase programme would end in March instead of June, and would allow the Fed to begin raising rates early in the second quarter. This would be bullish for the US dollar.
The Fed is not the only one worried about soaring inflation. President Biden is feeling the heat from hot inflation in his popularity numbers, as unhappy consumers look for someone to blame for rising prices. Biden recently took aim at the oil companies for gouging customers at the gas pump, but there’s little the President can do to keep gas prices down, as he found out when his order to release oil from the Strategic Petroleum Reserve failed to make a dent in high oil prices.
NZD/USD Technical
- There is resistance at 0.6829 and 0.6912
- NZD/USD has support at 0.6703, protecting the 67 level. Below, there is support at 0.6660
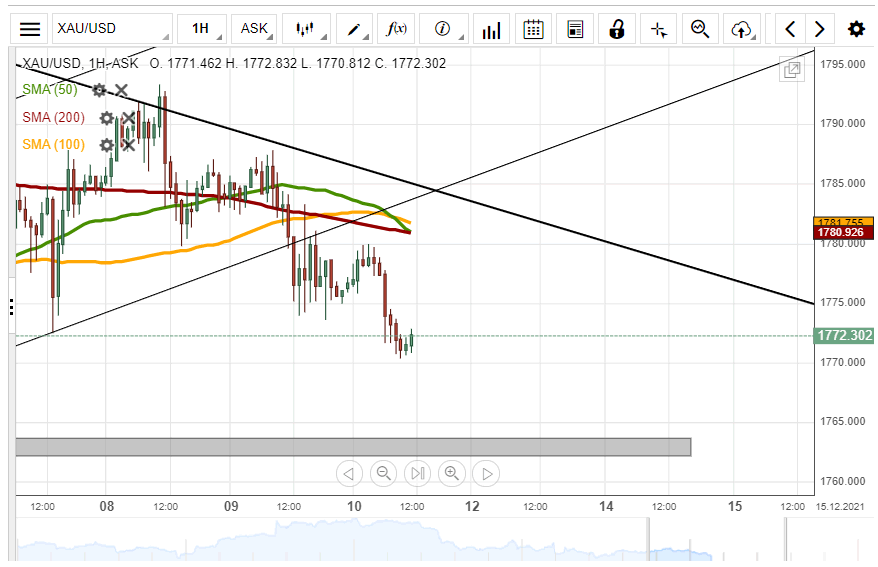
GOLD Continues To Decline
In general, since mid-Thursday, the price for gold has been fluctuating between round price levels. Namely, the 1,780.00 mark acted as resistance and the 1,775.00 and 1,770.00 are acting as support. It can be expected that the bullion continues to be impacted by price levels.
If the price continues to decline, it would eventually reach the December low levels at 1,762.20/1,763.80. Below this level, the next target could be the 1,750.00 mark.
A recovery of the price might find resistance in round price levels until it reaches the combined resistance of the 50, 100 and 200-hour simple moving averages near 1,780.00.
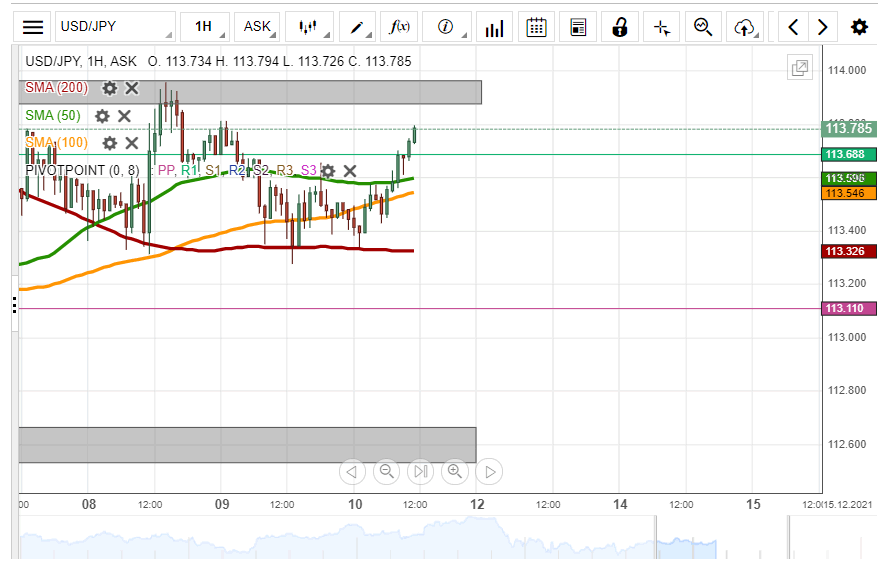
USD/JPY Surges On Friday
The 200-hour simple moving average has provided enough support for a surge to start. Namely, the rate is once again approaching the resistance zone at 113.88/113.97.
A passing of the high level zone at 113.88/113.97 might result in a surge to the weekly R2 simple pivot point at 114.53. However, note that the 114.00 and 114.50 levels might act as resistance.
Meanwhile, a decline of the pair is highly likely going to find support in the weekly R1 simple pivot point at 113.69, the 50 and 100-hour simple moving averages near 113.60 and the 200-hour SMA at 113.30.
GBP/USD Situation Is Unchanged
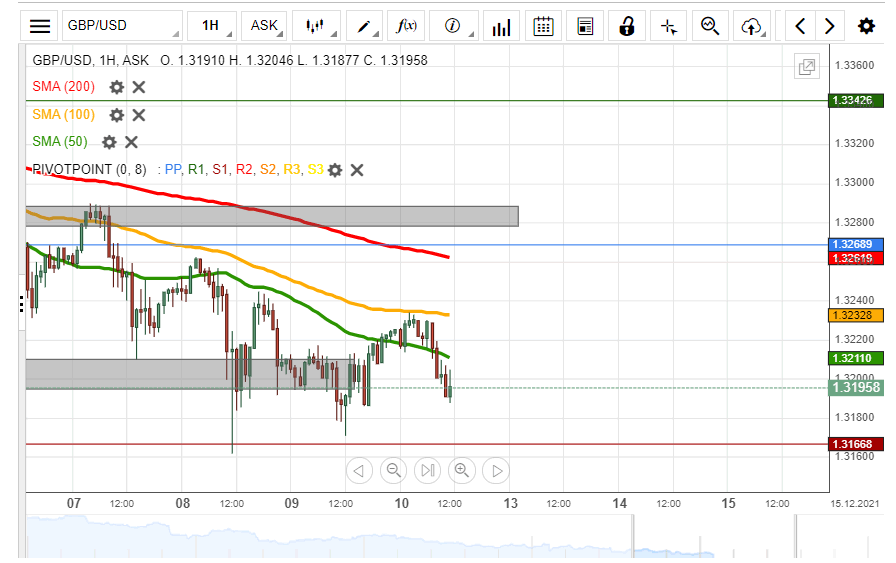
The situation on the GBP/USD chart has remained unchanged. The pair remains between the resistance of the 50 and 100-hour simple moving averages near 1.3210 and 1.3230 and the weekly S1 simple pivot point at 1.3167.
The GBP/USD rate would most likely decline, if it passes the support of the weekly S1 simple pivot point. A move below the pivot point would have no support as low as the 1.3100 mark and the weekly S2 at 1.3093.
Above the two SMAs, next close by resistance was the weekly simple pivot point at 1.3269, the 200-hour SMA at 1.3260 and this week's high levels above 1.3280.
EUR/USD Continues To Decline
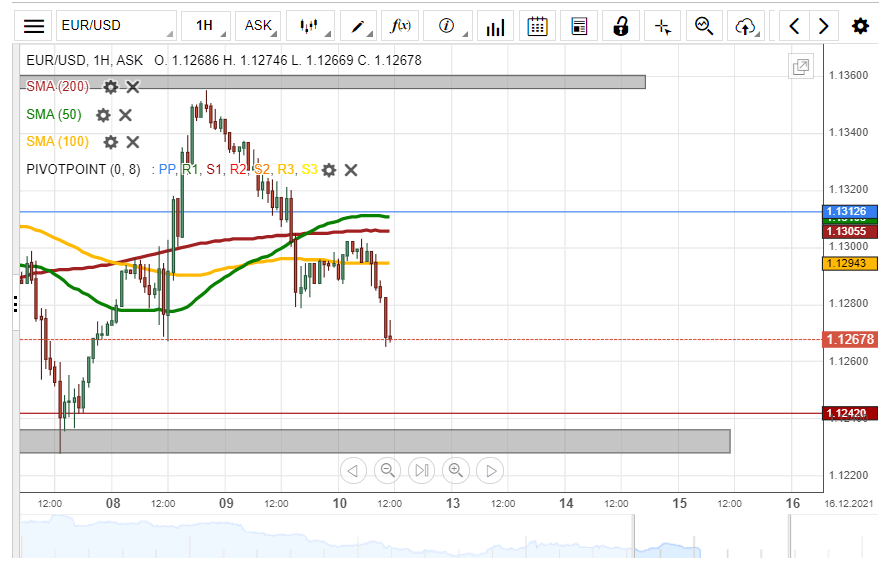
The EUR/USD passed the support of the 50, 100 and 200-hour simple moving averages on Thursday. By the middle of Friday's trading, the pair had reached below 1.1270.
A continuation of the decline might find support in the weekly S1 simple pivot point at 1.1242 and the support zone of the low levels at 1.1228/1.1236. Further below, note the November low level at 1.1186.
On the other hand, a potential recovery might find resistance in the weekly simple pivot point at 1.1313 and the hourly simple moving averages in the 1.1295/1.1310 range.
Euro Edges Lower, US CPI Looms
The euro is slightly lower on Friday. In the European session, EUR/USD is trading at 1.1271, down 0.19% on the day.
Markets eye US CPI
With no tier-1 releases out of the eurozone today, the euro is trading quietly. That could change in the North American session, when the US releases the November inflation reports. The consensus is that CPI will accelerate to 7.0% y/y, which would be up from the October rate of 6.2%. If CPI provides an upside surprise, it would raise speculation that the Fed will double its taper at the January meeting. That would raise the chances of an earlier rate hike and boost the US dollar. Fed Chair Powell retired the phrase “transitory inflation” and it appears that the Fed has accepted that hot inflation isn’t going anywhere.
The ECB holds a policy meeting next week, and high on the agenda is the bank’s monetary support for the eurozone economy. The ECB’s 1.85 trillion euro emergency pandemic programme, the PEPP, has been in place since March 2020. Although the eurozone continues to struggle with Covid, the economy is showing improvement and the bank plans to wind up PEPP in March 2022. The burning question is what to do with the bank’s Asset Purchase Programme (APP), which has been utilized to keep inflation close to the 2% target and is running at 20 billion euros per month. The ECB is expected to maintain the pace of the APP, while giving itself some flexibility to increase QE if needed. In a research note, Danske Bank referred to the expected ECB move as “baby steps towards normalization”. The heavily indebted members of the bloc, such as Greece, have voiced concern that that the removal of the PEPP could result in ‘cliff effect’ which would hurt these poorer countries.
EUR/USD Technical
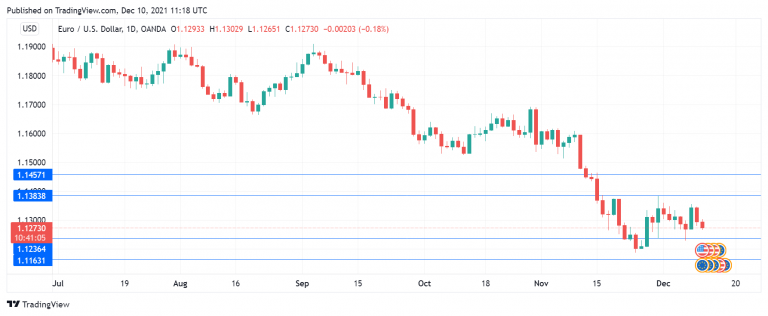
- EUR/USD has support at 1.1236 and 1.1163
- The next resistance lines are 1.1383 and 1.1457
NZD/USD: Bears Are Moving The Price Towards The First Target
NZD/USD technical analysis
- Bearish configuration.
- Downtrend continues.
- M L3 is the first target.
- NZD is weak.
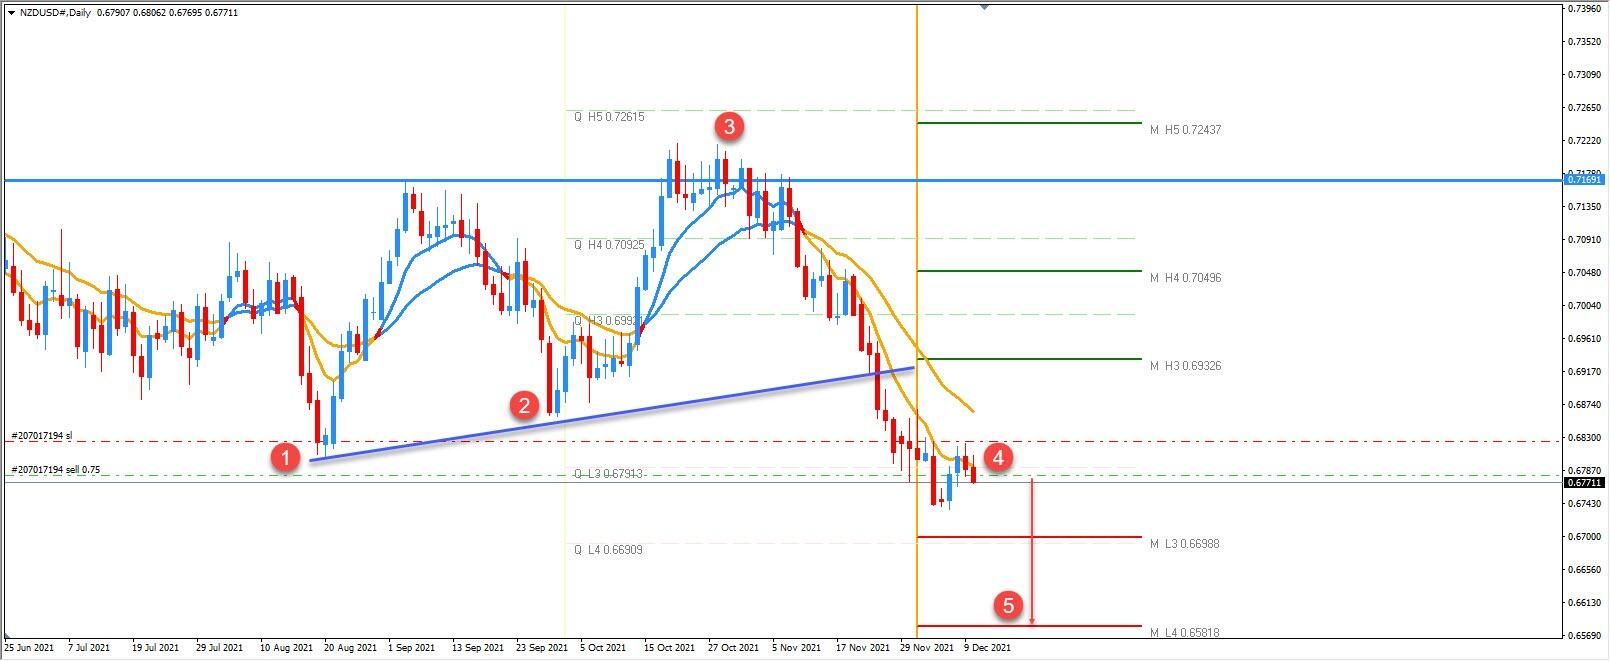
- Swing low.
- Higher low.
- Swing high.
- Entry zone.
- Final target.
The NZD/USD is bearish. We can see a strong downtrend in progress. This is a good opportunity to short the NZD/USD as this is the positional trade. We can clearly see a downtrend progression and the point 4 is entry zone. Shorts are bound to continue lower to the first target. M L3 - Q L4 camarilla pivot is the first target. So the entry is around 0.6770, the first target is 0.6698 and the final target is 0.6580. The final target can only be reached if 0.6690 breaks lower and/or the daily candlestick closes below that level.
GBPJPY Broader Uptrend Defended By Support Base
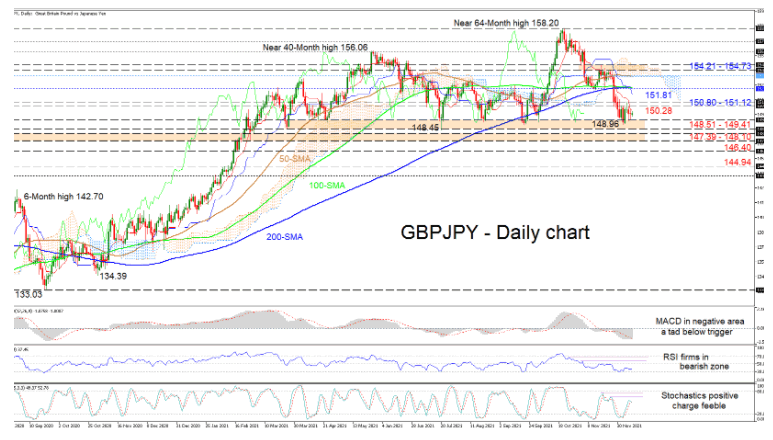
GBPJPY has once again found its feet around the critical 148.51-149.41 support base after a six-week decline from the more than 5-year high of 158.20. The steadier simple moving averages (SMAs) are endorsing a more sideways market in the near-term.
That said, the falling Ichimoku lines are indicating that negative forces have yet to fully diminish, while the short-term oscillators are transmitting mixed signals in directional momentum. The MACD, some distance below the zero mark, is flattening towards its red trigger line, while the RSI is static in the bearish region. The stochastic oscillator’s positive charge is fading but it has yet to confirm a credible negative command in the pair.
If the current trajectory endures, strong downside limitations may originate from the key 148.51-149.41 base, which has kept sellers at bay since March 24. In the event this significant barricade gives way, downside moves could snag at the neighbouring 147.39-148.10 support border, which is reinforced by the December 2019 rally peak of 147.95. Diving past this barrier too may spark worries about the broader positive structure. Sellers may then test the 146.40 low ahead of the 144.94 mark - identified around the end of February 2020 - before eyeing the 144.00 handle.
If buyers create traction off the key foundation, upside friction could commence from the red Tenkan-sen line at 150.28 ahead of the 150.80-151.12 resistance band. Next, a push beyond the blue Kijun-sen line at 151.81 and the joined 200- and 100-day SMA at 152.44 could pave the way for a test of the Ichimoku cloud’s lower band at 153.64. From here, should buyers manage to claw their way above the 154.21-154.73 resistance obstacle and the cloud, the 156.00 handle could be up for grabs.
Summarizing, in the bigger picture, GBPJPY remains skewed to the upside if the price holds above the 148.51-149.41 foundation. That said, a drop below the 147.39 trough could trigger downside worries in the pair, while a climb above the 200-day SMA at 152.44 could boost upside impetus.
Pound Yawns After Data Dump
The British pound has had a rather sleepy week, and the lack of activity has continued in Friday trade, as GBP/USD is hovering at the 1.32 line.
It has been a light calendar week for the UK, and today’s data dump didn’t have any effect on the drifting pound. The GDP report for September came in at 4.6% y/y, well short of the consensus of 6.6%. Manufacturing Production for September y/y slowed to 1.3%, shy of the forecast of 1.7%. Investors shrugged off the underperforming data, perhaps because they are more focused on two burning issues, Omicron and the BoE rate decision next week.
Omicron has caused some roller-coaster movement in the financial markets. There was a panic in late November, but risk sentiment than rebounded on reports that the variant was less severe than Delta. The World Health Organisation has said that it will have more data on Omicron in a couple of weeks. Although the symptoms appear to be relatively mild, Omicron is up to four times more contagious than Delta, and that has governments worried.
BoE rate move? Maybe
The UK has responded by implementing ‘Plan B’, which includes some health restrictions, such as wearing masks at public venues. Omicron is spreading quickly across the UK, and it’s unclear if Plan B will be enough to control the pandemic. The new health restrictions will likely cut into December/January holiday shopping and stoke inflation, as many shops will raise prices. We can expect a downgrade to Q1 2022 growth forecasts, and the wobbly pound will likely face further headwinds in the New Year.
The BoE holds its policy meeting next week, and whether the bank will press the rate trigger remains up in the air. The markets have priced in a 40% likelihood of a rate hike, making this a live meeting which could have a strong impact on the struggling British pound. The Omicron crisis has dampened the likelihood of a rate hike, and it was noteworthy that Michael Saunders, a hawkish member of the MPC, has stated that it may be prudent to hold off until we have more data about Omicron. If the markets have learned anything from last month’s shocker, when the BoE didn’t raise rates, it is not to make any assumptions when it comes to Andrew Bailey & Company.
GBP/USD Technical Analysis
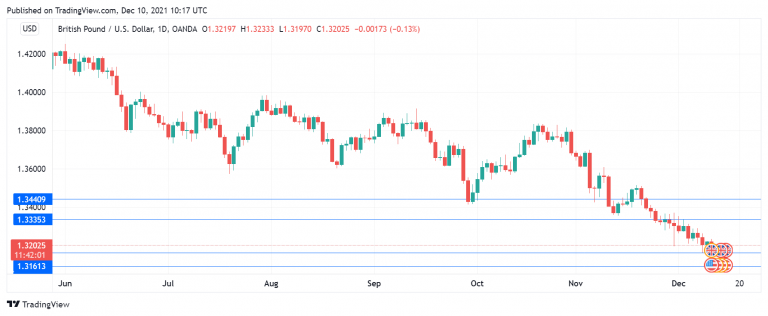
- GBP/USD has support at 1.3161 and 1.3091
- There is resistance at 1.3336 and 1.3441