

Sample Category Title
USD/JPY Mid-Day Outlook
Daily Pivots: (S1) 113.38; (P) 113.58; (R1) 113.76; More...
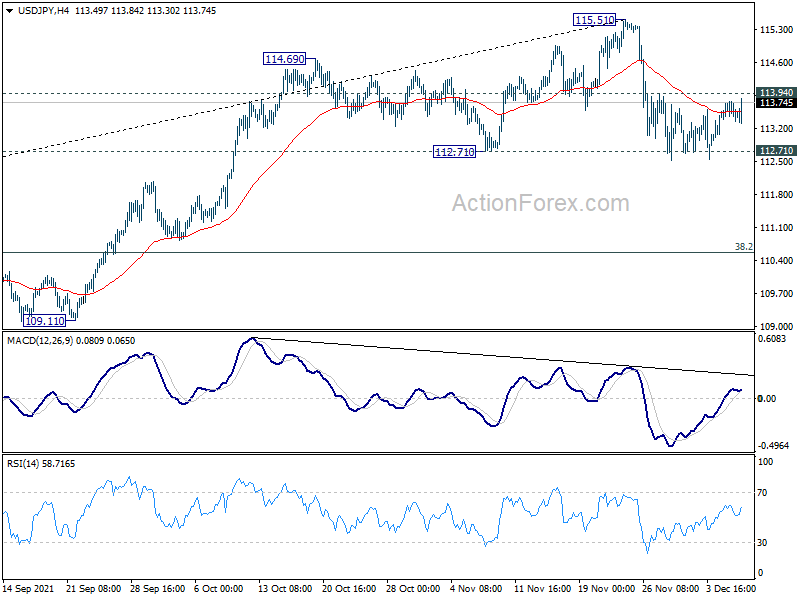
Intraday bias in USD/JPY remains neutral at this point. On the downside, sustained break of 112.71 will argue that it's already correcting whole rise from 102.58. Deeper fall would be seen to 38.2% retracement of 102.58 to 115.51 at 110.57. On the upside, break of 113.94 minor resistance will turn bias back to the upside for retesting 115.51 high instead.
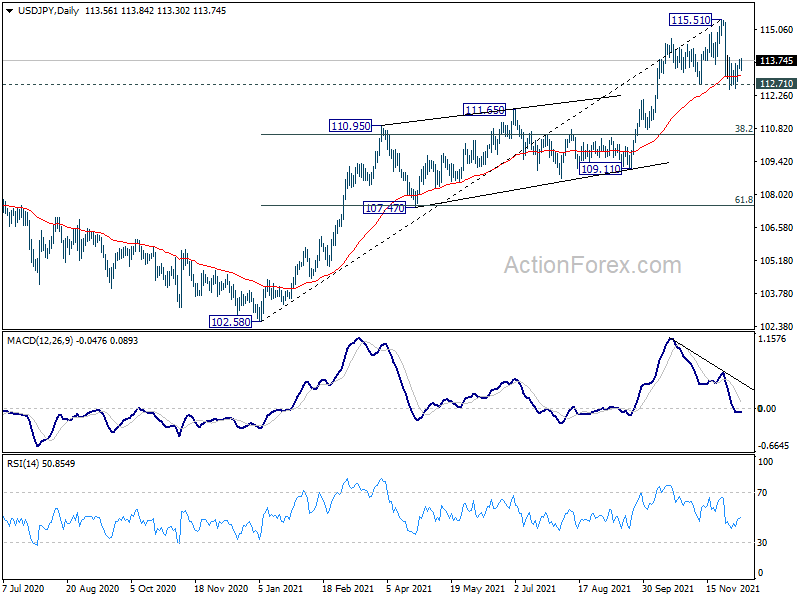
In the bigger picture, no change in the view that rise from 102.58 is the third leg of the up trend from 101.18 (2020 low). Such rally should target a test on 118.65 (2016 high) on resumption. However, firm break of 109.11 structural support will argue that the trend might have reversed and bring deeper fall to 107.47 support and possibly below.
EUR/GBP Mid-Day Outlook
Daily Pivots: (S1) 0.8494; (P) 0.8505; (R1) 0.8520; More...
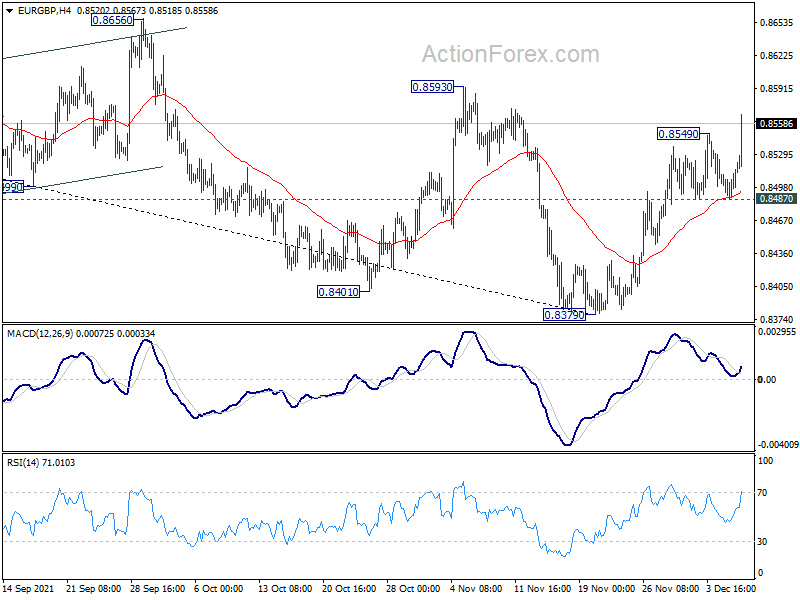
EUR/GBP's rise from 0.8379 resumed by breaking 0.8549 and intraday bias is back on the upside for 0.8593 structural resistance. Sustained break there will be the first sign of larger bullish reversal and target 0.8656 resistance next. On the downside, break of 0.8487 support is needed to indicate completion of the rebound. Otherwise, near term outlook will stay cautiously bullish in case of retreat.
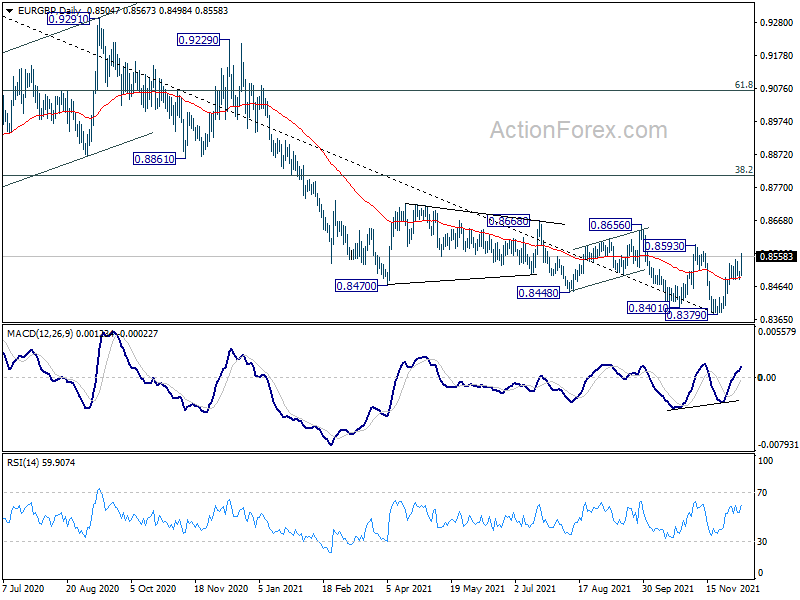
In the bigger picture, price actions from 0.9499 (2020 high) are still seen as developing into a corrective pattern. Deeper fall could be seen as long as 0.8593 resistance holds, towards long term support at 0.8276. We'd look for bottoming signal around there to bring reversal. Meanwhile, firm break of 0.8593 will now be an early sign of medium term bottoming. Further break of 0.8656 will pave the way to 38.2% retracement of 0.9499 to 0.8379 at 0.8807.
Sterling Tumbles as UK Said to Return to Restrictions, Pfizer News Lifts Sentiments
Much volatility is seen in the markets today, in particular in Sterling. The Pound tumbled sharply on news that the UK Government to going to activate a plan B and impose some restrictions as soon as on Wednesday, due to spread of Omicron. Yet, sentiments recovered After Pfizer said results from an initial laboratory showed their vaccine could neutralize Omicron after three doses. For now, Sterling is still the weakest one for today, while Euro and Aussie are the strongest.
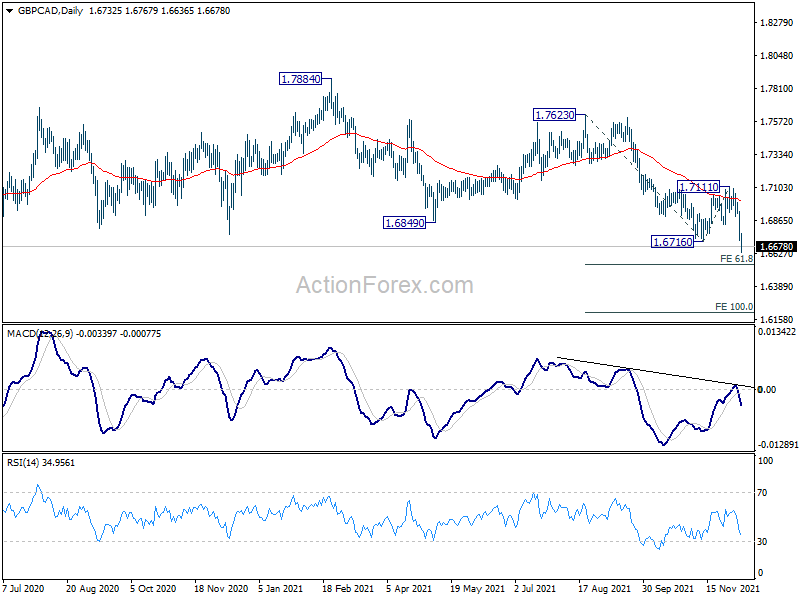
Technically, GBP/CAD dived through 1.6716 support today and hit as low as 1.6636 so far. Medium term down trend has resumed and next target would be 61.8% projection of 1.7623 to 1.6716 from 1.7111 at 1.6555. Firm break there will target 100% projection at 1.6204 next. We'll see if BoC meeting today could trigger downside acceleration in the cross.
In Europe, at the time of writing, FTSE is up 0.14%. DAX is down -0.49%. CAC is down -0.16%. Germany 10-year yield is up 0.092 at -0.365. Earlier in Asia, Nikkei rose 1.42%. Hong Kong HSI rose 0.06%. China Shanghai SSE rose 1.18%. Singapore Strait Times dropped -0.16%. Japan 10-year JGB yield dropped -0.0055 to 0.049.
ECB Kazaks: Don't preempt policy decisions because of Omicron uncertainty
ECB Governing Council member Martins Kazaks said in an interview that the PEPP emergency asset purchase program would still end as scheduled in March, despite Omicron.
"At the current moment, we don't know how the omicron variant will develop," Kazaks said. "Unless it spills over into significant and large negative revisions to the outlook for growth, I don't see that March -- which the market has been expecting for some time and which we've been communicating in the past -- should be changed."
"At the moment we simply know too little about omicron," he said. "I see it important to remain data-driven and make our decisions step by step. So react to the data, rather than preempt decisions when uncertainty is way too high."
"If in February we see that it's painful then of course we can change our views and that's the issue of flexibility," he said. "In my view, it's possible both to restart PEPP or increase the envelope if it turns out to be necessary."
On inflation, Kazaks said, "to exactly what level will it land in 2023-24, of course, there's lots of uncertainty." Nevertheless, "my baseline remains that it slides to below 2%."
BoJ Amamiya: No need to adjust large-scale monetary easing at present
BoJ Deputy Governor Masayoshi Amamiya said in a speech that Japan's inflation rate is still "far below the price stability target of 2 percent". CPI is projected to be just around 1% even in fiscal 2023, the end of the current projection period. Therefore, BoJ will "persistently continue with powerful monetary easing" under the current QQE with yield curve control.
While central banks in US and Europe have recently started adjusting their monetary policy, the situation is different in Japan. Amamiya said, "given the price developments in Japan I have described, I think it makes sense that the Bank does not actually need to adjust its large-scale monetary easing at present".
Also from Japan, GDP dropped -0.9% qoq in Q3, revised down from prior estimate of -0.8% qoq. GDP deflator dropped -1.2% yoy. Current account surplus widened to JPY 1.03T in October.
EUR/GBP Mid-Day Outlook
Daily Pivots: (S1) 0.8494; (P) 0.8505; (R1) 0.8520; More...
EUR/GBP's rise from 0.8379 resumed by breaking 0.8549 and intraday bias is back on the upside for 0.8593 structural resistance. Sustained break there will be the first sign of larger bullish reversal and target 0.8656 resistance next. On the downside, break of 0.8487 support is needed to indicate completion of the rebound. Otherwise, near term outlook will stay cautiously bullish in case of retreat.
In the bigger picture, price actions from 0.9499 (2020 high) are still seen as developing into a corrective pattern. Deeper fall could be seen as long as 0.8593 resistance holds, towards long term support at 0.8276. We'd look for bottoming signal around there to bring reversal. Meanwhile, firm break of 0.8593 will now be an early sign of medium term bottoming. Further break of 0.8656 will pave the way to 38.2% retracement of 0.9499 to 0.8379 at 0.8807.
Economic Indicators Update
| GMT | Ccy | Events | Actual | Forecast | Previous | Revised |
|---|---|---|---|---|---|---|
| 23:50 | JPY | GDP Q/Q Q3 | -0.90% | -0.80% | -0.80% | |
| 23:50 | JPY | GDP Deflator Y/Y Q3 | -1.20 | -1.10% | -1.10% | |
| 23:50 | JPY | Current Account (JPY) Oct | 1.03T | 0.98T | 0.76T | |
| 5:00 | JPY | Eco Watchers Survey: Current Nov | 56.3 | 57.8 | 55.5 | |
| 15:00 | CAD | BoC Interest Rate Decision | 0.25% | 0.25% | ||
| 15:30 | USD | Crude Oil Inventories | -0.9M |
S&P 500 Price Is At The Crossroads: Daily Candlestick Close Is Important
S&P 500 technical analysis
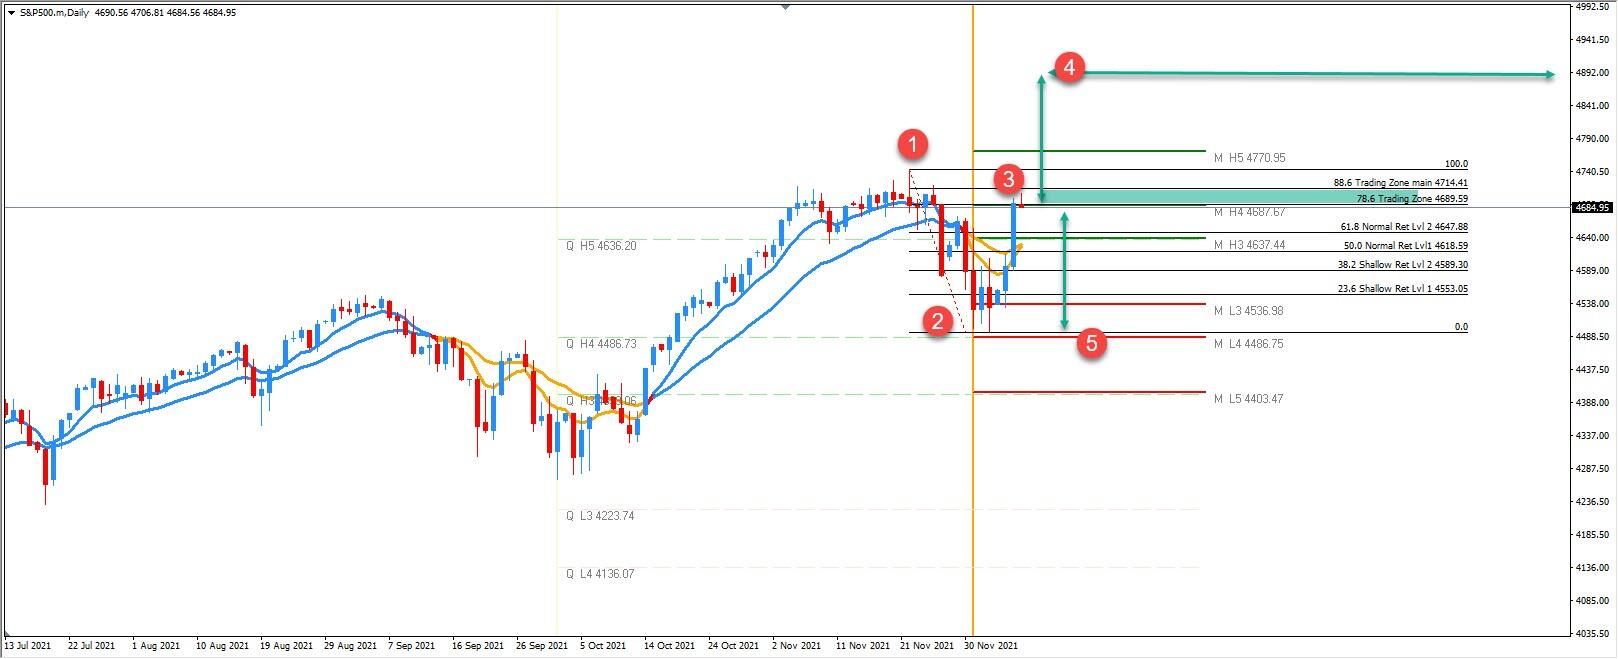
- S&P500 is bullish.
- The price might reject off 88.6.
- The market is at important level.
- It will bounce or reject.
Daily chart S&P 500
- Pinbar high.
- Swing low.
- The entry zone.
- Target High.
- Target Low.
The price is currently bouncing from the zone. We could see a continuation up or a move down depending on the daily close. The price is at the crossroads 4690-4715 is the trading zone. A bounce off the zone should be going towards 4892 while the drop might aim towards 4486. Watch the daily close and all levels in between. The SP500 also correlates very strongly to AUDJPY so watch also the movement on the AUDJPY pair. Equities generally highly correlate to JPY which is the risk on and risk off gauge. The daily close on the SP500 is important. Above or below the trading zone for the next direction.
Gold Recovers Ground After Bouncing At 1,761
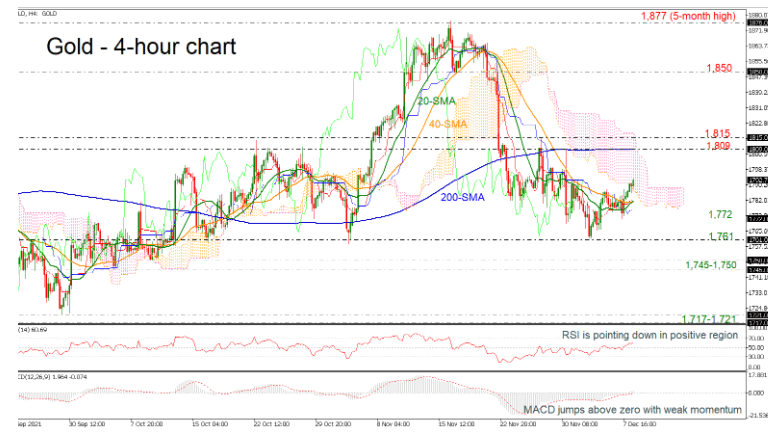
Gold prices are flirting with the Ichimoku cloud in the near-term after the positive move that started in the previous week from 1,761.
According to the technical indicators, the RSI is heading south in the positive region, while the MACD is trying to hold in the bullish area. The 20- and 40-period simple moving averages (SMAs) are ready to post a bullish crossover and the 200-period SMA is flattening.
If the price continues the upside structure, the next crucial level could come from the 200-period SMA, which overlaps with the 1,809 resistance. Slightly higher, the 1,815 barrier may halt the bullish actions before meeting 1,850.
On the flip side, a decline beneath the short-term SMAs could take the bears towards the immediate support of 1,772 and the 1,761 low. Below these obstacles, a lower low may take place around the 1,754-1,750 zone.
All in all, gold has been in a somewhat positive move over the last week and the bullish move may continue if the price overcomes the 200-period SMA at 1,809.
GOLD Breaks Resistance Levels
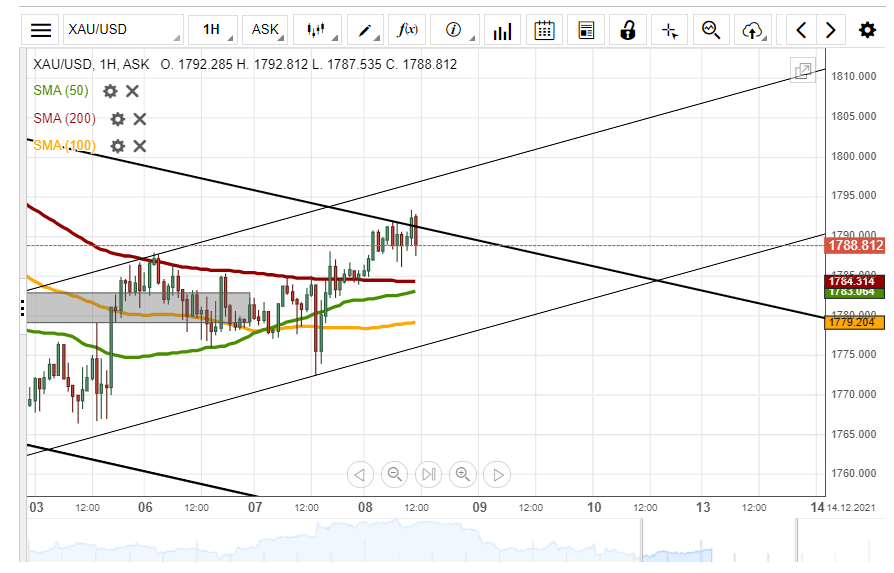
On Tuesday, the yellow metal's price passed the resistance of the 200-hour simple moving average. On Wednesday, the commodity reached above the upper trend line of the channel down pattern, which had guided the metal since last week.
If the bullion's price continues to surge, it would most likely test the resistance of the 1,800.00 mark and the upper trend line of a minor channel up pattern.
On the other hand, a decline might find support in the 50, 100 and 200-hour simple moving averages in the 1,780.00/1,785.00 zone. Below the SMAs, the lower trend line of the channel pattern might act as support.
USD/JPY Is Support By 200-Hour SMA
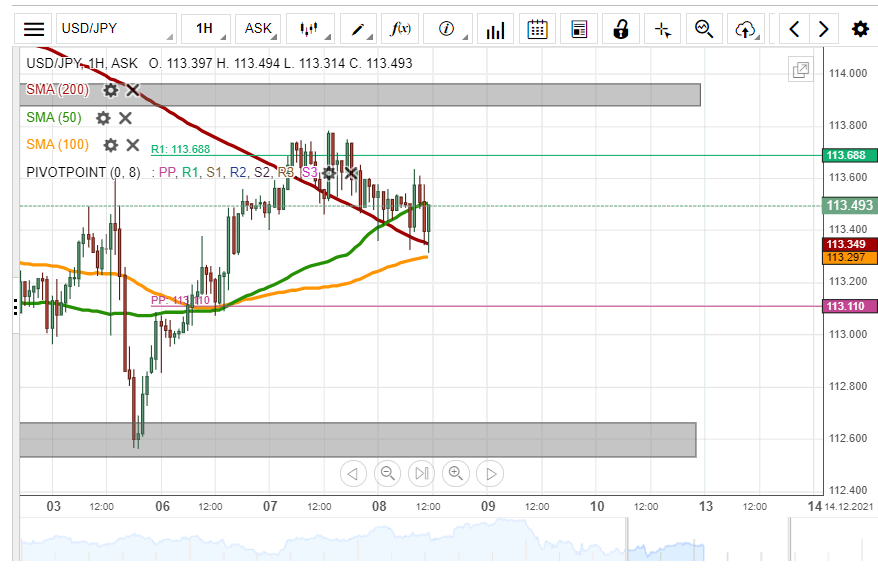
On Tuesday, the recovery of the USD against the Japanese Yen ended at the 113.75/113.78 zone. The rate failed to pass these levels after making three attempts.
Meanwhile, since early Tuesday trading, the pair has been finding support in the 200-hour simple moving average, which has been moving downwards. In addition, the 100-hour SMA had caught up with the pair.
If the USD/JPY continues to decline, it would have to pass the combined support of the 100 and 200-hour simple moving averages near 113.30. Below the SMAs, the weekly simple pivot point at 113.11 might act as support.
However, a move up by the currency exchange rate might find resistance in the 113.75/113.78 levels before aiming at the November 29 high level zone at 113.88/113.96.
GBP/USD Tests Support Zone
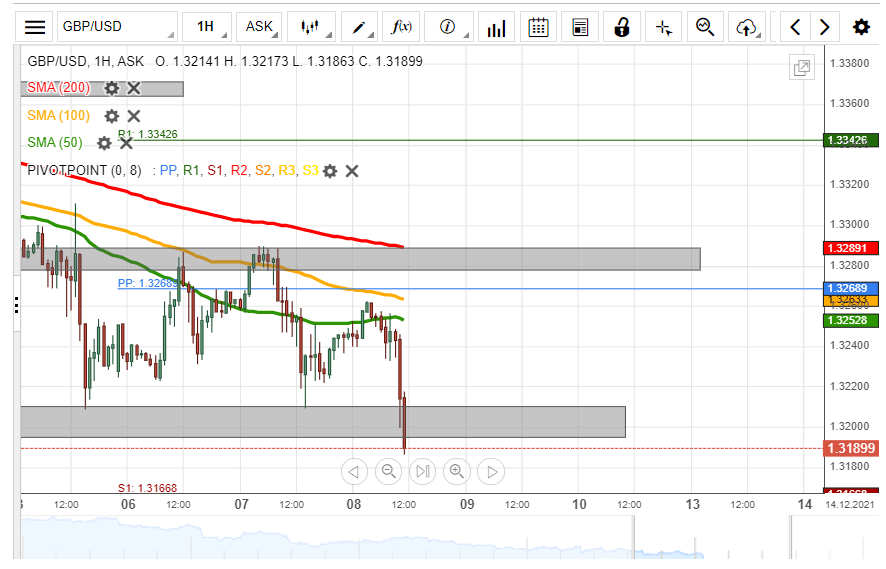
The GBP/USD currency exchange rate has been finding support in the 1.3195/1.3210 zone. However, the rate had retraced up to the resistance of the 100-hour simple moving average and the weekly simple moving average near 1.3265, before the second decline to the support zone.
In the case that the pair passes the support zone of 1.3195/1.3210, the GBP/USD might look for support in the weekly S1 simple pivot point at 1.3167. Further below, note the 1.3100 mark and the weekly S2 simple pivot point at 1.3093.
Meanwhile, a recovery of the GBP against the USD is highly likely set to encounter resistance in the 50, 100 and 200-hour simple moving averages, the weekly simple pivot point and this week's high level zone. All of these levels are located in the 1.3255/1.3290 zone.
EUR/USD Respects Simple Moving Averages
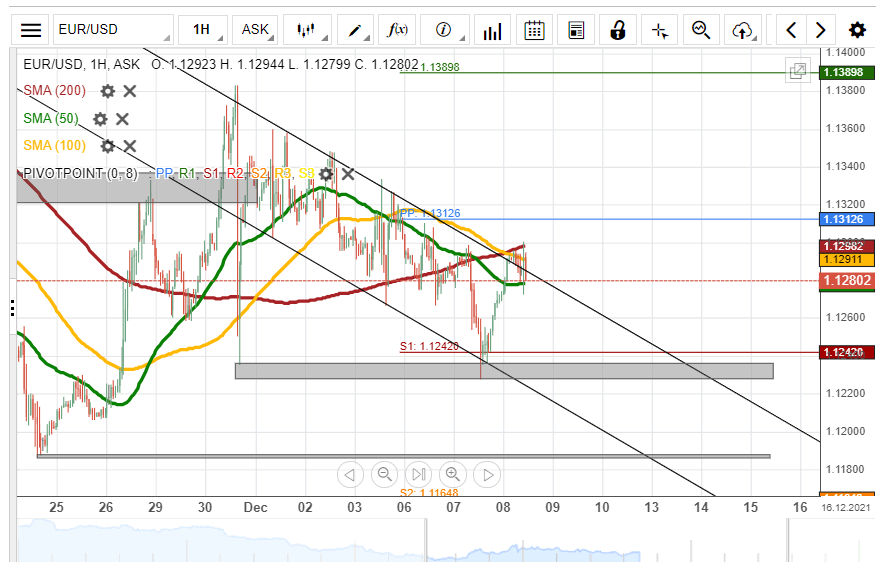
On Tuesday, the EUR/USD found support in the support levels near 1.1235. The event resulted in a surge, which passed the resistance of the channel down pattern. However, the rate started to respect the resistance of the 100 and 200-hour simple moving averages and the support of the 50-hour simple moving average.
If the EUR/USD breaks resistance of the 100 and 200-hour simple moving averages and the 1.1300 mark, a potential surge would encounter resistance at the weekly simple pivot point at 1.1313. Above the pivot point, there is no technical resistance as high as the weekly R1 simple moving average at 1.1390.
On the other hand, a move below the 50-hour SMA and the 1.1280 level might result in a decline to the combined support of the 1.1250 mark, the weekly S1 simple pivot point at 1.1242 and the support zone at 1.1228/1.1237.
The Analytical Overview Of The Main Currency Pairs
The EUR/USD currency pair
Technical indicators of the currency pair:
Prev Open: 1.1281
Prev Close: 1.1268
% chg. over the last day: -0.12%
Eurozone GDP growth estimate for Q3 remained at 2.2% as expected. German industrial production index unexpectedly grew by 2.8%; analysts had predicted an increase by 0.8%. However, there is a negative factor as well: the ZEW index of economic sentiment for Germany has become negative.
Trading recommendations
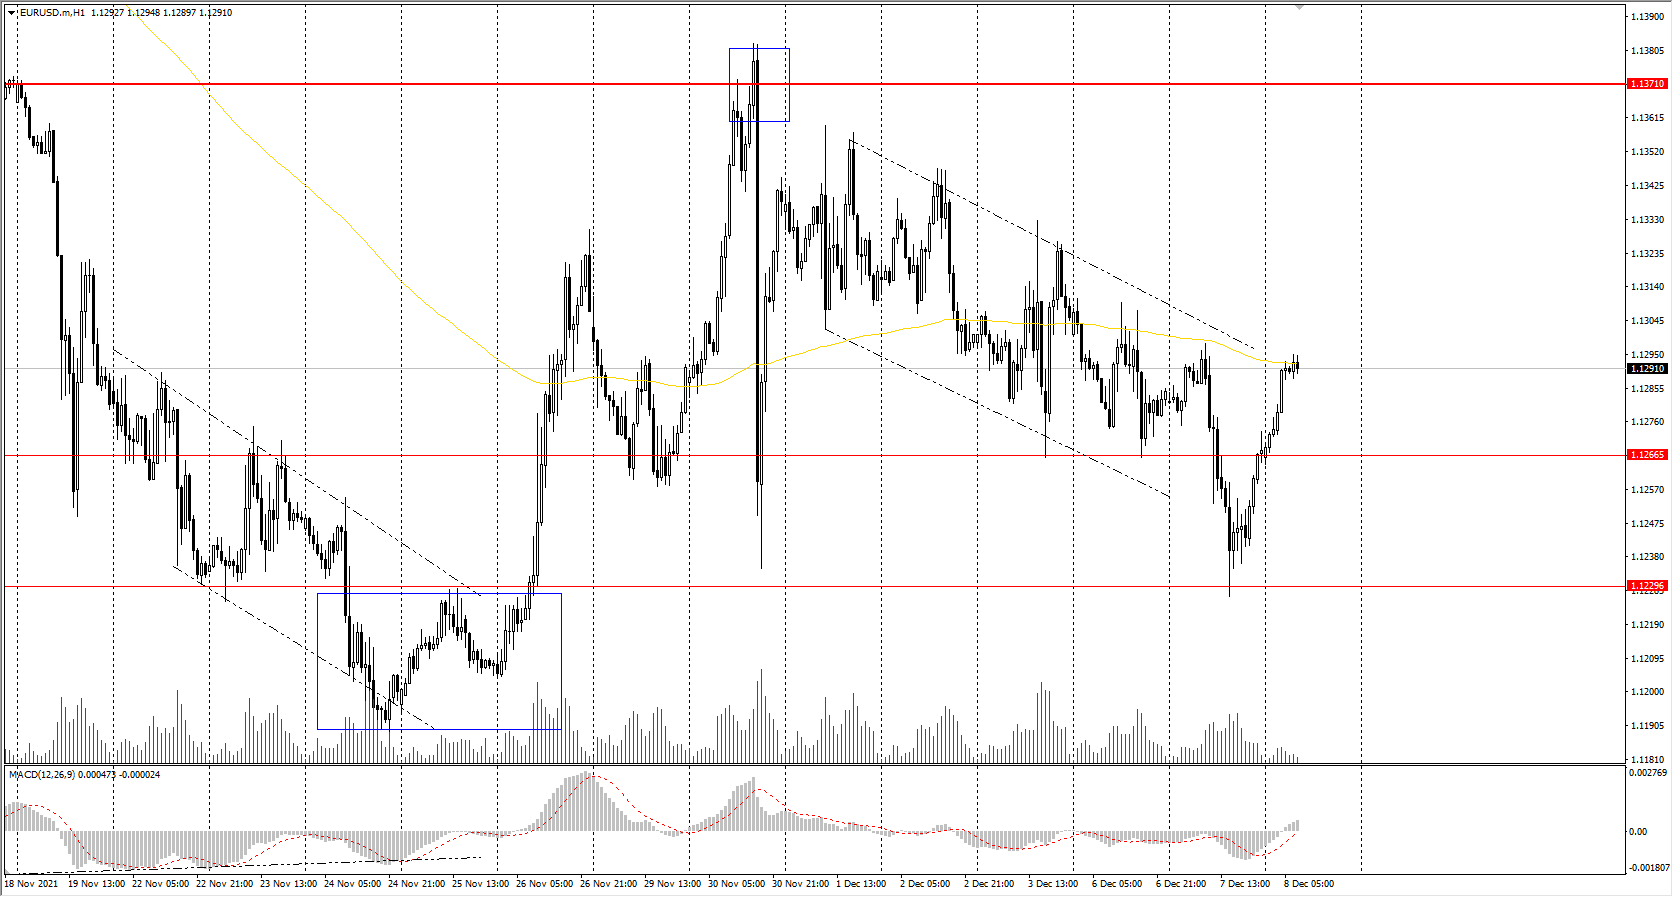
Support levels: 1.1266, 1.1230, 1.1168
Resistance levels: 1.1371, 1.1436, 1.1535, 1.1613, 1.1667, 1.1717
From a technical point of view, the EUR/USD on the hour time frame is still bearish. Yesterday, buyers showed initiative from the 1.1230 support level. At the moment, the price is trading near the moving average. The MACD indicator has become positive. Under such market conditions, traders should consider sell positions from the priority change level of 1.1371. Buy trades can be considered on lower time frames, but only with short targets.
Alternative scenario: if the price breaks out through the 1.1371 resistance level and fixes above, the mid-term uptrend will likely resume.
News feed for 2021.12.08:
- ECB President Lagarde’s Speech at 10:15 (GMT+2);
- US JOLTs Job Openings (m/m) at 17:00 (GMT+2).
The GBP/USD currency pair
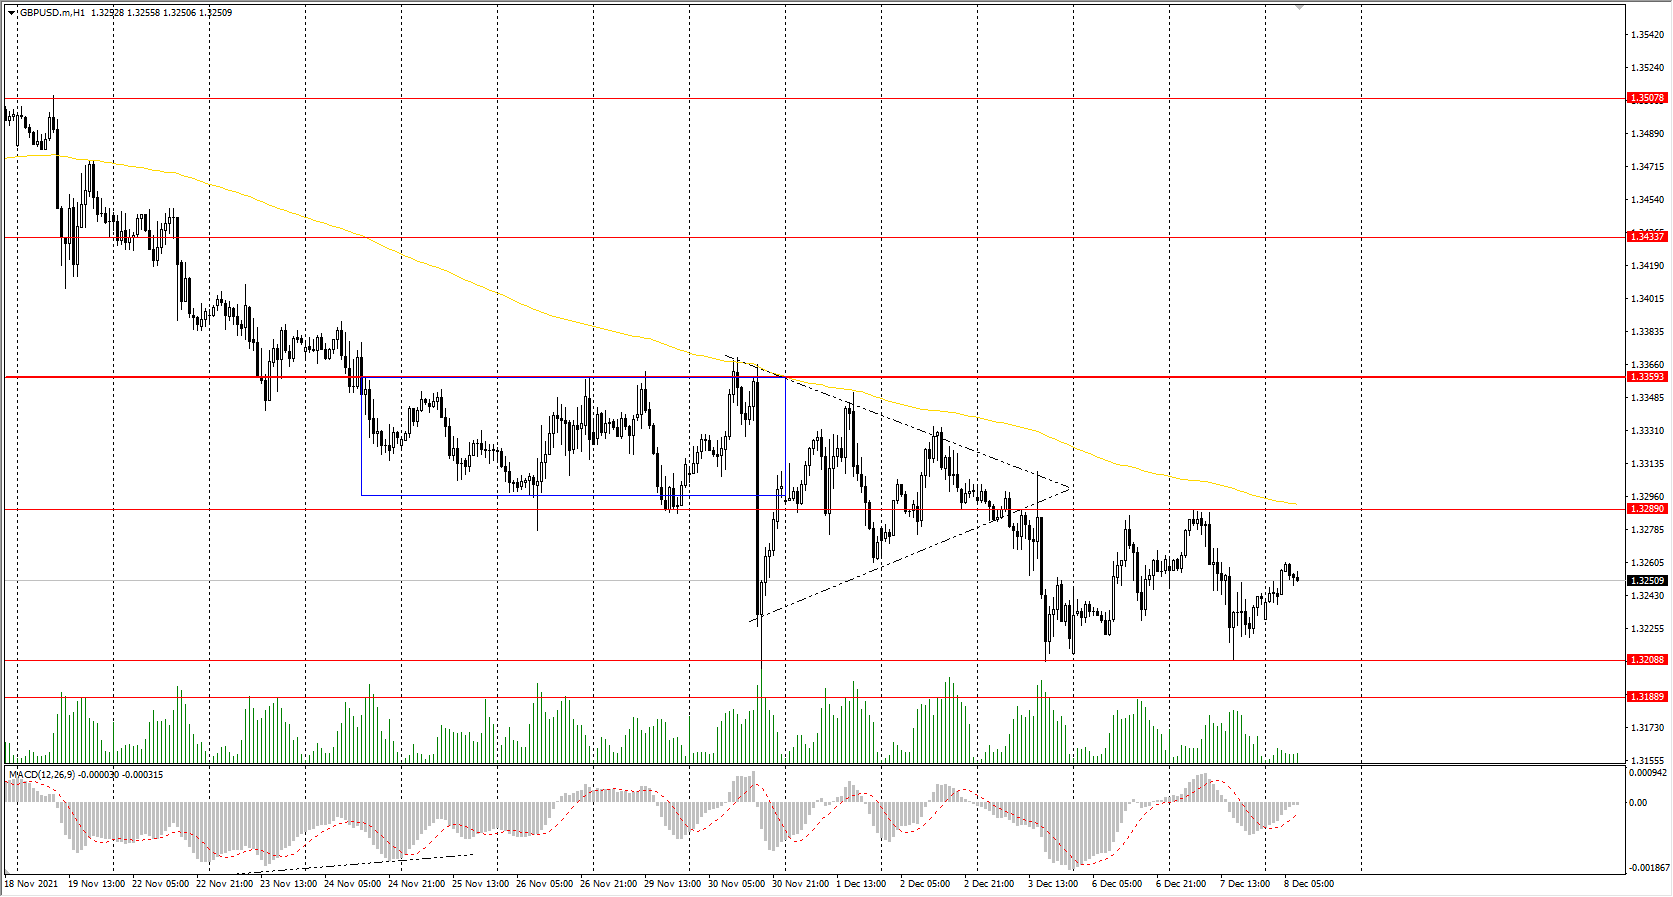
Technical indicators of the currency pair:
Prev Open: 1.3259
Prev Close: 1.3242
% chg. over the last day: -0.13%
The British pound is still under sellers' pressure as lending rates in pounds have fallen, signaling doubts among bankers about the Bank of England's future interest rate hike at the December 16 meeting.
Trading recommendations
Support levels: 1.3208
Resistance levels: 1.3289, 1.3360, 1.3434, 1.3507, 1.3575, 1.3685, 1.3748
On the hourly time frame, the trend on GBP/USD is bearish. The price is trading in the corridor again. The MACD indicator became inactive. Under such market conditions, traders should consider sell positions from the resistance levels around the moving average. Buy trades should be considered from the 1.3208 support level, but only with additional confirmation.
Alternative scenario: if the price breaks out through the 1.3359 resistance level and consolidates above, the bullish scenario will likely resume.
The USD/JPY currency pair
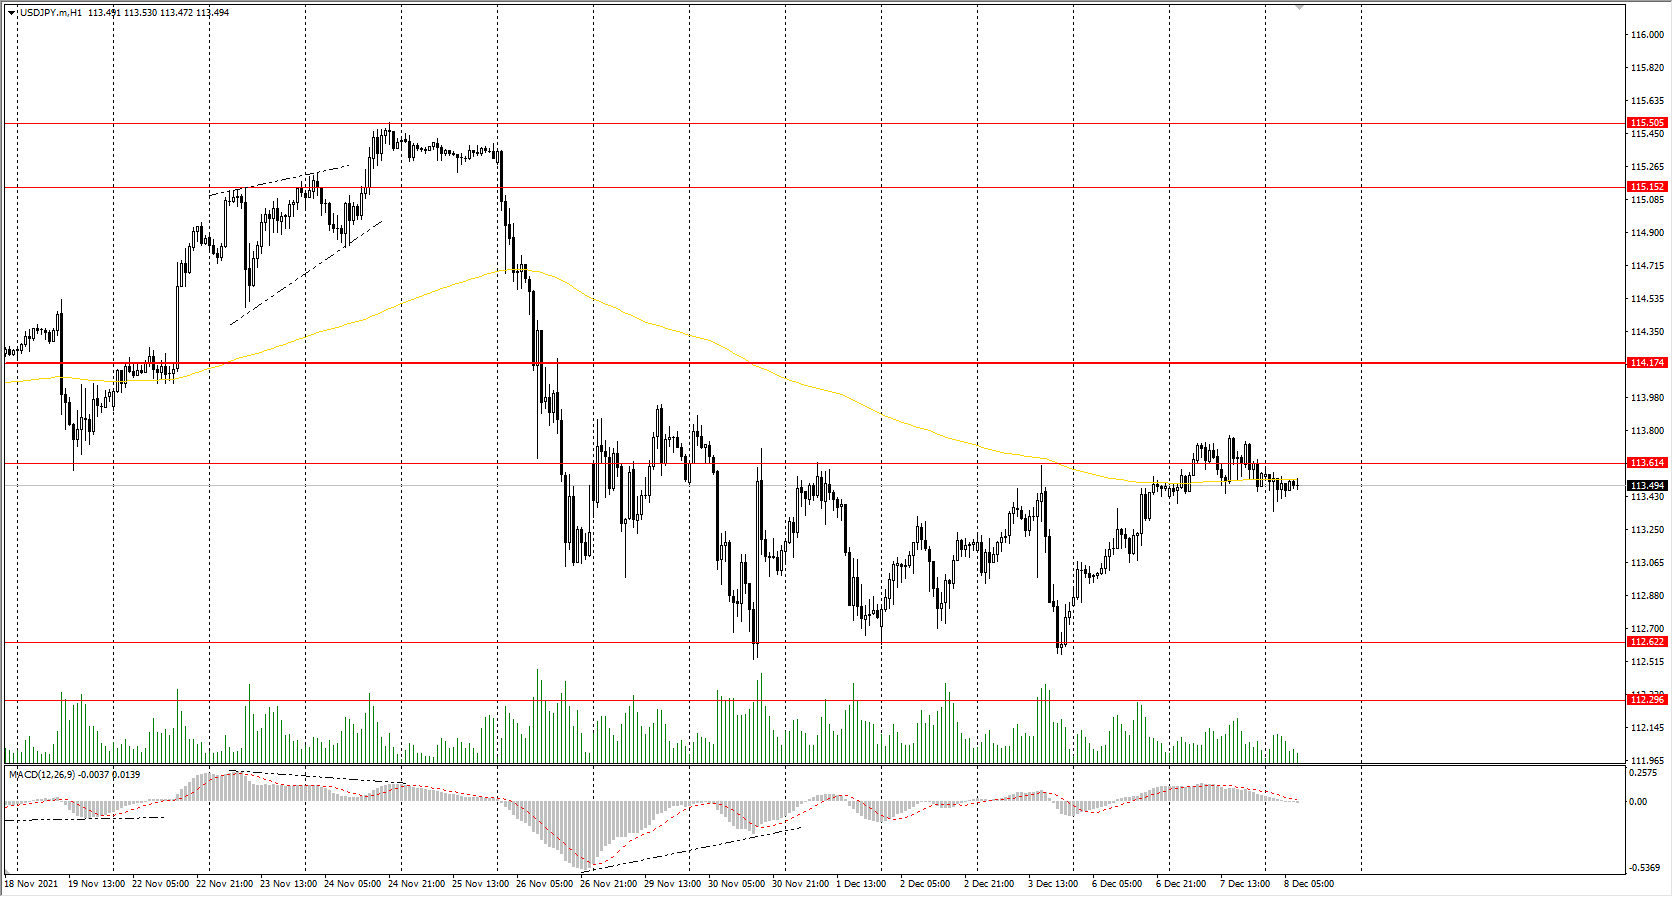
Technical indicators of the currency pair:
Prev Open: 113.43
Prev Close: 113.56
% chg. over the last day: +0.11%
The Japanese yen is declining against the US dollar since the risks associated with the Omicron strain are decreasing. Last month, the government announced a record $490 billion spending package to support the economy, contradicting the global trend to cancel crisis mode stimulus measures. Japan's central bank policy will negatively impact the national currency (growth of USD/JPY quotes) in the medium term.
Trading recommendations
Support levels: 113.61, 112.62, 112.30
Resistance levels: 114.48, 115.15, 115.50
The global trend on the USD/JPY currency pair is bearish. At the moment, the price is trading in the corridor, but the pressure of buyers is high. Under such market conditions, it is best for traders to look for sell positions from the resistance levels around the moving average or from the upper border of the corridor, but with additional confirmation. Buy positions should be considered from the lower border of the corridor, but with additional confirmation in the form of a buyers' initiative.
Alternative scenario: if the price rises above 114.17, the uptrend will likely resume.
News feed for 2021.12.08:
- Japan GDP (q/q) at 01:50 (GMT+2).
The USD/CAD currency pair
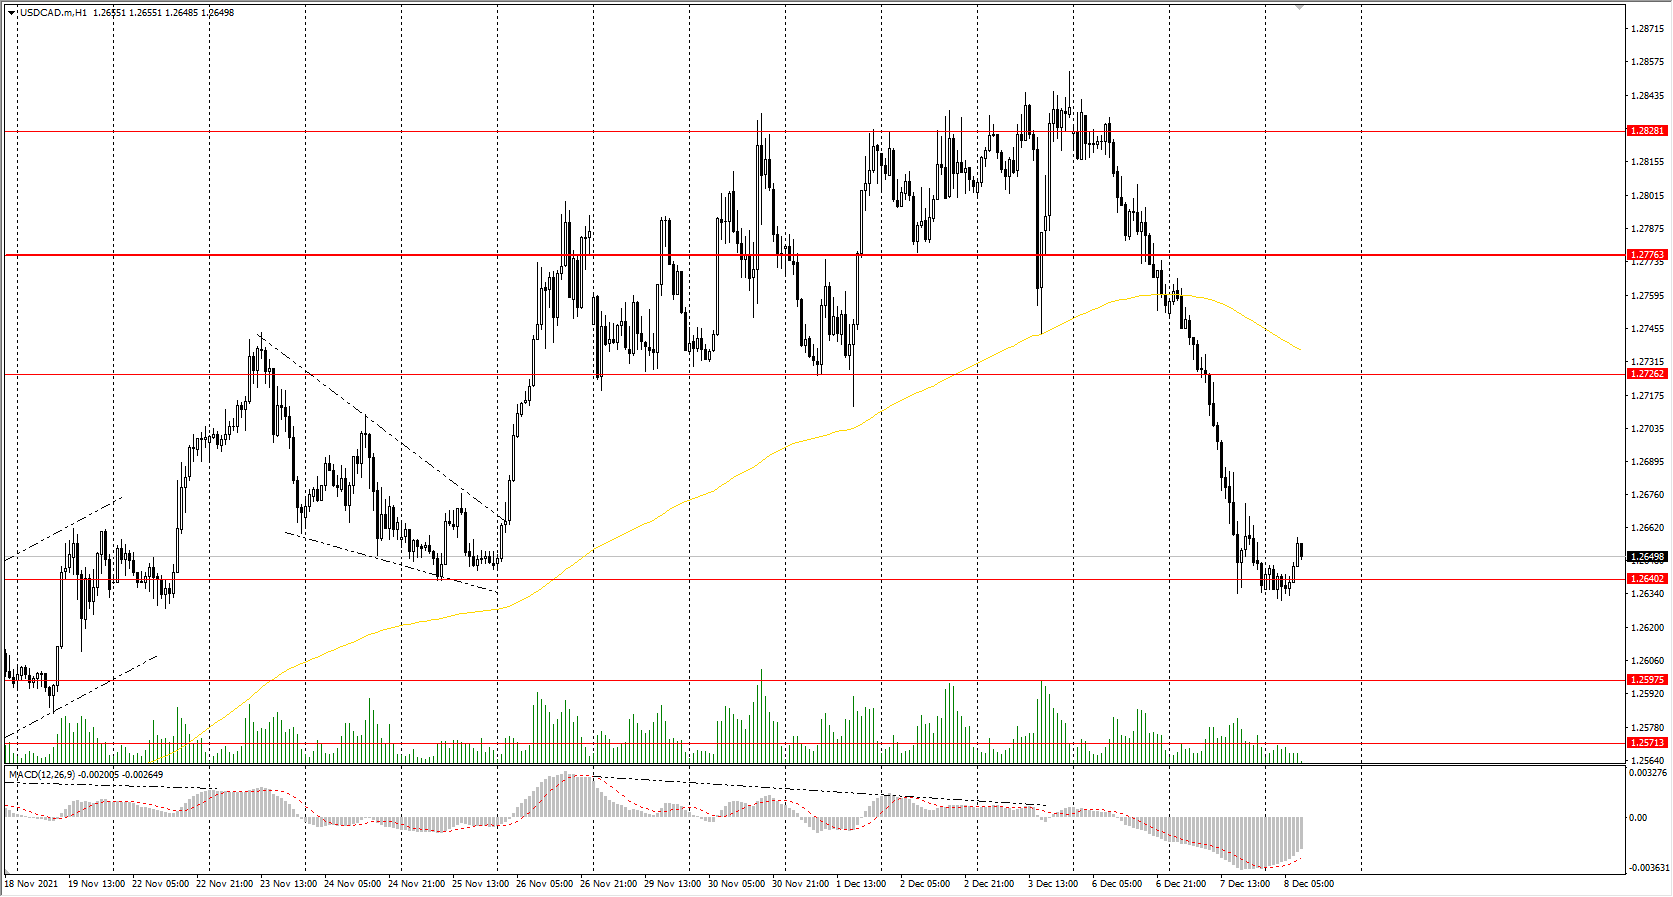
Technical indicators of the currency pair:
Prev Open: 1.2752
Prev Close: 1.2637
% chg. over the last day: -0.91%
The Canadian dollar is strengthening amid rising oil prices and as the Central Bank of Canada seeks to raise interest rates. Last week, a Reuters forecast with 32 strategists showed that the Canadian dollar would strengthen by 2.4% to 1.25 per US dollar in three months. The Bank of Canada will publish interest rate data and further monetary policy plans today.
Trading recommendations
Support levels: 1.2640, 1.2571, 1.2483, 1.2416, 1.2388
Resistance levels: 1.2726, 1.2828
From a technical point of view, the USD/CAD currency trend has changed to bearish. The MACD indicator became negative. At the same time, the sellers' pressure increased. Under such market conditions, it is better to look for buy trades from the 1.2640 support level, but only after additional confirmation in the form of a buyers' initiative. It is better to consider sell deals from the resistance levels near the moving average.
Alternative scenario: if the price breaks out through the 1.2776 resistance level and fixes above, the downtrend will likely be broken.
News feed for 2021.12.08:
- Canada BoC Interest Rate Decision (m/m) at 17:00 (GMT+2);
- Canada BoC Rate Statement (m/m) at 17:00 (GMT+2).