

Sample Category Title
New Omicron Strain Could SLow Global Economic Recovery
COVID-19 is becoming a major topic for investors once again amid fears that a new virus strain Omicron could slow the global economic recovery after a nearly two-year pandemic. Until Friday, investors were optimistic about the strength of the global economic recovery amid widespread availability of vaccines and advances in treatment, despite concerns about steadily rising inflation. But late last week, global stock markets lost $3.3 trillion in market value as investors faced a question of whether they were too early to discount a possible pandemic resolution due to the emergence of a new strain of coronavirus in South Africa. Although there is still little about a new version, scientists said it has a large number of mutations that could make it resistant to vaccines and more easily transmissible than the Delta variant. But there is positive news. On Sunday, the South African Medical Association chairman said the new variant of the Omicron coronavirus, though more contagious, causes mild illness without obvious symptoms.
The US stock market closed Friday in the red zone. By the close of the stock market Dow Jones decreased by 2.53% (-2.73% for the week), S&P 500 dropped 2.27% (-2.42% for the week), NASDAQ technology index lost 2.23% (-3.43% for the week) and became the leader of the fall among the main US indices. But the stocks of energy, financial, and tourism companies took the heaviest hit, which was caused by the detection of a new strain of coronavirus. The Cboe Volatility Index (VIX), also called Wall Street's "fear index," jumped 40% on Friday, the maximum value since January 2021.
European stock indices also followed a general panic wave of sell-offs amid a new strain. The British FTSE 100 index decreased by 3.64% on Friday (-2.49% for the week), Italian FTSE MIB lost 4.60% (-5.49% for the week), French CAC 40 decreased by 4.75% (-5.48% for the week), Spanish IBEX 35 decreased by 4.96% (-4.42% for the week), and German DAX index fell by 4.15% and became the leader of the fall with -5.75% for the week. Germany, Spain, and France will release inflation data on Monday and Tuesday. As inflation rises, the ECB is increasingly being called on to tighten monetary policy, but with Europe struggling with a new outbreak of the virus and news of a new strain, policymakers have a new argument for keeping the stimulus program as long as possible.
Gold increased more than 1% on Friday, rising above the $1,800 an ounce level, as investors began looking for safer assets after discovering a new strain of the coronavirus. But let's not forget that gold and silver prices are inversely correlated with the dynamics of US Treasury yields, which are trending upward amid the QE reduction. Thus, fundamentally, the precious metals prices will have a negative dynamic until the middle of the next year.
Oil prices fell $10 a barrel on Friday, the biggest one-day drop since April 2020, as news of the new Omicron option caused many countries to rush to limit travel, which strengthened the concerns that in the first quarter of next year there may be an excess supply. Also, traders shouldn’t forget about the release of strategic reserves by the US and several other consuming countries (Japan, South Korea, India, China, and others). Crude oil prices fell 13.1% on Friday, the 9th biggest one-day decline on record.
Asian stock indices also closed Friday in negative territory. Japan's Nikkei index decreased by 2.53% (-3.00% for the week), Australia's ASX 200 lost 1.73% (-1.58% for the week), China's benchmark CSI 300 index decreased by 0.74% (-0.72% for the week), and Hong Kong's Hang Seng lost 2.67%, closing the week down 3.90%, making it the biggest Asian decline.
At the commodities market, futures on natural gas (+7.43%) and corn (+1.07%) showed the biggest gains as of the end of the week. Futures on WTI oil (-13.04%), Heating oil (-12.36%), Brent oil (-11.35%), palladium (-5.11%), cocoa (-4.86%), copper (-4.04%), cotton (-3.33%), orange juice (-3.31%), lumber (-2.78%), sugar (-2.66%), and platinum (-2.3%) showed the biggest fall.
Main market quotes:
- S&P 500 (F) 4,594.62 −106.84 (−2.27%)
- Dow Jones 34,899.34 −905.04 (−2.53%)
- DAX 15,257.04 −660.94 (−4.15%)
- FTSE 100 7,044.03 −266.34 (−23.64%)
- USD Index 96.07 −0.70 (−0.73%)
Important events for today:
- Japan Retail Sales at 01:50 (GMT+2);
- Japan BoJ Gov Haruhiko Kuroda’s Speech (Tentative);
- Germany Prelim Consumer Price Index (m/m) at 15:00 (GMT+2);
- US Pending Home Sales (m/m) at 17:00 (GMT+2);
- ECB President Lagarde’s Speech at 19:15 (GMT+2);
- US FOMC Member Clarida’s Speech at 20:00 (GMT+2);
- Canada BoC Gov Macklem’s Speech at 21:00 (GMT+2);
- US FOMC Member Williams’s Speech at 22:00 (GMT+2);
- US Fed Chair Powell’s Speech at 22:05 (GMT+2).
The Analytical Overview Of The Main Currency Pairs
The EUR/USD currency pair
Technical indicators of the currency pair:
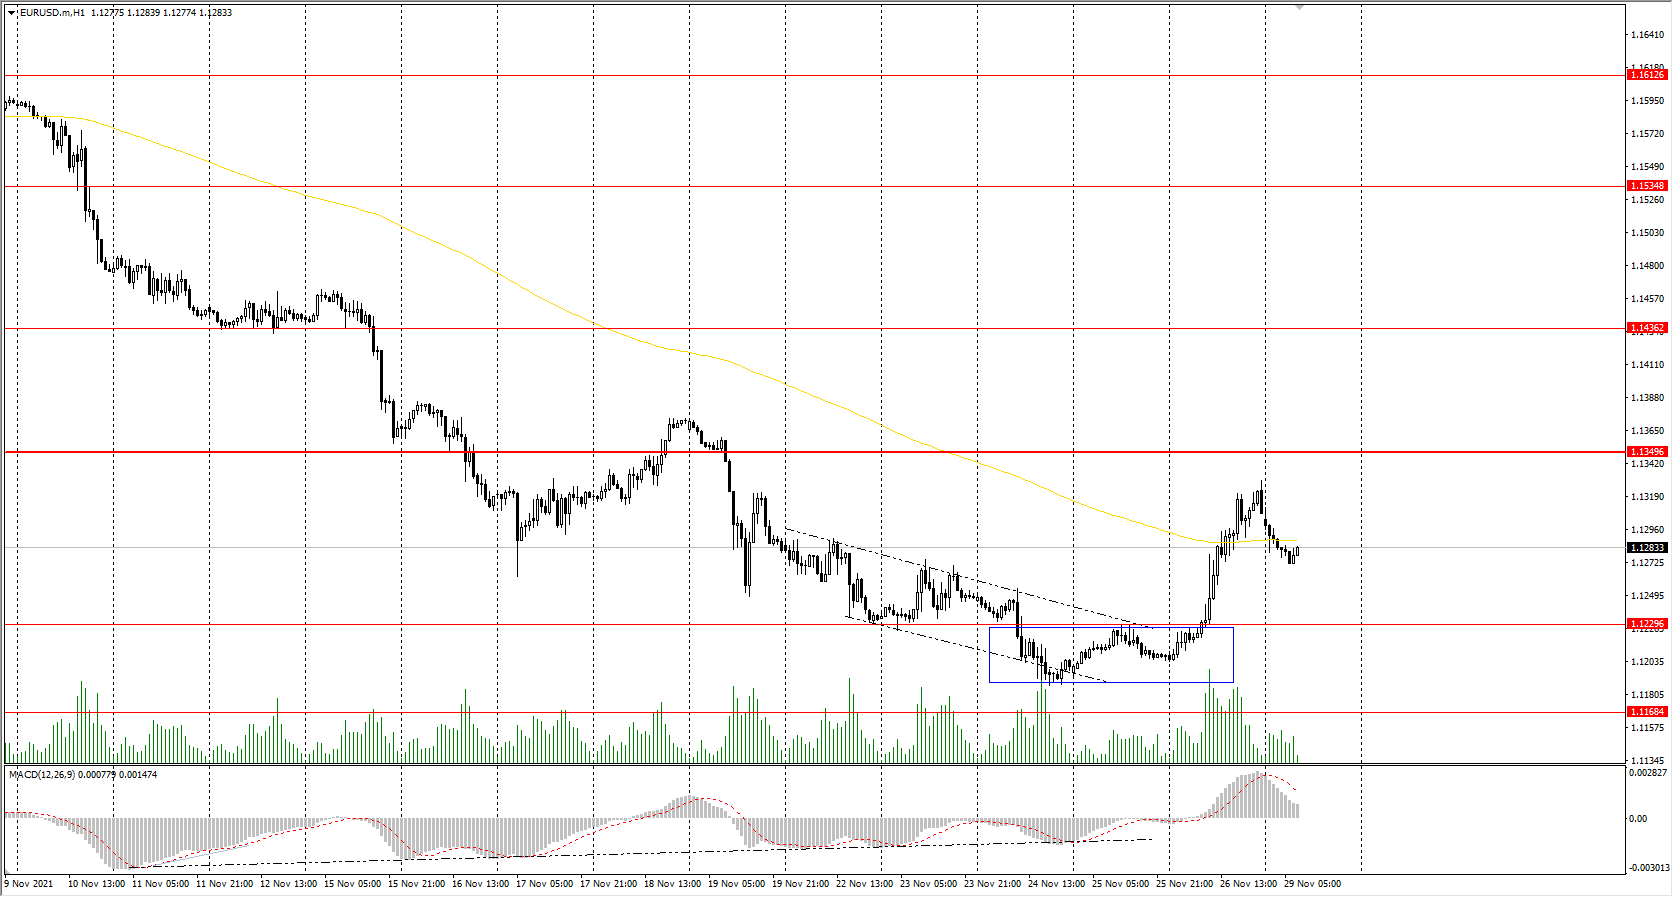
Prev Open: 1.1208
Prev Close: 1.1307
% chg. over the last day: +0.88%
Electricity prices in the Eurozone are rising again despite the risk of another lockdown. Inflationary pressures in Germany continue to rise. German import prices have increased to 21.7% in annual terms, the largest value since 1980. Germany will report today on the inflation rate.
Trading recommendations
Support levels: 1.1230, 1.1168
Resistance levels: 1.1350, 1.1436, 1.1535, 1.1613, 1.1667, 1.1717
From a technical point of view, the EUR/USD on the hour time frame is bearish. The MACD indicator has become positive; there is a buyers' initiative. Under such market conditions, traders should consider sell positions from the priority change level of 1.1350. Buy trades should be considered only from the support levels of the higher time frame, given the buyers’ initiative, but only with short targets.
Alternative scenario: if the price breaks out through the 1.1350 resistance level and fixes above, the mid-term uptrend will likely resume.
News feed for 2021.11.29:
- Germany Consumer Price Index (m/m) at 15:00 (GMT+2);
- S Pending Home Sales (m/m) at 17:00 (GMT+2);
- ECB President Lagarde’s Speech at 19:15 (GMT+2);
- US FOMC Member Clarida’s Speech at 20:00 (GMT+2);
- US FOMC Member Williams’s Speech at 22:00 (GMT+2);
- US Fed Chair Powell’s Speech at 22:05 (GMT+2).
The GBP/USD currency pair
Technical indicators of the currency pair:
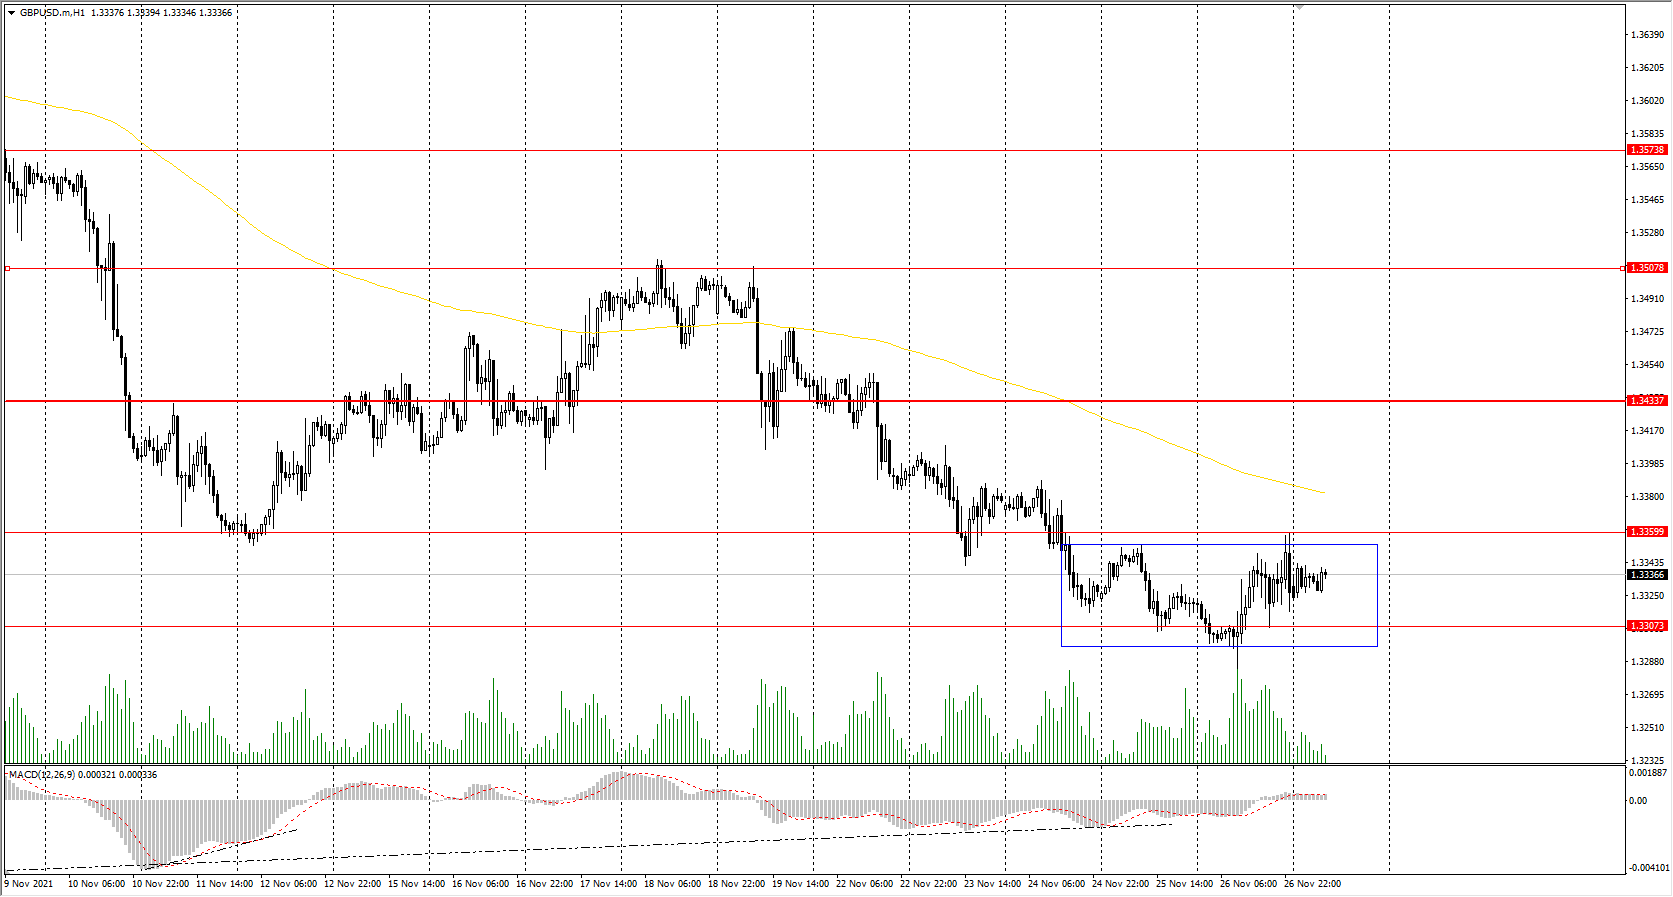
Prev Open: 1.3320
Prev Close: 1.3326
% chg. over the last day: +0.05%
Last month, the price spike in the UK forced some industrial companies to cut production and seek government aid. For the government, it could mean tensions with neighboring countries over supply protection measures. For households, it could mean being asked to use less energy.
Trading recommendations
Support levels: 1.3307
Resistance levels: 1.3360, 1.3434, 1.3507, 1.3575, 1.3685, 1.3748
On the hourly time frame, the trend on GBP/USD is bearish. The MACD indicator has become inactive but is signaling divergence on several time frames. Under such market conditions, traders should consider sell positions from the support levels around the moving average. The buyers need to get the price back above the 1.3360 level, so buy trades should be considered only if the price returns to the 1.3360-1.3507 corridor, given the buyers’ initiative.
Alternative scenario: if the price breaks out through the 1.3434 resistance level and consolidates above, the bullish scenario will likely resume.
The USD/JPY currency pair
Technical indicators of the currency pair:
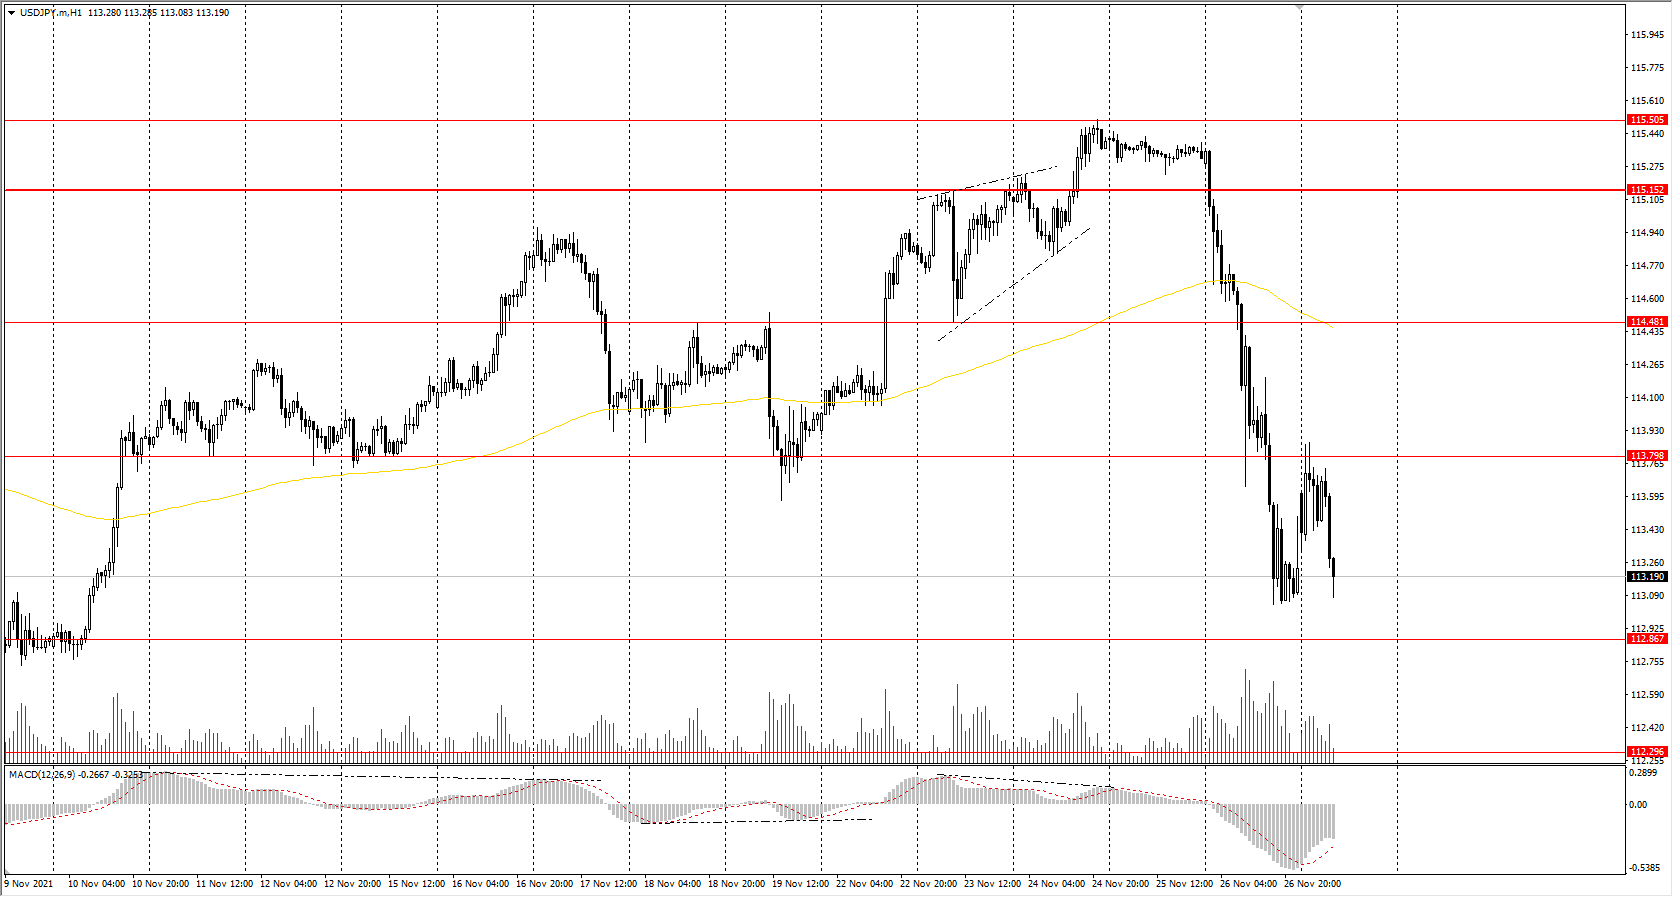
Prev Open: 115.29
Prev Close: 113.23
% chg. over the last day: -1.82%
The Japanese yen strengthened sharply on Friday as a new strain of Covid-19 detected in South Africa sparked a wave of caution in global markets. The Japanese Yen is one of the "safe-haven" currencies in case of emergency shocks. But it is important to understand that this can only be a temporary effect. Fundamentally, there is no reason for JPY to get stronger as the Bank of Japan plans to keep its stimulus program as long as possible while the US FED has been already cutting the program.
Trading recommendations
Support levels: 112.87, 112.30
Resistance levels: 113.79, 114.48, 115.15, 115.50
The global trend on the USD/JPY currency pair has changed to bearish. The price confidently broke through the priority change level and consolidated lower. Under such market conditions, it is best for traders to look for sell positions from the resistance levels around the moving average. Given the buyers ' initiative, buy positions should be considered from the support levels of the higher time frames.
Alternative scenario: if the price rises above 115.15, the uptrend will likely resume.
News feed for 2021.11.29:
- Japan Retail Sales at 01:50 (GMT+2);
- Japan BoJ Gov Haruhiko Kuroda’s Speech (Tentative).
The USD/CAD currency pair
Technical indicators of the currency pair:
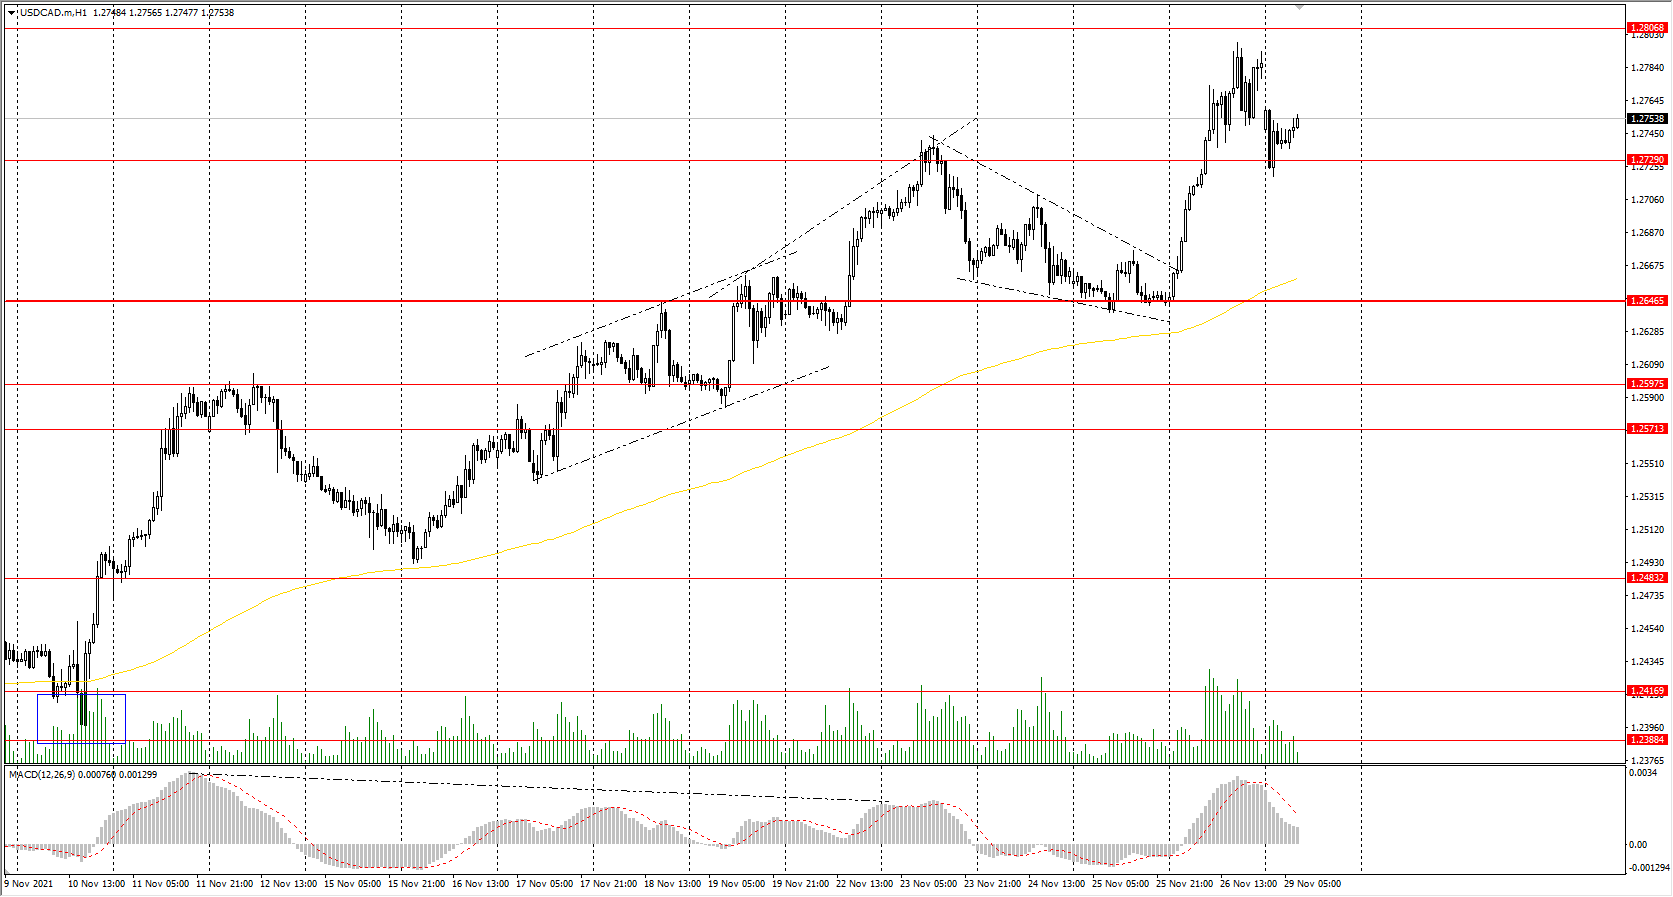
Prev Open: 1.2647
Prev Close: 1.2786
% chg. over the last day: +1.10%
On Friday, oil prices fell sharply as news of the new strain "Omicron." caused many countries to rush to restrict travel, which strengthened the concerns that there may be an excess supply in the first quarter of next year. The Canadian dollar is a commodity currency, so the CAD fell sharply against the dollar amid a drop in oil.
Trading recommendations
Support levels: 1.2729, 1.2646, 1.2598, 1.2571, 1.2483, 1.2416, 1.2388
Resistance levels: 1.2807
From a technical point of view, the trend of the USD/CAD currency is bullish. The MACD indicator became positive, the pressure of buyers is increasing. Under such market conditions, it is better to look for buy trades from the support levels near the moving average. Sell deals should be considered from the resistance levels of the higher time frames.
Alternative scenario: if the price breaks down through the 1.2646 support level and fixes below, the downtrend will likely resume.
News feed for 2021.11.29:
- Canada BoC Gov Macklem’s Speech at 21:00 (GMT+2).
Pandemic Knocks Off-Balance Markets
The newly discovered Omicron variant of the pandemic knocked the markets off-balance on Friday as it renewed the uncertainty in the markets. Safe haven currency JPY gained against the USD before correcting somewhat during today’s Asian session while also the USD was on the retreat on Friday. At the same time commodity currencies such as the Aussie, the Loonie and the Kiwi tended to be on the retreat given the worries for a possible deterioration of international trading terms and a slowdown of global economic recovery. Gold prices tended to edge higher as the USD seemed to retreat yet may have also gotten some support by the appeal provided by the uncertainty in the markets and the drop of US yields on Friday. Prices of oil tended to tumble as worries for the demand side of the commodity surfaced. OPEC was to reach a decision in the coming days about oil production levels of the coming months yet given the new uncertainty posed by the pandemic, it may be delayed to evaluate any possible repercussions, as per media. US stockmarkets also were on the retreat with Dow Jones leading the way lower, as risk off sentiment took over. Overall we expect financial releases today and early tomorrow could affect the markets, yet they still have to recover from Friday’s shock. Reports tend to show that there is high transmitability yet mild symptoms for the Omicron variant which could ease market worries. Overall, markets seemed to recover some of their confidence during the late American session and today’s Asian session, however uncertainty seems to be still present. Fundamentally the risk off mood which dominated on Friday could be reversed, yet the measures which were decided or are still to be announced by various countries, could keep markets worried for the recovery of the global economy maintaining a cautious stance by investors.
USD/JPY extended its drop on Friday breaking the 113.70 (R1) support line, now turned to resistance, yet corrected higher but remained below the R1. The bearish sentiment may have not spoken its final words yet, as the RSI indicator is at low levels, yet some stabilisation signs are present. Should the selling interest for the pair be renewed we may see the pair aiming if not breaking the 112.75 (S1) line. If the correction higher is extended, we may see pair breaking the 113.70 (R1) resistance line and aim for the 114.45 (R2) level.
AUD/USD continued to drop breaking the 0.7170 (R1) support line now turned to resistance. We maintain a bearish outlook for the pair as long as it remains below the downward trendline incepted since the 2nd of November. Should the bears actually remain in charge of the pair’s direction we may see AUD/USD breaking the 0.7105 (S1) support line and aim for the 0.7045 (S2) level. If the bulls take over, AUD/USD could break the prementioned downward trendline, the 0.7170 (R1) resistance line and aim for the 0.7230 (R2) level.
As for the rest of the week
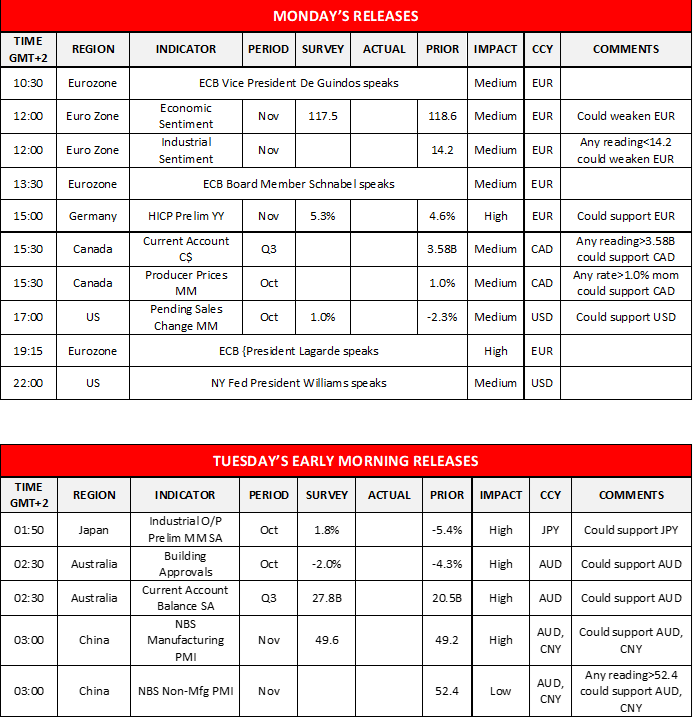
On Tuesday we get Japan’s preliminary industrial output rate for October, Australia’s building approvals rate for October, China’s NBS manufacturing PMI for November, France’s GDP rate for Q3 and preliminary CPI (EU Normalised) rates for November, Switzerland’s KOF indicators for November, Eurozone’s preliminary HICP rate for November, Canada’s GDP rates for Q3 and the US consumer confidence indicator for November while later on US Treasury Secretary Yellen and Fed Chairman Powell are to testify before the US Senate. On Wednesday, we get Japan’s Jibun manufacturing PMI for November, Australia’s GDP for Q3, China’s Caixin Manufacturing PMI, UK’s nationwide house prices, Switzerland’s CPI rates, Germanys’ final manufacturing PMI reading, Canada’s manufacturing PMI, and the US Markit and ISM manufacturing PMIs, all being for November. On Thursday we get Australia’s trade data for October and the weekly US initial jobless claims figure. On Friday we get China’s Caixin Services PMI, Turkey’s CPI rates, the US employment report with its
USD/JPY H4 Chart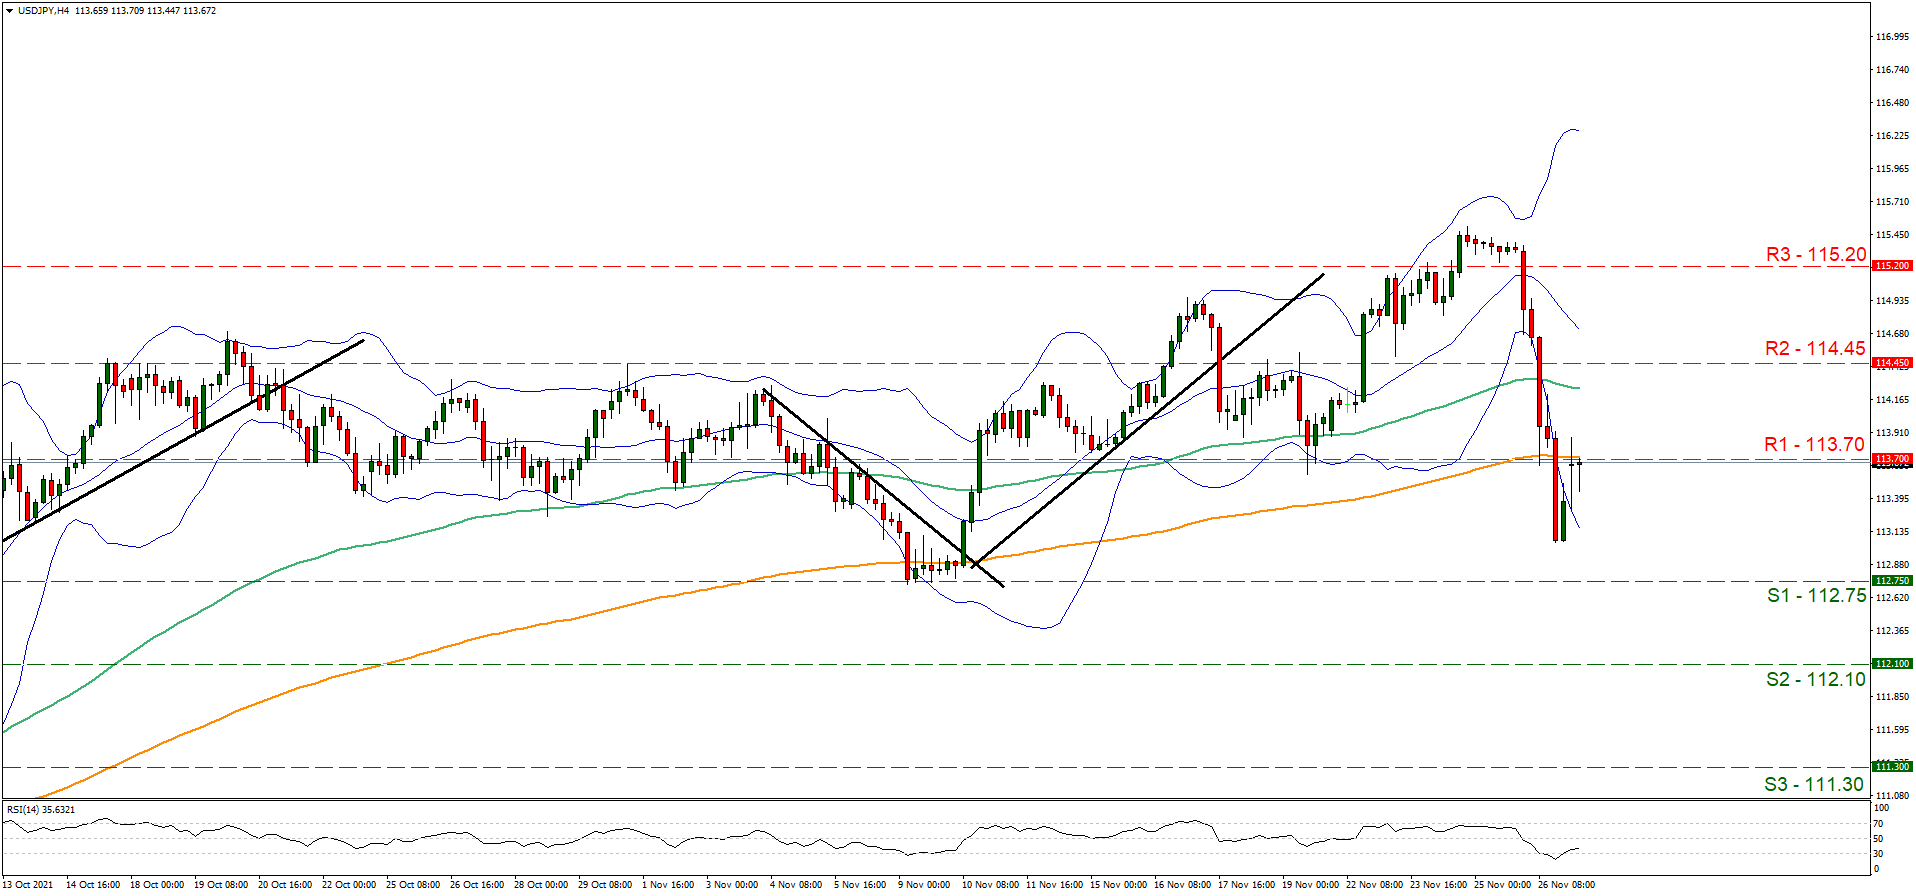
Support: 112.75 (S1), 112.10 (S2), 111.30 (S3)
Resistance: 113.70 (R1), 114.45 (R2), 115.20 (R3)
AUD/USD H4 Chart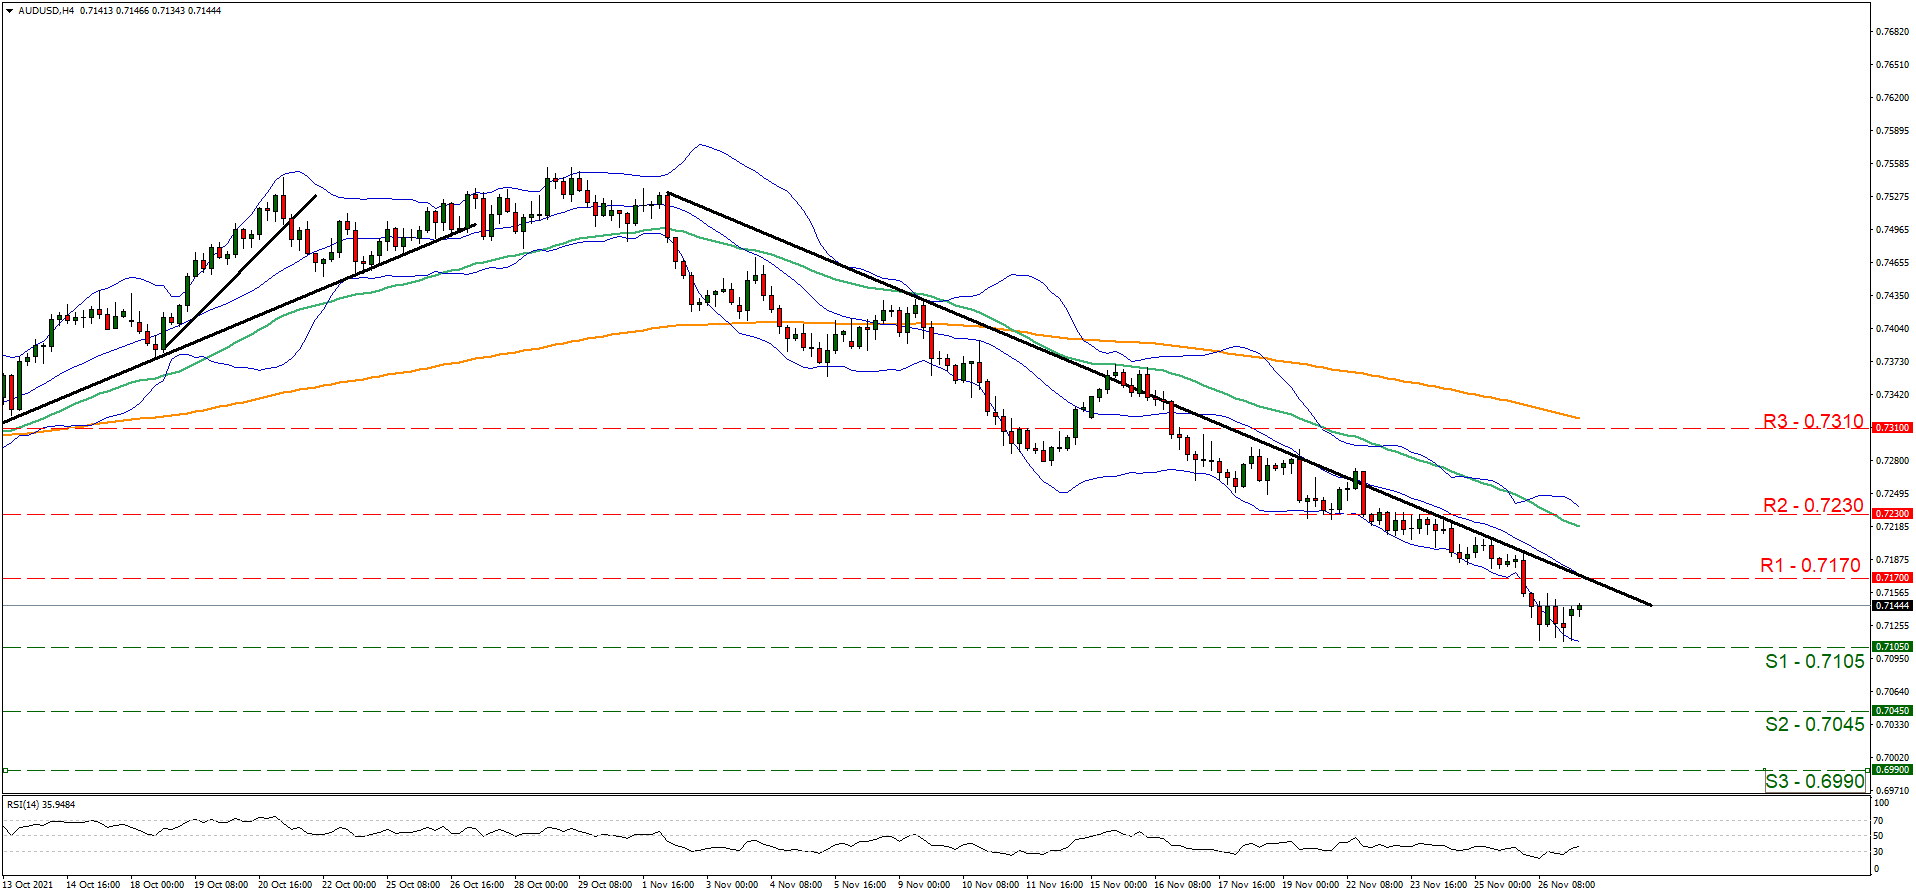
Support: 0.7105 (S1), 0.7045 (S2), 0.6990 (S3)
Resistance: 0.7170 (R1), 0.7230 (R2), 0.7310 (R3)
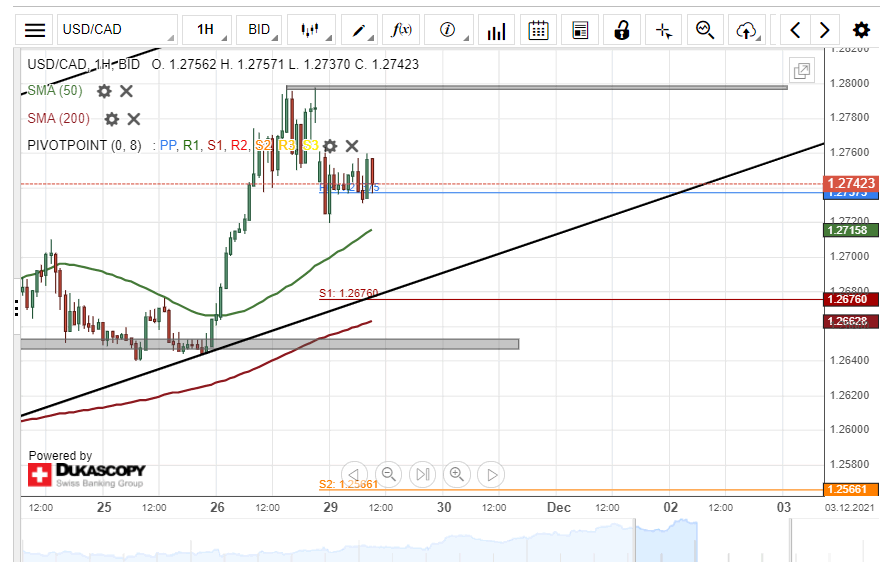
USD/CAD Bounces Off 1.2800 Mark
The USD/CAD started the week by a low opening near the 1.2750 level. Previously, the rate tested the resistance of the 1.2800 mark. In general, the rate traded sideways, as it was looking for direction.
In the near term future, the rate could be pushed up by the support of the 50-hour simple moving average, which on Monday morning was located near the 1.2715 level. A potential surge might once again test the resistance at 1.2800.
On the other hand, a decline below the simple moving average might result in a decline to the lower trend line of a channel up pattern and the 1.2700 mark.
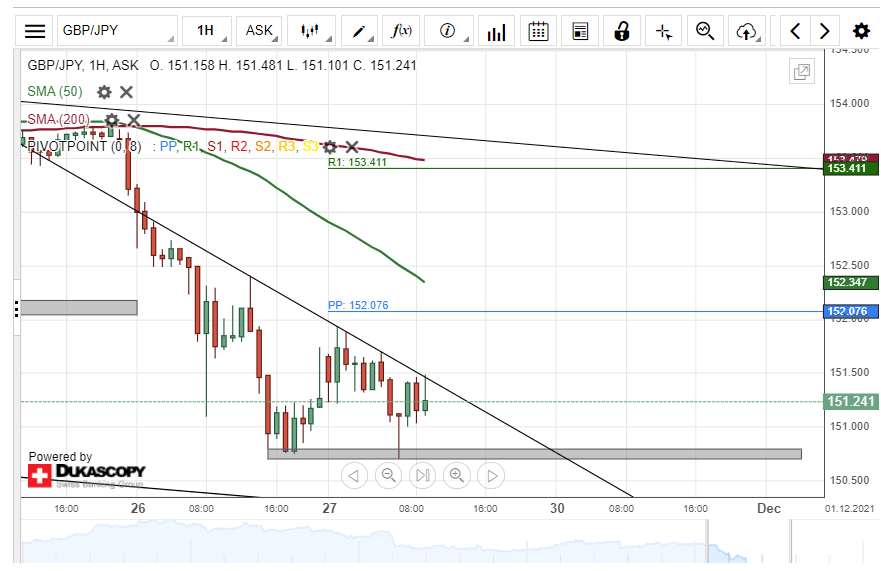
GBP/JPY Reveals Triangle Pattern
Since Thursday, the GBP/JPY currency exchange rate has been trading in the borders of a descending triangle pattern. Namely, the pair has been trading between a support zone at 150.70/150.80 and the resistance line that connects the Thursday and Friday high levels.
If the pair breaks out of the triangle to the upside, it could aim at the resistance of the 152.00 level, the weekly simple pivot point at 152.08 and the 50-hour simple moving average, which was approaching from above near the 152.30 level. Above these levels, most close by resistance could be found in the 152.50 level.
On the other hand, a break out to the downside might find support in the 150.00 mark and the lower trend line of a larger scale channel down pattern.
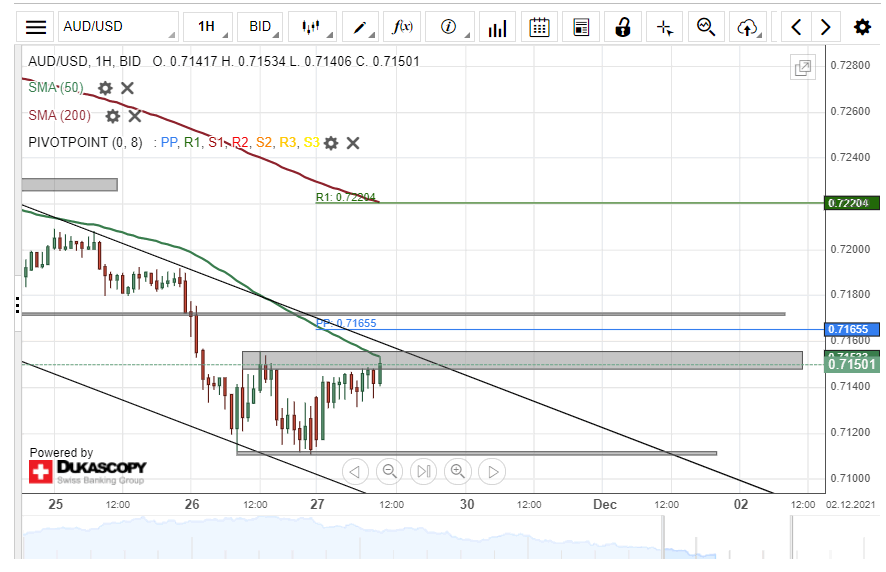
AUD/USD Faces Resistance At 0.7150
The AUD/USD currency exchange rate was testing the resistance of the 0.7150 mark on Monday morning. Meanwhile, the pair was being approached by the resistance of the 50-hour simple moving average.
If the pair declines, it could look for support in the Thursday and Friday low level zone above the 0.7110 mark. Below this zone, the rate might encounter support in the 0.7100 level.
However, a potential surge of the AUD/USD would have to pass the resistance zone at 0.7148/0.7156 and the 50-hour simple moving average. Above these levels, the upper trend line of the channel down pattern provides resistance.
EUR/JPY Reaches Below 128.00
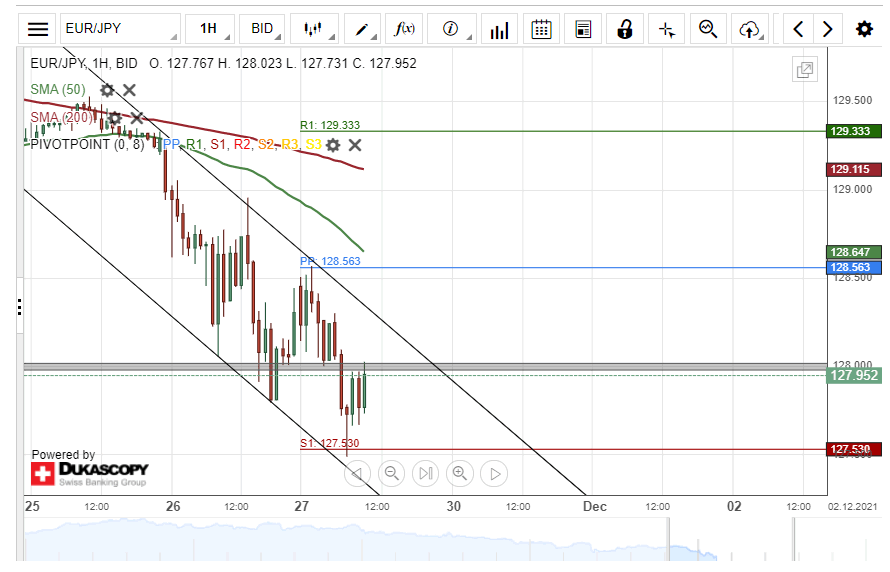
The EUR/JPY currency exchange rate has declined below the support of the 128.00 mark. In addition, on Monday morning, the pair confirmed the 128.00 level as resistance. Meanwhile, the 127.50 level provided support. Moreover, note that the rate has been declining in a channel down pattern since November 25.
If the rate continues to decline, it would look for support in the combination of the 127.50 mark and the weekly S1 simple pivot point at 127.53. Below these levels, the lower trend line of the channel down pattern might provide support.
On the other hand, a potential recovery would face the resistance of the 128.00 level. Above this level, the upper trend line of the channel down might act as resistance.
EURUSD’s Positive Traction Disappoints, Negative Bias Holds
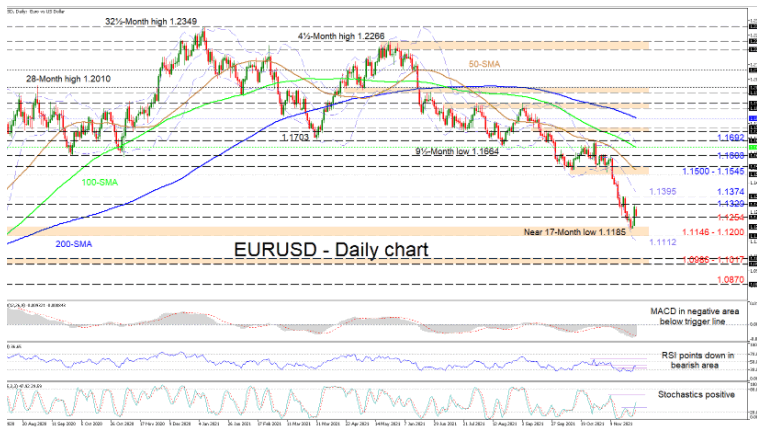
EURUSD's negative bearing prevails despite the bounce off the near 17-month low of 1.1185. The falling simple moving averages (SMAs) are endorsing the bearish outlook in the pair.
The short-term oscillators are transmitting mixed signals in directional momentum. The MACD is far beneath the zero mark and is holding below its red trigger line. The RSI is dipping in bearish territory signalling that positive impetus is feeble, whereas the rising stochastic lines continue to sponsor gains in the pair.
If sellers manage to stay in control, initial support could emanate from the 1.1254 level ahead of the 1.1146-1.1200 support boundary. Resuscitating the descent, sellers may snag at the 1.0986-1.1017 border, linked to the inside swing highs over the mid-April until mid-May period of 2020. Sinking beneath the 1.1000 vicinity, traders' attention could then turn to the 1.0870 trough, achieved in the later part of May 2020.
If buyers re-emerge, preliminary resistance could transpire from the 1.1329 and 1.1374 nearby highs, where the mid-Bollinger band is converging. Climbing higher, the critical 1.1500-1.1545 resistance border coupled with the 50-day SMA, may impede additional gains from materialising. However, should buyers conquer this barrier, they could jump towards the 1.1608 neighbouring high before challenging a fortified region of resistance, existing between the 100-day SMA and the 1.1692 mark.
Summarizing, EURUSD is struggling to recoup previously lost ground. The pair is sustaining a bearish bias below the SMAs and the 1.1500-1.1545 obstacle.
EUR/USD Outlook: Near-Term Action Lacks Clear Direction, 1.1290 Fibonacci Level Remains Key
The Euro is standing at the back foot in early Monday following last Friday’s nearly 1% bounce, driven by a weaker dollar on month-end sales and increased pressure as US traders are back after the Thanksgiving holiday pause.
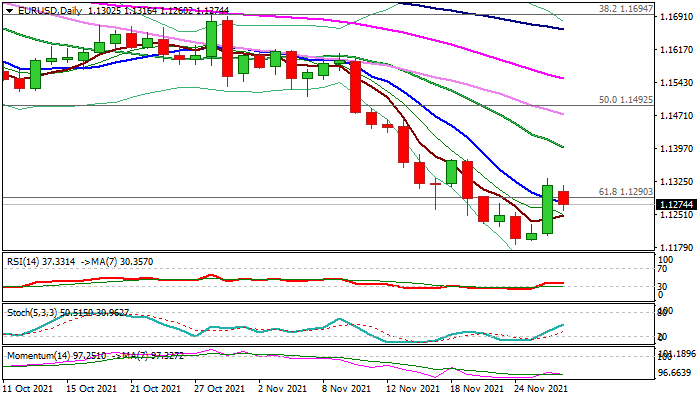
Friday’s rebound resulted in Euro’s failure to register a weekly close below cracked key Fibo support at 1.1290 (61.8% of 1.0635/1.2349 rally) though, the initial signal of formation of bear-trap and stronger rebound, is likely to be short-lived if the pair fails to sustain a break above 1.1290 and register another daily close above this level.
Daily techs maintain strong negative momentum and MA’s in bearish setup, keeping the downside at risk.
Monday’s close below 1.1290 would signal that a brief correction might be over, however, larger bears look for a monthly close below the key Fibo level that would further weaken the structure and risk extension towards targets at 1.1040/00 (Fibo 76.4%/psychological).
Res: 1.1290, 1.1330, 1.1373, 1.1400.
Sup: 1.1248, 1.1186, 1.1168, 1.1100.
Omicron Selloff Looks Overstretched
Last Friday could be designated as 2021’s worst day in financial markets. Risk-off sent global stocks, oil prices, commodity currencies, and Treasury yields sharply lower, reminding investors of the dark days in early 2020. The Greek letter, “omicron” has suddenly changed the game in markets and has quickly risen to the top of investors’ concerns. The WHO introduced this term and has designated the latest Covid variant as a ”variant of concern”.
When investors are introduced to a new risk factor, the initial reaction is to sell first and ask questions later. Lower market liquidity after the Thanksgiving holiday also exaggerated the selloff as the Dow Jones Industrial Average fell 905 points and the volatility index “VIX” spiked more than 50%. Following a two-day weekend, traders and investors are trying to digest the latest developments, and the recovery this morning in risk assets indicates markets went too far. Still, we’re not entirely out of the woods.
So, what do we know about the new Covid variant? Preliminary evidence suggests an increased risk of reinfection with this variant, meaning that it could hasten a new phase in the pandemic as we enter the winter season. Travel restrictions are already implemented in many countries and new lockdowns should not be ruled out.
According to South African Doctors, patients with the Omicron variant had very mild symptoms which could be treated at home. However, most infected patients were young and healthy and we do not know the impact on the elderly or people more at risk. With over 30 mutations, the new COVID-19 variant might elude currently available vaccines, but we do not know that for sure as it takes weeks to run scientific studies.
There are more questions than answers at this stage; it could turn out to be better or worse, depending on new findings. But investors today decided to downplay the worst-case scenarios and buy the dips. Also helping traders put risk back on is the diminishing expectation for US monetary policymakers to tighten policy. Interest rates futures are now indicating that the first US rate hike will occur in July compared to June, as of earlier last week. Now markets expect only two rate hikes for 2022, down from three before the Omicron news. However, these expectations could change dramatically over the coming weeks as we get to know more about the new variant.
Overall, investors need to be prepared for heightened volatility as markets respond to day-by-day headlines. Following weeks of tranquil markets, get ready for some big moves as we move into the last month of the year.