

Sample Category Title
USD/JPY Daily Outlook
Daily Pivots: (S1) 114.99; (P) 115.26; (R1) 115.68; More...
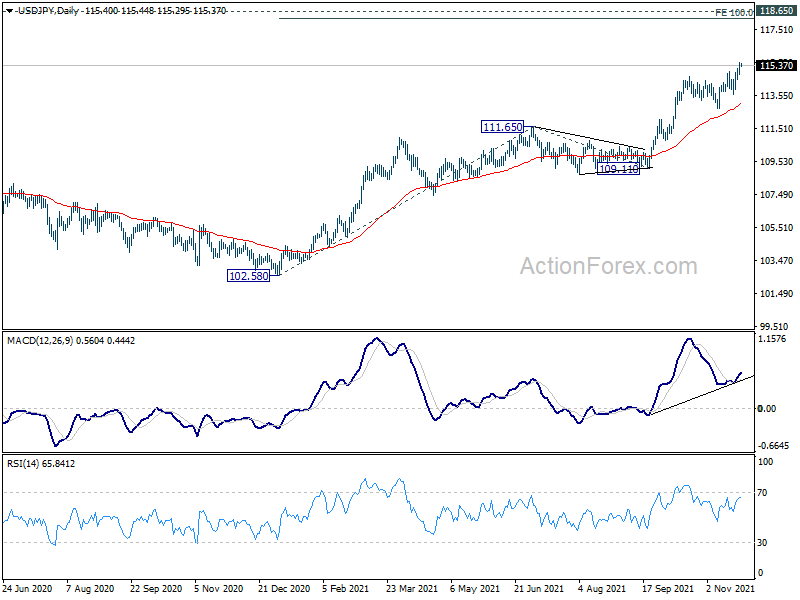
Intraday bias in USD/JPY remains on the upside for the moment. Current up trend from 102.58 should target 100% projection of 102.58 to 111.65 from 109.11 at 118.18 next. On the downside, below 114.81 minor support will turn intraday bias neutral first. But break of 113.57 support is needed to indicate short term topping. Otherwise, outlook will stay bullish in case of retreat.
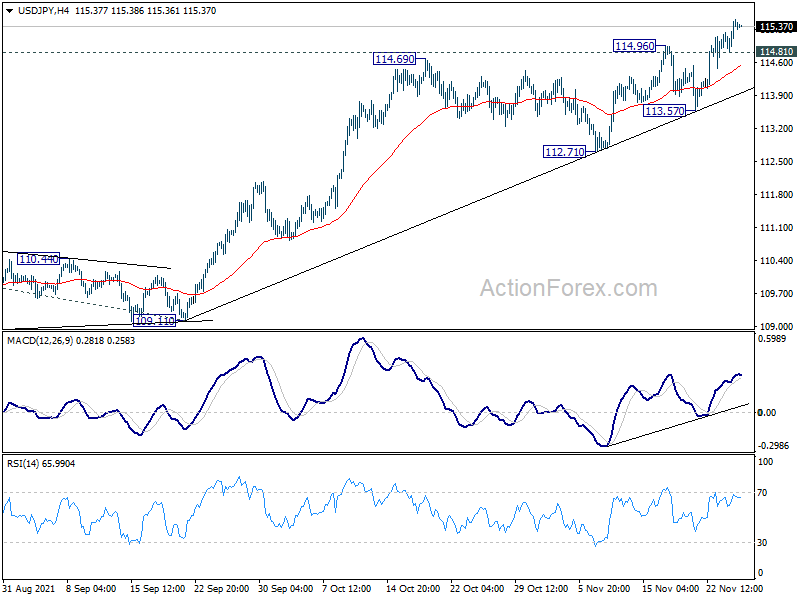
In the bigger picture, corrective decline from 118.65 (2016 high) should have completed at 101.18 already. Rise from the 102.58 is seen as the third leg of the up trend from 101.18. Next target is 118.65 high. This will now be the preferred case as long as 111.65 resistance turned support holds, even in case of deep pull back.
Dollar Firm in Quiet Holiday Trading, Yen Soft
The forex markets are rather quiet in Asian session today. Trading will probably remain subdued with US on holiday. The greenback remains the strongest one for the week on speculation that the "transitory" yet persistent strong inflation would eventually force Fed to raise interest rate earlier. Canadian Dollar is currently the second strongest for the week, as WTI oil price stabilized above 75 handle. New Zealand Dollar remains the worst performing one, with Yen a distant second.
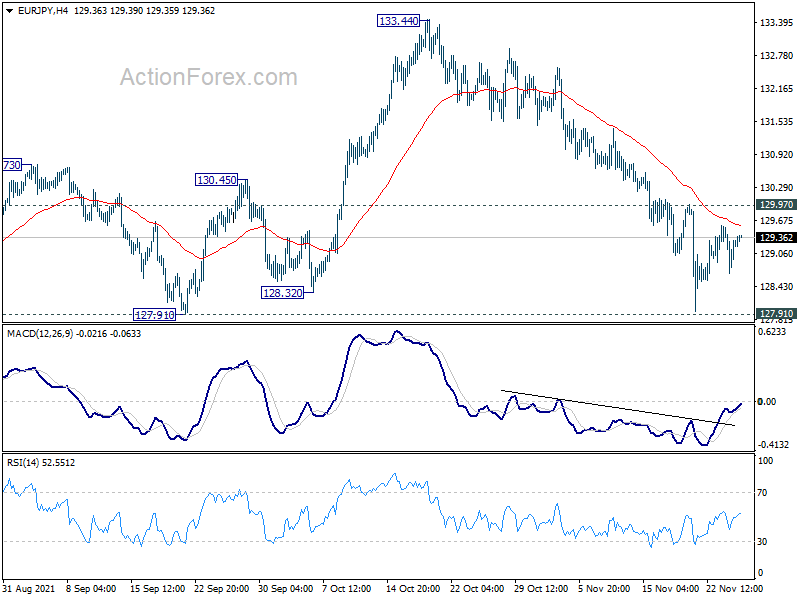
Technically, the next move in Sterling could be interesting, as both EUR/GBP and GBP/JPY are stuck in range, with near term bearish bias. That is both are in favor to extend recent decline, which is contrasting each other. But, downside breakout in both EUR/GBP and GBP/JPY would make sense, if that is also accompanied by EUR/JPY's sharp fall through 127.91 near term support. We'll see.
In Asia, Nikkei rose 0.77%. Hong Kong HSI is up 0.22%. China Shanghai SSE is down -0.08%. Singapore Strait Times is down -0.09%. Japan 10-year JGB yield is down -0.0024 at 0.084. Overnight, DOW dropped -0.03%. S&P 500 rose 0.23%. NASDAQ rose 0.44%. 10-year yield dropped -0.0022 to 1.645.
Fed minutes: No hesitate to take actions to address inflation risks
In the minutes of November 2-3 FOMC meeting, various participants noted that the Committee should be prepared to "adjust the pace of asset purchases and raise the target range for the federal funds rate sooner than participants currently anticipated" if inflation continued to run higher than levels consistent with the Committee's objectives. "
At the same time, because of the continuing considerable uncertainty about developments in supply chains, production logistics, and the course of the virus, a number of participants stressed that a "patient attitude toward incoming data remained appropriate to allow for careful evaluation of evolving supply chain developments and their implications for the labor market and inflation."
"That said, participants noted that the Committee would not hesitate to take appropriate actions to address inflation pressures that posed risks to its longer-run price stability and employment objectives."
New Zealand imports rose 12% yoy in Oct, imports rose 26% yoy
New Zealand goods exports rose 12% yoy to NZD 5.3B in October. Goods imports rose 26% yoy to NZD 6.6B. Trade deficit came in at NZD -1.3B, versus expectation of NZD -1.6B.
Exports to China was up 20%, Australia down -6.5%, USA up 12%, Japan 30%, EU up 11%. Imports from China rose 29%, EU up 33%, Australia up 7.5%, USD up 13%, Japan up 52%.
Japan corporate service price rose 1% yoy to highest since 2001
Japan corporate service price index rose 1.0% yoy in October, slightly above expectation of 0.9% yoy. At 105.4, the services producer price index hit the highest level since November 2001. The key driver of the rise was transportation fee, with cost of ocean freight transportation up 52.0% yoy.
"Corporate services prices are recovering gradually, with some sectors showing demand picking up due to the lifting of curbs. But the move hasn't broadened much on lingering caution over the pandemic," Shigeru Shimizu, head of the BOJ's price statistics division, told a briefing.
Looking ahead
Germany Gfk consumer sentiment and Q3 GDP final will be released in European session. ECB will also publish monetary policy meeting accounts.
USD/JPY Daily Outlook
Daily Pivots: (S1) 114.99; (P) 115.26; (R1) 115.68; More...
Intraday bias in USD/JPY remains on the upside for the moment. Current up trend from 102.58 should target 100% projection of 102.58 to 111.65 from 109.11 at 118.18 next. On the downside, below 114.81 minor support will turn intraday bias neutral first. But break of 113.57 support is needed to indicate short term topping. Otherwise, outlook will stay bullish in case of retreat.
In the bigger picture, corrective decline from 118.65 (2016 high) should have completed at 101.18 already. Rise from the 102.58 is seen as the third leg of the up trend from 101.18. Next target is 118.65 high. This will now be the preferred case as long as 111.65 resistance turned support holds, even in case of deep pull back.
Economic Indicators Update
| GMT | Ccy | Events | Actual | Forecast | Previous | Revised |
|---|---|---|---|---|---|---|
| 21:45 | NZD | Trade Balance (NZD) Oct | -1286M | -1575M | -2171M | -2206M |
| 23:50 | JPY | Corporate Service Price Index Y/Y Oct | 1.00% | 0.90% | 0.90% | |
| 00:30 | AUD | Private Capital Expenditure Q3 | -2.20% | -2.00% | 4.40% | 3.40% |
| 07:00 | EUR | Germany Gfk Consumer Confidence Dec | -0.3 | 0.9 | ||
| 07:00 | EUR | Germany GDP Q/Q Q3 F | 1.80% | 1.80% | ||
| 12:30 | EUR | ECB Monetary Policy Meeting Accounts |
Elliott Wave View: Rally In FTSE Expected To Fail
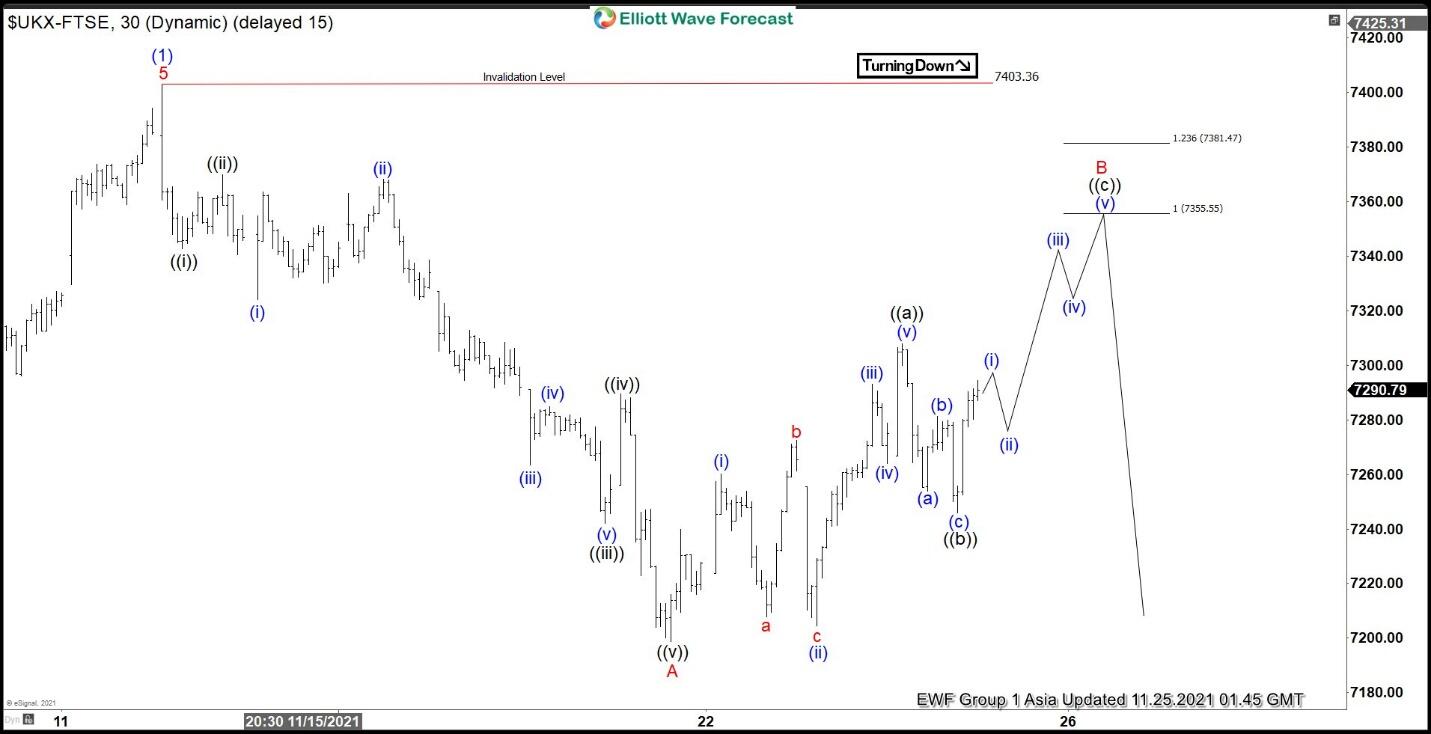
Short-term Elliott wave view in FTSE suggests cycle from September 20, 2021 low has ended with wave (1) at 7403.36. The Index is currently correcting that cycle within wave (2). Internal subdivision of wave (2) is unfolding as a zigzag Elliott Wave structure. Down from wave (1), wave ((i)) ended at 7342.61 and rally in wave ((ii)) ended at 7370.01. Index resumes lower in wave ((iii)) towards 7241.99 and bounce in wave ((iv)) ended at 7289.51. Final leg lower wave ((v)) ended at 7198.76 and this completed wave A.
Rally in wave B is in progress to correct cycle from November 12, 2021 high. Internal subdivision of the rally is unfolding as another zigzag in lesser degree. Up from wave A, wave ((a)) ended at 7307.89 and pullback in wave ((b)) ended at 7245.98. Near term, expect the Index to extend higher in wave ((c)) towards 100%-123.6% extension area at 7355.55 – 7381.47 . This should complete wave B in higher degree before the Index turns lower. As far as pivot at 7403.36 high remains intact, expect the rally to fail in 3, 7, or 11 swing for further downside in wave C.
FTSE 30 Minutes Elliott Wave Chart
Fed minutes: No hesitate to take actions to address inflation risks
In the minutes of November 2-3 FOMC meeting, various participants noted that the Committee should be prepared to "adjust the pace of asset purchases and raise the target range for the federal funds rate sooner than participants currently anticipated" if inflation continued to run higher than levels consistent with the Committee's objectives.
At the same time, because of the continuing considerable uncertainty about developments in supply chains, production logistics, and the course of the virus, a number of participants stressed that a "patient attitude toward incoming data remained appropriate to allow for careful evaluation of evolving supply chain developments and their implications for the labor market and inflation."
"That said, participants noted that the Committee would not hesitate to take appropriate actions to address inflation pressures that posed risks to its longer-run price stability and employment objectives."
USD/CAD Gains Momentum, US GDP Grew 2.1%
Key Highlights
- USD/CAD started a major increase above the 1.2600 level.
- A key rising channel is forming with support near 1.2640 on the 4-hours chart.
- EUR/USD declined below 1.1220, and GBP/USD traded to a new monthly low.
- The US GDP grew 2.1% in Q3 2021 (Preliminary), up from 2%.
USD/CAD Technical Analysis
The US Dollar formed a base above the 1.2450 level against the Canadian Dollar. As a result, USD/CAD started a major increase above the 1.2500 and 1.2550 resistance levels.
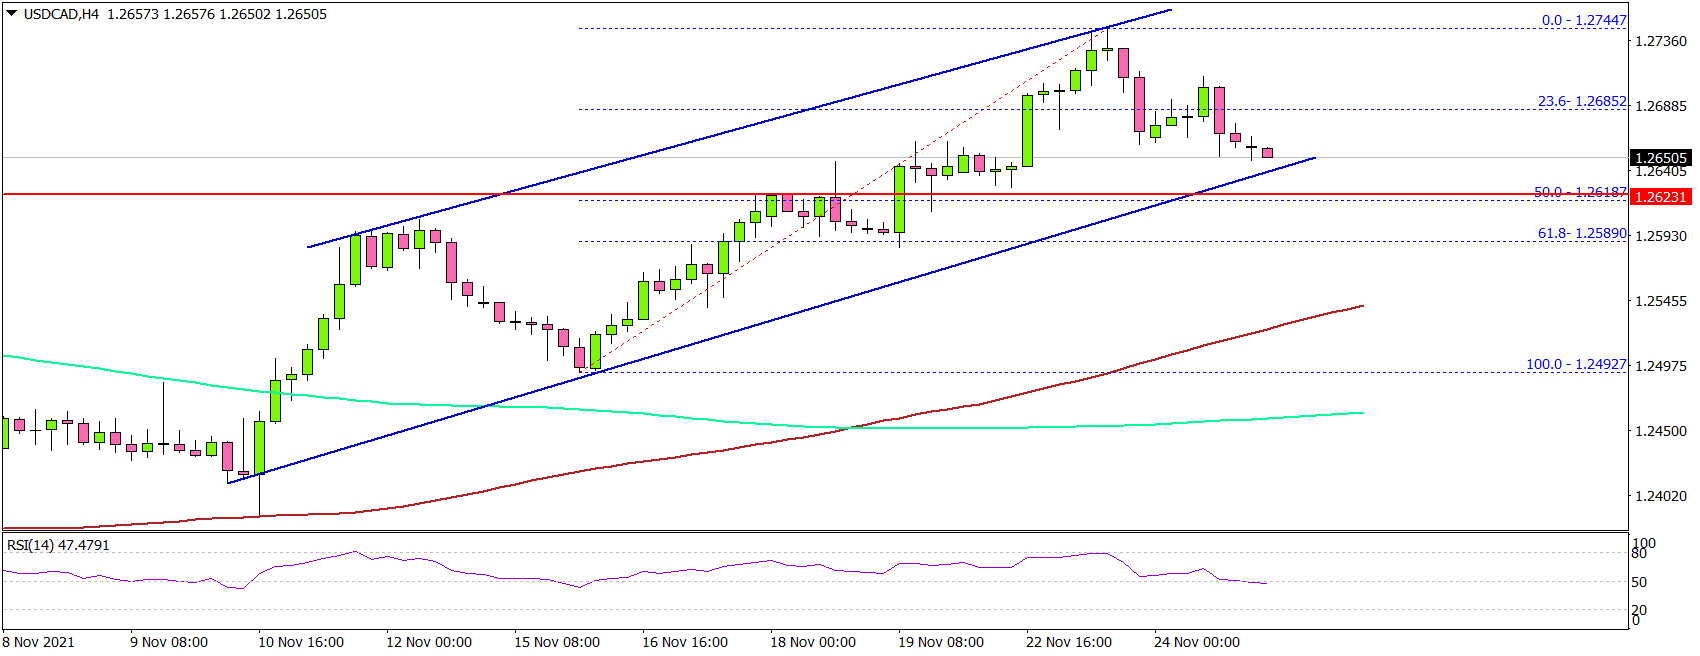
Looking at the 4-hours chart, the pair even broke the 1.2600 barrier. There was a close above 1.2600, the 100 simple moving average (red, 4-hours), and the 200 simple moving average (green, 4-hours).
The pair even broke 1.2700 and a high was formed near 1.2744. It is now consolidating gains and recently traded below 1.2700. There was a break below the 23.6% Fib retracement level of the upward move from the 1.2492 swing low to 1.2744 high.
On the downside, an initial support is near the 1.2640 level. There is also a key rising channel forming with support near 1.2640 on the same chart.
A downside break below the channel support may perhaps open the doors for more losses. The next major support sits at 1.2620. It is near the 50% Fib retracement level of the upward move from the 1.2492 swing low to 1.2744 high, below which the pair could test 1.2550.
On the upside, the pair is facing hurdles near 1.2750. The main resistance is forming near the 1.2800 level. A daily close above 1.2800 may perhaps open the doors for a decent increase. The next key stop for the bulls could be 1.2880.
Fundamentally, the US Gross Domestic Product Annualized reading for Q3 2021 was released yesterday by the US Bureau of Economic Analysis. The market was looking for a growth of 2.2% in Q3 2021.
The actual result was near the forecast, as the US GDP grew 2.1%. The increase was revised up 0.1% from the “advance” estimate released in October.
Besides, EUR/USD remained in a bearish zone and there was a break below the 1.1220 support. Similarly, GBP/USD extended decline below the 1.3350 level.
Economic Releases
- German Gross Domestic Product for Q3 2021 (YoY) – Forecast 2.5%, versus 2.5% previous.
- German Gross Domestic Product for Q3 2021 (QoQ) – Forecast 1.8%, versus 1.8% previous.
- Germany’s GfK Consumer Confidence for Dec 2021 – Forecast -0.5, versus 0.9 previous.
Market Morning Briefing: EURJPY Is Holding Well Above Support At 128
STOCKS
Ranged movements seen in most equity indices while immediate resistances and supports are holding. We need a break on either side of the range to predict the next course of action. Dow and Dax trade within 35500-36000 and 15900-15400/15000 respectively while Nikkei and shanghai trade within 29750-29000 and 3550-3600 respectively. Nifty can trade between 17200 and 17600/800 while Sensex is bearish below 59000. Watch price action for the next few sessions to see if there is any break on either side of the mentioned ranges.
Dow (35804.38, -9.42, -0.026%) has come down slightly. The index has support at 35500 which can hold for now and we can see a test of 36000 soon. As mentioned earlier a strong break above 36000 is needed to see 36250.As such we may expect a sideways consolidation between 35500-36000.
DAX (15878.39, -58.61, -0.37%) has come down sharply and has broken the support at 15900 making a low of 15740.60 yesterday. While below 15900 a fall towards 15400-15000 comes into the picture.
Nikkei (29500.57, +197.91, +0.68%) has risen to 29500 after falling sharply yesterday. Resistance is at 29750 can hold for now. A strong break above 29750 is needed for the view to be bullish towards 30000/31000. Else a fall back to 29250-29000 is possible.
Shanghai (3584.81, -7.89, -0.22%) has come down after testing the immediate resistance at 3600. While below 3600 a fall back towards 3550 is possible before we see a strong break on either side.
Nifty (17415.05, -88.30, -0.50%) has fallen after testing the interim resistance at 17600. The range of 17200-17600/800 continues while above 17200. A strong break on either side is needed to form the next view.
Sensex (58340.99, -323.34, -0.55%) also opened higher but came down after making a high of 58969.12. Immediate view is bearish while below 59000 to see a fall towards 58000 eventually.
COMMODITIES
Stability is seen in most commodities probably because the US markets are closed today. Gold has support at 1780/70 and while that holds, a rise back to 1830/40 is possible in the medium term. Failure to hold above 1770 can drag it lower to 1760/40. Silver can fall to 23-22 while below 25. Copper has surprisingly risen contrary to our expectation of a fall to 4.30. Watch price action to see if the price faces rejection from 4.50/60 which is an immediate resistance.
Brent (82.25) looks stable near levels seen yesterday. A test of immediate resistance near 84/85 is possible before a decline sets in towards 80-78-75 again in the medium term. Watch price action near 84/85. Some sideways consolidation looks more likely just now.
WTI (78.34) on the other hand has immediate resistance near 80 which if holds can produce a fall towards 75 again in the near term. A break above 80, if seen and sustained will trigger fresh rally towards 82.
Gold (1794.10) tested 1786 before bouncing slightly from there. Immediate support is seen near 1780/70 which if holds can produce a bounce back to 1830/40 in the near term. Failure to hold above 1770 can drag it lower towards 1760/40. Preference is to see a bounce from 1770/80 region.
Silver (23.73) has risen slightly but while below 25, there is scope for a fall to 23-22 in the near term. A small sideways pause is possible before falling further.
Copper (4.4635) has risen well towards 4.50/60 initially contrary to our expectation of seeing a fall towards 4.30 on the downside. We would now keep a close watch near 4.50/60 to see if the price faces rejection and falls back from the immediate resistance zone or manages to break on the upside indicating bullishness towards 4.90. Watch price action near 4.50/60.
FOREX
Dollar Index continues to trade higher taking along Dollar Yen to levels above 115. A rise in the index to 98 is possible while it sustains above 96.50 as Dollar Yen can also target 118 in the longer run on a sustained rise above 116. Euro if falls back below 1.12 can sustain lower to fall towards 1.11/10 soon. EURJPY can trade between 130-128 before breaking on either side. Pound and Aussie can see a short corrective bounce but is overall bearish in the medium term. USDCNY can trade within 6.37-6.40/42 while USDINR can trade within 74.20-74.60/70.
Dollar Index (96.758) has risen and continues to sustain above 96.50. The index looks bullish for a rise to 97.50-98 soon before a reversal is seen.
Euro (1.1212) dipped to 1.1186 yesterday but has failed to sustain below 1.12. The current bounce looks short lived and we may not negate a fall back below 1.12 and eventually target 1.11/10 on the downside as Dollar Index heads towards 98.
EURJPY (129.36) is holding well above support at 128. As mentioned yesterday, we need to watch price action near 130 to see if it manages to break above 130 or fall back to 129-128 again in the medium term. For now while below 130, we expect a ranged move within 130-128.
Aussie (0.7201) trades near 0.72 and if it manages to break and sustain, it can fall further towards 0.71/0.70 in the medium term. Watch price action to see if Aussie bounces back from current levels immediately or continues to fall lower.
Pound (1.3345) tested 1.3315 before bouncing from there. A short corrective upmove is possible to 1.34-1.3450 before a fall is again seen in the longer run to 1.33 or lower.
Dollar-Yen (115.37) has risen in line with the rise in Dollar Index. A break above 115.50 would be initially bullish towards 116.0-116.25 before rising higher. Medium term target above 116 would be 118.
USDCNY (6.3884) is likely to continue trade within 6.40/39-6.37 mentioned yesterday. A break above 6.40, if seen can take the pair up to 6.42 else sideways consolidation could continue.
USDINR (74.40) may trade within 74.20-74.60 before breaking on either side to extend towards 74.00 or 74.80. a fall to 74 is more likely. Watch price action while ranged within 74.20-74.60/70.
INTEREST RATES
The US Treasury yields have risen at the near-end while the far-end had dipped yesterday after a strong Personal Consumption Expenditure release yesterday. The US PCE rose 5% (YoY) in October. The resistances on the far-end yields are holding well for now and need to see if we get a further dip in the coming days from here to keep our broader range of trade intact. The German yields remain higher and stable. A further rise from here will negate our earlier view of seeing a fall back. The 5Yr and 10Yr GoI can continue to consolidate sideways for some more time before seeing a fresh fall.
The US 2Yr (0.64%) and the 5Yr (1.34%) Treasury yields have risen while the 10Yr (1.63%) and the 30Yr (1.96%) have dipped slightly. The 1.65%-1.68% resistance is holding well for now. It will have to be seen if the 10Yr can dip below 1.6% and fall to 1.5%-1.45% from here. The 30Yr on the other hand has failed to break 2% and can dip to 1.9% while below 2%. Overall, our view of seeing a broad range of 1.45%-1.65% (narrow) / 1.35%-1.75% (broad) on the 10Yr and 1.75%-2.1%/2.2% on the 30Yr remains intact.
The German 2Yr (-0.76%), 5Yr (-0.56%), 10Yr (-0.23%) and 30Yr (0.11%) yields sustain higher and stable. As mentioned yesterday, a rise past -0.2% (10Yr) and 0.10% (30Yr) will negate our bearish view of seeing a fall back to -0.45% and -0.5% (10Yr) and -0.1% and -0.2% (30Yr). In turn it will take the yields up to -0.1% (10Yr) and 0.2% (30Yr). That in turn will then negate our earlier bearish view of seeing.
The resistance at 6.38% on the Indian 10Yr GoI (6.3678%) continues to hold well to keep the narrow 6.3%-6.38% range intact. While below 6.38%, a dip to 6.34% and lower is possible in the near-term. We expect 6.3%-6.45% as the broader range of trade (in case if 6.38% is broken). But the bias remains bearish to break 6.3% and a fall to 6.2% eventually over the medium-term.
The 5Yr GoI (5.6967%) remains stable and keeps intact the broader 5.66%-5.75%/5.78 range. We expect the 5Yr to break this range on the downside below 5.66% eventually and fall to 5.63%-5.62%.
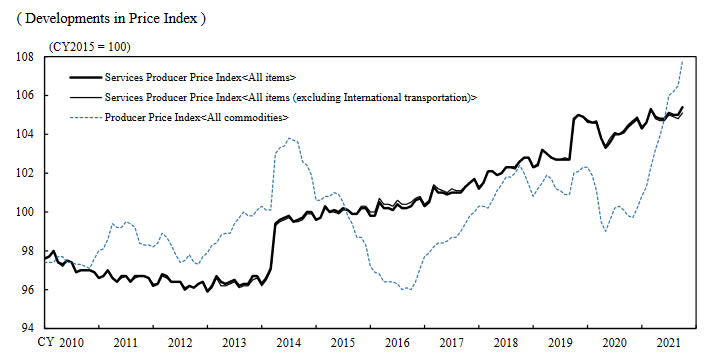
Japan corporate service price rose 1% yoy to highest since 2001
Japan corporate service price index rose 1.0% yoy in October, slightly above expectation of 0.9% yoy. At 105.4, the services producer price index hit the highest level since November 2001. The key driver of the rise was transportation fee, with cost of ocean freight transportation up 52.0% yoy.
"Corporate services prices are recovering gradually, with some sectors showing demand picking up due to the lifting of curbs. But the move hasn't broadened much on lingering caution over the pandemic," Shigeru Shimizu, head of the BOJ's price statistics division, told a briefing.
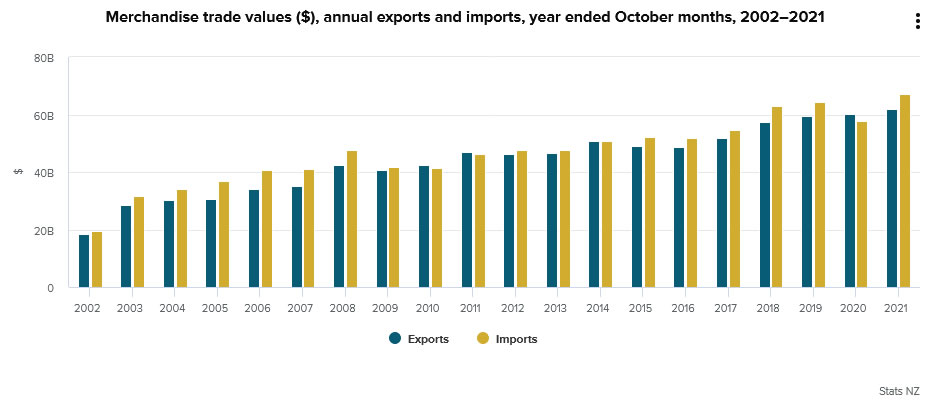
New Zealand imports rose 12% yoy in Oct, imports rose 26% yoy
New Zealand goods exports rose 12% yoy to NZD 5.3B in October. Goods imports rose 26% yoy to NZD 6.6B. Trade deficit came in at NZD -1.3B, versus expectation of NZD -1.6B.
Exports to China was up 20%, Australia down -6.5%, USA up 12%, Japan 30%, EU up 11%. Imports from China rose 29%, EU up 33%, Australia up 7.5%, USD up 13%, Japan up 52%.
US Crude Inventory Surprisingly Increased
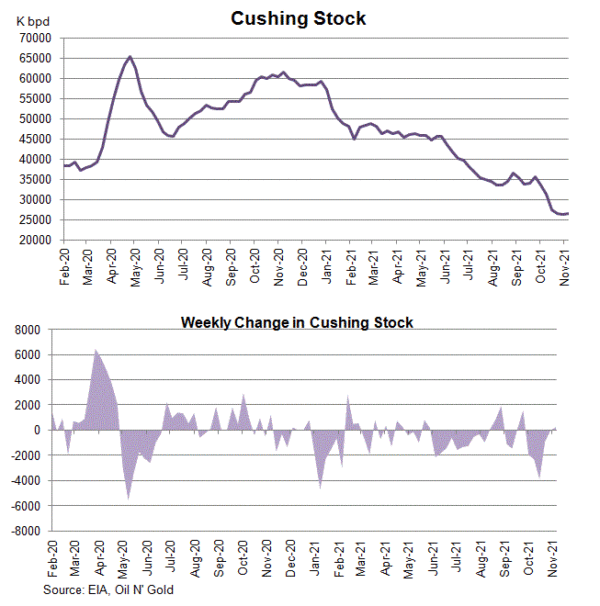
The report from the US Energy Information Administration (EIA) shows that total crude oil and petroleum products (ex. SPR) stocks slumped -5.98 mmb to 1217.89 mmb in the week ended November 19. Crude oil inventory added +1.02 mmb to 434 mmb, compared with consensus of a -0.48 mmb increase. Inventory increased in 3 out of 5 PADDs. PADD 5 (West Coast) alone saw a +3.05 mmb jump in stockpile during the week. Cushing stock added +0.79 mmb to 27.39 mmb. Utilization rate added +0.7 percentage points to 88.6% while crude production added +0.1 mmb to 11.5M bpd for the week. Crude oil imports increased +0.25M bpd to 6.44M bpd in the week.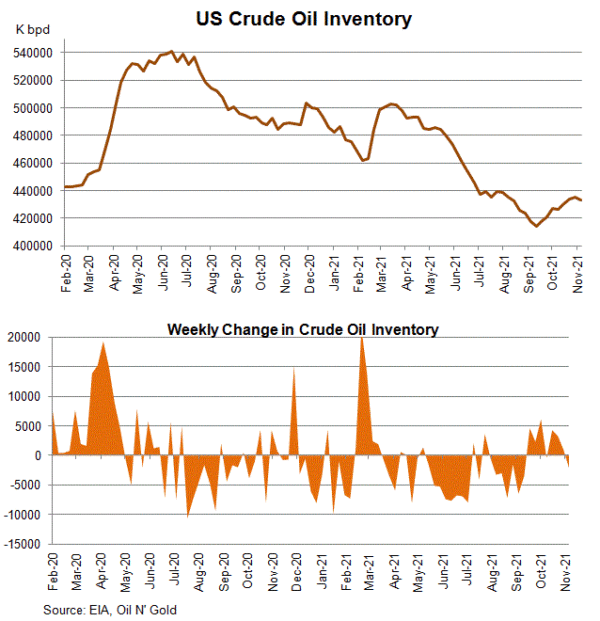
 Concerning refined oil product inventories, gasoline inventory slipped -0.6 mmb to 211.39 mmb while demand added +1.01% to 9.33M bpd. The market had anticipated a -0.46 mmb fall in stockpile. Production jumped +10.76% to 10.99M bpd while imports plunged -41.31% to 0.48M bpd during the week. Distillate stockpile dropped -1.97 mmb to 121.72 mmb. The market had anticipated a -1 mmb decrease. Demand added +0.94% to 4.39M bpd. Imports soared +38.91% to 0.33 mmb while production slipped -1.2% to 4.78M bpd during the week.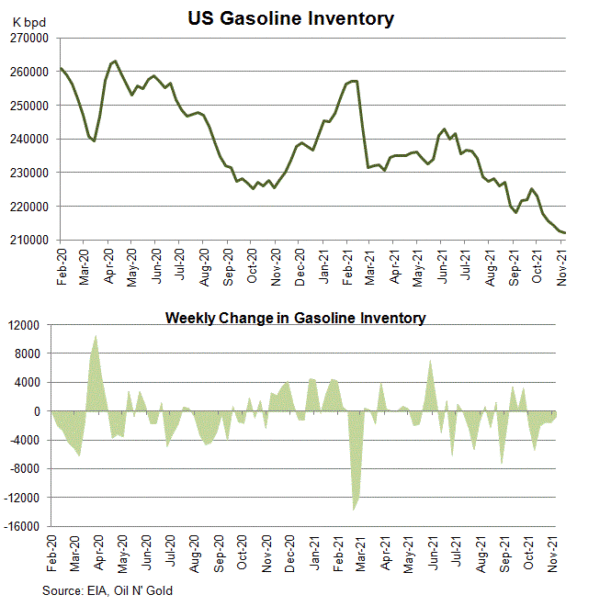
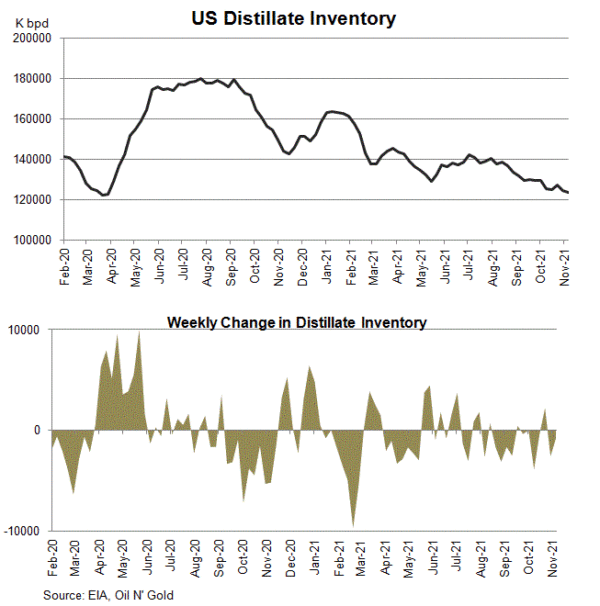
A day earlier, the industry-sponsored API estimated that crude oil inventory climbed higher, by +0.2.31 mmb. Gasoline stockpile added +0.6 mmb, while that for distillate was down -1.5 mmb.
Eco Data 11/25/21
[php_everywhere instance="1"]