Sample Category Title
USD/JPY Analysis: Trades Between Round Levels
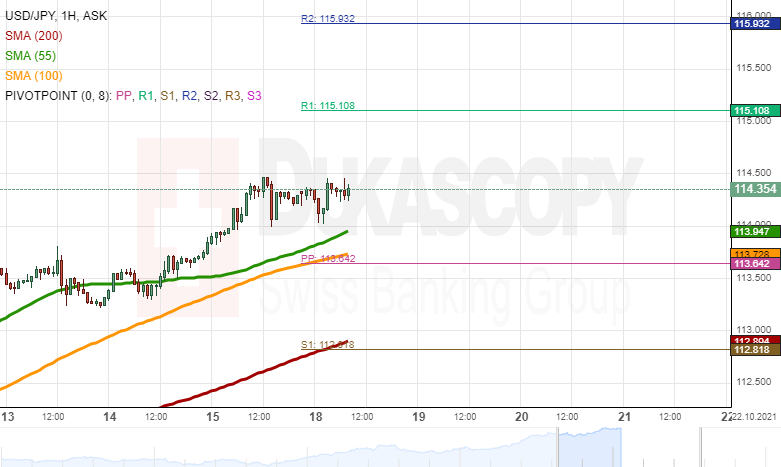
Since the middle of Friday's GMT trading hours, the USD/JPY has fluctuated between the 114.00 and 114.50 levels. On Monday morning, the pair was being approached by the 55-hour simple moving average.
If the 55-hour SMA provides the USD/JPY with support, a surge could begin. A surge might aim at the resistance of the 115.00 level before reaching the weekly R1 simple pivot point at 115.11.
Meanwhile, a failure of the SMA and decline below the 114.00 mark might look for support in the 100-hour SMA near 113.75 and the weekly simple pivot point at 113.64.
Gold Analysis: Passes Support Levels
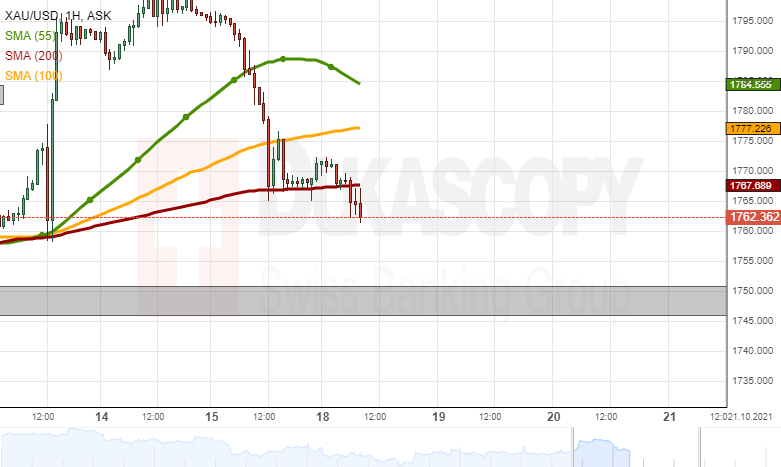
On Monday morning, the slowed down decline of the yellow metal's price reached below the support of the 200-hour simple moving average. The SMA had kept the pair up together with the 1,765.00 mark since early Friday's trading hours.
If the metal's price declines, it could reach the support of the October low level zone of 1,745.00/1,751.00.
However, a recovery of the price might encounter resistance in the 200-hour SMA at 1,768.00. Afterwards, the 100 and 55-hour SMAs might act as resistance at 1,777.25 and 1,784.50.
China Q3 and September Data Point to Consumer-Led Resurgence
Q3 GDP was as expected. The retail sales detail is promising for Q4 and 2022.
China GDP was consistent with our expectations in Q3, a 0.2% gain in the three months to September seeing annual growth slow from 7.9% in June to 4.9%.
Year-to-date growth for 2021 is now 9.8% compared to 0.7% at this stage in 2020 and a cycle peak of 18.3% in March 2021. To achieve our 8.5% full-year 2021 forecast, a 1.4% quarterly gain is necessary in Q4. With retail sales having rebounded in robust fashion in September (more below) and external demand strong as Q3 finished, a healthy gain seems probable in the three months to December.
While GDP detail is not available immediately each quarter in China, the monthly partial data for retail sales, industrial production and fixed asset investment provide a good sense of sectoral momentum through the quarter.
Of greatest significance in this instance is that, like in Q1/Q2, the threat of COVID-19 has quickly faded in China and consumers have responded with haste, annual growth in retail sales jumping from 2.5% to 4.4% in September against a consensus estimate of 3.5%. Spending on restaurants and catering was a big factor here, annual growth rising from -4.5% to +3.1%. Note however the NBS non-manufacturing PMI’s 6pt bound in September (released a fortnight ago) implies that it is not just restaurant spending that has rebounded.
There still remains considerable uncertainty over the immediate outlook for investment though. While Evergrande’s financial position continues to take all the headlines, the bigger issue for China’s economy is the time it is taking the sector as a whole to digest 2020’s regulatory changes, aimed at reducing leverage and better targeting construction to the needs of the rising middle class and those on low incomes.
It will likely be 2022 before the sector can fully reset. More broadly on investment, in 2022 and beyond, business investment will need to make a bigger contribution to total fixed asset investment if authorities’ growth ambitions are to be realised. This is true from an activity perspective, with property investment likely restricted to 7% growth instead of 10% annually, and as income growth will increasingly dictate maximum sustainable growth for the economy versus available debt.
A final point on production. The past six months have been a particularly trying time for global manufacturing. It is not surprising then that year-to-date industrial production growth has slowed from 14.1% in March to 3.1% currently. In the last month or so, power outages in China have been an additional headwind.
Given recent remarks by authorities with respect to securing necessary coal for power generation and preventing it from becoming uneconomic, we hold a continuation of these outages as a risk only. As for residential real estate investment, these issues should be fully resolved by the turn of the year, allowing the economy to expand by around 5.7% in 2022 after a 8.5% year-average gain in 2021. That said, we will continue to monitor the monthly data flow through Q4 for any evidence we are being too optimistic.
GBP/JPY Daily Outlook
Daily Pivots: (S1) 155.84; (P) 156.63; (R1) 157.84; More...
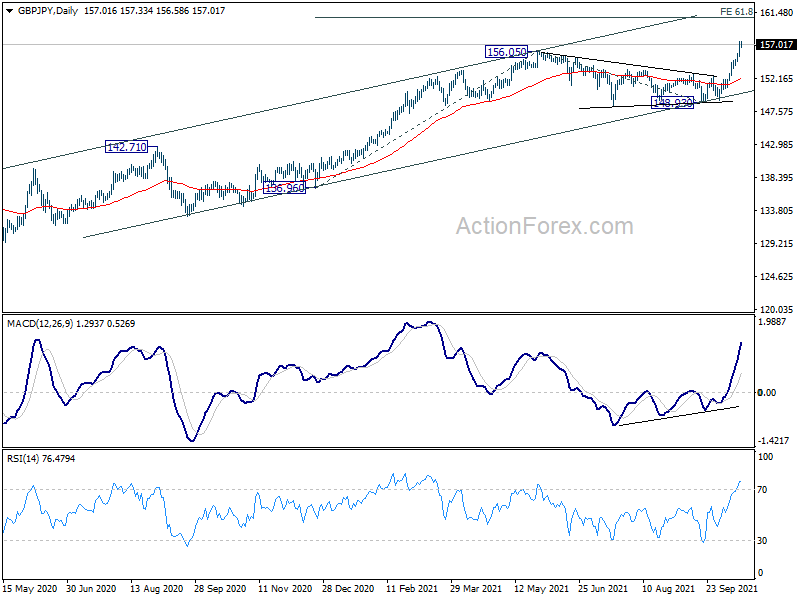
Intraday bias in GBP/JPY remains on the upside at this point. Current up trend from 123.94 should target 61.8% projection of 136.96 to 156.05 from 148.93 at 160.72 next. On the downside, below 155.32 minor support will turn intraday bias neutral and bring consolidations first, before staging another rally.
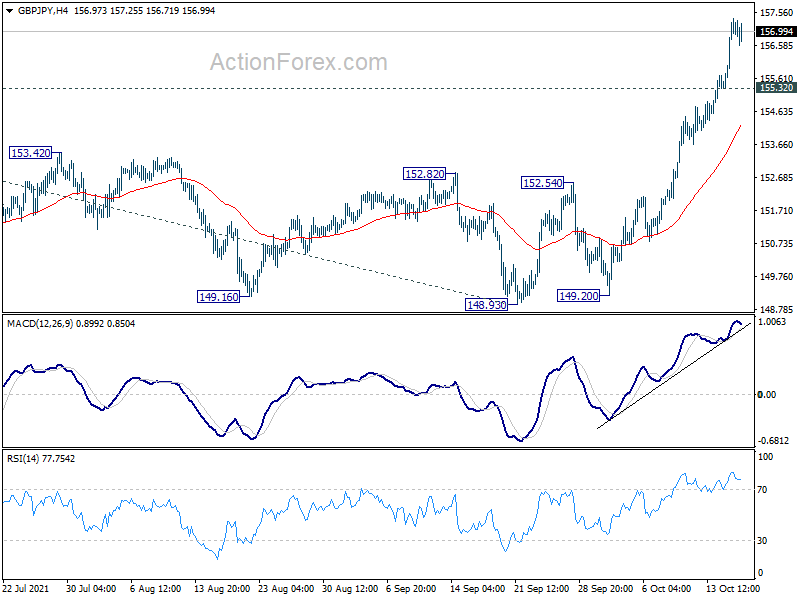
In the bigger picture, rise from 123.94 is seen as the third leg of the pattern from 122.75 (2016 low). The stay above 55 week EMA affirms medium term bullishness. Current rise should now target 61.8% retracement 195.86 (2015 high) to 122.75 at 167.93 next. In any case, outlook will remain bullish as long as 148.93 structural support hold, even in case of deeper pull back.
EUR/JPY Daily Outlook
Daily Pivots: (S1) 131.97; (P) 132.37; (R1) 132.94; More....
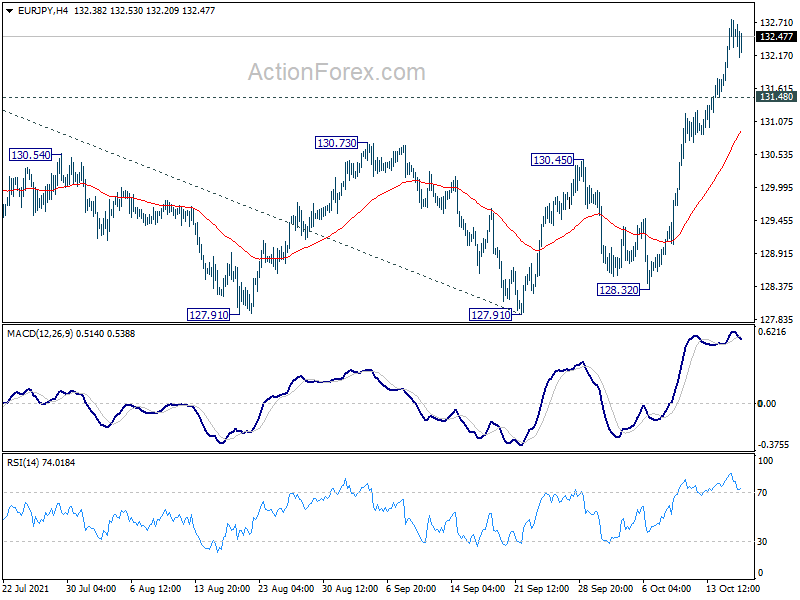
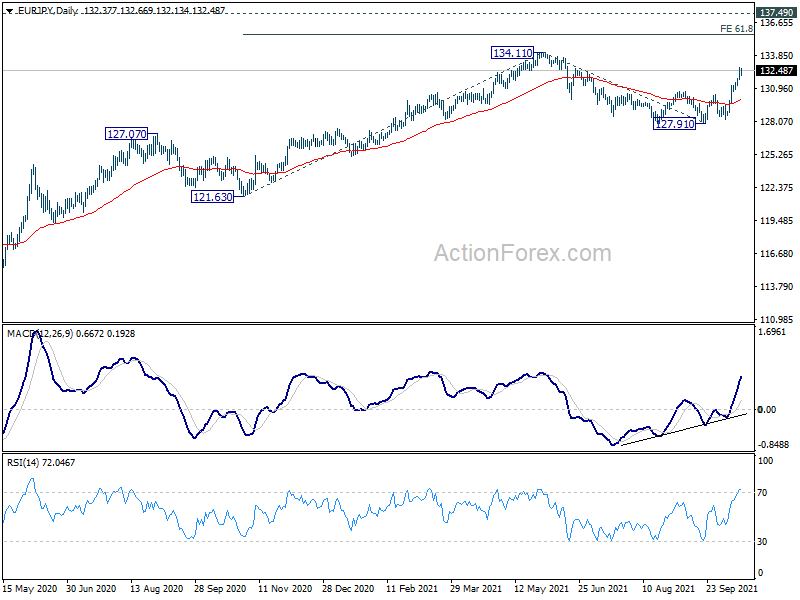
Intraday bias in EUR/JPY remains on the upside at this point. Rise from 127.91 should target retesting 134.11 high first. Firm break there will resume larger up trend from 114.42. Next target is 61.8% projection of 121.63 to 134.11 from 127.91 at 135.62. On the downside, below 131.48 minor support will turn intraday bias neutral and bring consolidation first, before staging another rally.
In the bigger picture, rise from 114.42 (2020 low) is still in progress and the strong support support from 55 week EMA affirms medium term bullishness. Further rise would be seen to retest 137.49 (2018 high). Decisive break there will resume the whole long term rise from 109.03 (2016 low). Next target will be 100% projection of 109.03 to 137.49 from 114.42 at 142.88. This will now remain the favored case as long as 127.91 support holds.
EUR/GBP Daily Outlook
Daily Pivots: (S1) 0.8413; (P) 0.8450; (R1) 0.8476; More...
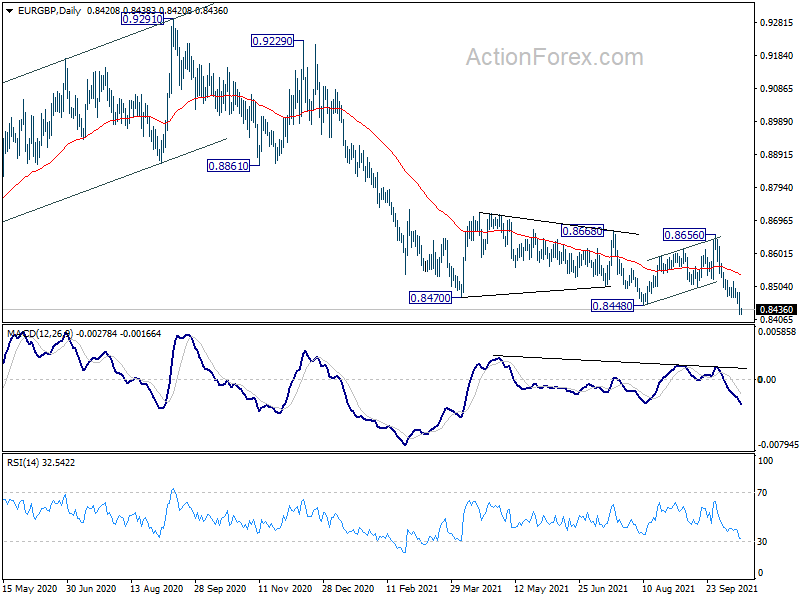
Intraday bias in EUR/GBP stays on the downside at this point. Current fall from 0.8656 is part of the larger down trend from 0.9499. Deeper decline would be seen towards 0.8276 key long term support next. On the upside, above 0.8485 minor resistance will turn intraday bias neutral and bring consolidations first. But overall, outlook will remain bearish as long as 0.8656 resistance holds.
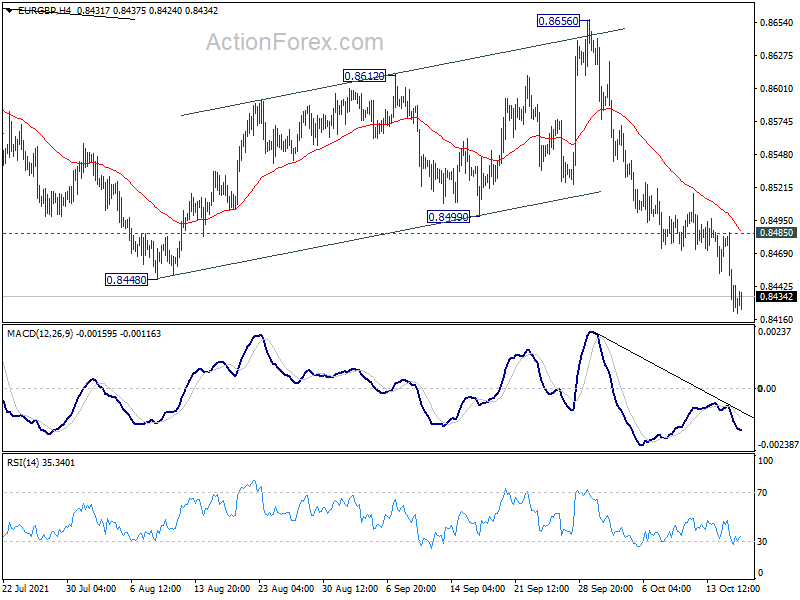
In the bigger picture, price actions from 0.9499 (2020 high) are still seen as developing into a corrective pattern. Deeper fall could be seen as long as 0.8656 resistance holds, towards long term support at 0.8276. However, firm break of 0.8656 resistance would argue that a medium term bottom was already formed. Stronger rise would be seen to 0.8861 support turned resistance to confirm completion of the corrective pattern.
Gold Erases Gains But Neutral Structure Has Still A Bullish Tilt
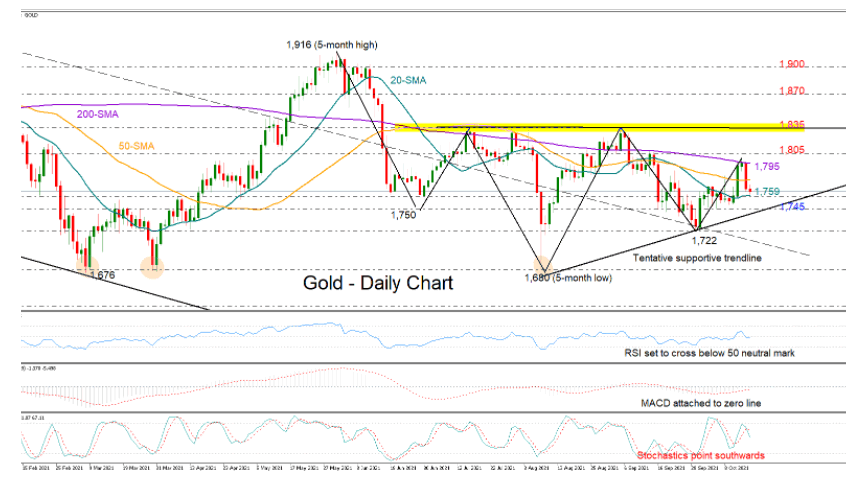
Gold saw its bullish fortunes evaporating near the 200-day simple moving average (SMA) and the 1,800 level last week, with the price erasing its latest exciting rebound to meet the 20-day SMA at 1,759.
Although the quick pullback was not enough to dissolve the broader neutral structure formed between the 1,835 and 1,721 boundaries, negative risks have not entirely faded yet. Particularly, with the RSI set to cross below its 50 neutral level, the MACD hovering within a narrow range marginally below its zero line, and the Stochastics pointing southwards again after printing a new lower high, the odds for a meaningful rally are looking low at the momentum.
Yet, with the price having pinned a higher low at 1,722 at the end of September, the horizontal trajectory has still a bullish tilt.
Nevertheless, a clear close below the tentative supportive trendline seen at 1,745 is epxected to trigger the next bearish round. If that’s the case, the price could retest September’s low of 1,722 and the long-term dashed restrictive line before diving towards the 5-month low of 1,680.
On the upside, a sustainable move above the 200-day SMA and the 1,805 resistance area is required to raise buying confidence up to the 1,835 ceiling. Should the bulls claim the latter, the rally could accelerate towards the 1,870 barrier, while higher, all eyes will turn to the crucial 1,900 – 1,916 territory.
In brief, gold could remain at a disadvantageous position in the next couple of sessions, though traders may not consider significant selling engagements unless the bears press the price below the 1,745 – 1,711 area.
EUR/AUD Daily Outlook
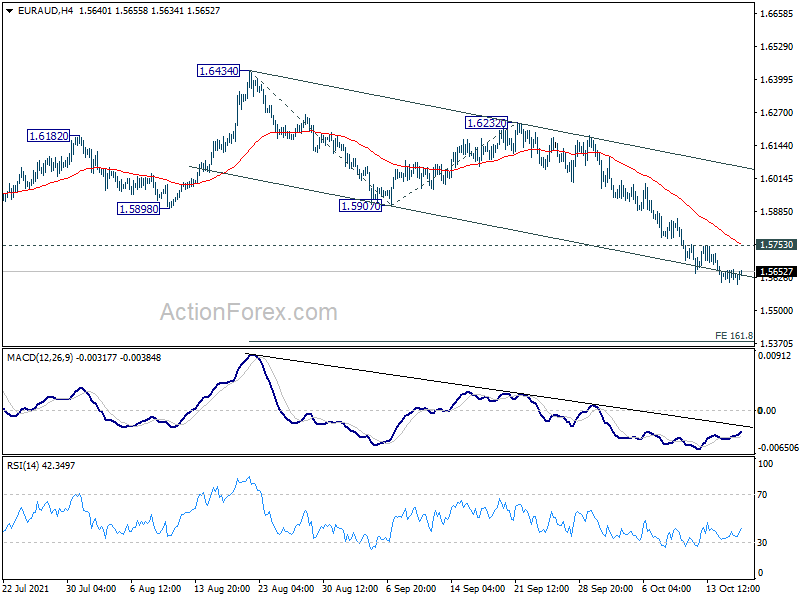
Daily Pivots: (S1) 1.5608; (P) 1.5634; (R1) 1.5659; More...
Intraday bias in EUR/AUD remains mildly on the downside at this point. Current fall from 1.6434 should target 161.8% projection of 1.6434 to 1.5907 from 1.6232 at 1.5379 next. On the upside, above 1.5753 minor resistance will turn intraday bias neutral and bring consolidations. But near term outlook will remain bearish as long as 1.5907 support turned resistance holds.
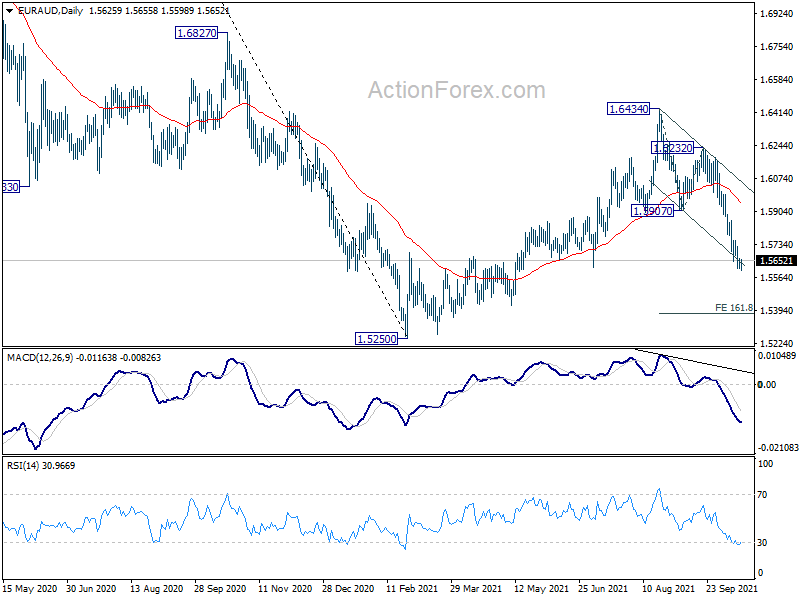
In the bigger picture, rise from 1.5250 medium term bottom is seen as a correction to the down trend from 1.9799 (2020 high) only. With 38.2% retracement of 1.9799 to 1.5250 at 1.6988 intact, such down trend is expected to resume at a later stage. Firm break of 1.5250 will target 61.8% retracement of 1.1602 (2012 low) to 1.9799 at 1.4733. In any case, sustained break of 1.6988 fibonacci level is needed to indicate long term reversal.
EUR/CHF Daily Outlook
Daily Pivots: (S1) 1.0693; (P) 1.0716; (R1) 1.0730; More....
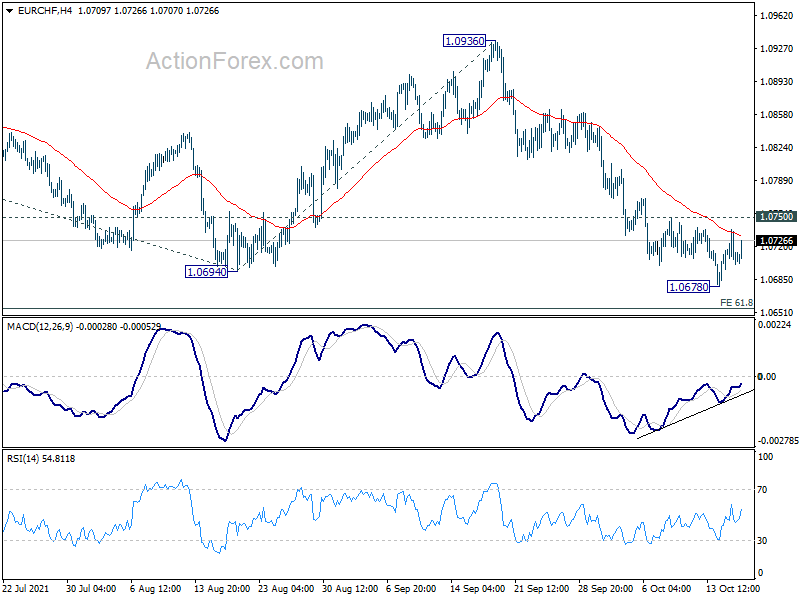
Intraday bias in EUR/CHF remains neutral first and further decline is expected with 1.0750 minor resistance intact. On the downside, break of 1.0678 will turn bias back to the downside for 61.8% projection of 1.1149 to 1.0694 from 1.0936 at 1.0655. Sustained break there will pave the way towards 100% projection at 1.0481. On the upside, break of 1.0750 will indicate short term bottoming and bring stronger rebound first.
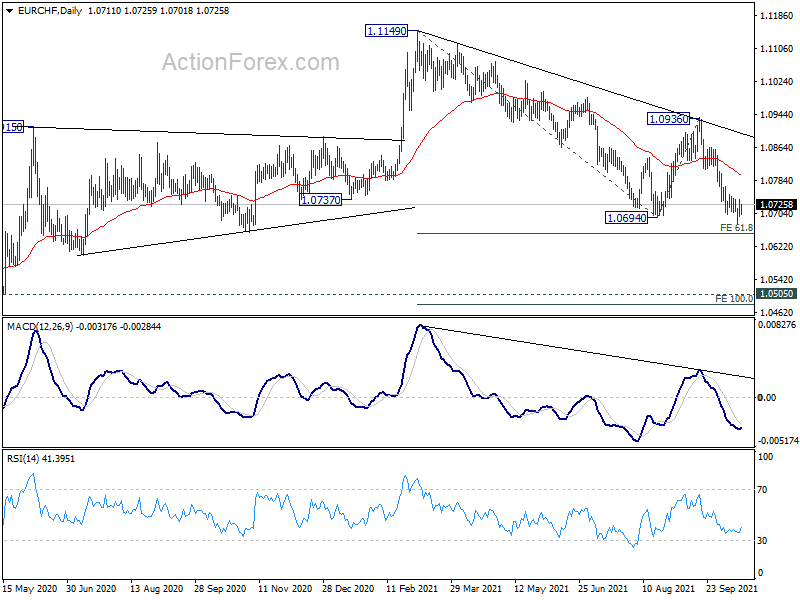
In the bigger picture, the rejection by 55 week EMA maintains medium term bearishness. Fall from 1.1149 (2021 high) is currently seen as the second leg of the patter from 1.0505 (2020 low) first. Hence, in case of deeper fall, we'd look for strong support from 1.0505 to bring rebound. However, sustained break of 1.0505 will resume the long term down trend from 1.2004 (2018 high). Also, medium term outlook will now be neutral at best as long as 1.0936 resistance holds.
Daily Technical Analysis
EUR/USD
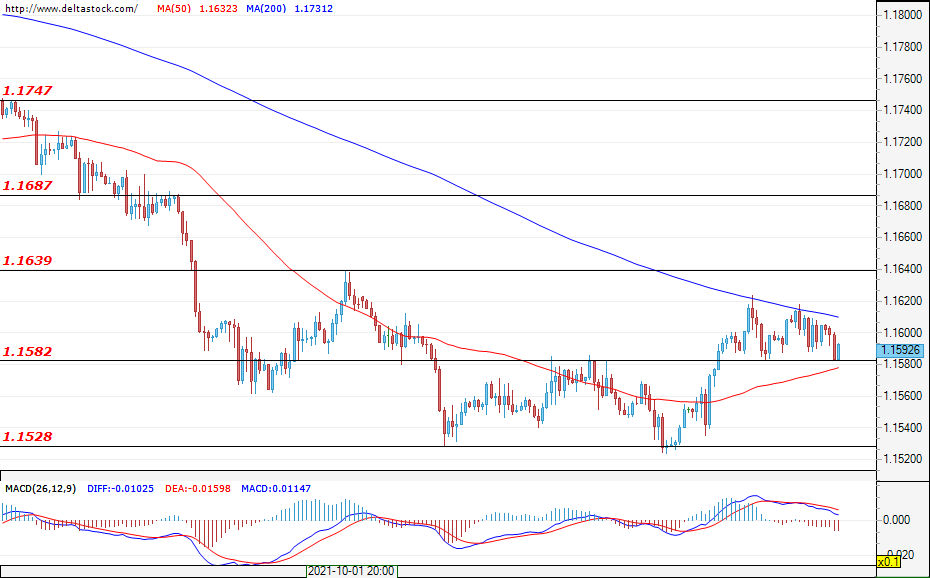
Current level - 1.1592
The currency pair is currently holding steady above the support of 1.1582, but the momentum of the bulls was not strong enough to test the resistance of 1.1640. Two scenarios are possible in the development of this complex pullback. In the first one, the failure of the bears to breach the 1.1528 support would make them look for better prices above 1.1582 and to fill in their ranks. In this case, a breach of 1.1528 would provoke a drop towards 1.1400. Given that the bulls are able to hold their positions and manage to attack 1.1640, they would heighten their chances for success and the next target for them would be the zone of 1.1670-1.1690. This week, more significant news affecting the pair is the housing data for the United States on Tuesday at 12:30 GMT.
| Resistance | Support | ||
| intraday | intraweek | intraday | intraweek |
| 1.1640 | 1.1750 | 1.1582 | 1.1410 |
| 1.1687 | 1.1800 | 1.1528 | 1.1280 |
USD/JPY
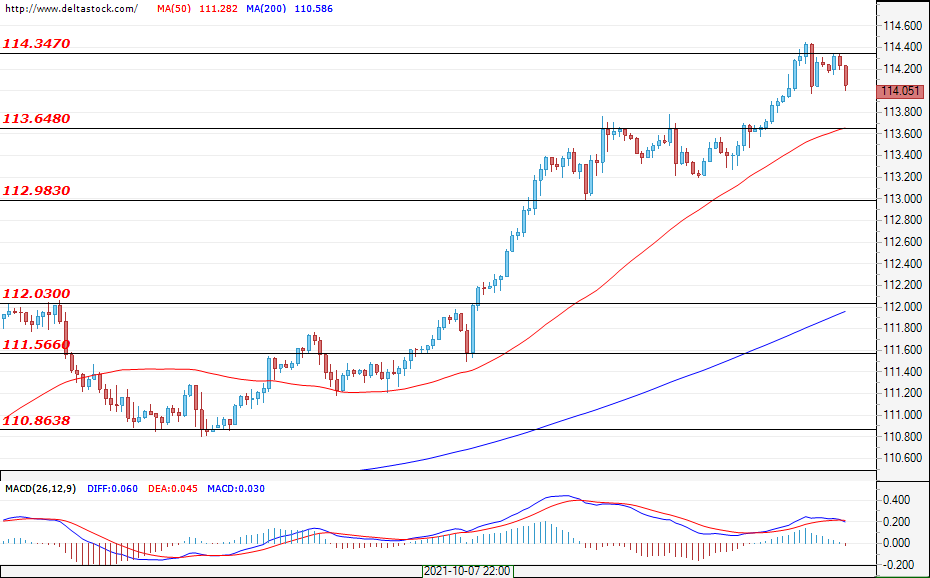
Current level - 114.05
The bulls did not manage to gain enough momentum to successfully breach the resistance zone of 1.1597 and, during the early hours of today`s trading session, the pair is trading just under the mentioned level. A new test of the level in question is a highly probable scenario and, if successful, the pair will most likely continue to recover and target the resistance level of 1.1639. However, if the bears regain control of the market and breach the support zone of 1.1528, the common European currency will most likely continue to lose ground against the greenback and move towards the levels of around 1.1400. During today’s session, volatility could spike when the data for the retail sales in the U.S. is announced (today; 12:30 GMT).
| Resistance | Support | ||
| intraday | intraweek | intraday | intraweek |
| 114.34 | 117.90 | 113.64 | 112.00 |
| 115.60 | 118.50 | 113.00 | 111.56 |
GBP/USD
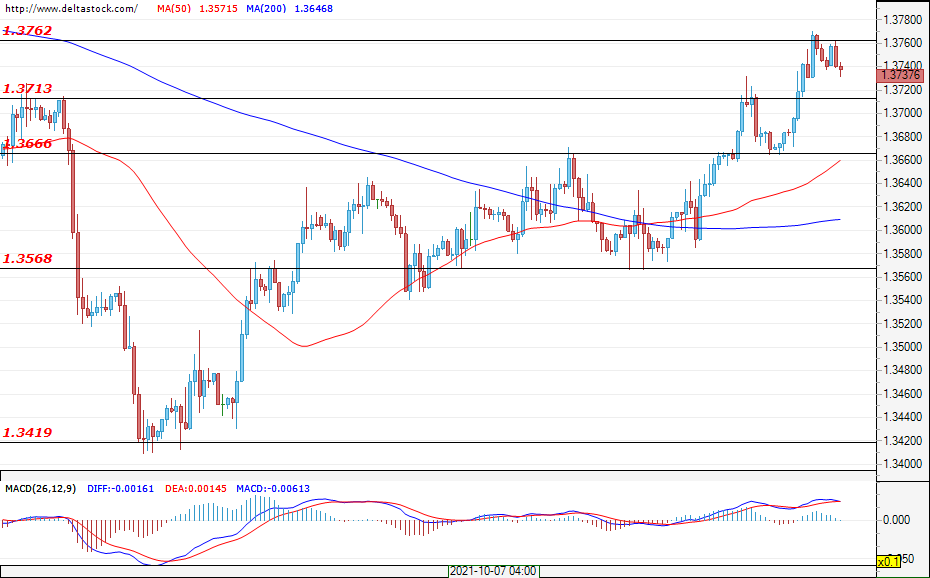
Current level - 1.3737
The Cable managed to breach the key resistance of 1.3713 and reached the next one of 1.3760. Expectations remain positive – for the recovery to continue, and corrective movements should remain limited above 1.3666. Consumer price index data is expected this week (Wednesday; 12:30 GMT) for the United Kingdom. Higher-than-expected data could lead to speculation about raising interest rates and appreciation of the sterling.
| Resistance | Support | ||
| intraday | intraweek | intraday | intraweek |
| 1.3762 | 1.3830 | 1.3713 | 1.3570 |
| 1.3830 | 1.3900 | 1.3666 | 1.3420 |