Sample Category Title
Through the Roof – NZ Consumers Price Index
- Inflation in New Zealand has been running hotter than we or the Reserve Bank expected, boosted by a potent cocktail of supply-side cost pressures and strong demand.
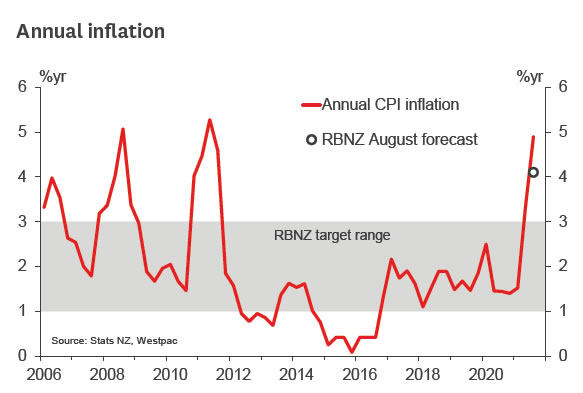
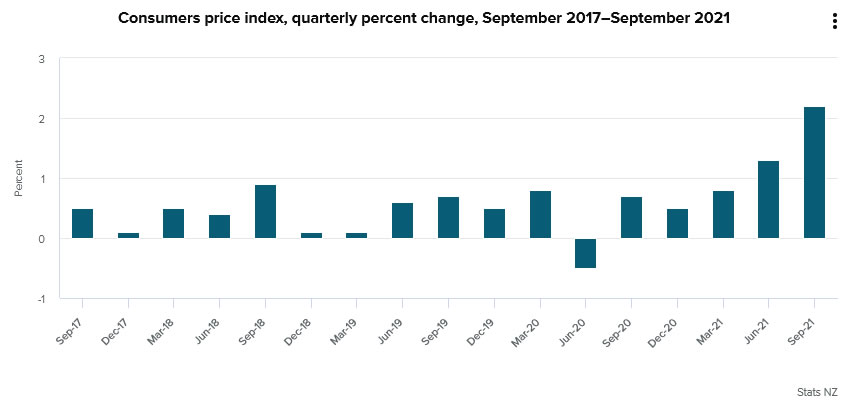
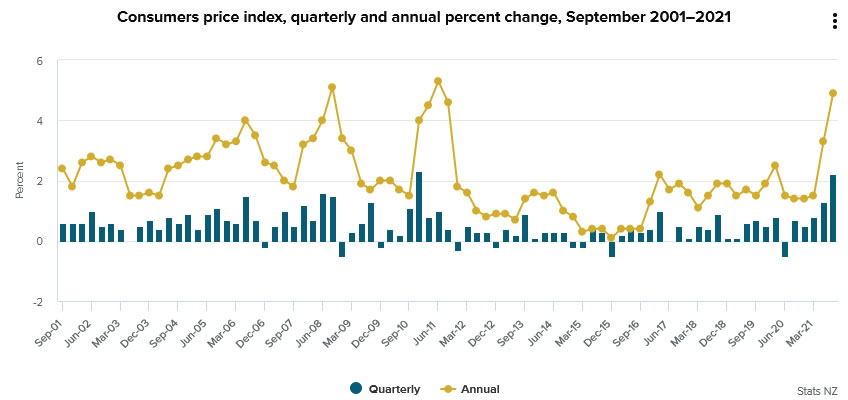
- Consumer prices rose by 2.2% in the September quarter. That resulted in the annual inflation rate rising to 4.9% - up from 3.3% last quarter and the highest level since 2011's GST related spike.
- The sharp rise in inflation over the past year has been broad based, and Covid-19's fingerprints are all over it.
- We expect that inflation will remain strong over the coming year, and that there will be a series of rate hikes from the RBNZ over the coming months.
Consumer prices rose by 2.2% in the September quarter. That resulted in the annual inflation rate rising to 4.9% - up from 3.3% last quarter and the highest level since 2011's GST related spike.
The September quarter increase was well above our own and the average market forecast for a 1.5% increase. Inflation has also been running much hotter than the RBNZ's last published forecast (released in August).
The rise in inflation over the past year has been broad based, and Covid-19's fingerprints are all over it. Ongoing disruptions to global manufacturing and supply chains have resulted in shortages of many goods, as well as strong increases in transport costs. At the same time, the recovery in global demand has seen commodity prices pushing higher, with global oil prices doubling over the past year.
Closer to home, the closure of our borders has meant that businesses across the nation are struggling to find staff, and wage costs have been rising as competition for workers has increased.
However, the rise in inflation isn't just due to cost pressures – domestic demand has recovered much faster than expected. That has given businesses greater leeway to pass on cost increases into the prices of consumer goods.
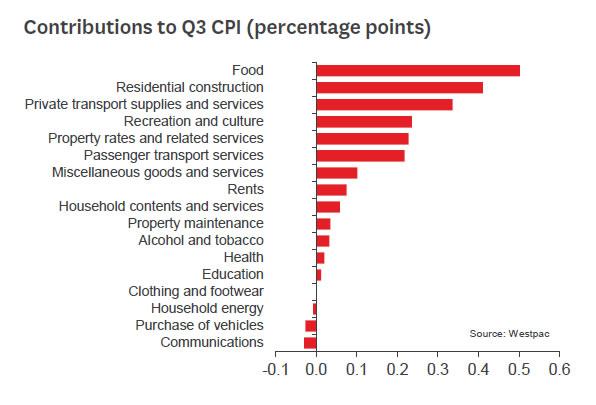
The combination of rising cost pressures and strong demand was clearly evident in the September quarter inflation figures. For instance, there was a particularly large increase in the cost of building a new home, with building activity running hot and many construction firms struggling to source materials. Construction cost rose 4.5% over the past three months alone. That follows a similar sized increase last quarter and leaves construction costs up 12% over the past year.
We also saw larger than expected increases in the prices for many recreational consumer goods, like toys and computer equipment, as well as firmness in the prices for household furnishings and durables. Spending in these categories has been running hot since Covid-19 first arrived on our shores, and across the globe retailers are struggling to get enough stock to keep up with demand.
On top of the above rises, the September quarter also saw a strong 2.7% increase in food prices, underpinned by higher prices for groceries, meat/poultry, and fruit and vegetables in recent months. The annual increase in local authority rates was also larger than it has been in some time, rising by 7.1%. However, inflation pressures have not been limited to a few categories. Strength in inflation remains broad based, with most of the measures of core (underlying) inflation released from Stats NZ today running above 3%. In many cases they are running above 4%.
Inflation is expected to remain above the RBNZ's target band through much of the coming year. The supply side pressures that have been adding to inflation in recent months look set to endure for some time yet, and they could become even more pronounced over the coming months as we head into the holiday shopping season here and abroad.
But even when those supply side cost pressures eventually ease, inflation is expected to remain firm, underpinned by strength in domestic demand. And while the current elevated Alert Level in parts of the country may moderate some of that strength in the near term, we expect that activity will recover quickly when the Alert Level is eventually dialled back. Consequently, we're still looking at a strong medium-term inflation outlook.
That firmness in demand and related persistence in inflation pressures is especially important for the RBNZ. While central banks often look through temporary cost shocks (like a spike in oil prices), inflation pressures in New Zealand are set to remain strong for some time. Indeed, inflation expectations have been pushing higher and large numbers of businesses are signalling that they plan to increase their prices over the coming months.
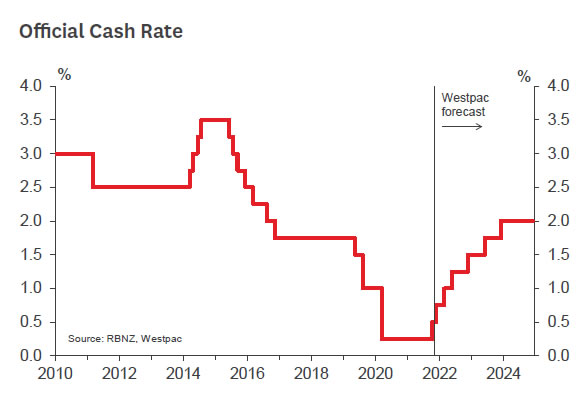
Against this backdrop, we expect a series of OCR hikes from the Reserve Bank over the coming months. We've pencilled in 25bp increases at the November, February and May policy announcements. At that point, we expect that the RBNZ will pause to assess how the economy is tracking, with the OCR set to continue gradually rising back to 2% further ahead.
Despite the much stronger than expected September quarter CPI result, we don't think a 50 basis point hike is likely in November. The RBNZ has previously noted that it is conscious of the two-sided risks surrounding the economic outlook. And with the current period of a heightened Alert level dragging on longer than expected, the RBNZ is more likely to move in a series of smaller steps rather than in large bounds.
Forex and Cryptocurrencies Forecast
EUR/USD: Correction or Trend Change?
Having reached a local low of 1.1523 on Tuesday October 12, EUR/USD ended a five-week downward marathon, turned, and moved up. Since autumn started, the dollar has won back 385 points from the euro. And is the pan-European currency going to regain losses now?
The situation is actually ambiguous. Some experts expected a much more powerful correction further north. But it didn't happen: the pair managed to rise only to 1.1624 and ended the five-day run at 1.1600.
The week's data show that the US economy continues to recover fairly quickly, increasing to almost 100% the chance that the Fed will start tapering monetary stimulus (QE) program next month.
Initial claims for unemployment benefits in the US fell to 293,000 for the first time since the start of the COVID-19 pandemic (down 36K against 14,000 forecast). And the number of those already receiving benefits, with the forecast of 78 thousand, decreased by 134 thousand: from 2.72 to 2.59 million. Producer prices also showed an increase, from 8.3% to 8.6% (with a forecast of 8.5%). Year-on-year, therefore, inflation of these prices showed the most powerful uptick in history.
It should be noted that the Producer Price Index serves as a leading indicator for consumer prices. And consequently, inflation can be expected to continue rising, bringing the beginning of the end of QE closer. Especially as retail sales released on Friday 15th October were also in the green zone: plus 0.7% versus the forecast minus 0.2%.
And here the question arises: if everything is so good in the US economy, why hasn't the pair continued its precipitous decline? Grasping at straws, euro-bulls are likely still hoping that the winding down of the fiscal stimulus program will be delayed at least until December. This is supported by the jump in stock indices: the S&P500 rose 3 per cent in the second half of the week (its highest gain in seven months) and the Dow Jones rose 3.4 per cent. This index has not seen such a big break in almost three months.
So what to expect from EUR/USD in the near future? Continuation of the downtrend after the correction? A stronger euro and an upward trend reversal? Or respite in the side channel?
The readings of the indicators on D1 look quite chaotic. Among oscillators, 55% are red, 15% green, and the remaining 30% are neutral grey. There is a lack of unity among trend indicators as well: 65% of them point south and 35% are looking north. The graphical analysis draws the pair's rise to 1.1725, then a fall back and move in the range of 1.1585-1.1725.
As for analysts, 20% favour further decline of the pair, 50% are for its growth, and 30% have taken a neutral stance. Support levels are 1.1585, 1.1560, 1.1520, 1.1485 and 1.1450. Resistance levels are 1.1625, 1.1685 1.1715, 1.1800, 1.1910.
For next week's events, the European Council meeting on Thursday October 21 and the Markit Manufacturing PMI in Germany and in the Eurozone as a whole on October 22 can be noted. The decision of the People's Bank of China on the interest rate, which will be made public on Wednesday, October 20, may also rock the pair.
GBP/USD: The Victory Is with the Pound So Far
Unlike its European neighbour, the British pound continues to strengthen actively against the dollar: the GBP/USD pair showed a 360-point gain (from 1.3412 to 1.3772) since September 29 and finished at 1.3744. The reason for this dynamic is understandable and lies in the Bank of England's intention to start tightening monetary policy and raising interest rates considerably in the foreseeable future.
As we have already written, according to Citibank experts, the pound is currently supported by the following factors. First is the UK's success in the fight against COVID-19. Secondly, the reduction of political risks associated with the negotiations between the EU and the UK on the Northern Ireland Protocol and the rejection of the referendum on the independence of Scotland. And of course, this is the decision of the Bank of England on a possible increase in the key interest rate to 0.25% in May 2022 and to 0.50% in December. Such prospects for UK monetary policy, according to Citibank analysts, are "well placed to confront Fed policy", which is what we have seen during October.
However, once the Fed moves to wind down its QE programme, things could change dramatically in favour of the dollar. 60% of experts predict at the moment that the pair will head south again to test the supports at 1.3675, 1.3600, 1.3575, 1.3525 and 1.3400. 20% of analysts vote for the continuation of the upward trend (resistance levels and targets of bulls 1.3770, 1.3810, 1.3900 and 1.4000). And 20% of experts, supported by graphical analysis on D1, predict a sideways trend.
Among the indicators, a significant advantage is still on the side of the green. 60% of oscillators and 100% of trend indicators indicate the continuation of the uptrend on the daily timeframe. 25% of oscillators signal that the pair is overbought, and 15% are in a neutral position.
As for the economic calendar for the coming week, attention should be paid to such an important measure of inflation as the UK CPI (due on Wednesday October 20), as well as Markit's UK services PMI to be released on Friday October 22.
USD/JPY: Per Aspera Ad Astra
There is such an expression in Latin, Per aspera ad astra, the authorship is attributed to the ancient Roman philosopher Lucius Anna Seneca. It literally translates as "Through hardships to the stars" and means "Through difficulties to victory." This is exactly what the USD/JPY bulls won.
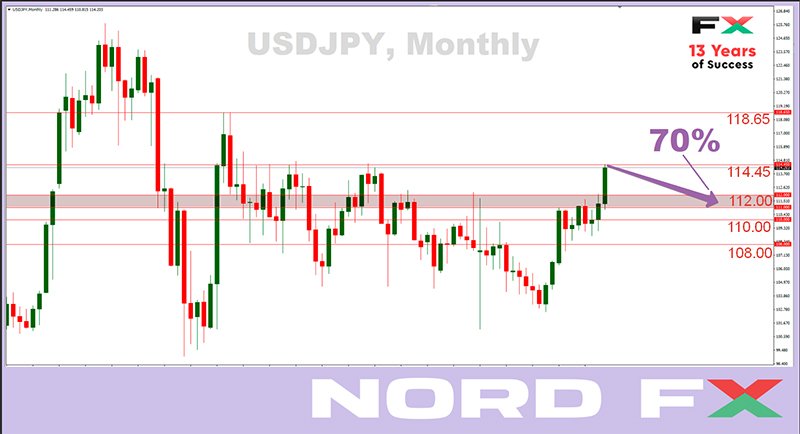
Most experts expected that they would not calm down until they took the 112.00 height by storm. And now, finally, their months-long efforts have succeeded. And in a great way. After jumping 222 points over the week, the pair reached a height of 114.45 on Friday October 15, and the last chord was slightly lower at 114.21, near the upper limit of the trade range since the beginning of 2017.
Such a fiasco of the Japanese currency is fully consistent with its role as a haven currency and reflects a stable inverse relationship between its rate and the demand for risks. The growing interest of investors in the American and Japanese stock markets (the Japanese stock index Nikkei 225 grew in parallel with the S&P 500) dealt a strong blow to the yen. A pullback in energy prices, which the country mostly imports, supported the market's appetite for Japanese stocks as well.
According to Japanese Finance Minister Shunichi Suzuki, the weak yen supports exporters, but inflates import costs for a number of companies and consumers. At the same time, he said that the stability in the Forex market is important for the government, and it closely monitors the impact of exchange rates on the Japanese economy. But the minister refused to comment directly on the current situation.
However, the yen's fall in two weeks of October looks too fast against the background of the dynamics of the last five months. And this could be the reason for a strong correction of the USD/JPY pair to the south. So 70% of analysts believe that the pair will return to the 111.00-112.00 zone within the next three to five weeks. However, the bulls will have the advantage in the short term. According to 55% of experts, the continued interest of investors in the stock market could lead to further weakening of the Japanese currency.
At the time of writing this review, 75% of oscillators and 100% of trend indicators on D1 indicate further growth in the pair. 25% of oscillators signal that it is overbought and a possible correction. The resistance levels are 114.55 and 115.50, the long-term target of the bulls is the December 2016 high of 118.65. Support levels are 113.80, 113.25, 112.00 and 111.65.
CRYPTOCURRENCIES: BTC's New Target Is $68,000
China-related news almost reversed the bitcoin trend south again on Wednesday, October 13. Binance, the largest cryptocurrency exchange, has announced, following other exchanges, that it will stop serving Chinese clients and remove the yuan from the list of supported currencies as of December 31.
Prior to Beijing's repressions, residents of this country formed one of the major parts of the crypto community, with the country leading bitcoin mining. Back in 2020, its share was 50-60% of the global hash rate. The situation has changed dramatically since then and, according to Cambridge University, the top three in crypto mining are now the United States (35.4%), Kazakhstan (18.1%) and Russia (11.2%).
If you look at the map, you can see that the last two of these countries have a land border with China, which made it possible to move numerous mining equipment there. As a result, illegal miners in some Russian border regions have increased annual electricity consumption by 160%.
Time will tell whether China will win or lose from the imposed bans. This applies to other countries as well, some of which seek to tighten legislation in this area as much as possible, while others are very loyal to digital assets. For example, Director of US National Intelligence John Ratcliffe sent a letter to the SEC chairman last year asking him not to restrict the activities of US miners. There is no need to talk about El Salvador, which recognized bitcoin as the official currency.
Interestingly, this decision was heavily criticized by ethereum creator Vitalik Buterin. "Shame on everyone (okay, I'll name the main culprits: shame on bitcoin maximalists) who praise him [El Salvador President Nayib Bukele] without any criticism," Buterin wrote on Reddit. And he stressed that the process of forcibly integrating digital assets into the financial system "runs counter to the ideals of freedom that should be appreciated by members of the cryptocurrency community. In addition, the tactic of simultaneously distributing BTC to millions of El Salvadorians with little or no prior training is reckless and fraught with the risk of large numbers of innocent people being hacked or tricked."
The Capgemini Research Institute is also concerned with the question of how widely cryptocurrencies have entered the life of ordinary people. In addition to surveys conducted in many countries, it examined statistics from the Bank for International Settlements, the European Central Bank, the International Monetary Fund, the World Bank and other central banks.
Capgemini noted that less than 10% of consumers currently use cryptocurrency for payments. However, the institute predicts that nearly 45% of customers will use this new payment method in one to two years. This trend will be supported by the growing demand for international payments and the reluctance to pay high transaction fees.
If the world's leading powers don't start chasing bitcoin after China, the flagship cryptocurrency has a lot of chances to to bypass leading corporations and even entire sectors of the world economy in terms of capitalization.
According to Coinmarketcap, the largest capitalization currently belongs to Apple ($ 2.34 trillion), followed by Microsoft, Google, Amazon, and BTC is in fifth place. If you look at the statistics, the total capitalization of the stock market is currently about $100 trillion, the capitalization of the gold market is around $12 trillion, the total capitalization of the cryptocurrency market at the time of writing the review is $2.42 trillion, and the capitalization of BTChas already reached $1.12 trillion (dominance index 46.24%).
Bitcoin continued to delight investors over the past week. Over the seven days, the BTC/USD pair rose 16% to reach a local high of $62,880. Projections supported by many experts suggest that it will soon test the historic high of $64,810 on April 14. If successful, taking into account the statistical volatility, the pair will reach the $68,000, followed by a serious correction associated with massive profit taking.
However, despite a possible pullback, the mid-term outlook for this pair remains positive. The next major resistance level is located in the $80,000-81,000 area. American Crypto Exchange Kraken experts believe that the price of the flagship asset could reach $100,000 by the end of 2021. Based on the analysis of the dynamics of previous years, a calculation was made, according to which, the price of bitcoin tends to grow during the fourth quarter of any year. During this period, "the average and median returns reached +119% and +58%, respectively." If the average return of the previous 2020 year recurs, BTC could end the year close to $100,000. More precisely, around $96,000. However, if we see not the average, but the median profitability, Kraken experts write, then the price of bitcoin will rise to about $70,000.
The Crypto Fear & Greed Index climbed from the Fear Zone to the Greed Zone in the two weeks of October to reach 71 points. However, this does not mean that the market is strongly overbought, and, in the opinion of the index developers, it can still be dangerous to open short positions in this situation.
BoE Bailey sent another signal that “we have to act”
BoE Governor Andrew Bailey warned that rising energy prices means inflation will "last longer" and "get into the annual numbers for longer as a consequence." The development raised the "fear and concern of embedded expectations."
"Monetary policy cannot solve supply-side problems," he noted. "But it will have to act and must do so if we see a risk, particularly to medium-term inflation and to medium-term inflation expectations"
"That's why we, at the Bank of England have signaled, and this is another signal, that we will have to act", he said. "But of course that action comes in our monetary policy meetings."
ECB Lagarde: Inflation is largely transitory
ECB President Christine Lagarde repeated on Saturday that "inflation is largely transitory". "Monetary policy will continue supporting the economy in order to durably stabilize inflation at our 2% inflation target over the medium term," she said. "The ECB is committed to preserving favorable financing conditions for all sectors of the economy over the pandemic period."
"Once the pandemic emergency comes to an end -- which is drawing closer -- our forward guidance on rates as well as asset purchases will ensure that monetary policy remains supportive of the timely attainment of our target," Lagarde said.
Separately, Governing Council member Klaas Knot also said the current inflation is "mostly temporary". "It is highly relevant to determine whether this is a temporary phenomenon and goes away or not, and whether this becomes a risk and has secondary effects through higher wages and costs, and that is not the case now," Knot said. "At this moment, we see it as mostly temporary as our economy is reopening after the corona shock and the supply of products is not keeping up with demand."
China GDP growth slowed to 0.2% qoq, 4.9% yoy in Q3
China GDP grew 4.9% yoy in Q3, below expectation of 5.2% yoy. On a quarterly basis, GDP grew only 0.2% qoq, slowed from Q2's 1.2% qoq, and missed expectation of 0.5% qoq. In September, retail sales rose 4.4% yoy, above expectation of 3.3% yoy. Industrial production rose 3.1% yoy, below expectation of 4.5% yoy. Fixed asset investment rose 7.3% ytd yoy, below expectation of 7.9%.
"The overall national economy maintained the recovery momentum in the first three quarters … however, we must note that the current uncertainties in the international environment are mounting and the domestic economic recovery is still unstable and uneven," said NBS spokesman Fu Linghui.
New Zealand CPI rose 2.2% qoq, 4.9% in Q3, highest in over a decade
New Zealand CPI rose 2.2% qoq in Q3, well above expectation of 1.4% qoq. That's the largest quarterly increase in over a decade since 2010. For the 12-month period, CPI accelerated to 4.9% yoy, up from Q2's 3.3% yoy, well above expectation of 4.1% yoy too. The annual rise is also the highest since 2011. The strong inflation reading prompted more expectations of more RBNZ rate hikes ahead, following the 25bps increase earlier this month.
Eco Data 10/18/21
[php_everywhere instance="1"]
Yen Selloff Accelerated on Strong Energy and Commodity Rallies
Yen's selloff accelerated rather steeply last week, on the back of surging commodity and energy prices. Dollar was also pressured this time, as treasury yields retreated and on late rally in stocks. Euro was not to far away, as pressured by selloff in crosses. On the other hand, commodity currencies ended broadly higher, as led by Kiwi and Aussie. Sterling was also strong as aided by increasing speculations of an early BoE rate hike.
As noted before, US stock indexes are probably ready to resume their long term up trend. Industrial metal like copper could also be staging an upside breakout too. Such developments will continue to exert much downside pressure in Yen, while lifting commodity currencies. Dollar's upside, however, could be capped as rise in yields loses momentum.
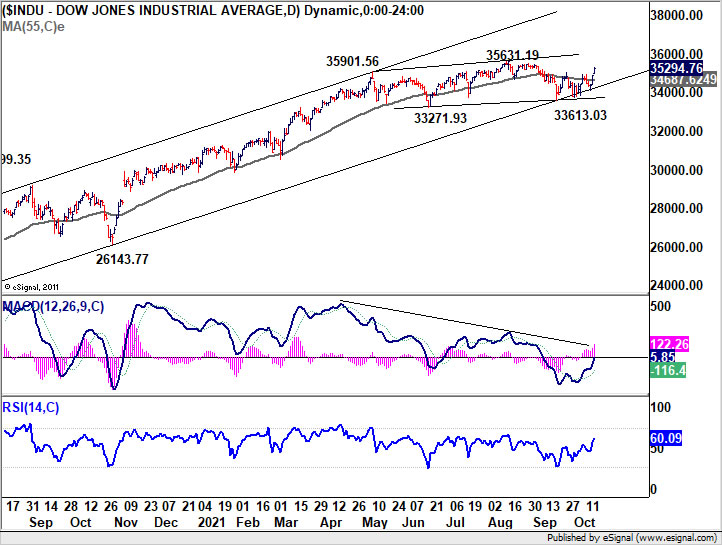
DOW ready to resume long term up trend through 35631 high
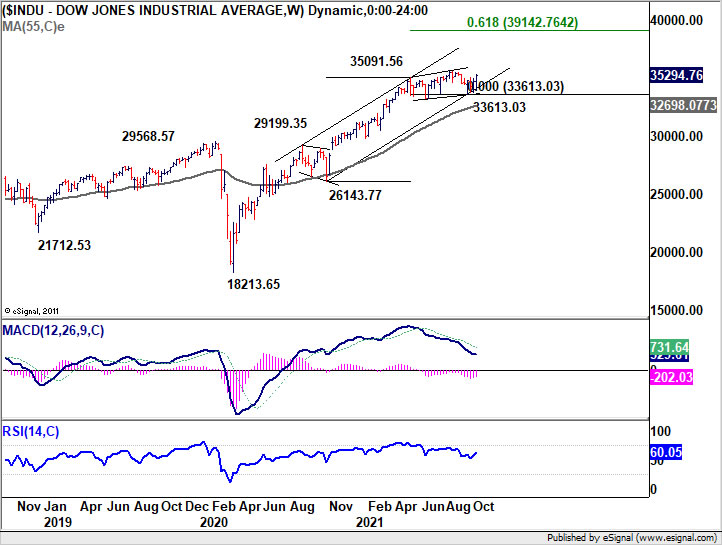
The late rally in DOW last week suggests that it has finally overcome the 55 day EMA with some conviction. We're now viewing price actions from 35091.56 as a three wave consolidation pattern that should have completed at 33613.04, after hitting medium term channel support. That is, long term up trend from 18213.65 (2020 low) is probably ready to resume.
Retest of 35631.19 high should be seen rather soon. Sustained break there will confirm our bullish view. Next target will be 61.8% projection of 26143.77 to 35091.56 from 3361.03 at 39142.76. Such development could spark more explosive selloff in Yen.
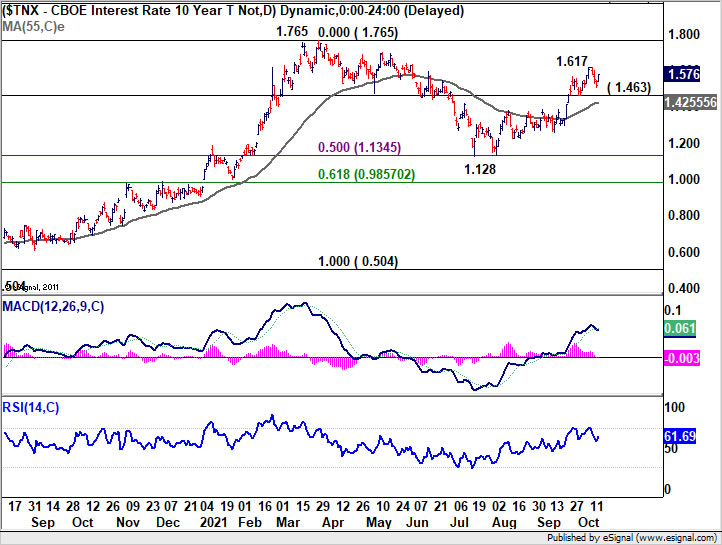
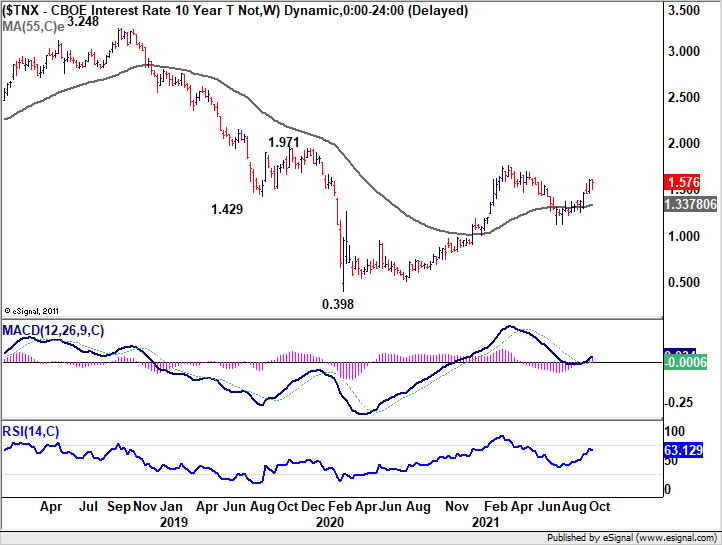
10-year yield still on track to retest 1.765 high, but no sign of breakthrough yet
10-year yield lost momentum after hitting 1.617 the prior week, and turned into consolidation last week. But there is no threat to the near term up trend for now, with 1.463 support intact. Further rise is still expected and break of 1.617 will target 1.765 high. For now, it's unsure if TNX could surge through 1.765. Or, break of 1.1463 support will extend the corrective pattern from 1.765 with another falling leg. Dollar's overall strength could be limited if stocks continue to rally but TNX is capped below 1.765.
Bearish divergence in daily MACD suggests deeper pull back for Dollar index
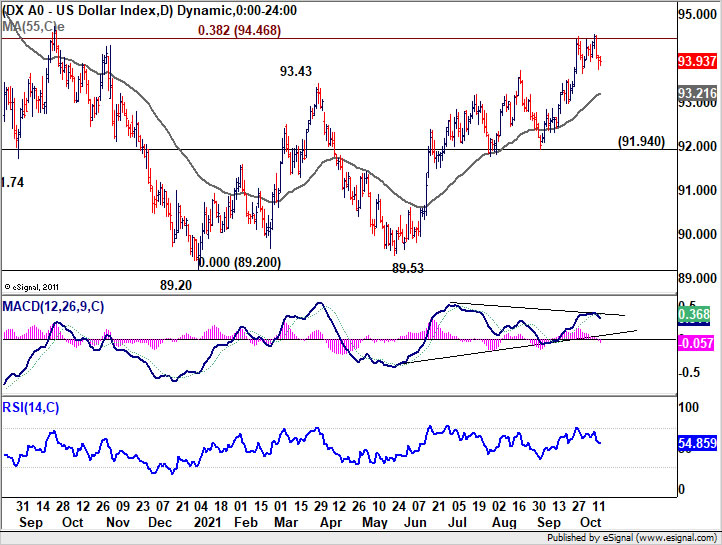
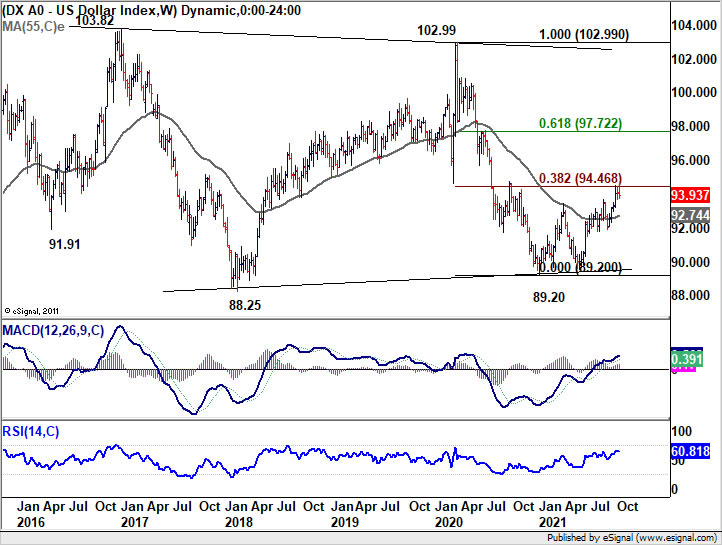
Dollar index edged higher to 94.56 last week, but failed to sustain above 38.2% retracement of 102.99 to 89.20 at 94.46 again. The retreat from there is so far shallow, with help from weakness in Euro and Yen. But bearish divergence condition in daily MACD is raising the chance of a deeper pull back, or even reversal. On the downside, break 55 day EMA (now at 93.21) should confirm short term topping and bring deeper fall towards 91.94 support next.
Nevertheless, sustained break of 94.46 carry larger bullish implication. That is, rise from 89.20 is already reversing the whole down trend from 102.99 (2020 high). In this case, stronger rally would be seen to 61.8% retracement of 97.72 and possibly above.
WTI oil extends up trend, copper to break out soon
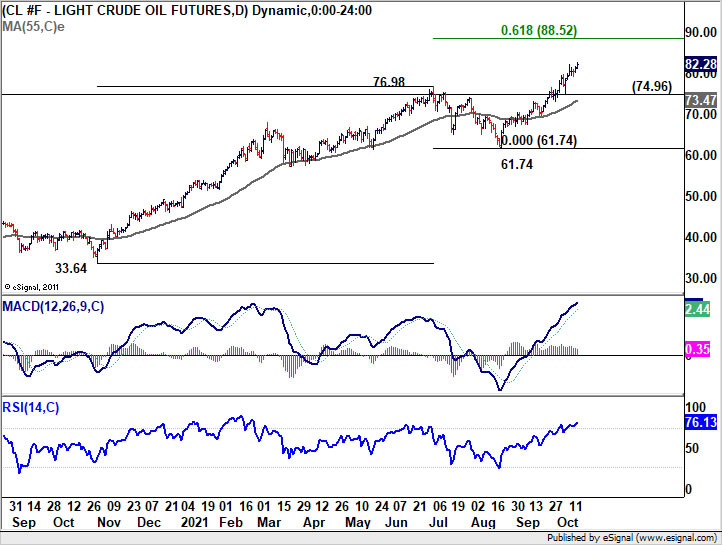
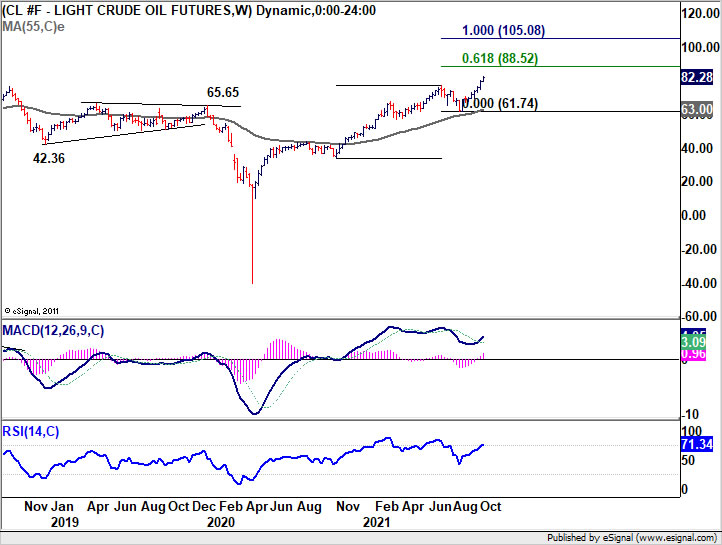
The strong up trend in WTI crude oil continued last week, hitting as high as 82.66. Outlook will continue to stay bullish as long as 74.96 near term support holds. WTI should target 61.8% projection of 33.64 to 76.98 from 61.74 at 88.52 next.
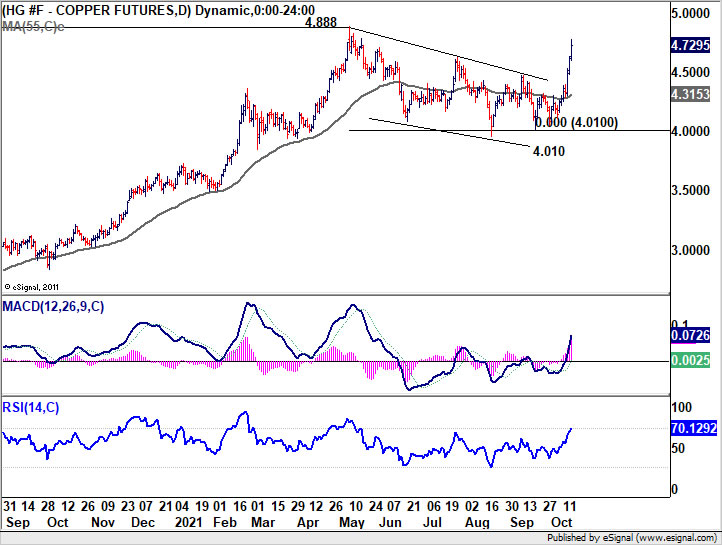
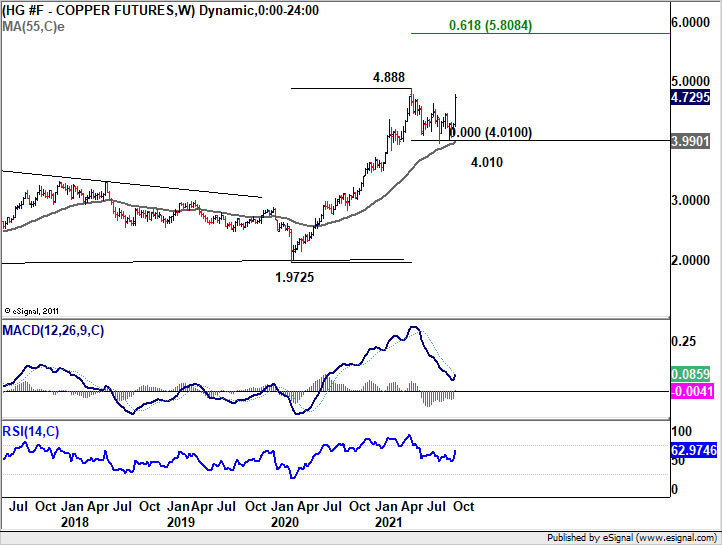
Industrial metals are also catching up. Copper's strong rally last week argues that the triangle consolidation from 4.888 has completed at 4.010 already, after drawing support from 55 week EMA. Based on current momentum, break of 4.888 high should be see rather soon. In that case, up trend from 1.9725 would resume and target 61.8% projection of 1.9725 to 4.888 from 4.010 at 5.808. Both development in oil and copper are not favorable for keeping inflation under control.
CAD/JPY and NZD/JPY upside breakout, AUD/JPY too follow soon
Commodity Yen crosses are clearly the top movers this month, on the back on surging commodity and energy prices, rising global treasury yields, and resistance in investor sentiment.
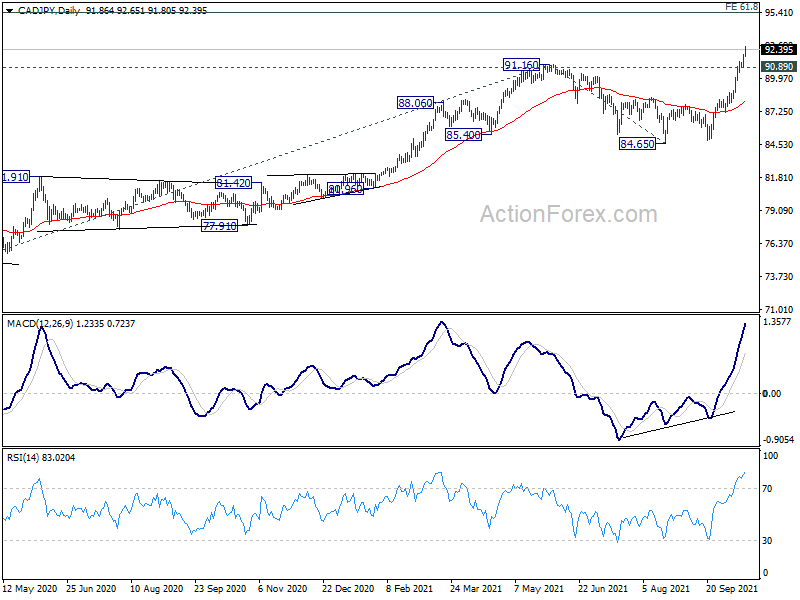
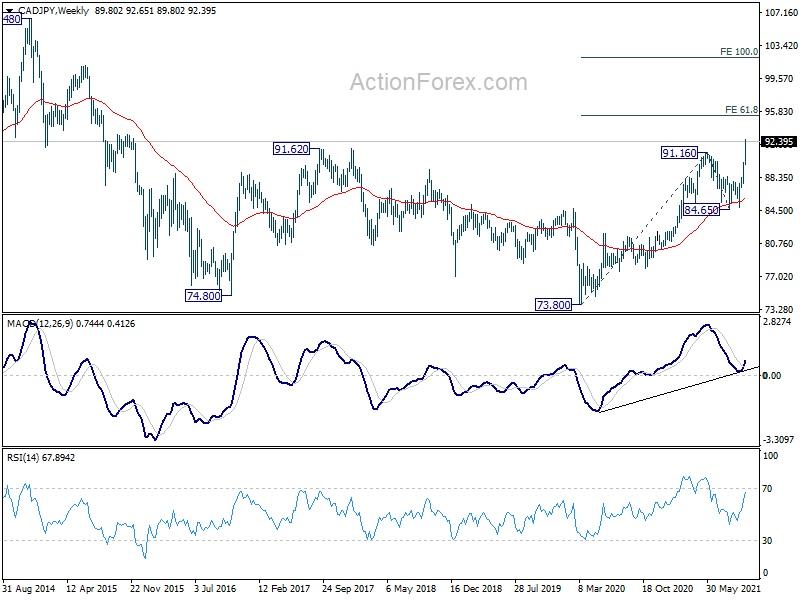
CAD/JPY powered through 91.16 high to resume whole up trend from 73.80 (2020 low). Indeed, the break of 91.62 long term resistance (2017 high) also suggest that the fall from 106.48 (2014 high) has completed with three waves down to 73.80. Near term outlook will now stay bullish as long as 90.89 support holds. Further rise should be seen to 61.8% projection of 73.80 to 91.16 from 84.65 at 95.37 next.
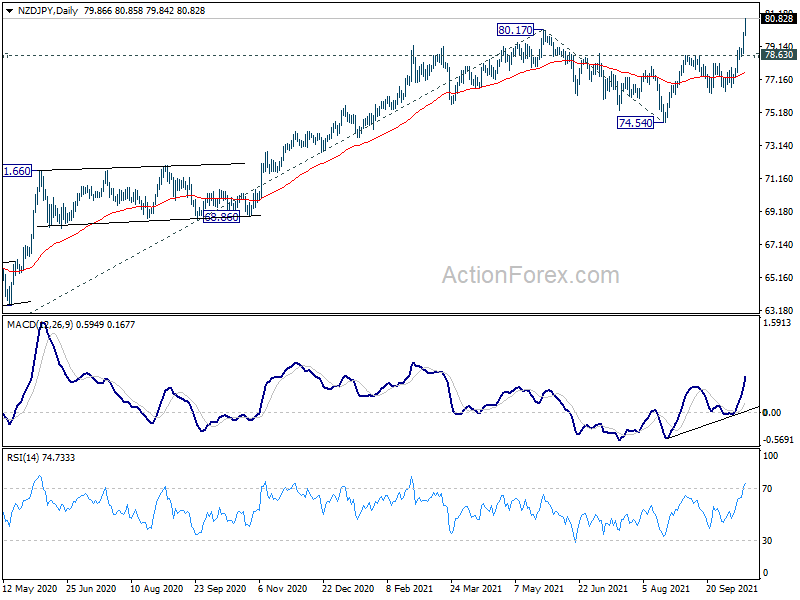
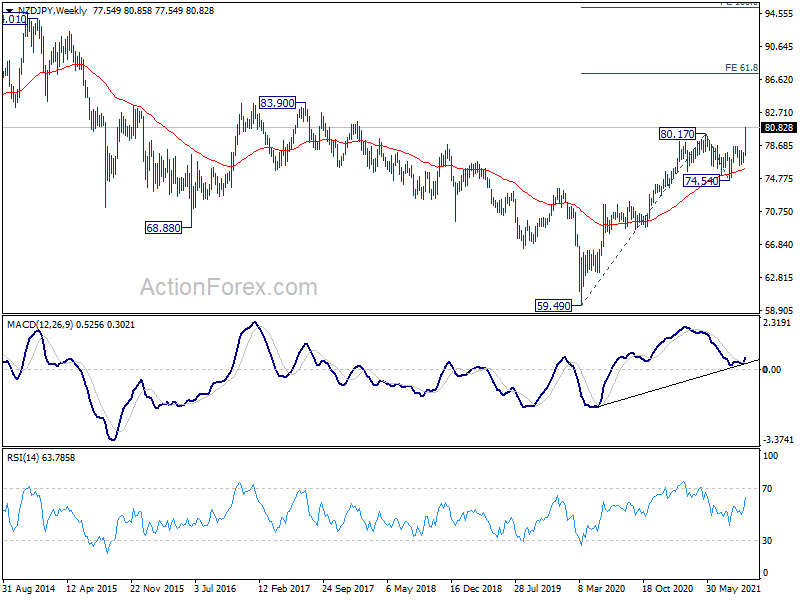
NZD/JPY followed by breaking through 80.17 high to resume the up trend from 59.49 (2020 low) too. Near term outlook will stays bullish as long as 78.63 support holds. Further rise should be seen to 83.90 resistance first. Firm break there will also confirm that fall from 94.01 (2014 high) has completed with three waves down to 59.49. NZD/JPY should then target 61.8% projection of 59.49 to 80.17 from 74.54 at 89.17 next.
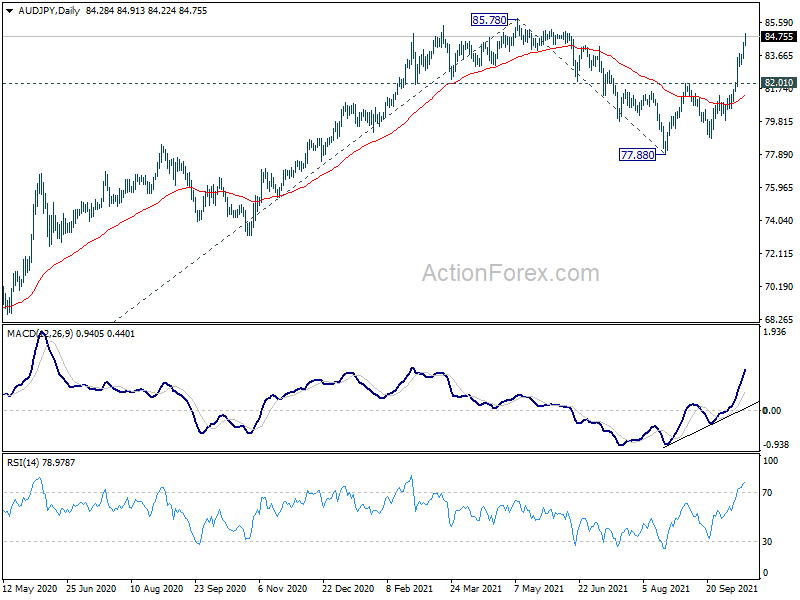
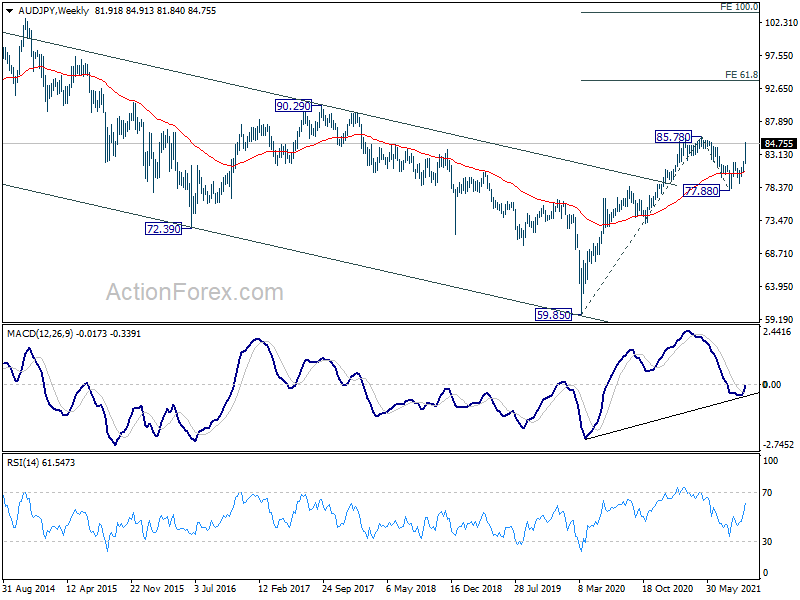
AUD/JPY continued to lag behind, but it's nonetheless on track to follow CAD/JPY' and NZD/JPY's path, and should break through 85.78 high soon. In the case, up trend form 59.85 (2020 low) should resume for 90.29 long term resistance first. Sustained break there should confirm that whole decline from 105.42 (2013 high) has completed with three waves down to 59.85. Next target will be 61.8% projection of 59.85 to 85.78 from 77.88 at 93.90.
GBP/USD Weekly Outlook
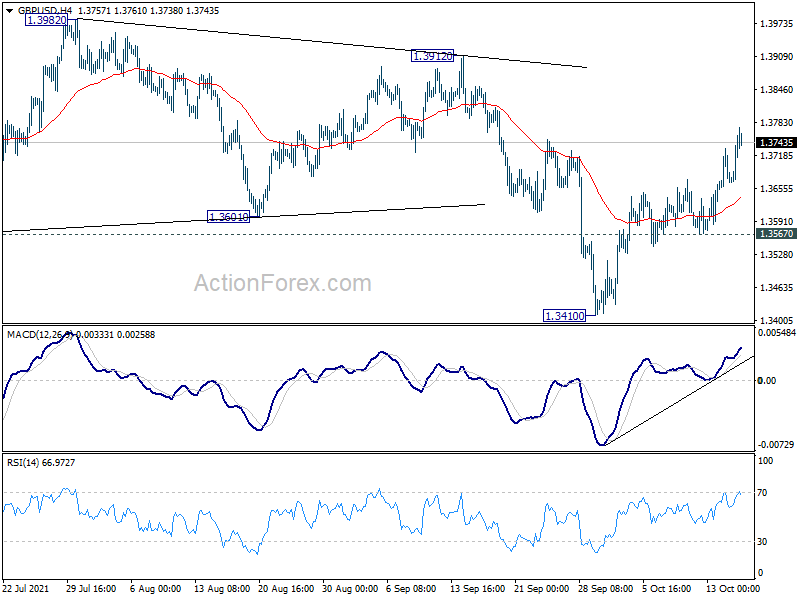
GBP/USD's rebound from 1.3410 extended higher last week and broad 55 day EMA. Initial bias stays on the upside this week for 1.3912 key structural resistance. Firm break there will indicate that the correction from 1.4248 is complete with three waves down to 1.3410. Further rally would then be seen to retest 1.4248 high. On the downside, however, break of 1.3567 support will turn bias back to the downside for 1.3410 low instead.
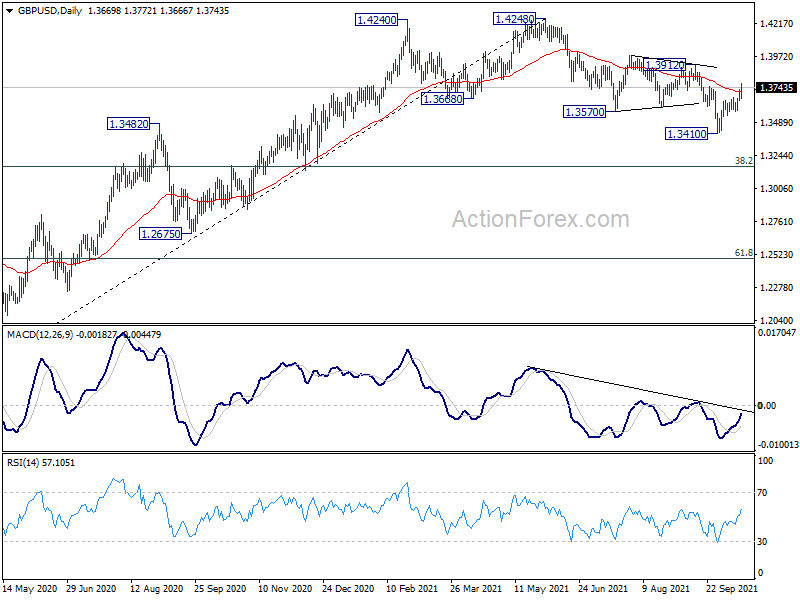
In the bigger picture, the structure of the fall from 1.4248 suggests that it's a correction to the up trend from 1.1409 (2020 low) only. While deeper fall cannot be ruled out yet, downside should be contained by 38.2% retracement of 1.1409 to 1.4248 at 1.3164, at least on first attempt, to bring rebound. ON the upside, firm break of 1.4376 key resistance (2018 high) will add to the case of long term bullish reversal. However, sustained trading below 1.3164 will revive some medium term bearishness and target 61.8% retracement at 1.2493.
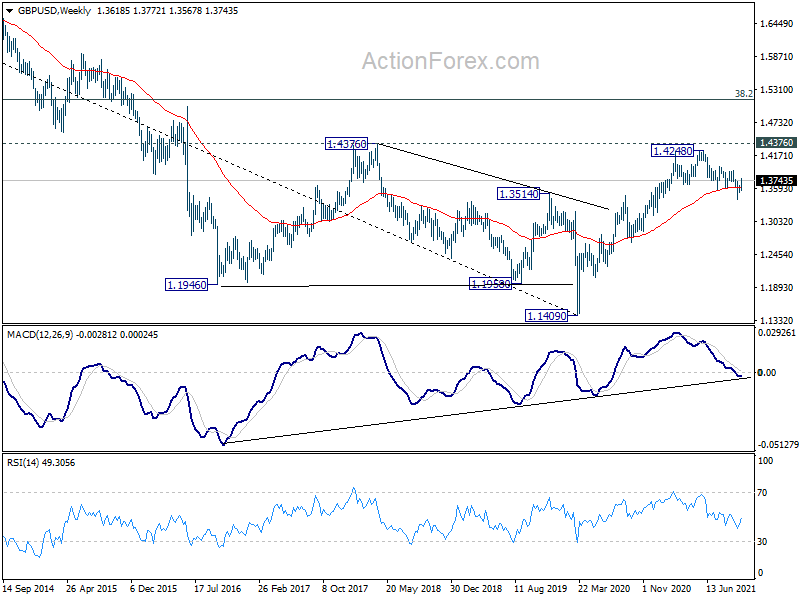
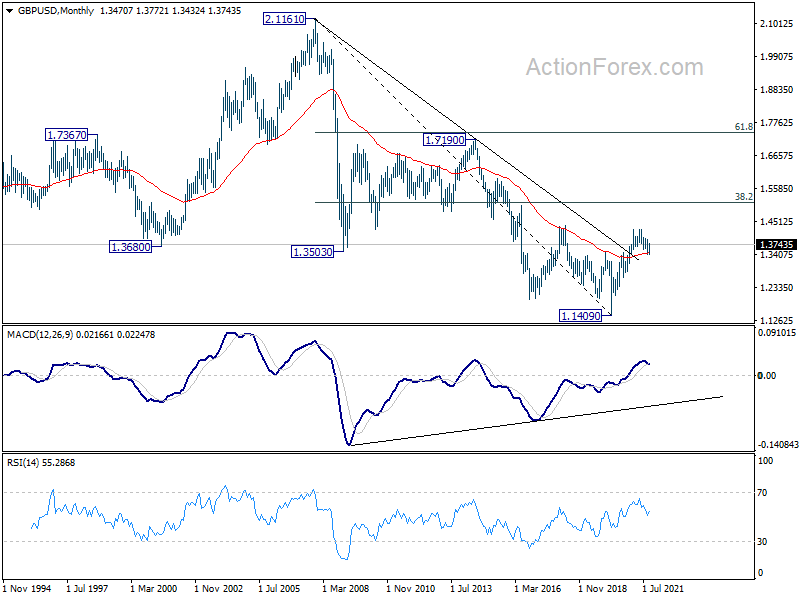
In the longer term picture, a long term bottom should be in place at 1.1409, on bullish convergence condition in monthly MACD. Rise from there would target 38.2% retracement of 2.1161 to 1.1409 at 1.5134. Reaction from there would reveal whether rise from 1.1409 is just a correction, or developing into a long term up trend.
CFTC Commitments of Traders – Energy Prices Remain Strong as Power Shortage Persists
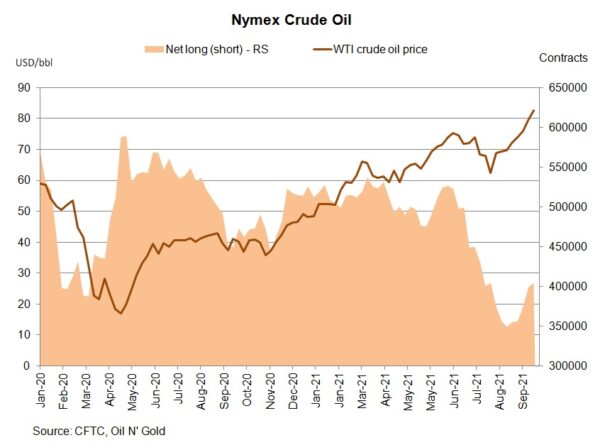
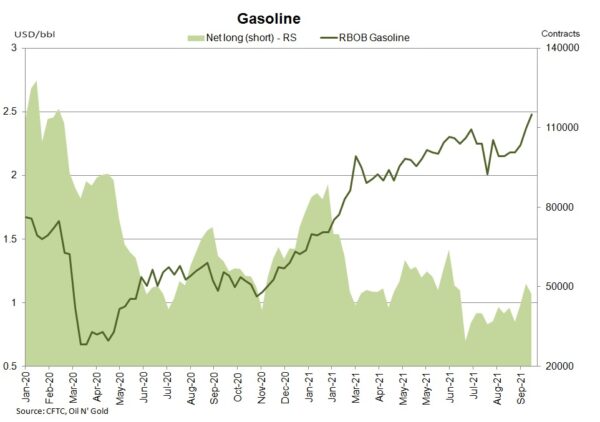
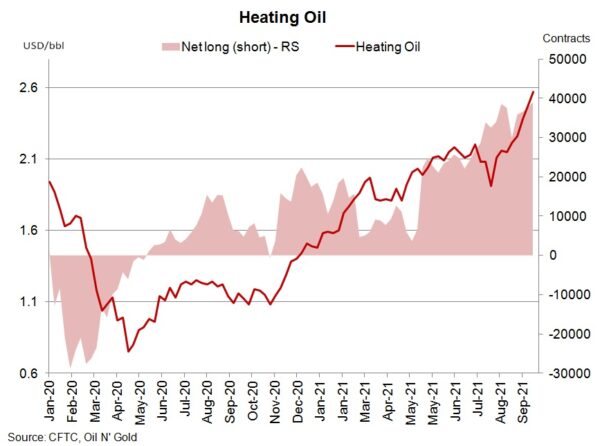
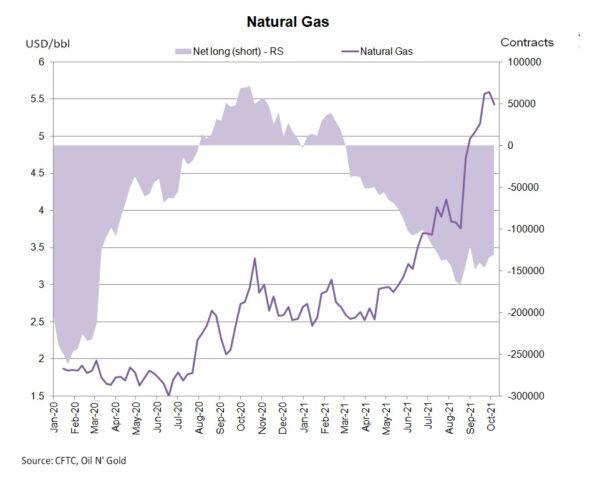
According to the CFTC Commitments of Traders report for the week ended October 12, NET LENGTH of crude oil futures rose +6 469 contracts to 404 776. Speculative longs jumped +15 440 contracts while shorts increased +8 971 contracts. For refined oil products, NET LENGTH for heating oil added +1 589 contracts to 39 137, while that for gasoline fell -3 859 contracts to 47 193. NET SHORT of natural gas futures climbed +2 806 contracts to 130 902 during the week.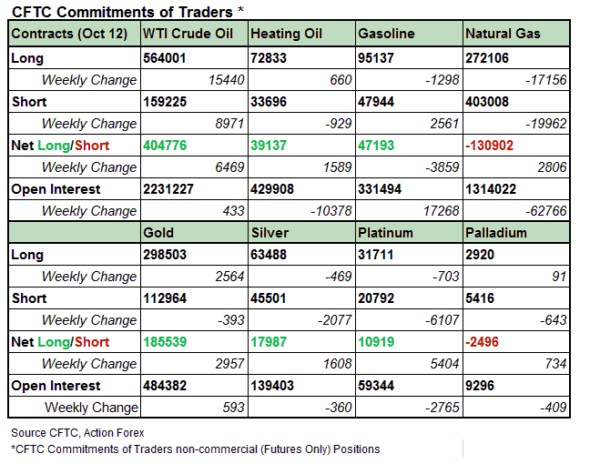
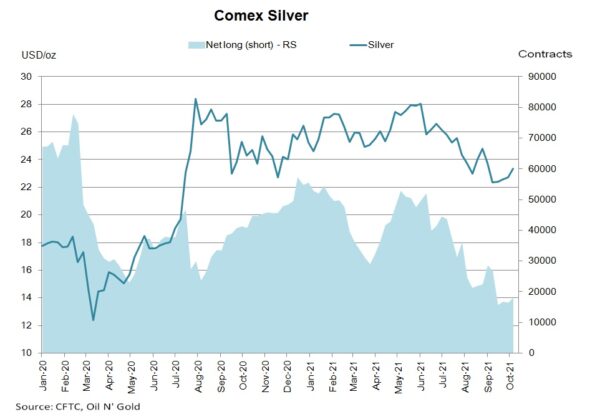
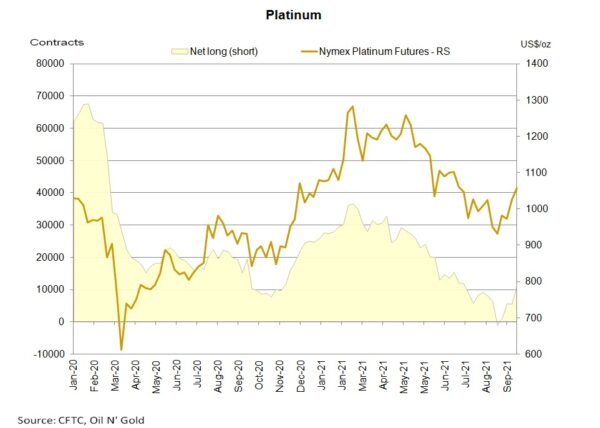
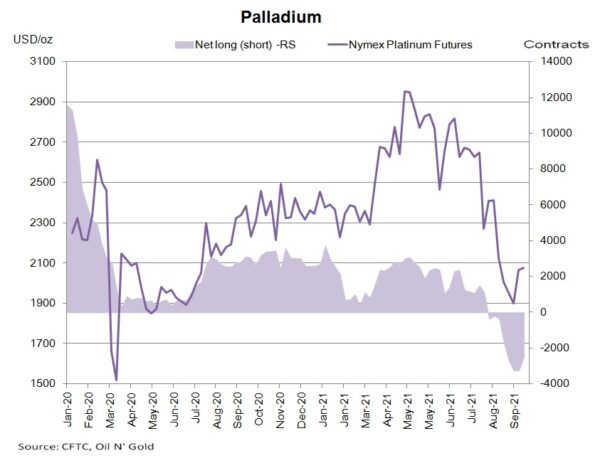
Gold futures’ NET LENGTH gained +2 957 contracts to 185 539. Silver futures’ NET LENGTH added +1 608 contracts to 17 987. For PGMs, NET LENGTH of Nymex platinum futures rose +5 404 contracts to 10 919, while NET SHORT for palladium futures was down -734 contracts to 2 496.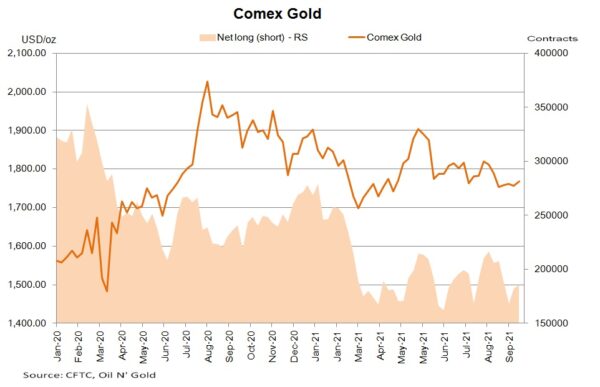
CFTC Commitments of Traders – Risk Currency Rebounded on Bargain-Hunting
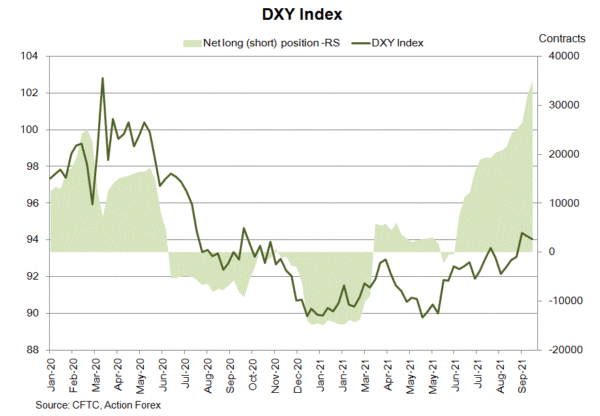
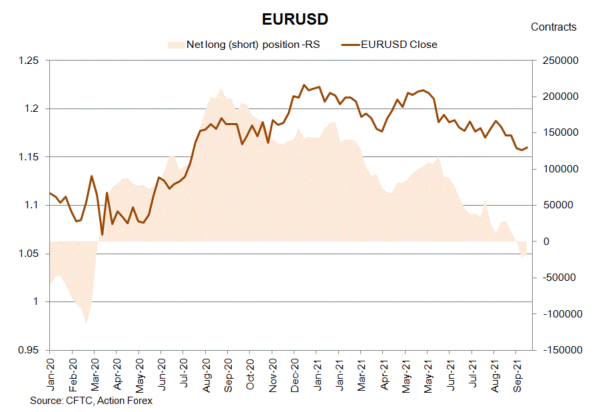
As suggested in the CFTC Commitments of Traders report in the week ended October 12, NET LENGTH of USD index futures rose +3 306 contracts to 35 062. Bets increased modestly on both sides. Concerning European currencies, NET SHORT of EUR futures dropped -3 936 contracts to 18 398. Speculative shorts gained +5 693 contract while shorts added +1 575. GBP futures' NET SHORT also sank -8 039 contracts to 11 979.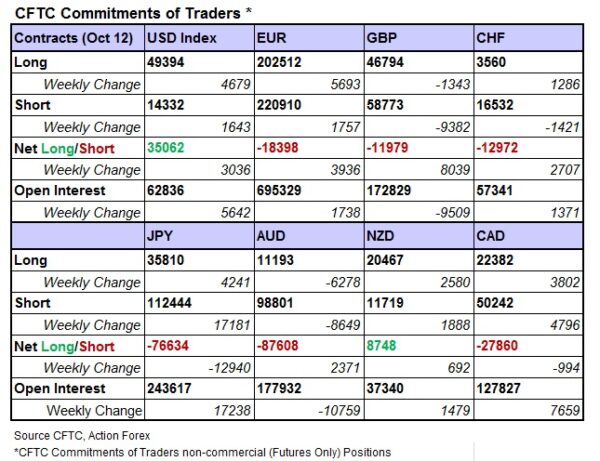
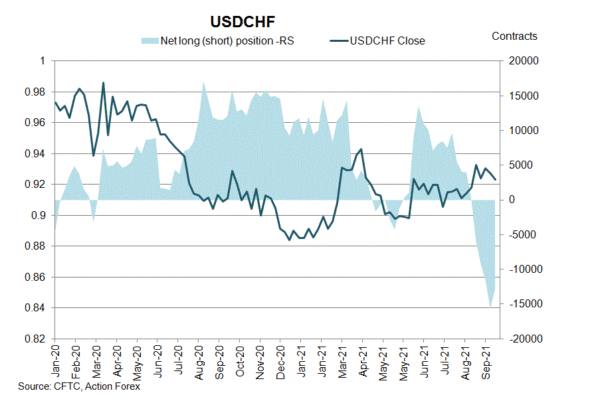
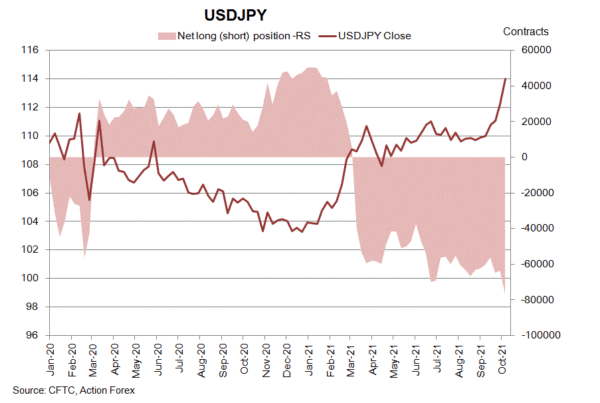
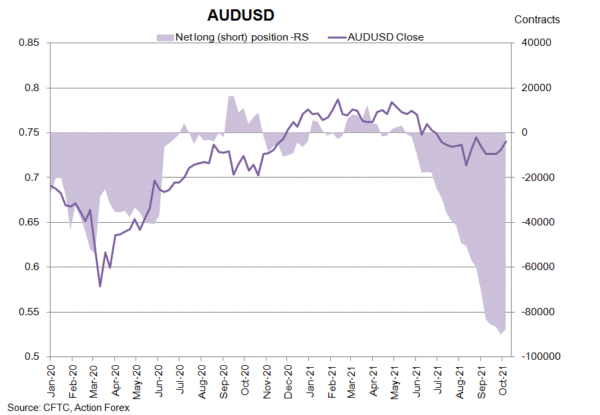
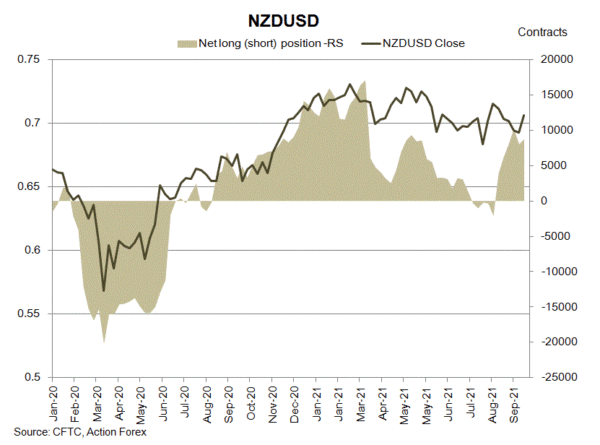
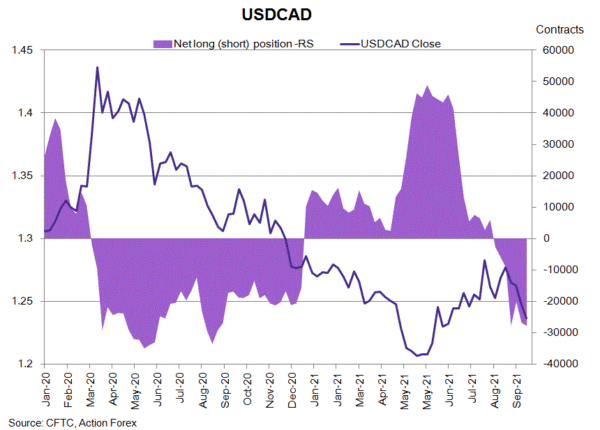
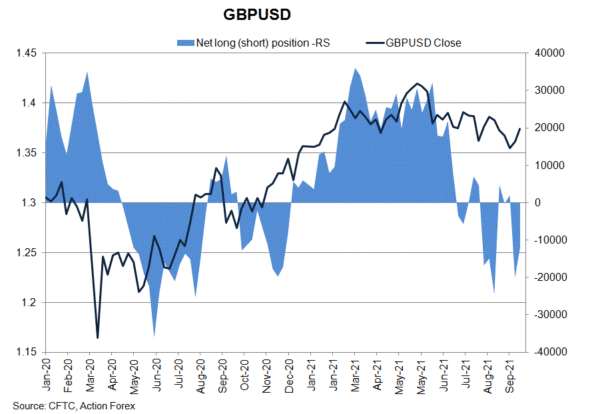 On safe-haven currencies, NET SHORT of CHF future dropped -2 707 contracts to 12 972 while that of JPY futures soared +12 940 contracts to 76 634. Concerning commodity currencies, NET SHORT of AUD futures decreased -2 371 contracts to 87 608. NET LENGTH for NZD futures added +692 contracts to 8 748 during the week. CAD futures' NET SHORT added +994 contracts to 27 860.