Sample Category Title
The Analytical Overview Of The Main Currency Pairs
The EUR/USD currency pair
Technical indicators of the currency pair:
Prev Open: 1.1596
Prev Close: 1.1599
% chg. over the last day: +0.03%
Inflation expectations in Germany continue to rise as markets no longer view inflation as a temporary phenomenon but as something more permanent. The German inflation expectation index increased up to 1.80%, the highest level since April 2013.
Trading recommendations
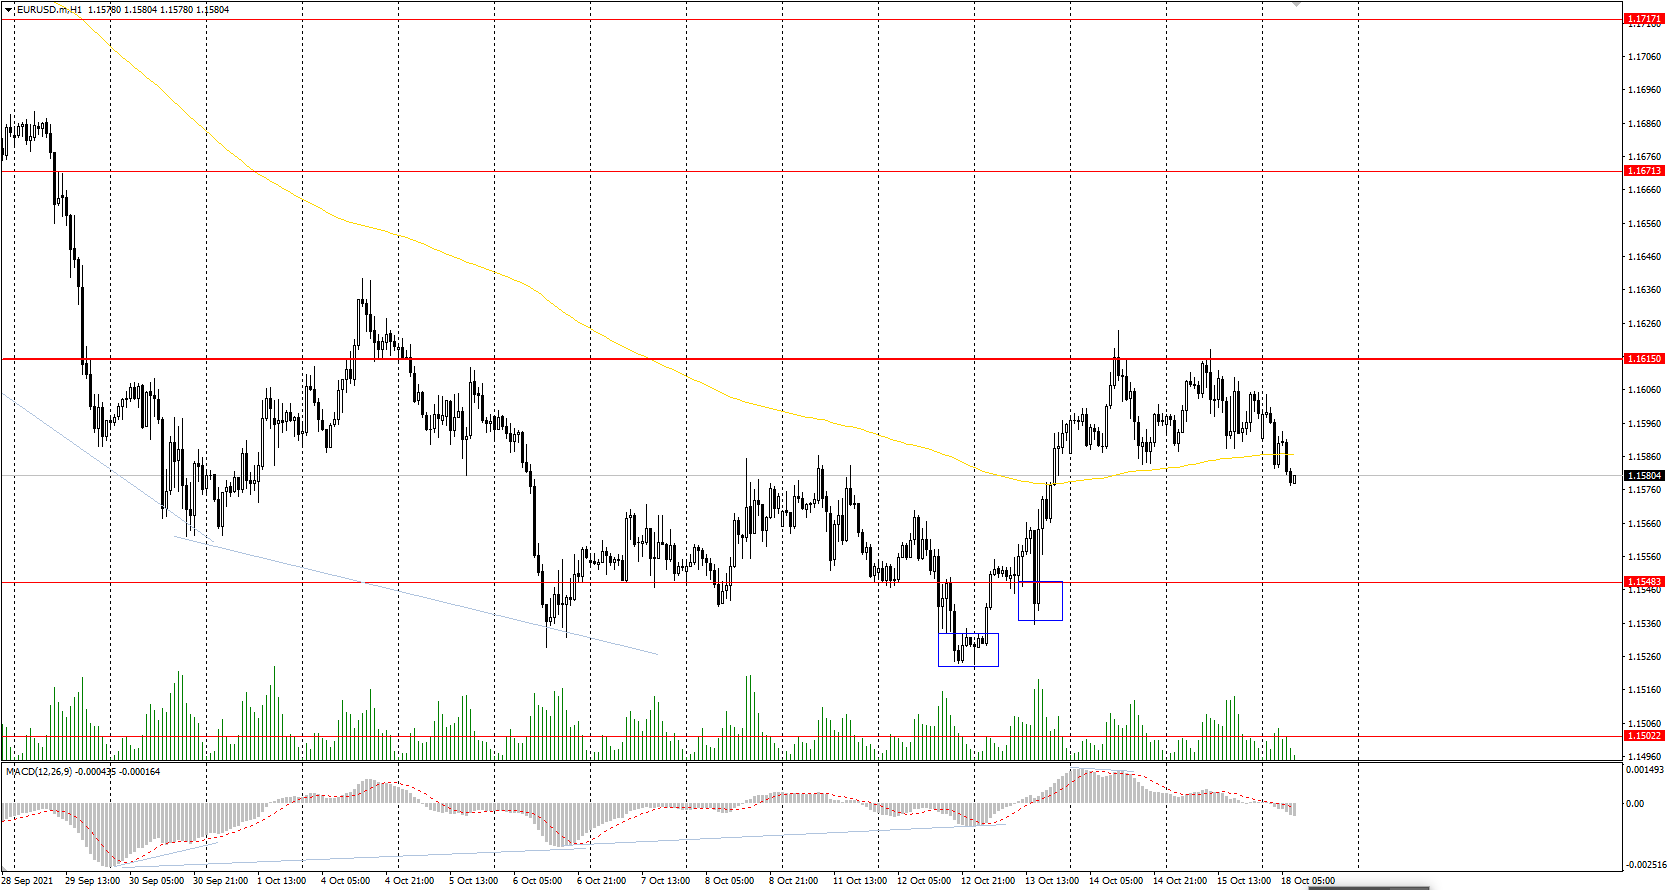
Support levels: 1.1548, 1.1502, 1.1453
Resistance levels: 1.1615, 1.1671, 1.1717, 1.1772, 1.1802, 1.1835
From the technical point of view, the EUR/USD trend is bearish. The price failed to break through the priority change level. The MACD indicator has become inactive. Under such market conditions, traders should consider sell deals from the priority change level, given there is sellers' initiative. Buy trades should be considered only on lower time frames from the support levels or from the buyers' initiative areas.
Alternative scenario: if the price breaks through the 1.1615 resistance level and fixes above, the mid-term uptrend will more likely resume.
News feed for 2021.10.18:
- US Industrial Production (m/m) at 16:15 (GMT+3).
The GBP/USD currency pair
Technical indicators of the currency pair:
Prev Open: 1.3671
Prev Close: 1.3744
% chg. over the last day: +0.53%
The UK reports on inflation this week. Analysts expect consumer prices to rise and fear that the inflation rate will increase above 3.2%. Investors and funds will be watching the report closely in anticipation that the Bank of England will raise interest rates before the end of the year to combat rising inflation.
Trading recommendations
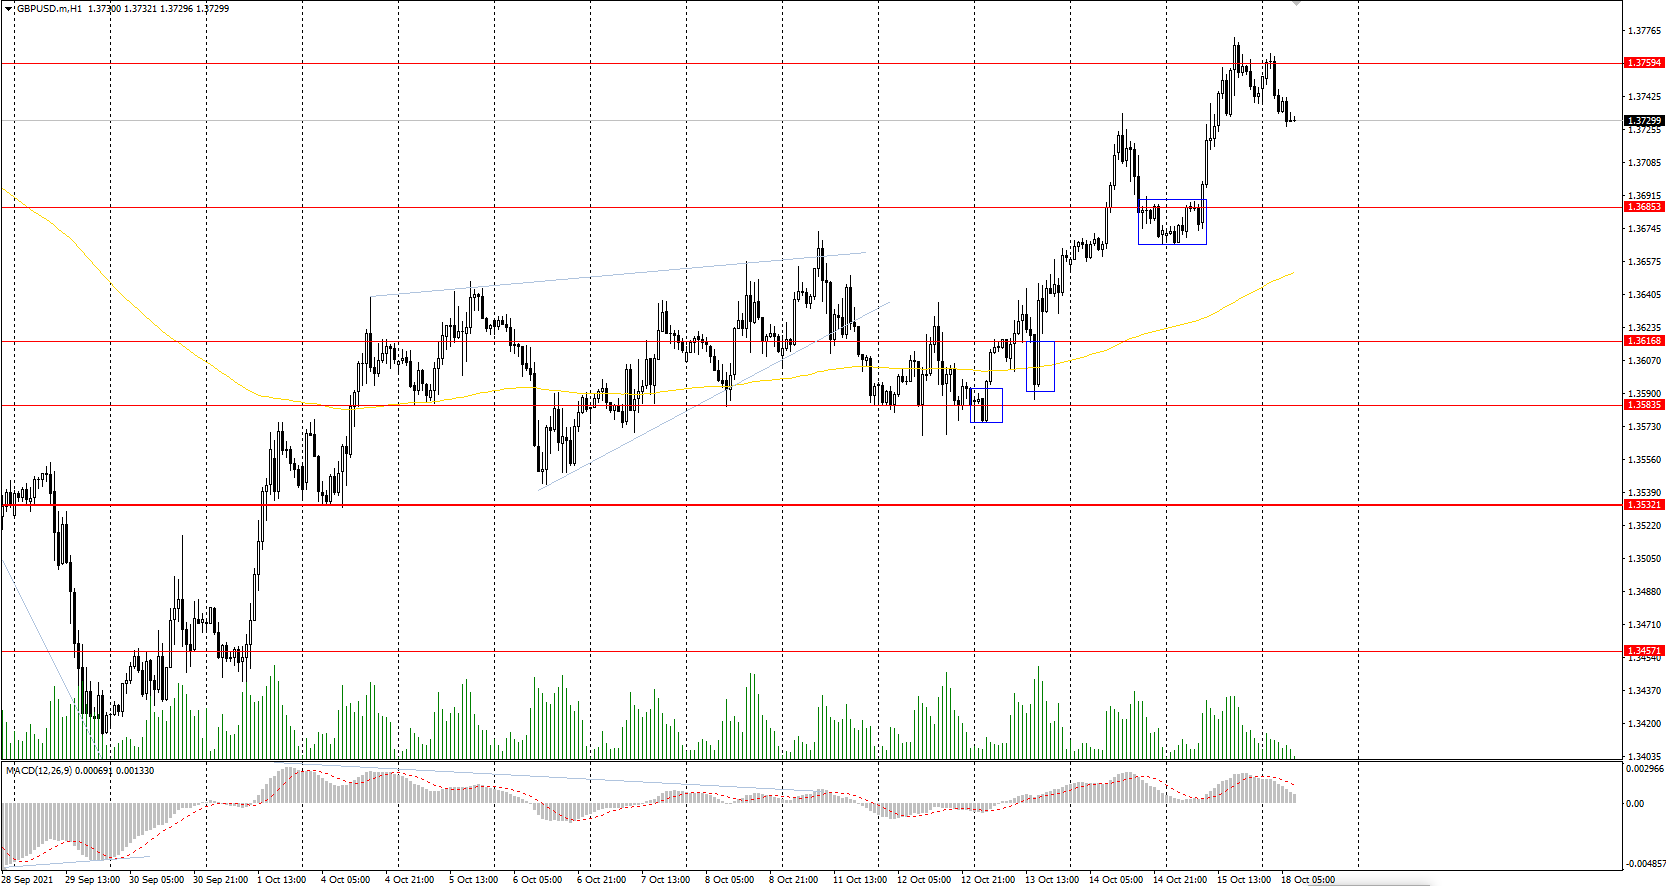
Support levels: 1.3685, 1.3617, 1.3584, 1.3532, 1.3457, 1.3360, 1.3282
Resistance levels: 1.3759, 1.3812, 1.3886
On the hourly time frame, the GBP/USD trend has changed to bullish. The British pound is strengthening due to direct correlation with oil prices. The MACD has become inactive. Buy trades should be considered only within the day and only from the initiative zone of the buyers. It is better to look for sell deals from the resistance levels, but only after an additional confirmation in the form of a sellers' initiative, because the buyers' pressure is higher now.
Alternative scenario: if the price breaks down through the 1.3532 support level and consolidates below, the bullish scenario is likely to be broken.
The USD/JPY currency pair
Technical indicators of the currency pair:
Prev Open: 113.66
Prev Close: 114.25
% chg. over the last day: +0.52%
Japan will launch a 100 billion yen ($875 million) fund in 2022 to promote modern technology and economic security. The fund's investments will go to universities and companies for research and development in technological areas that the Japanese government considers a priority. It also became known that Prime Minister Kishida intends to call on producers of oil to increase production.
Trading recommendations
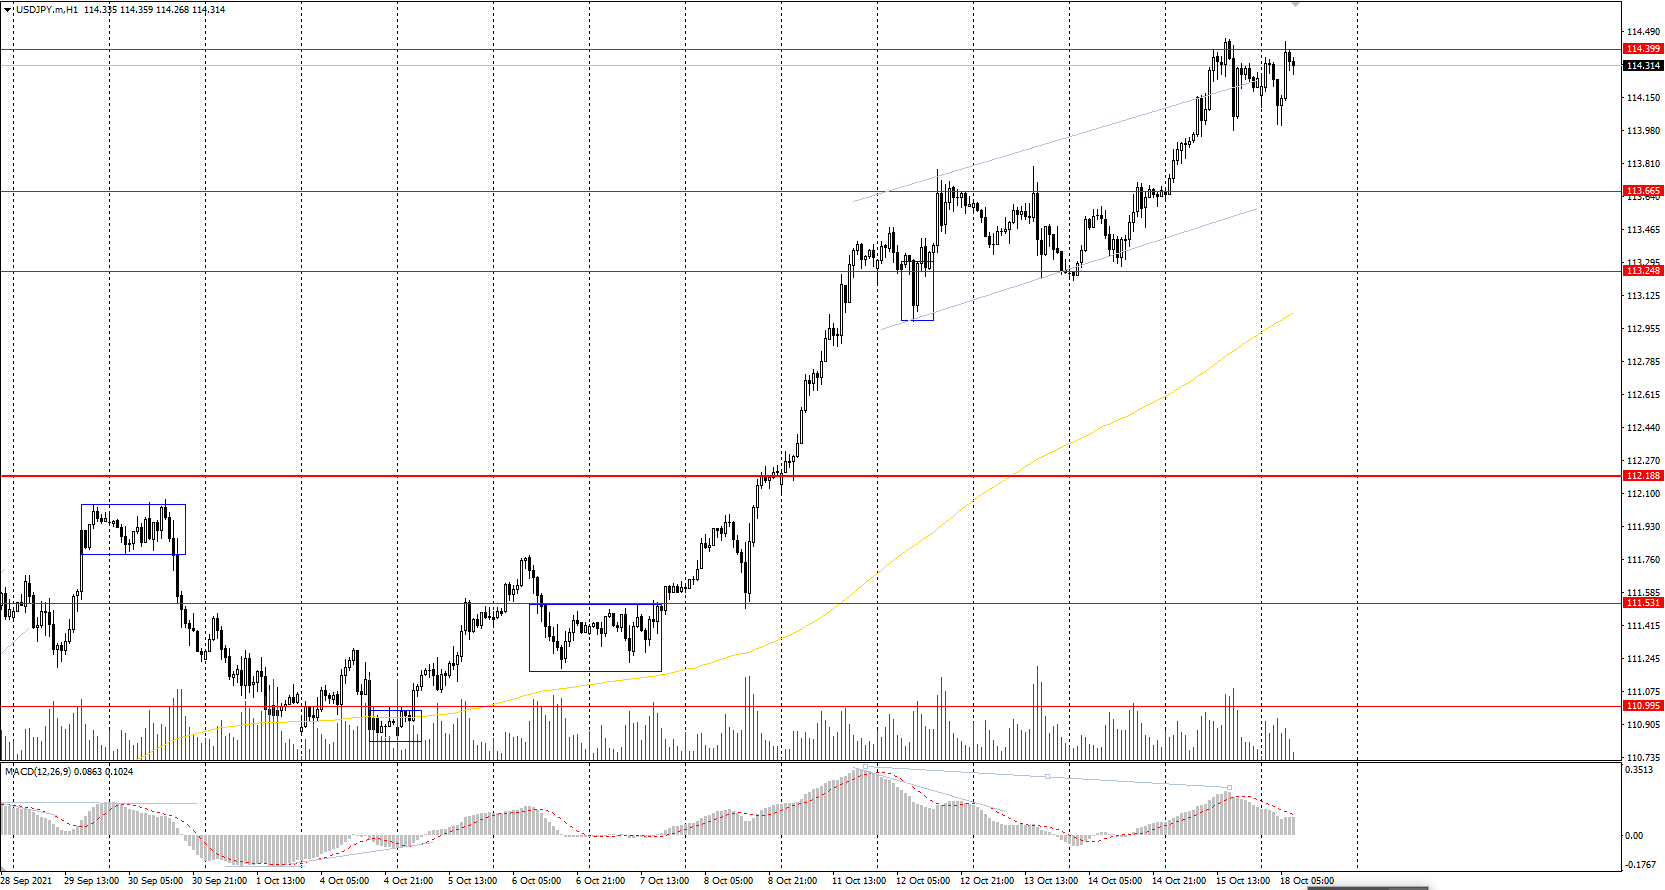
Support levels: 113.66, 113.25, 112.19, 111.53, 110.99, 110.65, 109.95, 109.63
Resistance levels: 114.40
The main trend of the USD/JPY currency pair is bullish. The Japanese yen is rapidly declining against the US dollar. The MACD indicator is in the positive zone, but on higher time frames there is a divergence, which means that growth is limited and correction is expected in the near future. Under such market conditions, it’s better to look for buy positions from the support levels near the moving average, since the price has deviated greatly from the average line. Sell positions should be considered only throughout the day from the resistance levels, given there is sellers' initiative.
Alternative scenario: if the price falls below 112.19, the uptrend is likely to be broken.
The USD/CAD currency pair
Technical indicators of the currency pair:
Prev Open: 1.2366
Prev Close: 1.2358
% chg. over the last day: -0.06%
The Canadian dollar is a commodity currency, so USD/CAD is highly dependent on the dynamics of the dollar index and oil prices. The dollar index was trading flat on Friday, while oil prices were slowly growing. As a result the USD/CAD currency pair is decreasing due to the growth in oil prices and as a result of the Canadian dollar strengthening.
Trading recommendations
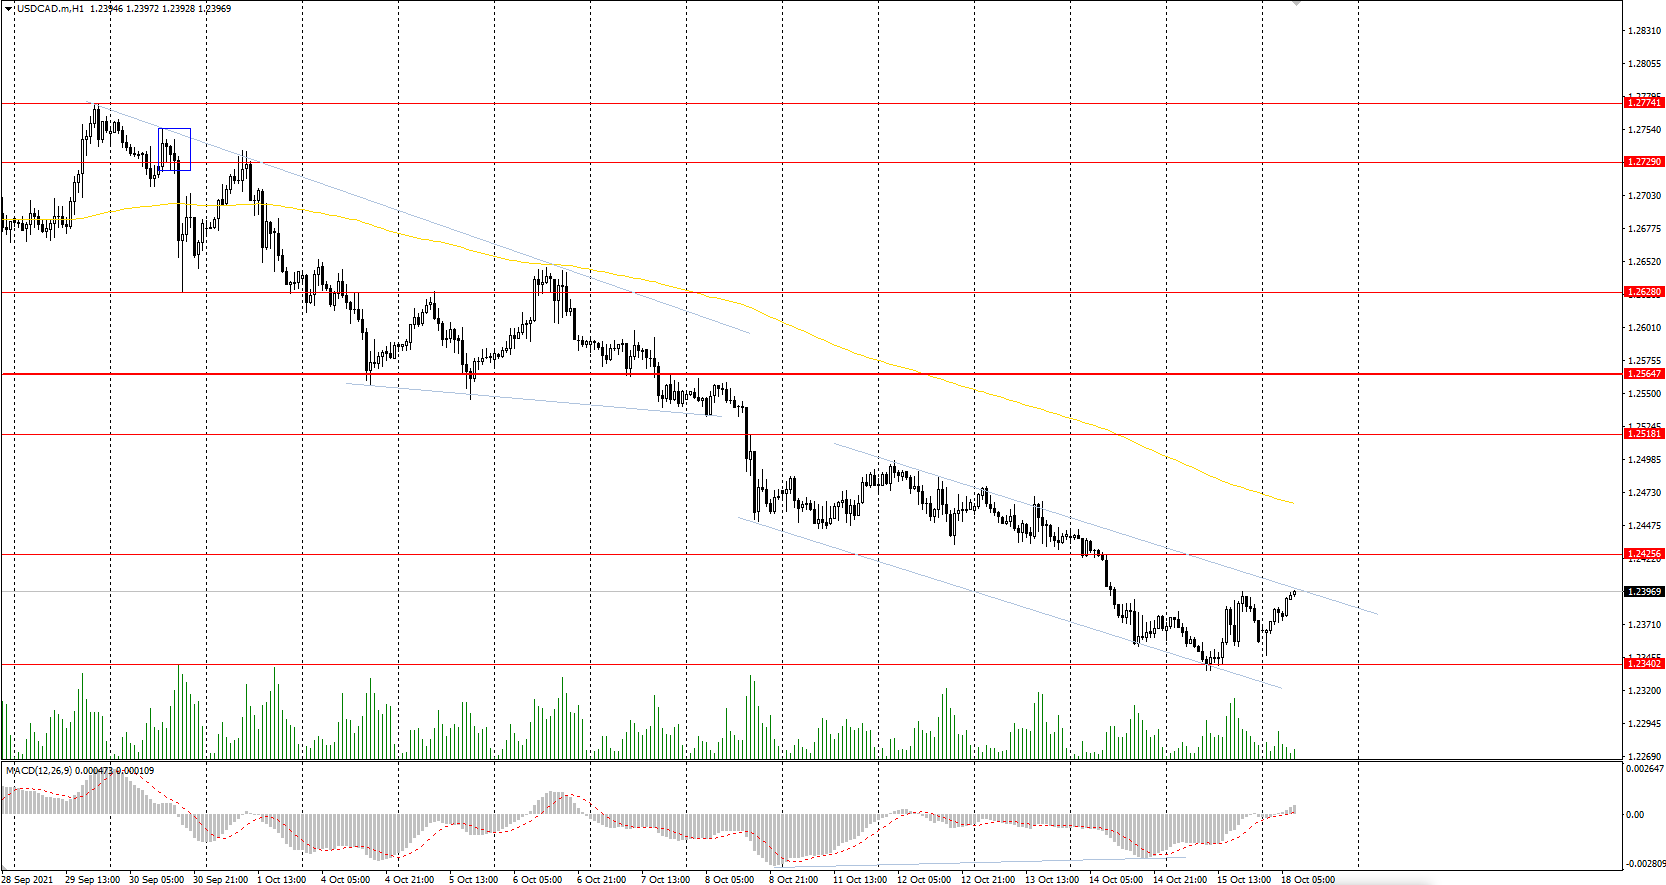
Support levels: 1.2340
Resistance levels: 1.2425 1.2518, 1.2565, 1.2628, 1.2729, 1.2774
From the technical point of view, the trend of the USD/CAD currency pair is bearish. But the price has reached the daily support level, which will at least give a bounce. The MACD indicator has become inactive, but there are still signs of divergence on higher time frames. Under such market conditions, it is better to look for sell deals from the resistance levels near the moving average. Buy trades should be considered only on smaller time frames from the support levels, if there is the buyer’s initiative.
Alternative scenario: if the price breaks out through the 1.2565 resistance level and fixes above, the uptrend will likely resume.
News feed for 2021.10.18:
- Canada BoC Business Outlook Survey (m/m) at 17:30 (GMT+3).
ECB Visco: Some flexibility should remain in asset purchases to help against unexpected shocks
Governing Council member Ignazio Visco said even if the inflation pressures in Eurozone "may last for some months and well during the next year", it's still "largely transitory". He added that market expectations for rate hike in late 2022 were "not that consistent" with ECB's forward guidance.
Visco also said "flexibility should remain" after the emergency PEPP program as. "We certainly have to discuss how to adjust our purchase programs," he said. "It will help against unexpected shocks, and it will help to avoid fragmentation that may rise again."
Investors Continue To Worry About Inflation
Last week, the US stock market closed positively. On Friday, the S&P 500 index increased by 0.75% (+1.96% for the week), Dow Jones added 1.09% (+1.64% for the week), and NASDAQ increased by 0.5% (+2.46% for the week). The Dow Jones closed above 35,000, the highest weekly percentage gain since June. The US Commerce Department data released on Friday showed a surprising increase in retail sales in September. Still, the October consumer confidence index from the University of Michigan was worse than expected.
US President Joe Biden signed into law a temporary increase in the US debt limit. The $480 billion increase in the borrowing limit is expected to be exhausted by December 3rd.
The United States is removing all restrictions from November 8 on the entry for tourists who have passed the full course of coronavirus vaccination.
European stock indices closed the week in the green zone thanks to the strong start of the corporate reporting season. British FTSE 100 gained 0.37% on Friday (+1.95% for the week), French CAC 40 increased by 0.63% (+2.77% for the week), Spanish IBEX 35 added 0.81% (+0.73% for the week), Italian FTSE MIB increased by 0.81% (+1.85% for the week), and German DAX jumped by 0.81% (+3.12% for the week, the best result among all European indices). Consumer prices in the euro area increased to 3.4% in September, the highest level in 13 years. However, ECB head Christine Lagarde still believes that inflation in the euro area is temporary, and the ECB monetary policy is aimed to maintain favorable financing conditions for all sectors of the economy.
Record revenues from natural gas and fish exports helped Norway post its highest-ever trade surplus last month. Europe continues to actively withdraw gas from storage, reducing reserves for the second day in a row. In Spain, the price of electricity is rising four times faster than the European average. Many politicians believe that the introduction of Nord Stream 2 can improve the situation in the European market. The UK government will fund a new nuclear power plant as part of a program to achieve net zero emissions.
Oil prices continue to rise amid an energy crisis as demand shifts from expensive natural gas and coal to cheaper oil. Oil prices have been increasing for the eighth week straight, with WTI crude rising above $83 for a barrel, its highest level since 2014. Brent has approached $86 for a barrel. Investors continue to worry about inflation amid growing energy shortages that are causing even more production cuts.
Asian stock indices also closed the week on a positive note. Japan's Nikkei 225 increased by 1.81% on Friday (+3.90% for the week), China's CSI 300 added 0.38% (-0.19% for the week), Australia's ASX 200 increased by 0.69% (+0.57% for the week), and South Korea's KOSPI jumped by 0.88% (+1.25% for the week). But most Asian stocks fell on Monday amid weak economic data on China that showed a slowdown in the recovery. China's Q3 2021 GDP showed +4.9% growth (expectations +5.2%; previous +7.9%), industrial production increased by 3.1% (forecast 3.8%, previous 5.3%), unemployment rate declined to 4.9% (forecast 5.1%, previous 5.1%).
On October 23, the grace period for the first non-payment expires, so that date could be the beginning of China Evergrande's default.
Alibaba will release its own 5nm Arm processor to compete with Amazon and Huawei, making it another Chinese tech company.
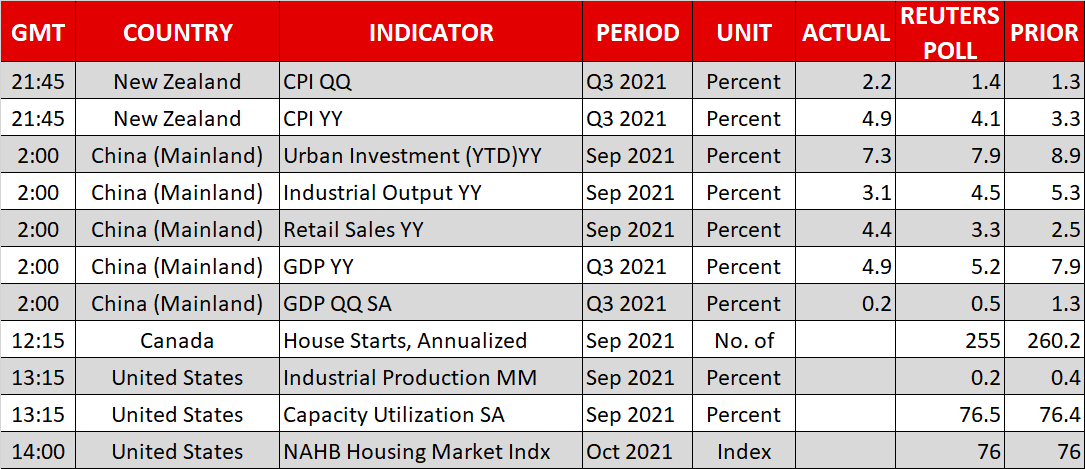
New Zealand's consumer price index (CPI) increased by 2.2% in the third quarter, the largest quarterly change since December 2010. Annual inflation rose to 4.9%, up from a 3.3% increase in the previous quarter, also the biggest annual change in more than a decade.
Japan's Toyota will cut production by 15% in November due to chip shortages.
Australia will partially cancel lockdowns amid vaccination progress.
Main market quotes:
- S&P 500 (F) 4,471.37 +33.11 (+0.75%)
- Dow Jones 35,294.76 +382.20 (+1.09%)
- DAX 15,587.36 +124.64 (+0.81%)
- FTSE 100 7,234.03 +26.32 (+0.37%)
- USD Index 93.95 −0.02 (−0.02%)
Important events for today:
- New Zealand Consumer Price Index (m/m) at 00:45 (GMT+3);
- China GDP (q/q) at 05:00 (GMT+3);
- China Retail Sales (m/m) at 05:00 (GMT+3);
- China Industrial Production (m/m) at 05:00 (GMT+3);
- China Unemployment Rate (m/m) at 05:00 (GMT+3);
- US Industrial Production (m/m) at 16:15 (GMT+3);
- Canada BoC Business Outlook Survey (m/m) at 17:30 (GMT+3).
EURUSD Bearish Course Endures As Upside Forces Fade
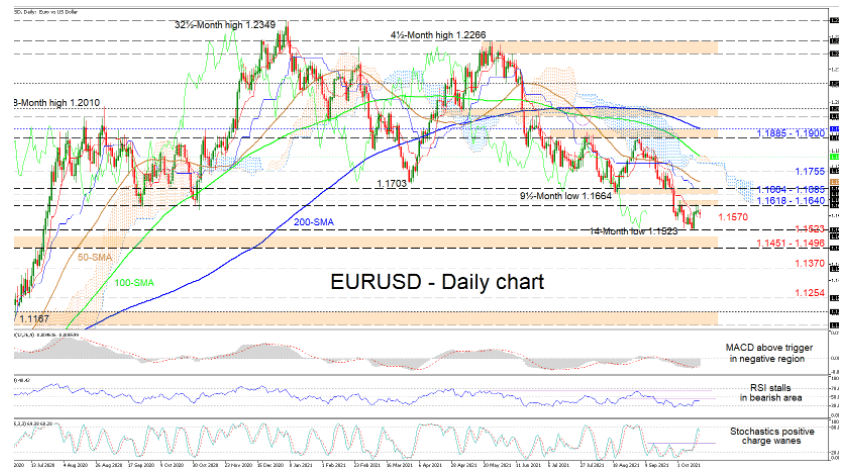
EURUSD’s recent positive impetus off a 14-month low of 1.1523 is faltering in the vicinity of the 1.1600 handle. The diving simple moving averages (SMAs) are defending the short-term bearish trend in the pair.
The Ichimoku lines are indicating that negative momentum is picking up again. Furthermore, the pair is struggling to make strong headways past the 1.1600 barrier, something also being reflected in the short-term oscillators. The MACD, some distance below zero, has pushed over its red trigger line, while the RSI is struggling to improve in bearish territory. The stochastic %K line has dipped ahead of the 80 level, signalling that positive drive is dwindling.
If the decline in the pair prevails, instant friction could emanate from the red Tenkan-sen line at 1.1570 before the price retests the 14-month low of 1.1523. If selling interest intensifies and drives the price below the crucial support border of 1.1451-1.1496, the bears may then target the 1.1370 trough, identified on July 16. Another push lower could sink the pair as low as 1.1254, around the July 10 barrier.
Otherwise, if buyers start to push back, prompt resistance could transpire from the area between the nearby highs of 1.1618 and 1.1640 respectively, ahead of the border of 1.1664-1.1685. Conquering these obstacles, the approaching 50-day SMA at 1.1711, and the neighbouring 1.1755 high may try to impede gains from challenging the Ichimoku cloud and the 100-day SMA at 1.1811. Triumphing above the 1.1800 barricade, the price may then propel for the 1.1885-1.1900 resistance section.
Summarizing, EURUSD’s short-term descent seems to overpower current bullish pressures. A price climb above 1.1755 could feed upside drive, while a close below 1.1451 could bolster the negative picture.
Inflation And Growth Worries Take Heat Off Stocks Rebound, Dollar Firms
- China GDP misses estimates, New Zealand CPI surges, reviving stagflation fears
- Stocks back in the red as doubts resurface but hopes on earnings keep optimism alive
- Bond yields edge up again as oil keeps climbing
- Kiwi erases earlier gains from rate hike bets as dollar bulls regain control
 China growth disappoints, dents risk appetite
Economic growth in the world’s second largest economy slowed more than expected in the third quarter as China reported that GDP rose by 4.9% from a year ago, missing forecasts of 5.2%. Power cuts and pressures in the property sector dragged down growth, especially towards the end of the quarter. Industrial output was up just 3.1% year-on-year in September while fixed asset investment slowed for the seventh straight month.
The fallout from the Evergrande debt crisis will likely reverberate through the current quarter as authorities step up efforts to reduce leverage among heavily indebted real estate companies. The energy shortages inflicting businesses won’t be resolved anytime soon either, though the government might deprioritise climate goals so as to ease the rationing.
The immediate focus for investors, however, is how soon will policymakers loosen monetary policy again amid some tempering in expectations that China’s central bank – the PBOC – is planning an imminent cut in the reserve requirement ratio (RRR).
China’s blue-chip CSI 300 index closed more than 1% down on the day, pulling most of Asia down with it. The S&P/ASX 200 index in Sydney was the exception as shares were lifted by more news of easing coronavirus restrictions in Australia. However, European stocks opened in negative territory as US stock futures headed lower.
US futures dip but eye more earnings boost
Wall Street’s earnings-driven rebound is looking a bit shaky on Monday as markets are being reminded about the mounting headwinds that somehow got put aside last week. The rally in crude oil is showing no sign of abating, with WTI futures scaling fresh seven-year highs today, though natural gas prices remained well off their recent peaks. The surge in energy prices is adding to the cost burden for businesses, which are also battling to untangle supply-chain bottlenecks and fill vacancies amid widespread worker shortages.
But it’s not all doom and gloom as equity markets had plenty to cheer about last week. The Q3 earnings season got off to a blistering start. A solid set of results from Wall Street’s major banks transformed the S&P 500’s three-day slide into a three-day rally, taking the benchmark index within 1.5% from its all-time high.
The earnings season continues in earnest this week, with Netflix’s results tomorrow being one of the highlights.
Higher yields and market jitters lift dollar
Another boost for the markets last week was Friday’s much stronger-than-expected retail sales report out of the United States, which soothed fears of a sharp slowdown in growth. However, the upbeat data also made investors more confident that the Federal Reserve will be able to hike rates sooner rather than later, pushing the two-year yield on US Treasuries to 19-month highs.
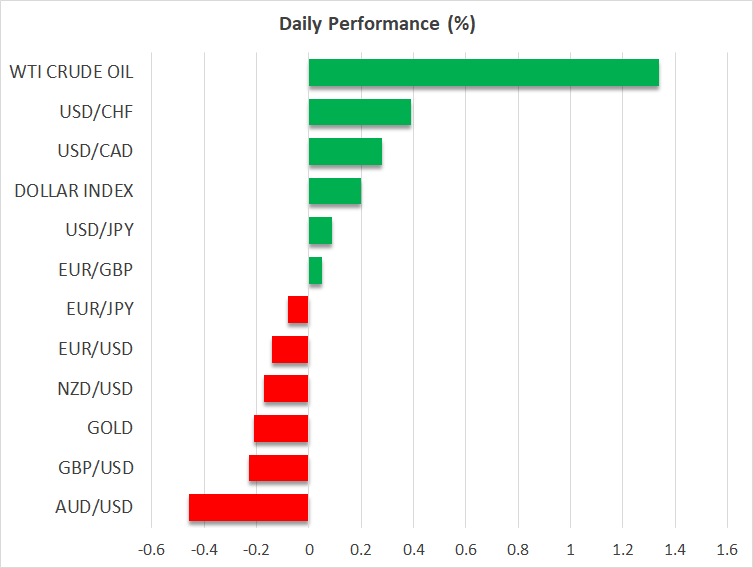
Higher Treasury yields combined with China’s weak GDP numbers are spurring demand for the US dollar and other safe haven currencies on Monday, with even the battered yen making some advances. The dollar index is up about 0.2% as the greenback’s gains versus the yen and euro cool off slightly but riskier currencies like the pound slip. The Australian and New Zealand dollars are also under pressure today even as their respective yields rise on the back of rate hike expectations.
Inflation soars in New Zealand; will UK be next?
New Zealand’s consumer price index jumped by 2.2% during the third quarter, taking the annual rate to a 10-year high of 4.9%. The Reserve Bank of New Zealand is now almost certain to raise the cash rate again at the next meeting in November and could signal an even faster normalization timeline than previously predicted.
Odds that the Bank of England will lift rates soon are also going up after Governor Andrew Bailey once again strongly hinted that policymakers “will have to act” if medium-term inflation expectations start rising. Inflation figures for September are due out of the UK on Wednesday and could fuel rate hike bets if they beat expectations.
For now, though, worries about the growth and inflation outlook are giving the upper hand to the dollar.
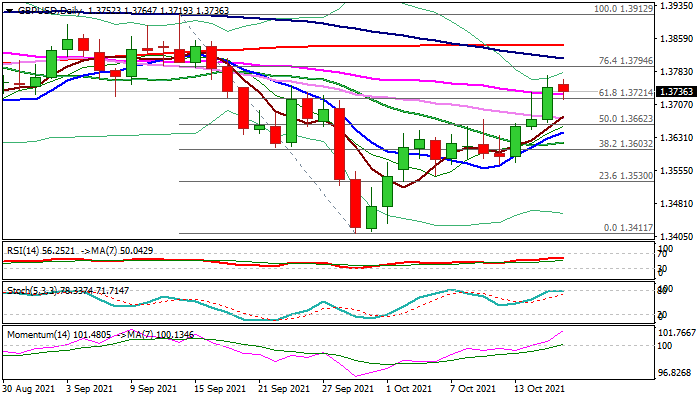
GBP/USD Outlook: Cable Is Consolidating Under New One-Month High
Cable is consolidating under new one-month high (1.3773) in early Monday, following last week’s 0.55% advance and weekly close above double-Fibo barriers at 1.3721 (61.8% of 1.3912/1.3411) and 1.3731 (61.8% of 1.4249/1.3411) that generated bullish signal.
The sentiment remains strong as hopes for BoE rate hike as early as November were boosted by hawkish comments from Governor Bailey, who said that the central bank is gearing up for the first rate hike after pandemic on mounting inflation risk.
Although Bailey sees the recent jump in inflation as temporary, worries that surge in energy prices would push inflation higher and for a longer period, would prompt BoE to act.
Fresh bullish acceleration is facing headwinds from thin daily cloud, which looks like minor obstacle, as the price emerged above thick ascending weekly cloud that underpins.
Rising bullish momentum and double bull- cross of 5/20 and 10/20DMA’s supports the action, but sideways-moving stochastic and RSI suggest bulls may take a breather before resuming.
Broken Fibo barrier offers immediate support at 1.3721 with extended dips expected to find ground above 1.3675 (5/30DMA bull-cross) to keep bulls intact.
Res: 1.3777, 1.3794, 1.3812, 1.3844.
Sup: 1.3721, 1.3675, 1.3662, 1.3643.
EUR/NZD Bears Could Prevail
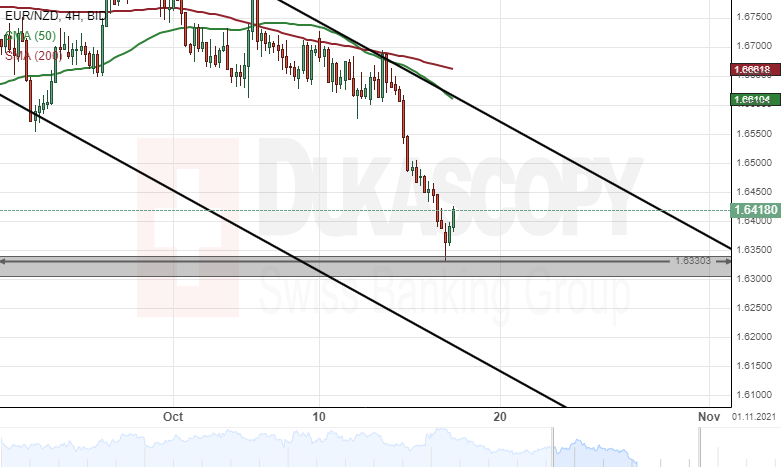
Since last week's trading sessions, the common European currency has declined by 2.20% against the New Zealand Dollar. The 50– and 200– period SMAs pressured the currency pair lower last week.
Technical indicators suggest selling signals on the 4H, daily and weekly time-frame charts. Most likely, the exchange rate could continue to edge lower in a descending channel pattern this week.
However, the currency exchange rate could encounter support at the 1.6300 level within this week's trading sessions.
AUD/NZD Decline Likely To Continue
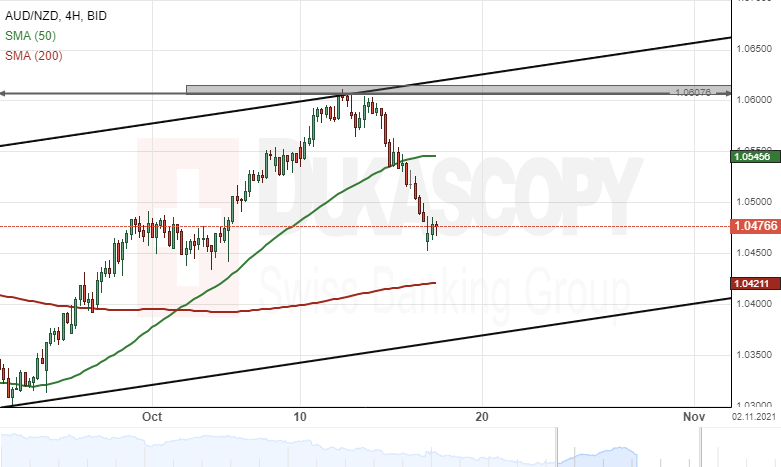
The Australian Dollar has declined by 1.46% against the New Zealand Dollar since last week's trading sessions. The currency pair breached the 50– period simple moving average at 1.0545 last week.
All things being equal, the AUD/NZD exchange rate could continue to edge lower during the following trading sessions. The potential target for sellers will be near the 1.0350 level.
However, the 200 Since last week's trading s period simple moving average at 1.0420 could provide support for the currency exchange rate this week.
EUR/USD Analysis: Looks For Support
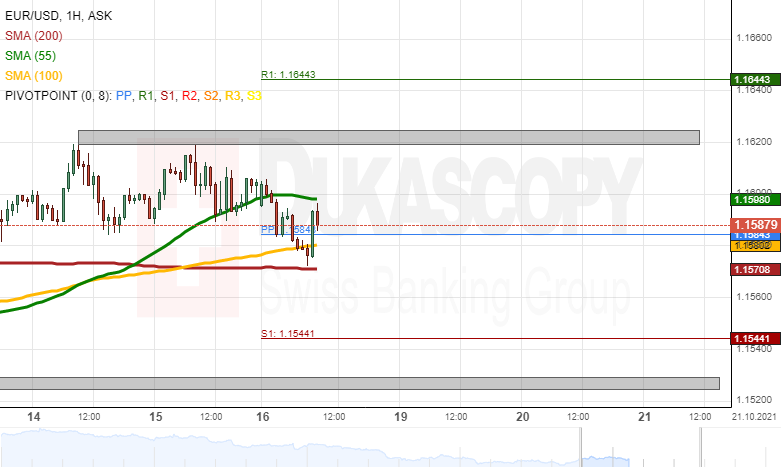
On Monday morning, the EUR/USD appeared to be looking for support, as it found short term support in the weekly simple pivot point at 1.1584 and the 200-hour simple moving average at 1.1571. Near term forecasts were based upon whether or not the support levels hold.
In the case of a decline, the pair could reach first for the weekly S1 simple pivot point at 1.1544. Afterwards, the rate might aim for the last week's low levels at 1.1524/1.1530.
On the other hand, if the EUR/USD recovers, it would face the resistance of the 55-hour simple moving average near 1.1600. Above the 1.1600 mark, the rate might encounter resistance in the last week's high level zone at 1.1620/1.1625.
GBP/USD Analysis: Tests Pattern’s Support
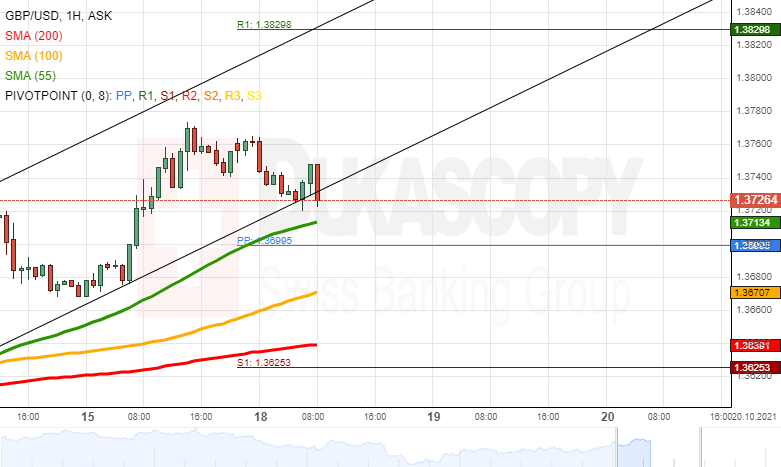
The GBP/USD rate retreated on Monday morning to the support of the lower trend line of a channel up pattern, which has guided the pair since October 12. Future forecasts were based upon whether or not the support holds.
In the case of a passing of the support of the channel up pattern, the GBP/USD might find support in the 55-hour simple moving average near 1.3712. Below the 55-hour SMA, the weekly simple pivot point at 1.3700 might act as a support level. Although, the 1.3700 has been providing both support and resistance on its own.
However, a potential surge of the rate might encounter resistance in the Friday's high levels at 1.3765 and 1.3775. Above the high levels, the weekly R1 at 1.3830 might keep the rate down.