

Sample Category Title
US Equities Rally Fizzles In Asia
Asian equities fade
Equity markets rebounded sharply overnight after strong services PMI data across Europe and the US lifted battered spirits. The veritable buffet of risks outlined yesterday, not least the US debt ceiling and spending packages, are all still there, but in a quiet data week, the buy-the-dip crowd couldn’t resist temptation. The S&P 500 rose by 1.05%, tech rebounded as the Nasdaq rallied by 1.25%, and the Dow Jones finished 0.93% higher.
That rally has quickly faded in Asia, with US index futures falling deep into the red, despite a lack of headline drivers. Nasdaq futures are 0.50% lower after news that Facebook could once again be having “technical issues,” but S&P 500 futures are also down by 0.45% and Dow futures have sunk by 0.35%. That momentum has waned so quickly could also be a function of higher US bond yields, but it does hint that US stocks will struggle to maintain gains ahead of Friday’s payroll data.
Japan, once again, has led Asia south today, the Nikkei 225 falling by 0.95%. The Nikkei seems to be suffering from a buy the rumour, sell the fact scenario, having bought stocks up before new PM Kishida’s appointment on the hopes that more fiscal stimulus is on the way. It is indeed on the way, but so it appears is a proposal to hike income tax rates for higher earners and on investment income. PM Kishida also wants a fairer distribution on national income aka China’s “shared prosperity.” The fallout from that on China equities is there for all to see, and it is not a large jump to say that higher taxes and rejigged income distribution in Japan could have a similar effect.
Mainland China remains on holiday today, but Hong Kong has also fallen by 0.95%, while South Korea’s Kospi is 1.0% lower. Taipei is down 0.35% while Singapore has struggled into the green, rising 0.20% after the government signalled yesterday it was considering various international travel corridors. Kuala Lumpur is the region’s standout, catching a strong commodity and energy price tailwind, the KLCI rising by 1.0% as bargain hunters circle Malaysia’s stock market. Jakarta is seeing a similar boost as well, the Jakarta Composite Index rising by 1.05%. Notably, Thailand and Manila have also rallied today as well.
Australian markets, though, are not receiving the same commodity tailwind. Banks and travel have led Australian equities lower today after the government said borders would not open to tourism until next year. APRA, the Australian prudential regulator, today tightened lending requirements for mortgage providers, which has weighed on the heavyweight banking sector. The ASX 200 and All Ordinaries have fallen by around 0.50%.
Australia aside, there appears to be a notable rotation in Asia today into the ASEAN value markets from the more tech-centric North Asian heavyweights. The latter are also heavy net energy and commodity importers, as opposed to ASEAN, which may be raising the perception that ASEAN is a more defensive play in Asia at the moment. I am cautious on that trade though, because a firm US Non-Farm Payroll number on Friday will have the Fed taper in play, and ASEAN is much more sensitive to potentially higher US interest rates.
Pre-Non-Farms Flip Flop Continues
Markets eye US employment report
The choppy week continues as markets continue to chase their tails in a light data week ahead of Friday’s US Non-Farm Payrolls main event. Overnight, firmer services PMI data across Europe and from the US was enough to flush out the buy-the-dippers in equity markets, which ignored a torrid Asian session and posted strong gains. Unsurprisingly, US technology behemoths outperformed, having been singled out for treatment the day before.
The disconnect continued elsewhere, where US yields firmed, notably at the long end. It wasn’t enough to distract the FOMO gnomes of the equity market, but the US dollar did lift itself higher over the session. Energy prices continued to surge, led by natural gas which climbed nearly 10.0% overnight. We’ll have to name it Bit-gas at this rate. On that note, bitcoin and cryptos also continue on a burn higher, for reasons I know not. Elon Musk hasn’t said anything, but I note that the Head of the US SEC, in testimony on the Hill, said that the US wouldn’t ban cryptos.
The equity rally is already fading in Asia today, with US index futures deep in the red. That suggests that despite the best hopes of the perpetual mega-bulls, the path of least resistance is lower at the moment. I am expecting the markets to continue tying themselves in knots over the next few sessions until we, hopefully, get a decisive Non-Farm Payrolls print. Higher or lower than 500,000 will do, as it will allow some clarity on the Federal Reserve taper path and positioning appropriately.
Today’s Asian data calendar is another blank canvas with retail sales data released across Europe, while the US releases official crude inventory, petroleum, and distillates data. The latter will attract more attention than usual given the ongoing spike in energy process. China remains on holiday until Friday and Evergrande stock remains suspended and has been relegated in the headlines, I doubt it will stay that way though.
South Korean September inflation eased slightly to 0.50% MoM this morning. Given the movement in global prices, that may become more challenging as time goes by but is unlikely to push the Bank of Korea into moving rates. The other main event has been the Reserve Bank of New Zealand policy decision, with the RBNZ going ahead with its previously postponed 0.25% rate hike to 0.50%. That is likely to be the first of several hikes if New Zealand’s recovery continues. The New Zealand dollar has fallen after the announcement suggesting it was fully priced in by markets. Also adding to concern, and rightly so, are the rise in delta-variant cases in Auckland and in locations outside the Auckland fence. Experience internationally suggests that once Delta is loose from a contained area, life gets more challenging very quickly and that will leave the New Zealand dollar vulnerable to more downside.
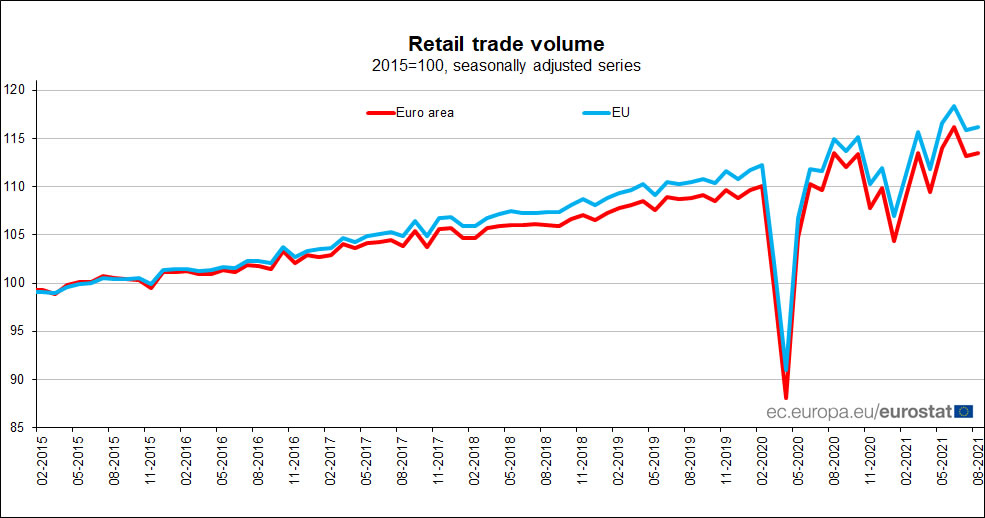
Eurozone retail sales rose 0.3% mom in Aug, EU up 0.3% mom
Eurozone retail sales rose 0.3% mom in August, well below expectation of 0.8% mom rise. Volume of retail trade increased by 1.8% for non-food products, while it fell by 0.1% for automotive fuels and by 1.7% for food, drinks and tobacco.
EU retail sales rose 0.3% mom. Among Member States for which data are available, the highest monthly increases in total retail trade were registered in Malta (+2.7%), Ireland (+2.5%) and Slovakia (+2.0%). The largest decreases were observed in Denmark (-1.4%), Estonia and France (both -1.2%).
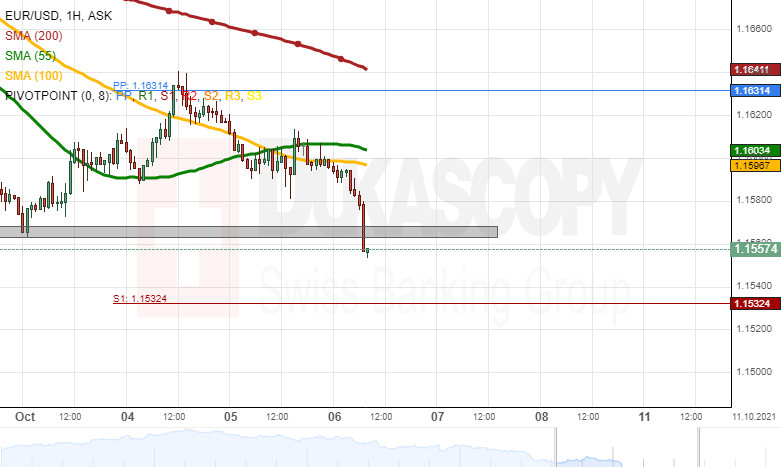
EUR/USD Analysis: Approaches Low Level
On Wednesday morning, the EUR/USD was heading to the support of the September 30 low level at 1.1563/1.1568. Future forecasts were based upon whether or not the support zone holds.
If the EUR/USD passes the support of the 1.1563/1.1568 zone, the weekly S1 simple pivot point at 1.1532 could be reached. However, take into account that the 1.1550 mark might serve as a support level.
On the other hand, a recovery from the 1.1563/1.1568 zone might encounter resistance at 1.1600. The 55 and 100-hour simple moving averages are located near the 1.1600 level and could strengthen its resistance. Above the 1.1600 mark, the weekly simple pivot point at 1.1631 would likely provide resistance.
GBP/USD Analysis: Tests Support Levels
The GBP/USD currency exchange rate declined on Wednesday morning below the 55 and 200-hour simple moving averages. The rate was testing the support zone of the 1.3575/1.3595 levels.
If the rate continues to decline, it could find support in the weekly simple pivot point at 1.3563 and the 100-hour simple moving average at 1.3553. A passing below the technical levels would leave the GBP/USD with no additional technical support as low as the weekly S1 simple pivot point at 1.3397. However, round exchange rate levels would highly likely impact the pair.
Meanwhile, a recovery of the pair might encounter resistance in the 55 and 200-hour simple moving averages at 1.3600 and 1.3580 before aiming at this week's high level zone just below the 1.3650 mark.

USD/JPY Analysis: Sharply Recovers
The USD/JPY has recovered, as it found support in the 110.82/110.90 zone. The following surge passed the resistance of the 55, 100 and 200-hour simple moving averages. On Wednesday morning, the rate had reached the 111.80 level.
A continuation of the surge of the USD/JPY currency exchange rate could reach first for the weekly R1 simple pivot point at 111.93. Afterwards, the rate might test the resistance of the 112.00 level.
However, if the pair ends the surge and begins to decline, it might find support in the 55, 100 and 200-hour simple moving averages and the weekly simple pivot point near 111.25.

Gold Analysis: Tests Week’s Low Level
On Wednesday morning, the yellow metal's price had reached the support zone of this week's low levels near the 1,750.00 level. In addition, the price had reached below the 55, 100 and 200-hour simple moving averages.
If the bullion declines, the price might find support in round price levels before reaching the September low level at 1,721.00/1,723.00.
However, a recovery of the metal's price might find resistance in the 200-hour SMA at 1,750.00, the 100-hour SMA at 1,754.50 and the 55-hour SMA at 1,760.00.

USD Edges Higher As Uncertainty Remains
The USD tended to gain yesterday and during today’s Asian session as uncertainty about the recovery of the global economy remains present. Markets seem to be shifting their attention towards the US Employment report for September due out on Friday, yet data about the employment market are also due out today and tomorrow and could come also under the focus of market participants. On the monetary front we note Chicago Fed President Evan’s comments that inflation in the US could drop below the bank’s 2% target once the bottleneck issues in the supply chains are addressed, which sounded more dovish. On the other hand, tensions in the US-Sino relationships seem to be easing for now, given that US President Biden stated yesterday that he spoke with Chinese President Xi and they agreed to follow the Taiwan agreement. We expect fundamentals to lead the USD, yet the ADP employment report for September may also capture trader’s attention.
The USD index was on the rise yesterday and during today’s Asian session seems to be testing the 94.10 (R1) resistance line. We would like to see the index clearly breaking the 94.10 (R1) resistance line before actually switching in favor of a bullish outlook for the index. Please note that the RSI indicator below our 4-hour chart is above the reading of 50, which could imply a slight advantage for the bulls. Should the bulls actually take charge of the index’s direction, we may see it breaking the 94.10 (R1) resistance line and aim for the 94.60 (R2) level. On the other hand, should the bears say enough is enough and take over, we may see the index, reversing course and breaking the 93.70 (S1) support line aiming for the 93.20 (S2) level.
US Stockmarkets rose yesterday, yet the bulls remain capped
US stockmarkets rose yesterday yet the bull’s price action seemed to remain capped as they retreated in the after-market hours. It’s characteristic that Dow Jones, Nasdaq and S&P 500 rose yesterday, yet corrected lower during today’s Asian session. It should be noted that the uncertainty in the US Congress about the lifting or even the removal of the debt ceiling seems to weigh on investor’s sentiment, while at the same time, stockmarkets are also in a wait and see position ahead of the US employment report release for September. On the other hand, Facebook advanced recovering substantial part of Monday’s losses despite allegations about how the company deals with hateful speech, while other big tech companies also recovered some ground. We would also note that the US yields seem to continue to rise and if they continue their upward motion, they may have an adverse effect on US stockmarkets.
Dow Jones rose yesterday testing the 34400 (R1) resistance line, yet retreated lower later on. We tend to maintain a bias for a sideways motion for the index currently given also that the RSI indicator below our 4-hour chart runs along the reading of 50 which may imply a rather indecisive market. Should a selling interest be displayed by the market, we may see it breaking the 34060 (S1) support line and aim for the 33740 (S2) level. On the other hand, should buyers be in charge of the index’s direction ,we may see Dow Jones, breaking the 34400 (R1) resistance line and aim for the 34700 (R2) level.
Today’s events and expectations
Today during the European session we note the release of Germany’s industrial orders for August and UKs’ Markit/CIPS Construction PMI reading for September, while a bit later we get Eurozone’s retail sales for August. In the American session we note the release of the US ADP National employment figure for September while oil traders may be more interested in the release of the EIA weekly crude oil inventories figure. On the monetary front, we note that Atlanta Fed President Bostic is scheduled to speak twice today.
USD Index H4 Chart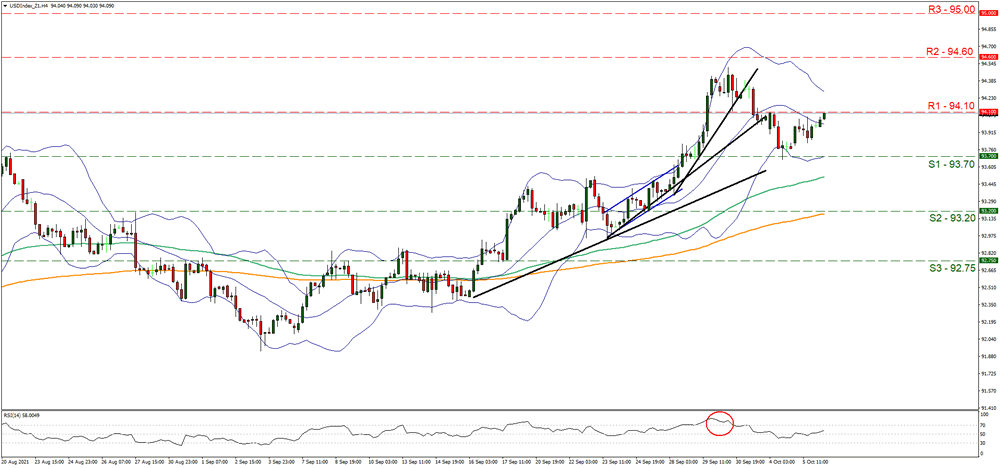
Support: 93.70 (S1), 93.20 (S2), 92.75 (S3)
Resistance: 94.10 (R1), 94.60 (R2), 95.00 (R3)
US 30 Cash H4 Chart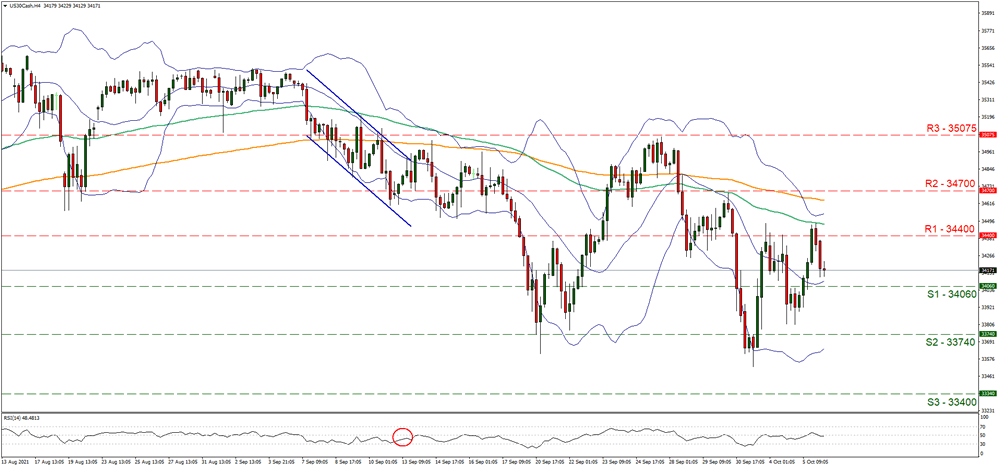
Support: 34060 (S1), 33740 (S2), 33400 (S3)
Resistance: 34400 (R1), 34700 (R2), 35075 (R3)
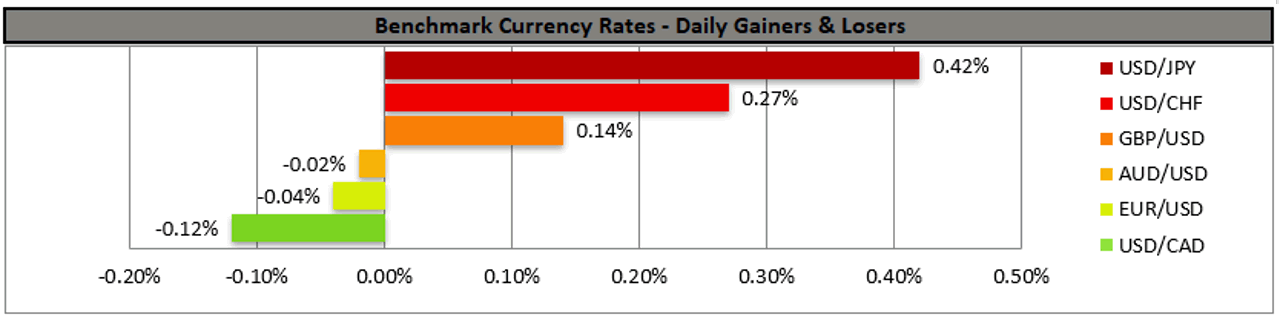
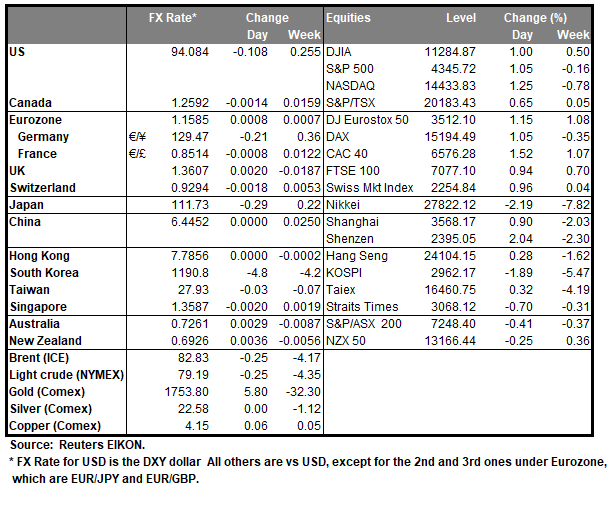
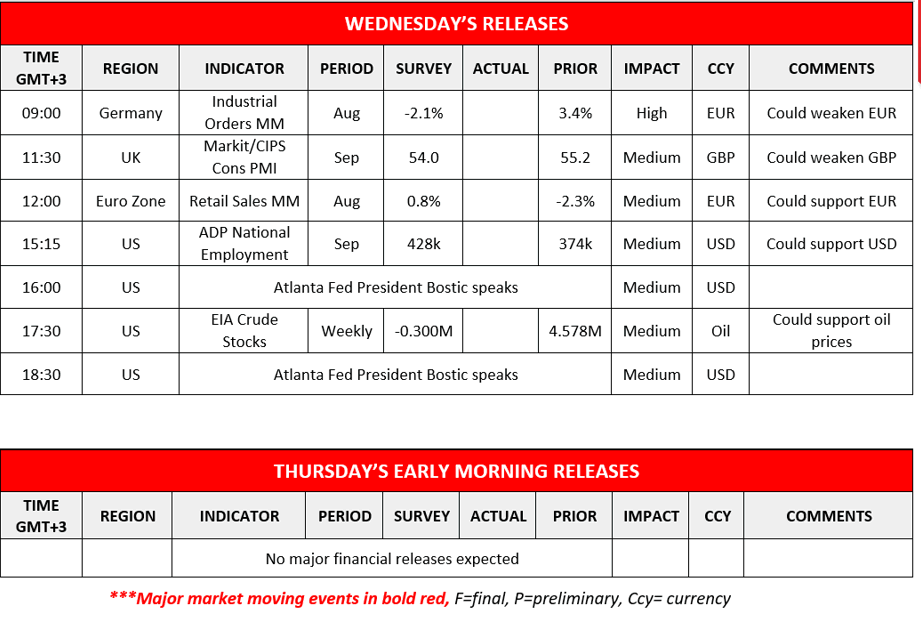
The Analytical Overview Of The Main Currency Pairs
The EUR/USD currency pair
Technical indicators of the currency pair:
Prev Open: 1.1618
Prev Close: 1.1597
% chg. over the last day: -0.18%
Europe's gas reserves are at their lowest seasonal level in more than a decade. Global gas and coal shortages are pushing energy prices higher, which in turn is negatively impacting businesses and economies in the region. Against the background of such a deficit, prices are likely to continue growing in winter. Energy independence is now the EU's main goal.
Trading recommendations
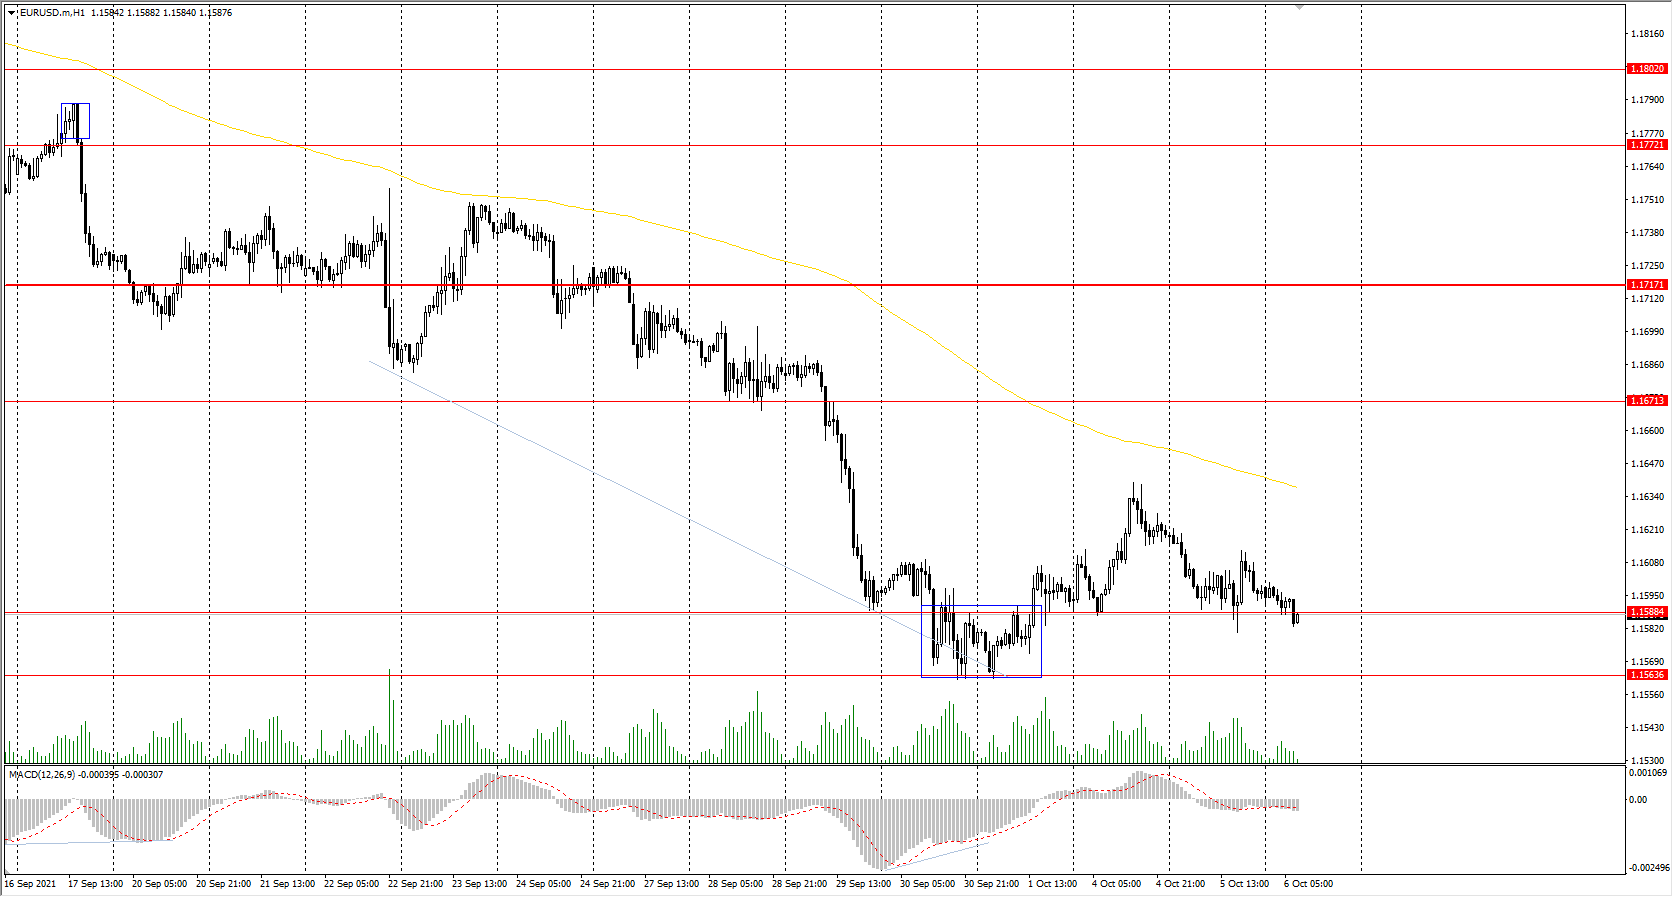
Support levels: 1.1588, 1.1564, 1.1453
Resistance levels: 1.1671, 1.1717, 1.1772, 1.1802, 1.1835
From the technical point of view, the EUR/USD trend is bearish. However, the MACD indicator has become inactive. It indicates that the sellers have stopped putting pressure. Under such market conditions, traders should consider sell deals from the resistance levels near the moving average, as the price has deviated from the middle line. Buy trades should be considered only from the support levels with additional confirmation in the form of a buyers' initiative.
Alternative scenario: if the price breaks out through the 1.1717 resistance level and fixes above, the mid-term uptrend will likely resume.
News feed for 2021.10.06:
- Eurozone Retail Sales (m/m) at 12:00 (GMT+3);
- US ADP Nonfarm Employment Change (m/m) at 15:15 (GMT+3).
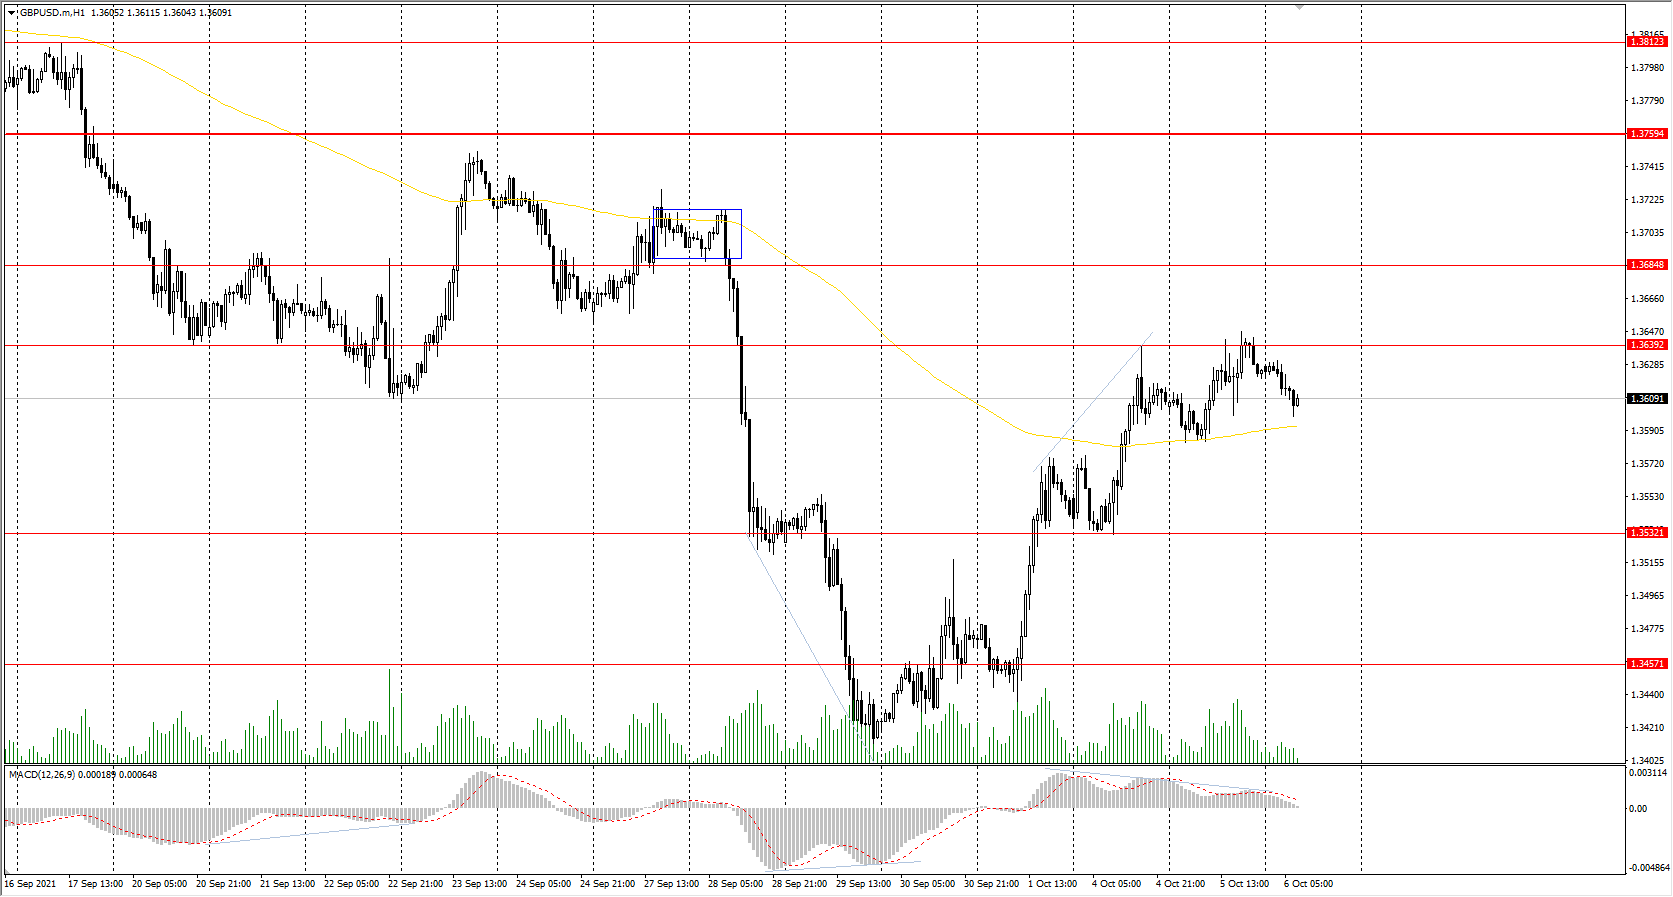
The GBP/USD currency pair
Technical indicators of the currency pair:
Prev Open: 1.3605
Prev Close: 1.3625
% chg. over the last day: +0.15%
Gas prices in the UK have risen significantly since early July. But the situation with fuel shortages at gas stations is improving. British Prime Minister Boris Johnson said that the government created reliable supply lines for Christmas.
Trading recommendations
Support levels: 1.3532, 1.3457, 1.3360, 1.3282
Resistance levels: 1.3639, 1.3685, 1.3759, 1.3812, 1.3886
On the hourly time frame, the GBP/USD trend is bearish. But the British currency keeps getting stronger due to oil prices growth. The MACD indicator has become positive, but there are already signs of divergence. Buy trades should be considered only throughout the day and only with short targets from the support levels after the buyer’s initiative. Sell trades can be found at the resistance levels near the moving average line.
Alternative scenario: if the price breaks out through the 1.3759 resistance level and consolidates above, the bullish scenario will likely resume.
News feed for 2021.10.06:
- UK Construction PMI (m/m) at 11:30 (GMT+3).
The USD/JPY currency pair
Technical indicators of the currency pair:
Prev Open: 110.85
Prev Close: 111.46
% chg. over the last day: +0.55%
Japanese shares fell against the background of the market disappointment in the new government and threats for global economic growth. Rising commodity prices are increasing fears about global inflation in the region, which is also negatively affecting the Japanese Yen.
Trading recommendations
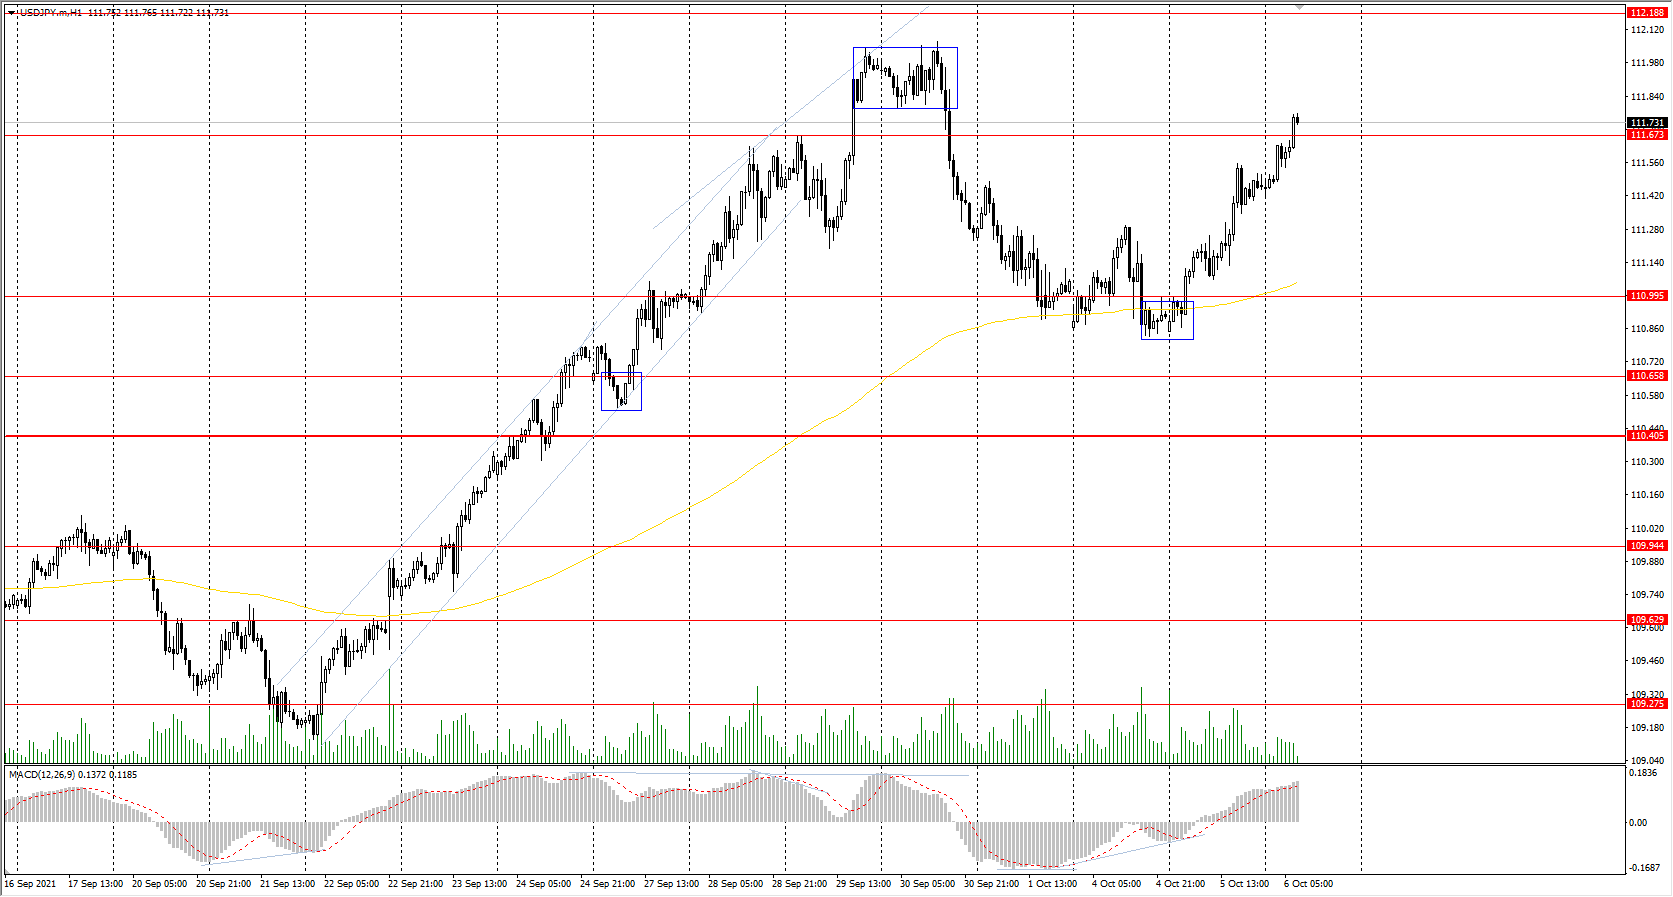
Support levels: 110.99, 110.65, 110.40, 109.95, 109.63, 109.27
Resistance levels: 111.67, 112.19
The main trend of the USD/JPY currency pair is bullish. The MACD indicator has become positive, and there are signs of buyer’s initiative. Under such market conditions, it’s better to look for buy positions from the support levels near the moving average. Sell positions should be considered only throughout the day from the resistance levels, given there is sellers' initiative.
Alternative scenario: if the price falls below 110.45, the uptrend is likely to be broken.
The USD/CAD currency pair
Technical indicators of the currency pair:
Prev Open: 1.2588
Prev Close: 1.2579
% chg. over the last day: -0.07%
The Canadian dollar is a commodity currency, so USD/CAD is highly dependent on the dynamics of the dollar index and oil prices. Both the dollar index and oil prices strengthened yesterday. As a result, USD/CAD are trading flat.
Trading recommendations
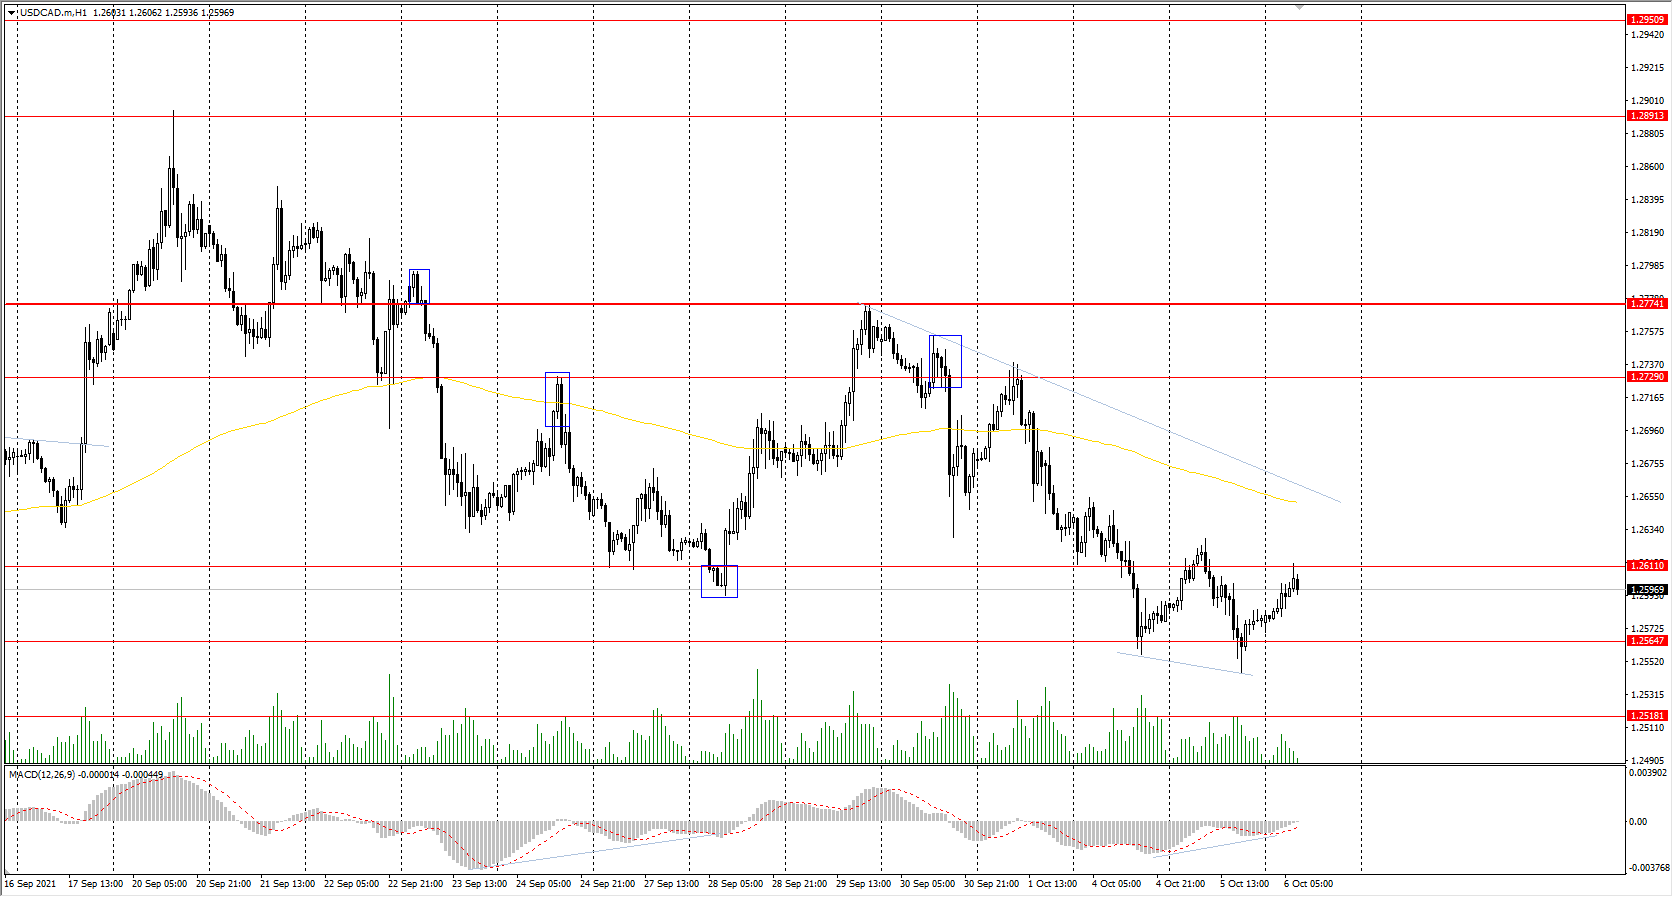
Support levels: 1.2565, 1.2518, 1.2425
Resistance levels: 1.2611, 1.2729, 1.2774, 1.2891
From the technical point of view, the trend of the USD/CAD currency pair is bearish. But the MACD indicator is showing the divergence in the direction of buying. Under such market conditions, it is better to look for sell deals from the resistance levels near the moving average. Buy deals should be considered from the false breakdown zone but with short targets.
Alternative scenario: if the price breaks out through the 1.2774 resistance level and fixes above, the uptrend will likely resume.
News feed for 2021.10.06:
- US Crude Oil Reserves (w/w) at 17:30 (GMT+3).
Inflation Is Above The Target Level In Many Countries
The US stock market closed in the green zone yesterday. At the close of the stock market, the Dow Jones index added 0.92%, the S&P 500 index increased by 1.05%, and the NASDAQ index jumped by 1.25%. But investors still have plenty to worry about, from supply chain disruptions to skyrocketing prices and anticipation of tighter monetary policy from the Federal Reserve. Investors are no longer willing to buy back every stock market drop, and high oil prices create additional inflationary concerns.
Jim Cramer, a well-known US TV host and former hedge fund manager, says that he thinks investors may start looking for hard-hit stocks to buy. Goldman Sachs expects a strong 4th quarter with the S&P 500 up 9%.
US President Joe Biden warns of the risk of a US government debt default due to Republican opposition. The US again opposed the Nord Stream 2 pipeline after Russia announced that it had begun to fill it with gas.
European stock indices rose yesterday. German DAX gained 1.05%, British FTSE 100 added 0.94%, French CAC 40 increased by 1.52%, Spanish IBEX 35 and Italian FTSE MIB increased by 1.54% and 1.95%, respectively. Despite the fact that the cost of gas futures in Europe has updated the record, exceeding $1300 per thousand cubic meters, ECB head Christine Lagarde said that the Central Bank should not overreact to problems in energy supply chains and rising energy prices, as monetary policy can not directly affect it. The ECB still believes that the region's economy will return to pre-pandemic levels by the end of the year.
Saxo Bank's chief equity market strategist said the following, "Policies are being implemented globally as if we have a demand shock, but we are currently facing a supply-side shock due to the pandemic, lack of investments in the physical world, and an accelerated decarbonization through electrification and renewable energy."
Current technology does not allow for increased solar and wind generation because of the instability of such sources. It will lead to supply lagging behind demand and rising inflation, weak real economic growth, and negative rates.
Oil is holding near its highest level since 2014 following OPEC+'s decision to maintain a gradual increase in supply, even as the natural gas crisis boosts demand for crude oil. Companies like Glencore, Gunvor, Trafigura, and Vitol faced margin calls in the gas futures market and had to raise additional funding from banks. Brokers are demanding hundreds of millions of dollars from commodity traders to secure positions that were taken as part of hedging strategies.
Gold prices have stabilized in recent days. But as long as US government bond yields continue to rise because of rising inflation fears, gold and silver prices will be under selling pressure.
The missed payment on the bonds of Chinese real estate developer Evergrande has investors worried again. Another major Chinese developer Fantasia Holdings Group failed to pay its bond debt on time. The company missed the deadline to pay its $205.65 million bond debt due Monday.
Beijing is creating a system designed to ensure that the automated processes of Internet platforms are fair, transparent, and consistent with the ideology of the Communist Party. China's tech index seeks a new low as the global sell-off continues. The Hang Seng Tech Index decreased by 2.5% yesterday. The blue-chip CSI 300 Index lost another 3%, extending losses from the September high to 10%.
Australia's banking regulator is tightening home loan requirements as the rapid credit growth that has caused a jump in home prices poses a risk to financial stability.
New Zealand's central bank raised interest rates for the first time in seven years in an attempt to curb rising inflation. The Reserve Bank of New Zealand (RBNZ) raised the interest rate from 0.25% to 0.5%. The RBNZ also plans to remove most of its stimulus measures as the economy recovers.
Main market quotes:
- S&P 500 (F) 4,345.72 +45.26 (+1.05%)
- Dow Jones 34,314.67 +311.75 (+0.92%)
- DAX 15,194.49 +157.94 (+1.05%)
- FTSE 100 7,077.10 +66.09 (+0.94%)
- USD Index 94.00 +0.22 (+0.24%)
Important events for today:
- New Zealand RBNZ Interest Rate Decision at 04:00 (GMT+3);
- New Zealand RBA Rate Statement at 04:00 (GMT+3);
- UK Construction PMI (m/m) at 11:30 (GMT+3);
- Eurozone Retail Sales (m/m) at 12:00 (GMT+3);
- US ADP Nonfarm Employment Change (m/m) at 15:15 (GMT+3);
- US Crude Oil Reserves (w/w) at 17:30 (GMT+3).