

Sample Category Title
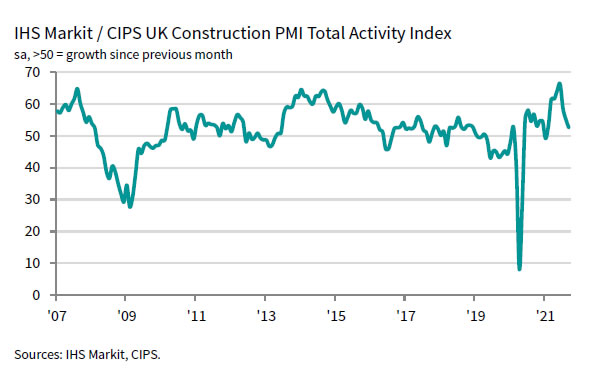
UK PMI construction dropped to 52.6, severe loss of momentum
UK PMI Construction dropped to 52.6 in September, down from August's 55.2, missed expectation of 53.9. Markit said output growth eased for the third month running. Sub-contractor charges increased at survey-record pace. Widespread supply shortages led to rapid cost inflation.
Tim Moore, Director at IHS Markit said: "September data highlighted a severe loss of momentum for the construction sector as labour shortages and the supply chain crisis combined to disrupt activity on site. The volatile price and supply environment has started to hinder new business intakes... Shortages of building materials and a lack of transport capacity led to another rapid increase in purchase prices... Measured overall, prices charged by sub-contractors increased at the fastest rate since the survey began in April 1997."
RBNZ Hiked Policy Rate for First Time in 7 Years
For the first time in 7 years, the RBNZ increased the OCR by +25 bps to 0.5% in October. Policymakers pledged to tighten further in coming months as inflation pressure continues to exceed target. Policymakers remained hopeful about the economic outlook, suggesting that easing of pandemic-related restrictions could help return growth momentum.
On economic developments, the central bank acknowledged “elevated” economic uncertainty as a result of the pandemic. Yet, it remained optimistic about the longer-term outlook. As noted in the statement, “household and business balance sheet strength, ongoing fiscal policy support, and a strong terms of trade provide confidence that economic activity will recover quickly as alert level restrictions ease”.
Policymakers also took note of the “persistent” cost pressure in the near-term due to labor shortage and supply chain disruption. They projected headline CPI to rise above +4% in the near-term before returning towards the +2% midpoint over the medium term. They also indicated that the near-term price pressure has mainly been driven by the supply side shortage: higher oil prices, rising transport costs and the impact of supply shortfalls. Such pressures should prove temporary and be alleviated in the medium term.
The rate hike was widely anticipated. Policymakers also affirmed that further removal of monetary policy stimulus is expected over time, contingent on the outlook of inflation and the job market in the medium term. While the another rate hike in November is likely, the rate cycle could be gradual as inflation tames in the medium term. With restrictive measures eased and border control relaxed, labour shortage and supply chain problem could be relieved.
NAS 100 Breaks Key Support
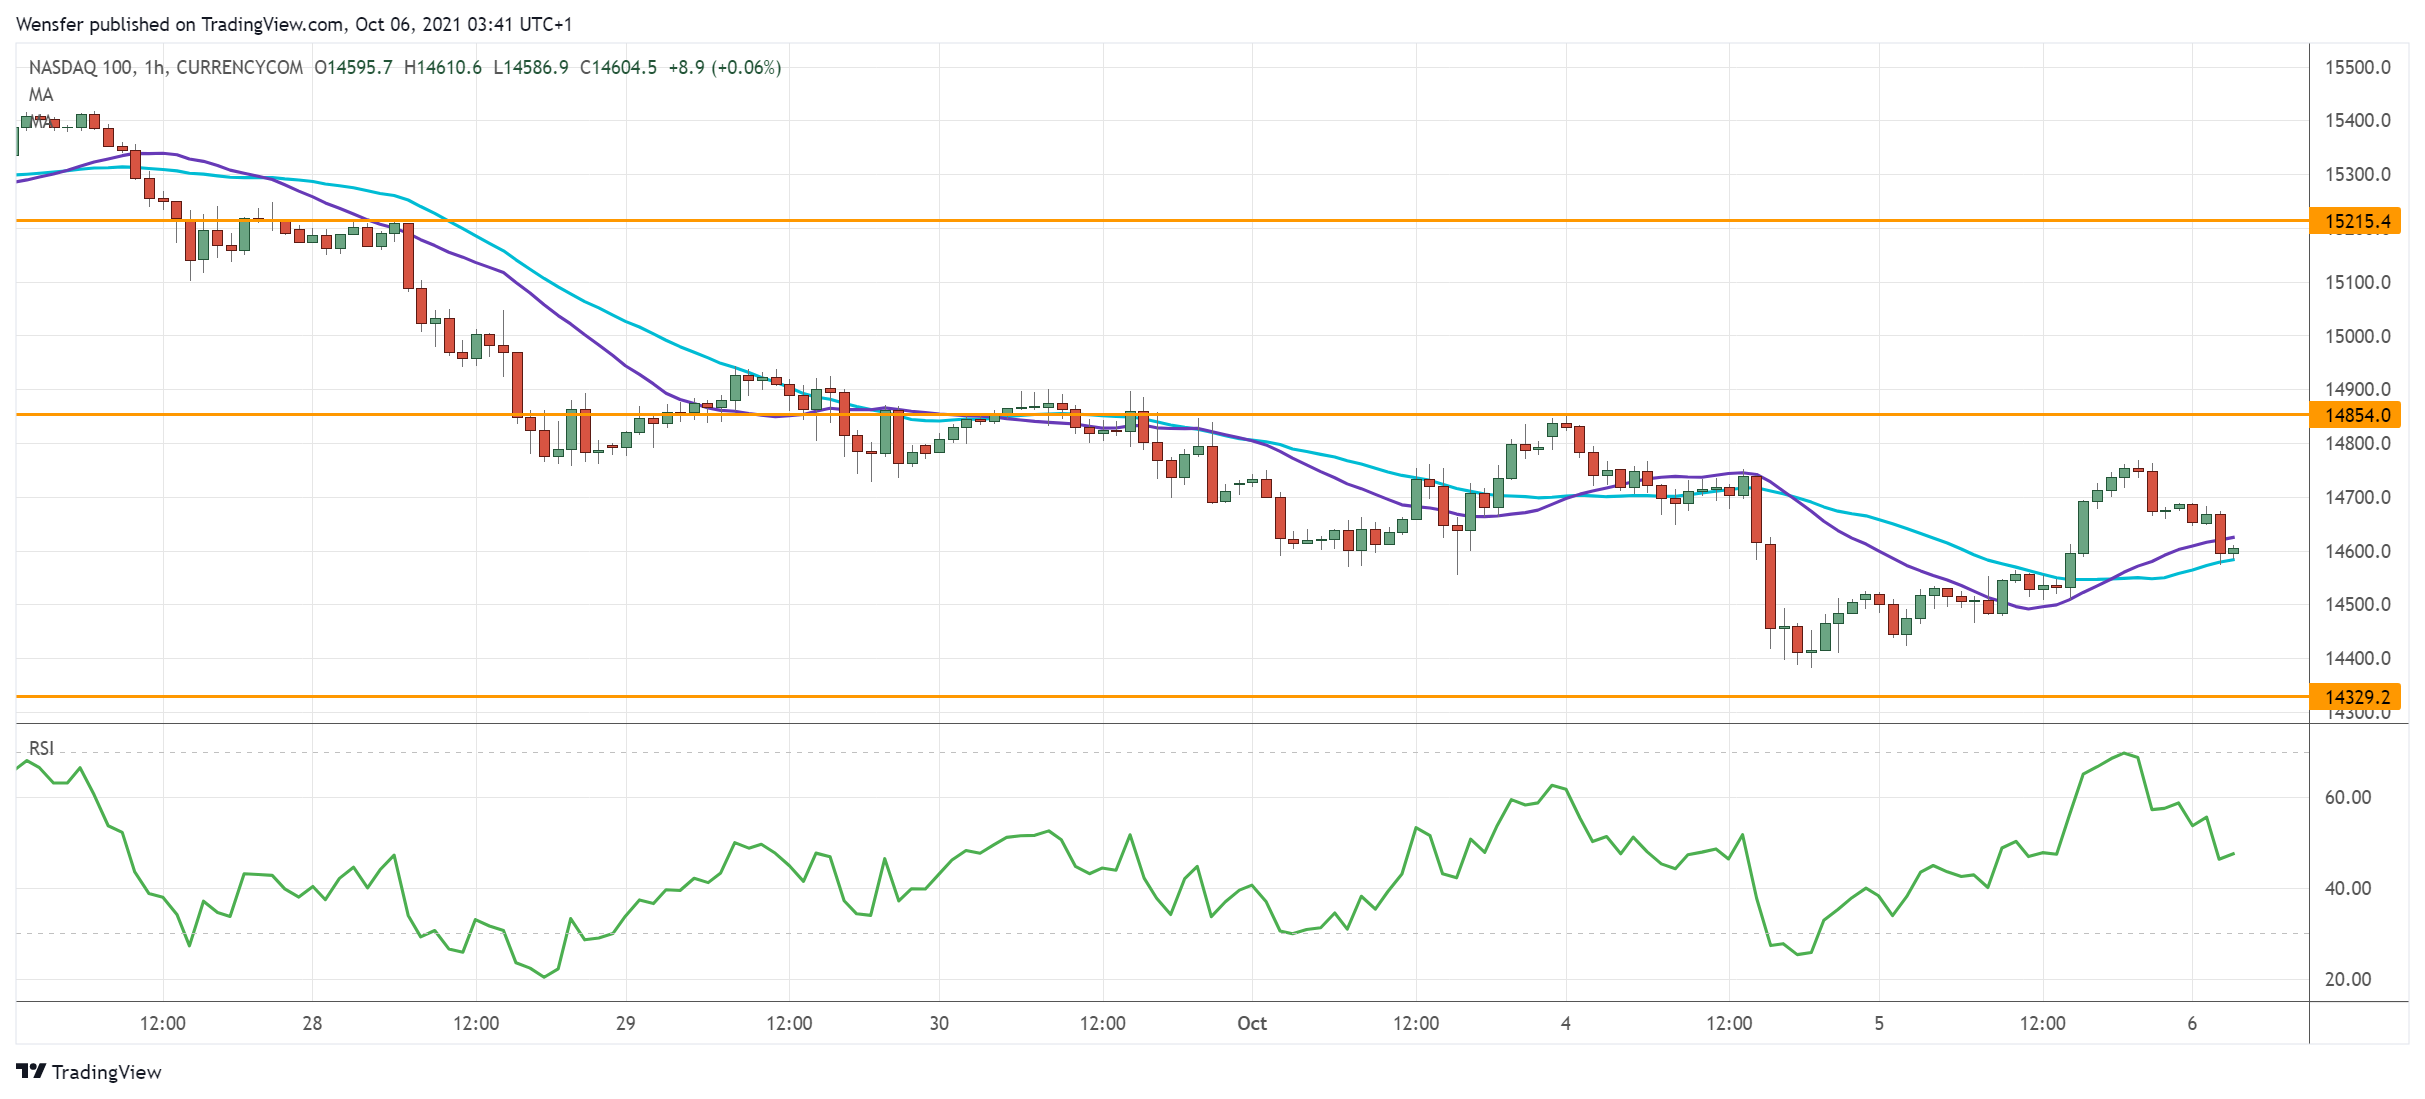
The Nasdaq 100 struggles as investors rotate out of growth stocks amid an uncertain outlook.
The break below last July’s low (14450) has pushed the index into a deeper correction. A bearish MA cross on the daily chart points to a downgrade in market sentiment.
An oversold RSI has caused a temporary rebound, which would be an opportunity for trend followers to sell into strength. 14330 is the next support. Short-term traders who are brave enough to buy the dips must push through 14850 to secure a foothold.
AUD/USD Attempts To Rebound
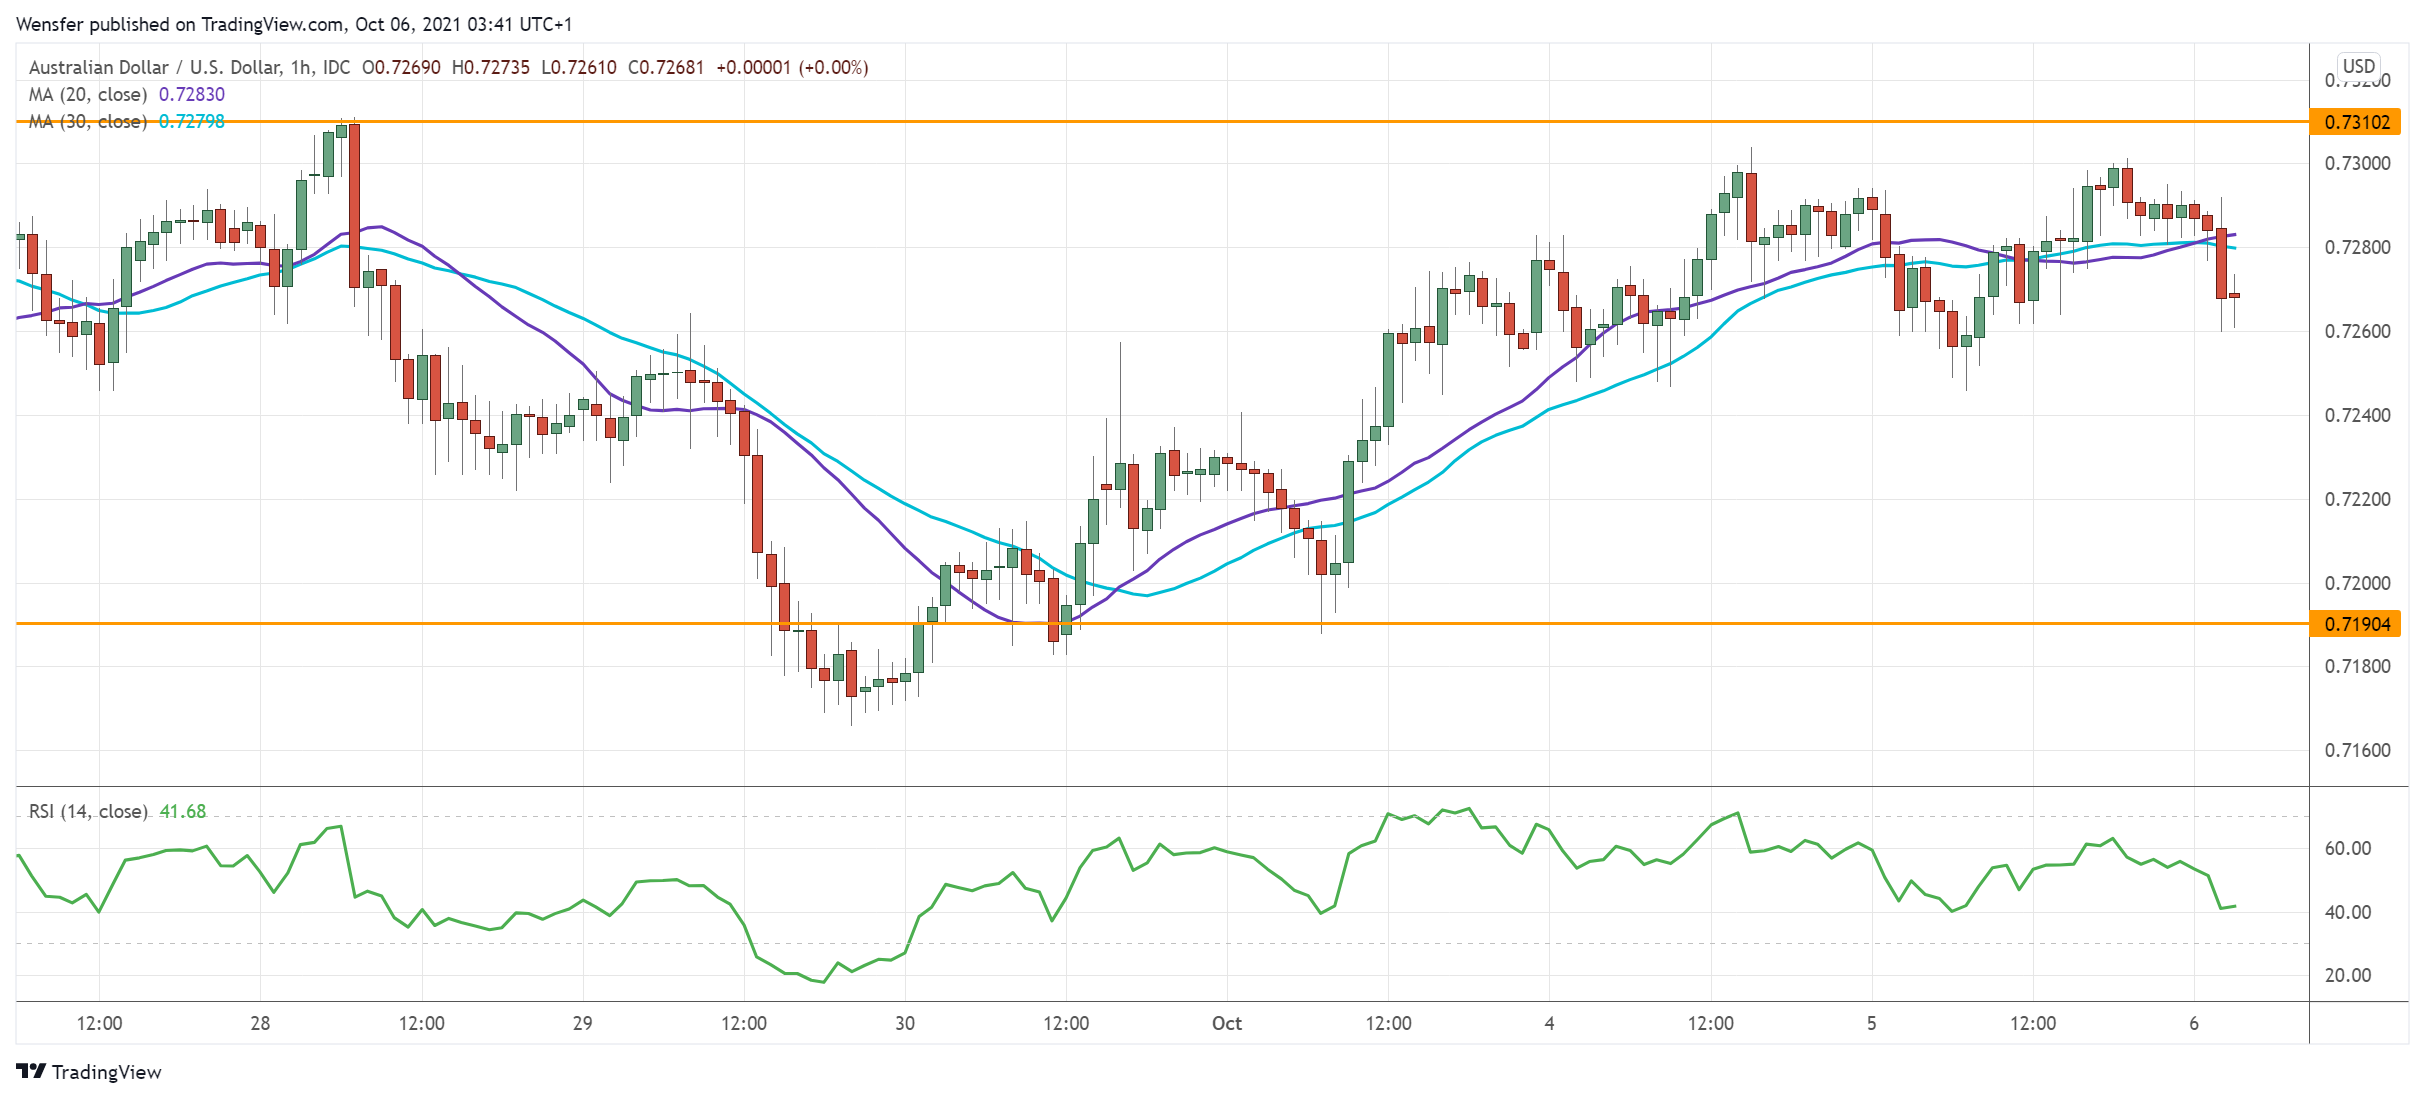
The Australian dollar consolidated its gains after the RBA played down the rate-hike pressure.
The rally above 0.7250 has prompted short-term traders to take some chips off the table. However, the bulls will need to clear the main hurdle at 0.7310 before they could extend upward. The RSI’s double top in this congestion area may momentarily restrain their optimism.
In case of a pullback, 0.7190 is a key support to keep the rebound relevant. Failing that, the pair could tumble towards the daily support at 0.7120.
XAU/USD Tests Resistance
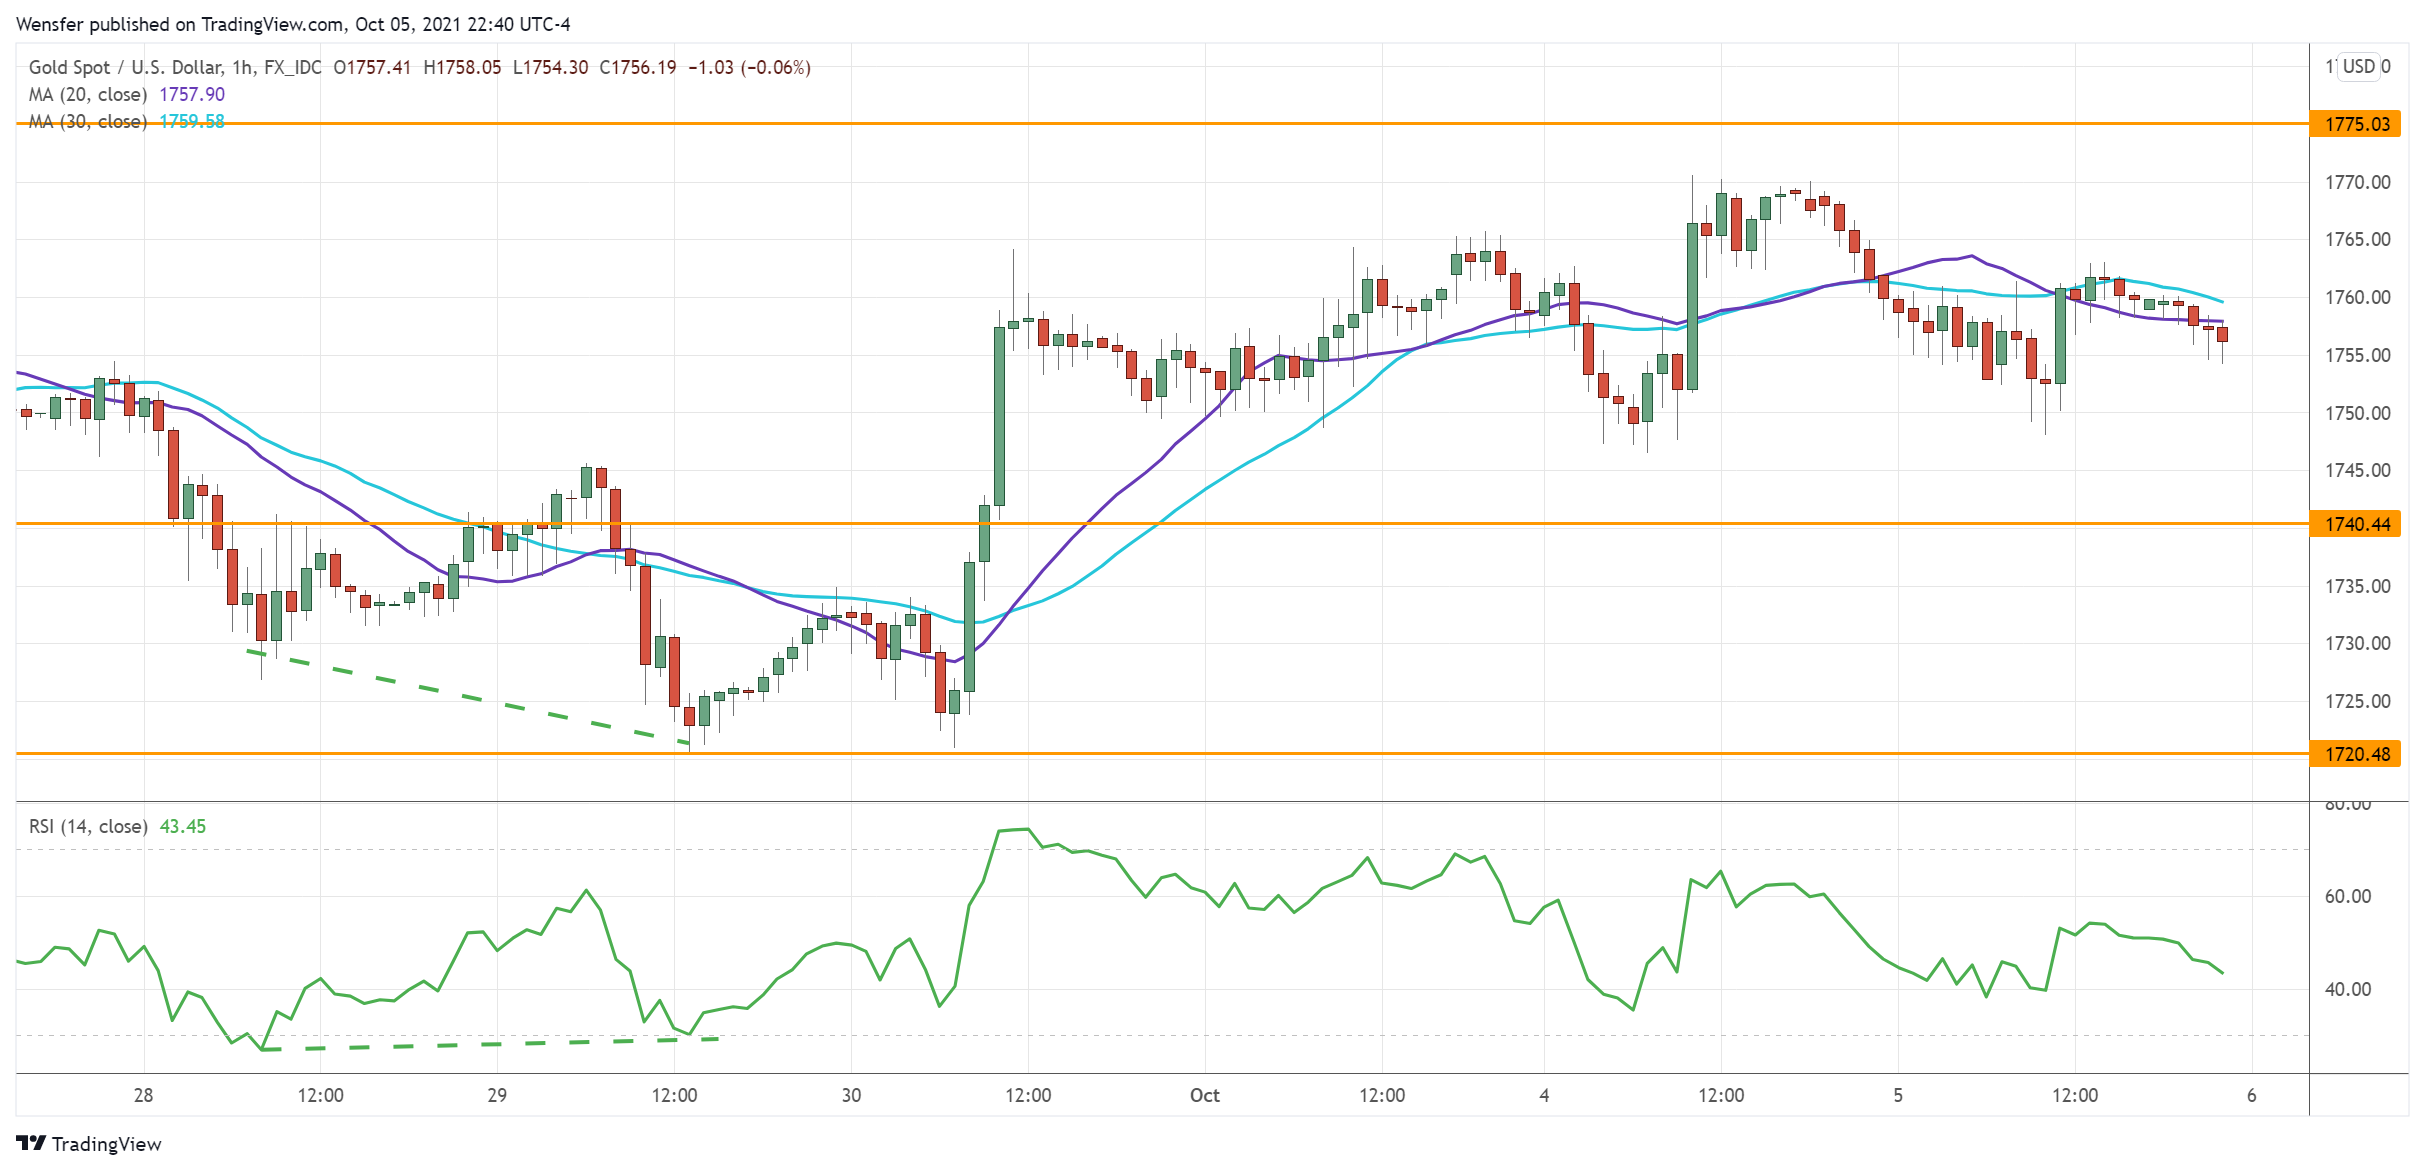
Gold hit a speed bump after an upbeat ISM Services PMI boosted the dollar’s appeal. The metal saw buying interest in the major demand zone around 1720. A bullish RSI divergence indicates a slowdown in the pace of the sell-off. The initial surge above 1745 could be due to profit-taking from the short side, a prerequisite for a reversal.
1775 is the main hurdle and its breach may lead to the psychological level of 1800. On the downside, the area between 1720 and 1740 is the floor to keep price action afloat.
Gold: Growth Potential Already Outweighs Downside Risks
Gold's near-term prospects are bleak, but observations on the price dynamics indicate cautious buying for the longer term, limiting the downside potential.
In early September, the sellers, with a strong move, brought the gold back below the significant 50 and 200-day moving averages and the descending resistance line formed by the August 2020 and May-June peaks of this year. Locally, gold is also being pushed ever lower, as shown by a series of declining local lows since June.
Fundamental factors are also playing clearly against gold. The US monetary policy cycle is unfolding, promising a reduction of stimulus in the form of balance sheet purchases. More importantly, the Fed is expecting an interest rate hike in about a year. This is much faster than it has been since the global financial crisis. It is important to note that gold and silver broke their steep upward trend in 2011 precisely on the tightening of US policy signals.
Last year gold barely and briefly managed to rewrite the highs of ten years ago, while silver never reached them. Rising interest rates are bringing back the attractiveness of bonds, while precious metals are not yielding.
Fears that the Fed's monetary policy will miss out on inflation and collapse the dollar have also so far failed to materialise. Investors perceive the current policy as adequate, switching to buying dollars, judging by the markets' reaction.
But there is a bright side of shorter timeframes for trends cycles in gold: a faster decline to attractive levels reduces the chances of long-term depression in the sector.
Although we continue to see a prevailing downtrend, in the coming days and weeks, traders should pay attention to the dynamics of gold near $1680. A dip to these levels would undo all the gains from pre-pandemic levels. This is where prices have received meaningful support since June last year. We saw roughly the same nullification of the crisis growth cycle after 2011 when the price of gold found long-term support near $1000 in 2015.
This time too, a return under $1700 promises to attract long-term buyers betting on trends beyond the pandemic and intensified money printing and long-term economic growth and demand for the metal.
Therefore, short-term traders can already start looking at gold for a good entry point on the local oversold area. Longer-term investors seem looking closer to the sector and buying, as the balance of potential and risk is now skewed towards the former.
Momentum dips below $1700 may be accumulation points for long-term investors and the starting point of a multi-year bullish cycle.
USDJPY Back To Bullish Territory With Strong Momentum
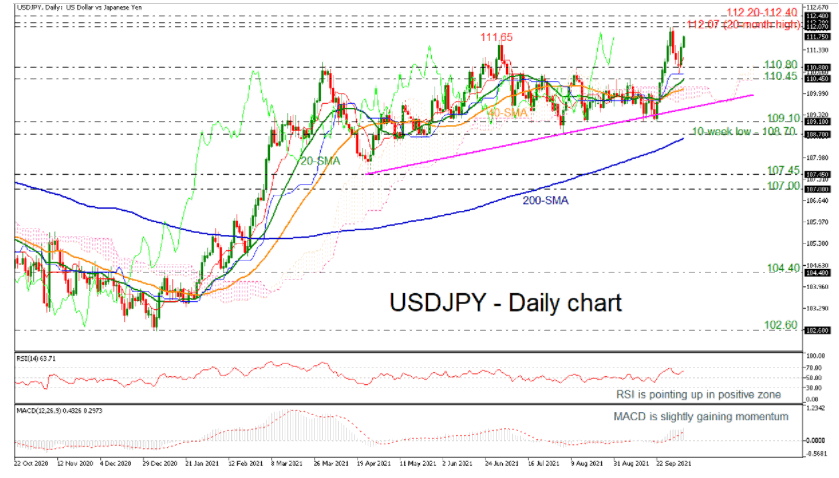
USDJPY is recouping the losses that posted in the preceding week with strong momentum, approaching the 20-month high of 112.07.
In technical indicators, the RSI is sloping upwards in the positive region, while the MACD is gaining momentum again above its trigger and zero lines. Moreover, the red Tenkan-sen line is still standing above the blue Kijun-sen line, while the price is trading well above the Ichimoku cloud, endorsing a positive structure.
More upside moves could retest the 112.07 key mark before attention turns to the 112.20-112.40 resistance area. Moving higher, the 113.70 resistance may next attract attention as the market action had paused around this level in the past, while a significant rally above that region could last until 114.20, the peak in November 2018.
Should the price extend declines, the 110.80 support could come into the spotlight ahead of the 110.45 barrier. Below that, the focus could shift straight to 110.45 before the 20- and 40-day simple moving averages (SMAs) at 110.30 and 110.07 respectively come into view. If the latter permits for further weakness, the next stop could be around 109.10 and the ten-week low of 108.70.
Turning to the medium-term picture, the bullish outlook came back into play after the bridge of the 111.65 high. For a bear market, though traders need to wait for a clear close below the ascending channel and the 200-day SMA at 108.55.
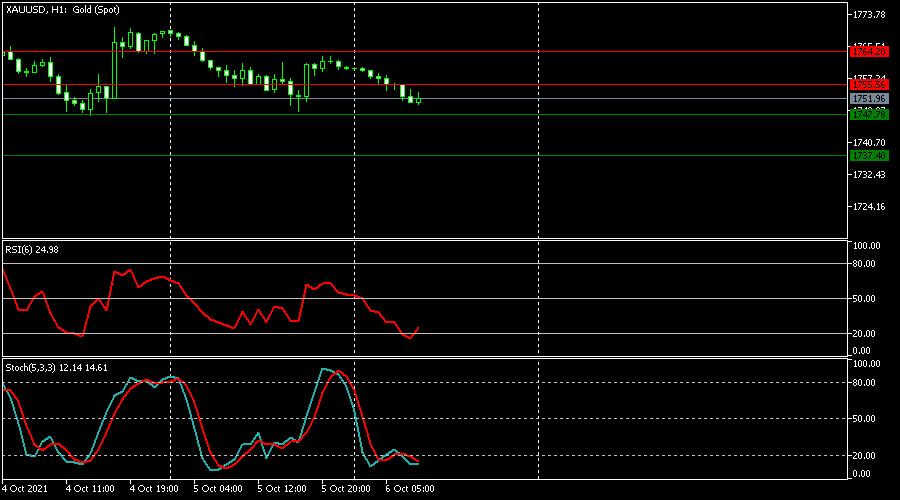
XAUUSD Is Possibly Bullish
Technical analysis
The RSI crossed the oversold zone and now pointing upwards
The Stochastics is at the oversold zone.
Most likely scenario - BUY
Target prices: 1,755.56 1,764.20
Alternative scenario - SELL
Target prices: 1,747.78 1,737.40
Key levels
Support 1,747.78 1,737.40
Resistance 1,755.56 1,764.20
NASDAQ 100 Rebounds Even As Inflation And Default Risks Remain
US stocks rebounded on Tuesday after dropping substantially on Monday. The Dow Jones and Nasdaq 100 indices rose by more than 400 points while the S&P 500 rose by more than 62 points. The rally happened as some investors moved to buy the dips after strong US services PMI numbers by the Institute of Supply Management (ISM). Still, there are several reasons to be fearful about the market. For one, inflation is expected to rise substantially as the price of key commodities like crude oil, natural gas, and cotton surged. There has been no solution to the debt ceiling issue in the United States.
The euro was little changed against key assets as the market reflected on strong composite and services PMI numbers. The data revealed that the services PMI in the Eurozone declined to 56.4 in September. This was better than the median estimate of 56.3. Eurostat also published relatively weak producer price index (PPI) data. The bloc’s PPI declined from 2.5% in July to 1.1% in August. On a year-on-year basis, the PPI rose from 12.4% to 13.4%. Later today, the euro will react to the latest Eurozone retail sales numbers.
The economic calendar will be muted today. The key numbers to watch will be the ADP private non-farm payroll numbers. Analysts expect the data to show that the economy added more than 428k jobs in September. The next key data to watch will be the Energy Information Administration (EIA) oil inventories numbers. Still, investors will be eying the Chinese property market. Evergrande has continued to halt its stock while strains showed among other companies. Fantasia Holdings failed to pay a debt instalment while the Sinic credit rating was downgraded.
EURUSD
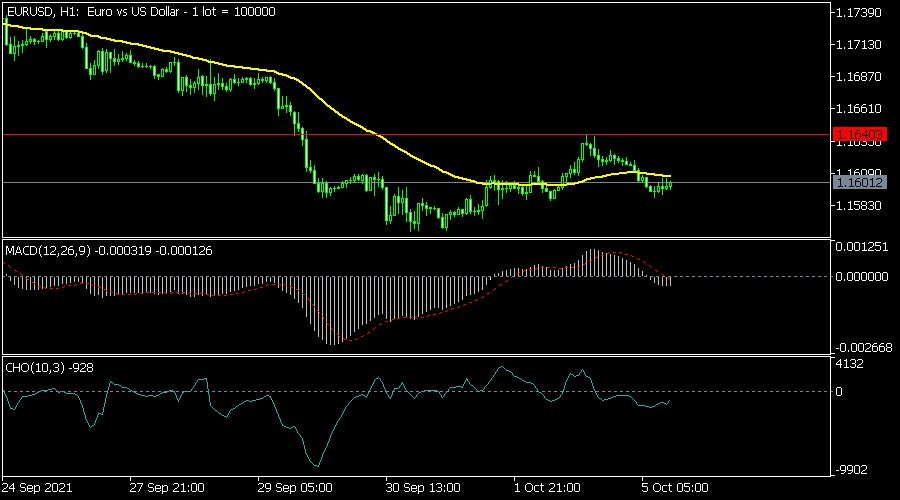
The EURUSD pair was little changed in the overnight session as traders waited for the Eurozone retail sales numbers. The pair is trading at 1.1606, where it has been in the past few sessions. As a result, the pair is trading along with the 25-day moving average while most oscillators are at the neutral level. Therefore, the pair will likely remain in the current range in the near term.
XTIUSD
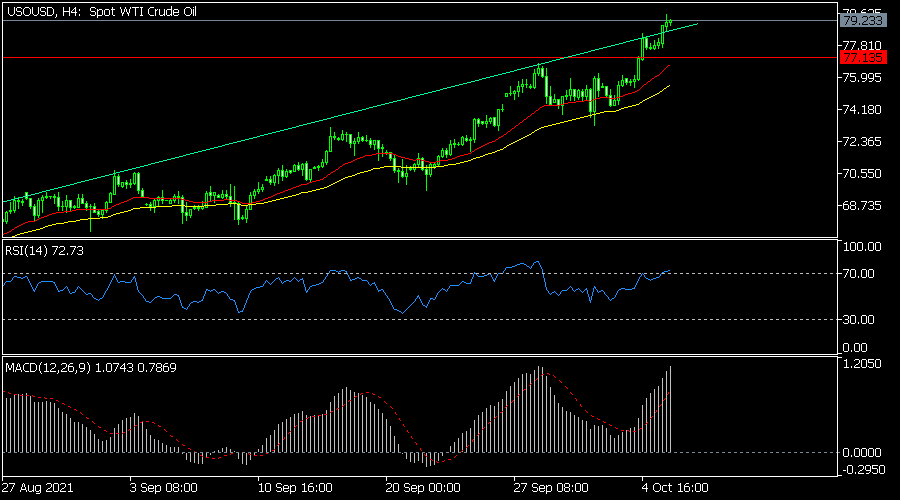
The XTIUSD pair has been in a major bullish trend as demand for crude oil rises at a faster pace than supplies. On the four-hour chart, the price is above the 25-day and 50-day moving averages. It also moved above the key resistance level at 77.13 while the Relative Strength Index (RSI) has moved to the overbought level of 72. The price rose above the upper trendline shown in green. Therefore, the pair will likely keep rising as bulls target the key resistance at 80.
AUDUSD
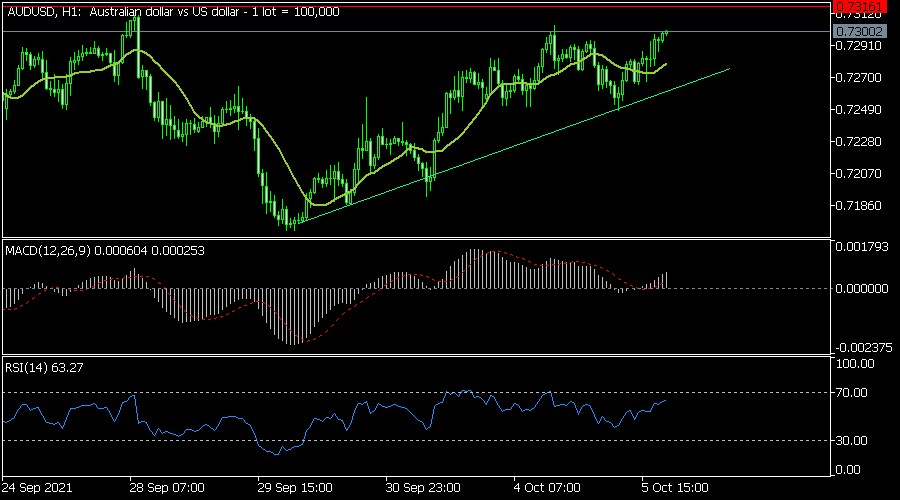
The AUDUSD pair rose to a high of 0.7300 as demand for commodities rose. On the four-hour chart, the pair is approaching the key resistance at 0.7315, which was the highest level in September. The pair is being supported by short and long term moving averages while the RSI has been in a strong bullish trend. Therefore, the pair will likely keep rising as bulls target the important resistance at 0.7315.
Most Asian Stocks Fail To Hold Opening Gains
Markets
Core bond yields surged yesterday with USTs hugely underperforming German Bunds. Along with an improved equity sentiment (European stocks up to 1.7% higher and up to 1.25% in the US), strong US data and ever-increasing gas/oil prices were the main drivers. US ISM services confidence unexpectedly improved to 61.9 mainly as business activity picked up (62.3 from 60.1). Supplier deliveries remain at an elevated 68.8 (from 69.6). Gas prices went completely berserk, adding about 20% and pulling oil and the likes also higher to $82.56/b (Brent). The US yield curve bear steepened with the move accelerating in the first US trading hour. Changes varied from 0.7 bps (2y) to 5.2 bps (30y) exclusively on the back of inflation expectations. Regarding the latter, we reached an important milestone in the EMU where a gauge for long-term expectations hit the 2% mark for the first time since 2013. Real yields continue to decline however, reaching a new all-time low in Germany at -2.11%. The curve steepened up to 2.6 bps (10y). Despite a weakish dollar, EUR/USD struggled and finished back below 1.16. It only gained against the JPY (129.28) and the CHF (1.075) in the G10 landscape. Sterling enjoyed both from the risk climate and skyrocketing yields (>7 bps). EUR/GBP neared the 0.85 barrier.
Most Asian stocks fail to hold opening gains. South Korea underperforms (-2.3%). Core bonds extend their steep fall amid rising inflation concerns. US yields push another 4.6 bps higher at the long end of the curve. The 10y and 30y yield are both trading at the highest level since June. The euro is in good shape but the dollar is simply better: EUR/USD extends yesterday’s decline to 1.1587 currently. The kiwi dollar is no match even as the RBNZ hiked rates and is likely to do so another time in November (see headline below).
The “unofficial” US job report from ADP is due today. Markets expect a 430k job creation in September. Whatever its outcome, however, it’ll have to be extremely bad or even negative to alter expectations for the Fed to formally announce/start the tapering process in November. We see no compelling reasons for the move in core bonds to reverse soon with the energy crisis intensifying as the winter approaches. The technicals suggest the same with the US10y taking out 1.52% resistance and the German 10y -0.20%. US gas inventories are later published today and might add to investor worries should they shrink beyond expectations. We stay cautious on the euro. EUR/USD’s downside looks vulnerable with first support at 1.1495 still lurking.
News headlines
The Reserve Bank of New Zealand pulled the trigger on a first rate hike after a sudden outbreak of the Delta-variant prevented them to do so back in August. The MPC raised the policy rate from 0.25% to 0.50% and believes that it is appropriate to continue reducing the amount of monetary stimulus over time so as to maintain low inflation and support maximum sustainable employment. Markets discount another 25 bps hike at the November 24 meeting. The New Zealand economy in aggregate has been performing strongly despite the Auckland-lockdown. Headline CPI inflation is expected to increase above 4% in the near term before returning towards the 2%-midpoint over the medium term. The near-term rise in inflation is accentuated by higher oil prices, rising transport costs and the impact of supply shortfalls. These immediate relative price shocks risk leading to more generalized price rises. The kiwi dollar slightly loses out against broad-based dollar strength this morning. NZD/USD declines from 0.696 to 0.692.
The Australian Prudential Regulation Authority (APRA) increased the minimum interest rate buffer it expects banks to use when assessing the serviceability of home loan applications from 2.5% percentage points above the loan product rate to 3%. APRA took the action supported by the RBA (eg in yesterday’s monetary policy statement), the Treasury and the Australian Securities and Investments Commission. While the banking system is well capitalised and lending standards overall have held up, increases in the share of heavily indebted borrowers, and leverage in the household sector more broadly, mean that medium-term risks to financial stability are building. AUD/USD also follow the broader dollar move, dipping from AUD/USD 0.729 to 0.726.