
Sample Category Title
EUR/AUD Daily Outlook
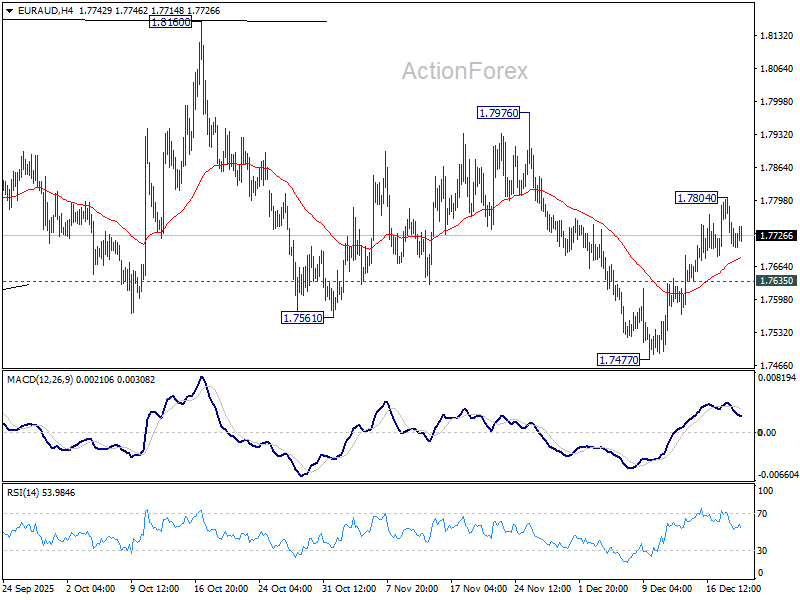
Daily Pivots: (S1) 1.7688; (P) 1.7748; (R1) 1.7789; More...
Intraday bias in EUR/AUD is turned neutral with current retreat. Further rise will remain in favor as long as 1.7635 support holds. Fall from 1.1806 might have completed with three waves down to 1.7477. Above 1.7804 will target 1.7976 resistance next. Nevertheless, break of 1.7635 will revive near term bearishness and target 1.7477 again.
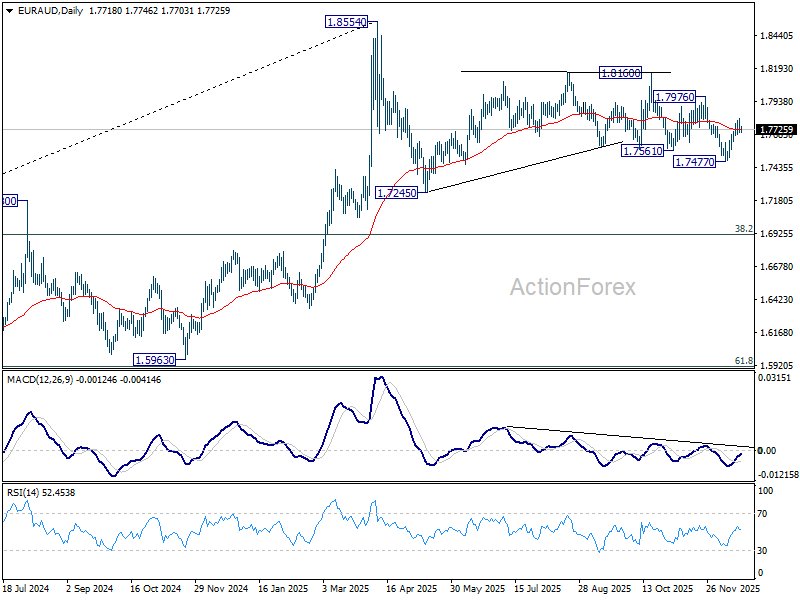
In the bigger picture, as long as 55 W EMA (now at 1.7465) holds, price actions from 1.8554 could still be a correction to rise from 1.5963 only. However, sustained break of the EMA will argue that it's already correcting the whole up trend from 1.4281 (2022 low). In this case, deeper decline would be seen to 38.2% retracement of 1.4281 to 1.8554 at 1.6922.
EUR/CHF Daily Outlook
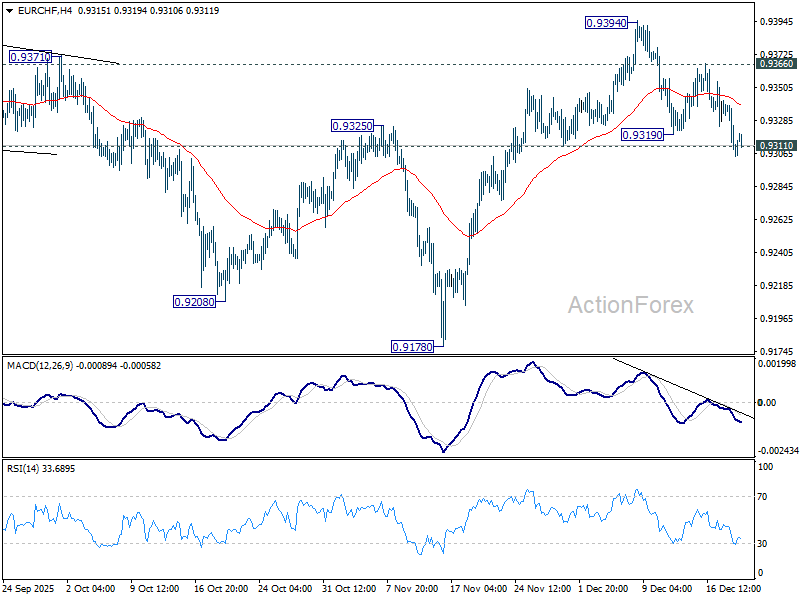
Daily Pivots: (S1) 0.9297; (P) 0.9320; (R1) 0.9332; More....
EUR/CHF's fall from 0.9394 resumed and the break of 0.9311 support argues that rebound from 0.9178 has completed. Intraday bias is back on the downside. Sustained trading below 55 D EMA (now at 0.9317) will pave the way back to retest 0.9178 low. Nevertheless, break of 0.9366 resistance will resume the rise from 0.9178 through 0.9394.
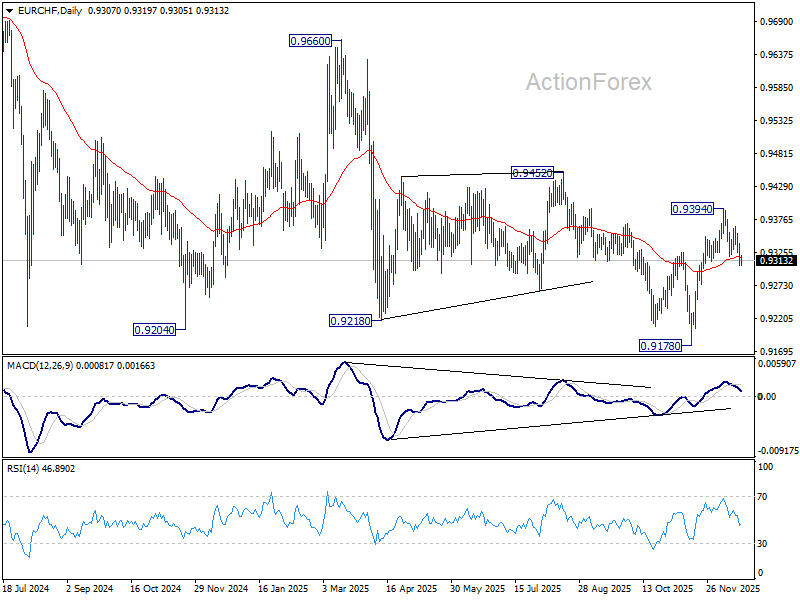
In the bigger picture, EUR/CHF has breached long term falling channel resistance as the rebound from 0.9278 extends. Considering bullish convergence condition in W MACD, sustained trading above 55 W EMA (now at 0.9316) will indicate medium term bottoming at 0.9178, and suggests that it's already in larger scale rebound. Further break of 0.9452 resistance will bring stronger medium term rally towards 0.9928 resistance next. Nevertheless, rejection by 55 W EMA will retain bearishness for another fall through 0.9278 at a later stage.
AUD/USD Daily Report
Daily Pivots: (S1) 0.6594; (P) 0.6612; (R1) 0.6632; More...
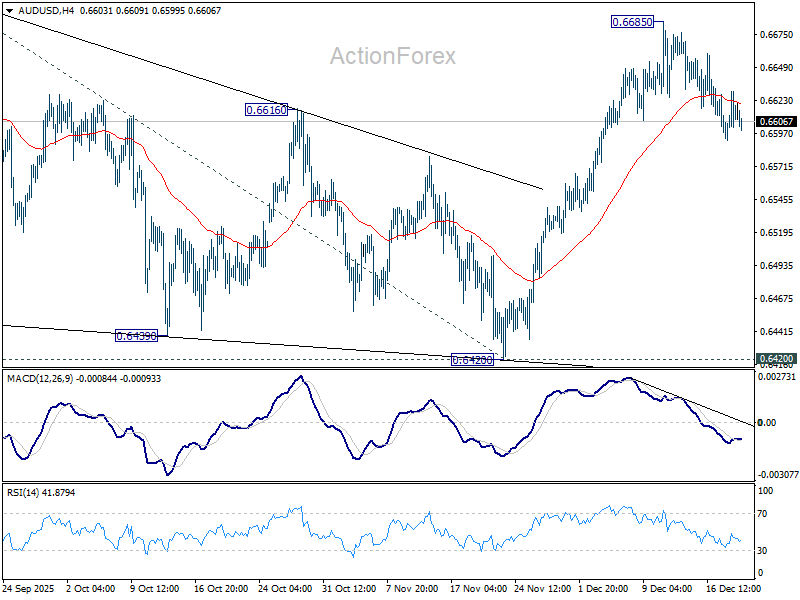
AUD/USD is still extending consolidations below 0.6685 and intraday bias stays neutral. On the upside, firm break of 0.6706 will confirm resumption of whole rise from 0.5913. Next target is 61.8% projection of 0.5913 to 0.6706 from 0.6420 at 0.6910. However, sustained break of 55 D EMA (now at 0.6561) will extend the corrective pattern from 0.6706 with another falling leg, and target 0.6420 support.
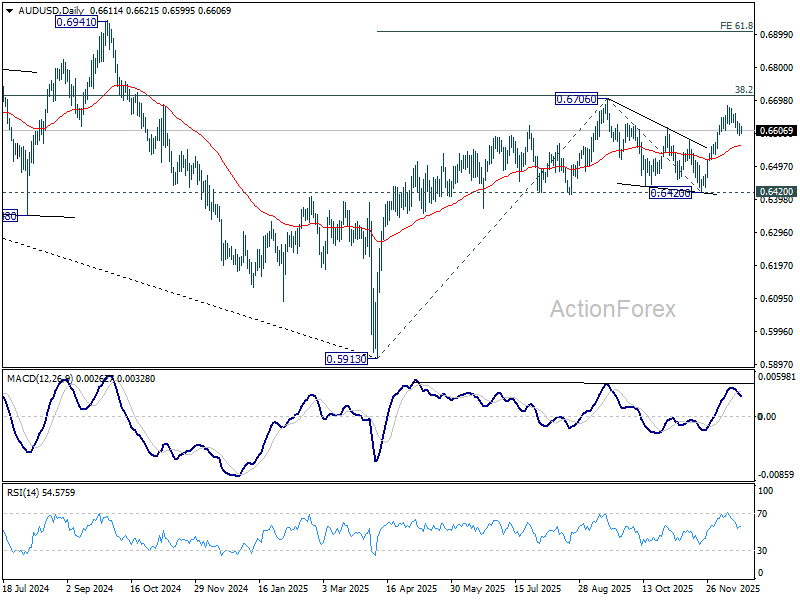
In the bigger picture, the break of multi-year falling trend line resistance suggests that rise from 0.5913 is possibly reversing whole down trend from 08006 (2021 high). Decisive break of 38.2% retracement of 0.8006 to 0.5913 at 0.6713 will solidify this case, and bring further rally to 61.8% retracement at 0.7206. On the downside, however, firm break of 0.6420 support will suggest rejection by 0.6713 and retain medium term bearishness.
USD/CAD Daily Outlook
Daily Pivots: (S1) 1.3758; (P) 1.3777; (R1) 1.3798; More...
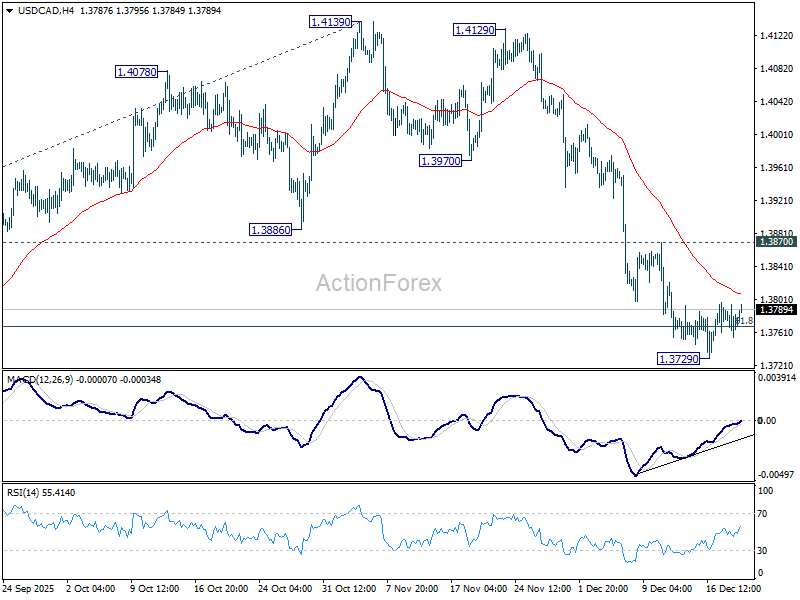
Intraday bias in USD/CAD stays neutral as range trading continues. With 1.3879 resistance intact, further decline is expected. On the downside, sustained trading below 61.8% retracement of 1.3538 to 1.4139 at 1.3768 will argue that whole fall form 1.4791 might be ready to resume. Retest of 1.3538 low should be seen next. However, firm break of 1.3870 resistance will confirm short term bottoming, and turn bias back to the upside for stronger rebound.
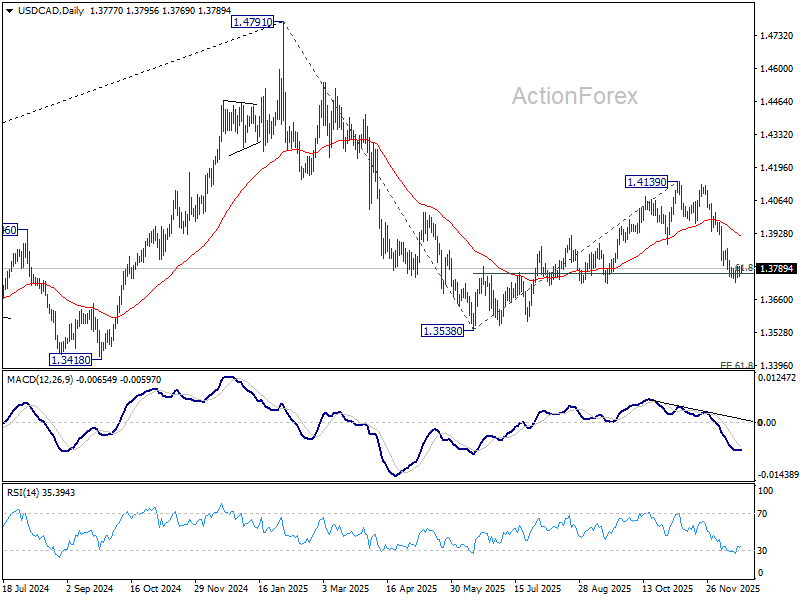
In the bigger picture, current development suggests that price actions from 1.4791 is developing into a deeper, larger scale correction. In the less bearish case, it's just correcting the rise from 1.2005 (2021 low). But even so, break of 1.3538 will pave the way to 61.8% projection of 1.4791 to 1.3538 from 1.4139 at 1.3365. This will remain the favored case as long as 1.4139 resistance holds, in case of rebound.
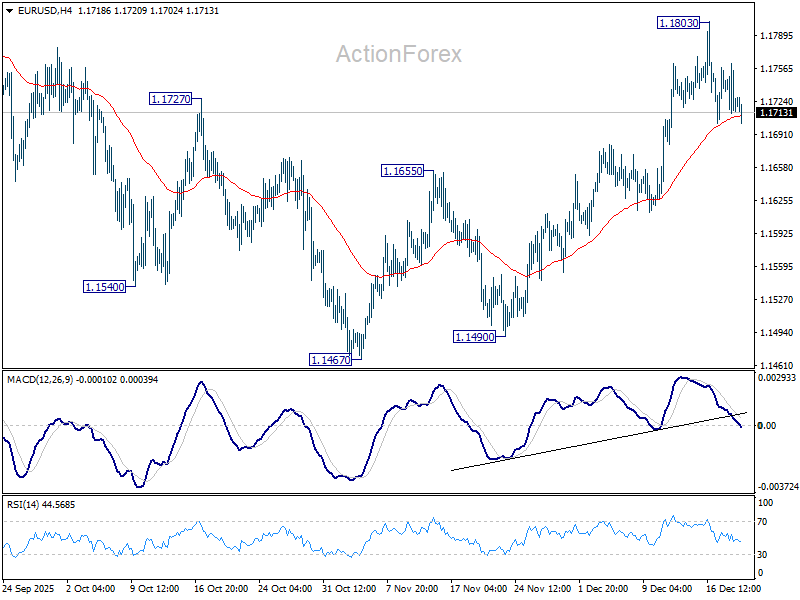
EUR/USD Daily Outlook
Daily Pivots: (S1) 1.1704; (P) 1.1734; (R1) 1.1754; More….
Intraday bias in EUR/USD remains neutral as range trading continues below 1.1803. On the upside break of 1.1803 will resume the rally from 1.1467 to retest 1.1917 high. Decisive break there will resume larger up trend. On the downside, however, firm break of 55 D EMA (now at 1.1640) will turn bias back to the downside for 1.1467 support, to extend the corrective pattern form 1.19717 with another falling leg.
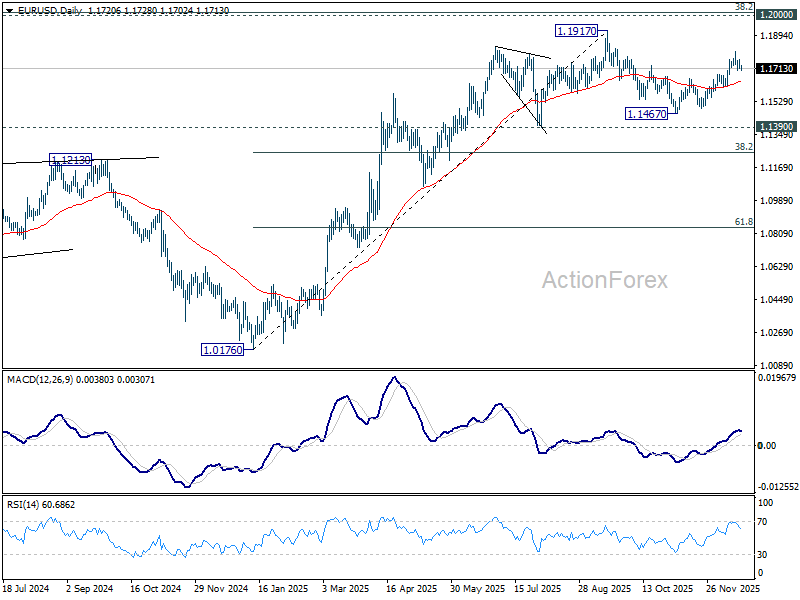
In the bigger picture, as long as 55 W EMA (now at 1.1373) holds, up trend from 0.9534 (2022 low) is still in favor to continue. Decisive break of 1.2 key psychological level will carry larger bullish implication. However, sustained trading below 55 W EMA will argue that rise from 0.9534 has completed as a three wave corrective bounce, and keep long term outlook bearish.
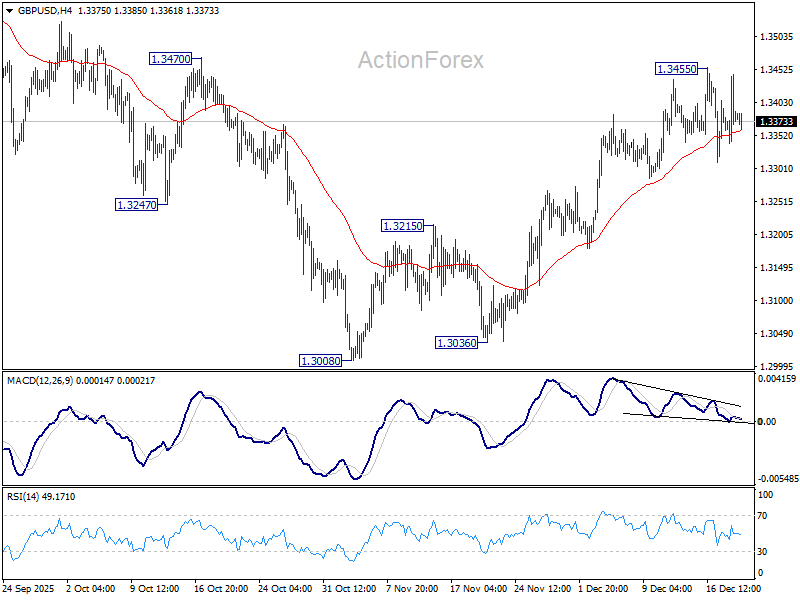
GBP/USD Daily Outlook
Daily Pivots: (S1) 1.3333; (P) 1.3390; (R1) 1.3439; More...
Intraday bias in GBP/USD remains neutral as it's still bounded in range below 1.3455. On the upside, above 1.3455 will resume the rebound from 1.3008. Firm break of 1.3470 resistance will pave the way to retest 1.3787 high. However, sustained break of 55 D EMA (now at 1.3298) will argue that the rebound has completed. Deeper fall would be seen back to 1.3008 support to resume the whole corrective pattern from 1.3787 high.
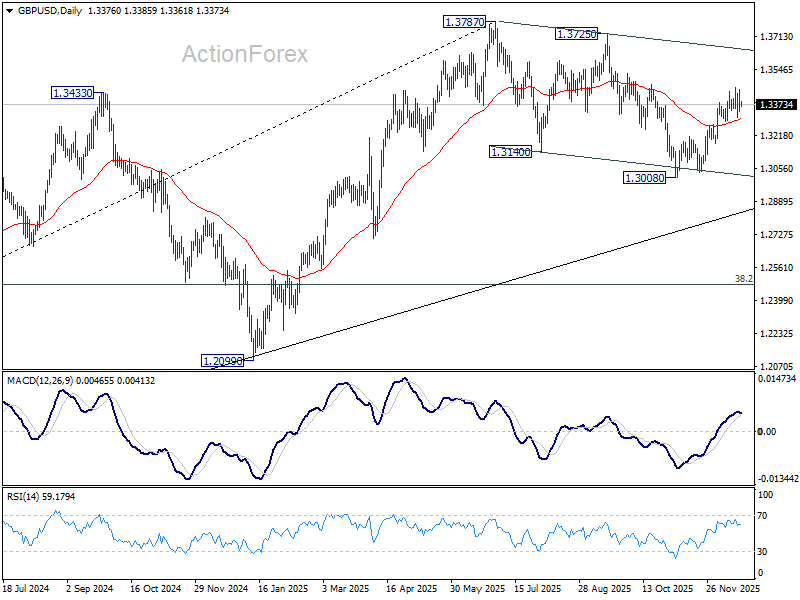
In the bigger picture, current development suggests that fall from 1.3787 is merely a corrective move, and larger rise from 1.0351 (2022 low) is still in progress. Firm break of 1.3787 will target 1.4248 (2021 high) key structural resistance. This will remain the favored case as long as target 38.2% retracement of 1.0351 to 1.3787 at 1.2474 holds, in case of another fall.
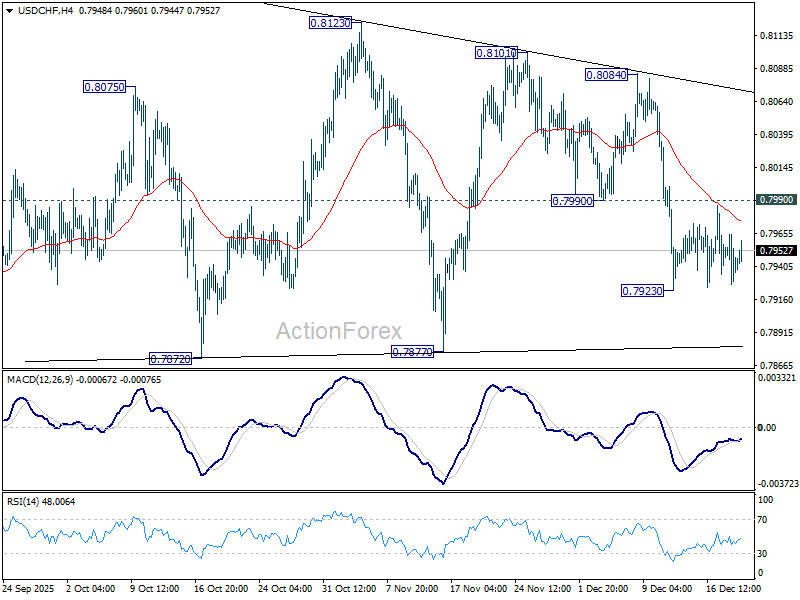
USD/CHF Daily Outlook
Daily Pivots: (S1) 0.7924; (P) 0.7945; (R1) 0.7961; More….
Range trading continues in USD/CHF and intraday bias stays neutral. Overall, corrective pattern from 0.7828 is still extending. On the upside, break of 0.7990 support turned resistance will bring stronger rebound towards 0.8084. On the downside, below 0.7923 will target 0.7877 support.
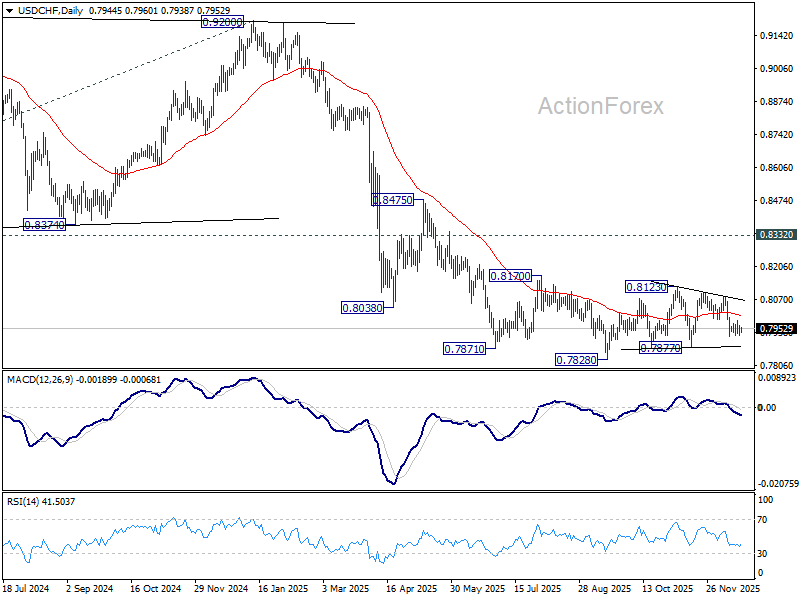
In the bigger picture, outlook will stay bearish as long as 0.8332 support turned resistance holds (2023 low). Long term down trend from 1.0342 (2017 high) is still in progress. Next target is 100% projection of 1.0146 (2022 high) to 0.8332 from 0.9200 at 0.7382.
Bank of Japan Raises Policy Rate, Yen Fails to Profit
Markets
US Treasuries outperformed yesterday on benign November CPI numbers. The partial inflation report showed headline and core inflation slowing down to respectively 2.7% Y/Y and 2.6% Y/Y from 3%. It fits in our view that markets are underestimating the risk of continuation of the Fed’s normalization cycle in Q1 2026. The dollar temporarily lost ground but fought back in the end (close around EUR/USD 1.1725). US equity markets rebounded on the prospect of a more accommodative Fed’s stance with strong Micron earnings also putting aside AI valuation concerns. Decisions by the ECB and the BoE were as expected. The ECB raised its growth forecasts over the 2025-2028 horizon, but president Lagarde refused to give any forward guidance on interest rates sticking to the mantra that policy “is in a good place” instead. Interest rate stability is our base scenario for at least another 6 months. BoE governor Bailey flipped the vote from 5-4 in favour of unchanged in November to 5-4 in favour of a 25 bps rate cut (to 3.75%) yesterday. Three out of those five showed reservations against another rate cut on “auto pilot” early next year. They want more prove of either the disinflation process or a further weakening of the economy/labour market. The “hawkish” cut provided only temporarily relief for sterling with Gilts underperforming.
The Bank of Japan raised its policy rate by 25 bps to 0.75% this morning, the highest level since 1995. The central bank believes that the likelihood of realizing the baseline scenario that underlying CPI inflation will be at a level that is generally consistent with the 2% inflation target in the second half of the projection period (fiscal 2025-2027) has been rising. Looking forward, the BoJ thinks that it highly likely that the mechanism in which both wages and prices rise moderately will be maintained. Moves to pass on wage increases to selling prices continues, keeping underlying CPI on an upward trajectory. Simultaneously, uncertainties around the US economy and the impact of trade policies remain but they have declined. Real interest rates are expected to remain significantly negative and accommodative financial conditions will continue to firmly support economic activity. Therefore, if the outlook presented in October is realized, the BoJ will raise the policy rate further and adjust the degree of monetary accommodation. Japanese bonds underperform this morning because of the slightly hawkish guidance. Money market discount a next move at the July meeting, which would accord to the +- 6 month hiking pace in place since March2024 but interrupted during the trade war. Japanese yields add 2.2 bps (2-yr) to 4.8 bps (10-yr) with the 10-yr yield surpassing the 2% mark and reaching the highest level since 1999. The Japanese yen fails to profit against a slightly stronger overall dollar and in a positive risk environment (USD/JPY 156.35).
News & Views
• The Czech National Bank (CNB) unanimously decided to keep its policy rate unchanged at 3.5% yesterday. Even as inflation has held close to the 2% target over the previous two years, core inflation is assessed to remain elevated in the quarters ahead. This ongoing inflation pressures from the domestic economy currently rule out a further decrease in interest rates. The CNB still thinks that a relatively tight monetary policy compared to the past is needed as elevated credit growth is fostering a rise in the quantity of money in the economy. The labour market remains tight and wages are rising at an elevated pace. Household consumption is also increasing. Elevated services inflation and property price growth are having an inflationary effect. Despite this assessment, the CNB now sees the risks and the uncertainties for the fulfilment of the inflation target as “balanced overall”. In November this risk balance was labeled as “inflationary overall”. At the press conference, governor Michl saw an equal chance for a rate cut or a hike as the next step. He also indicated that policy won’t react to one-off changes in power prices which might push headline inflation below the 2% target next year. The Czech 2-y swap yield declined further to 3.66%.
The EU this morning reached an agreement for a loan of €90bn to Ukraine. The funding of the loan will come from joint debt issuance backed by the EU budget. In this respect, the EU moved away from the plan to use frozen Russian assets. According to EU leaders, Russian assets remain blocked. If Moscow later pays reparation loans to Ukraine, then Ukraine can use these funds to pay back the EU loan. The agreement also includes that the use of the EU budget won’t impact the financial obligations of Hungary, the Czech Republic and Slovakia, who were skeptical to provide financial support to Ukraine.
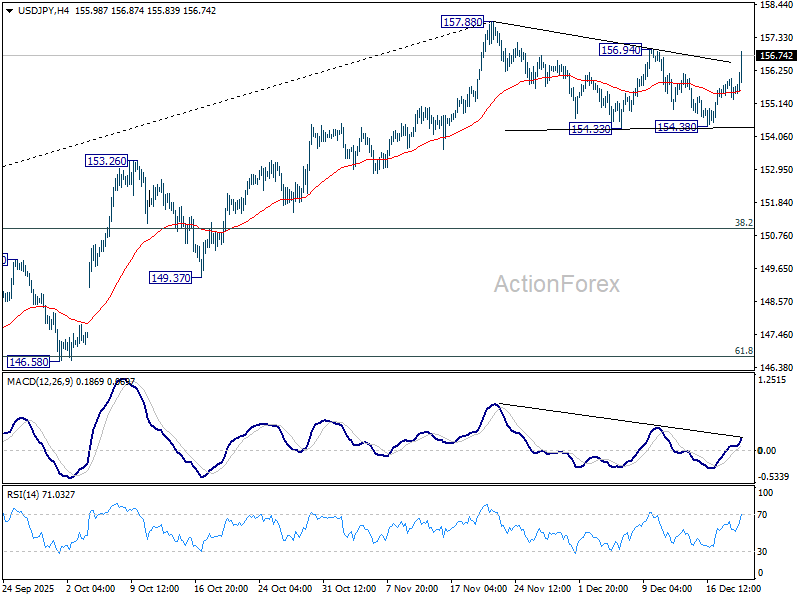
USD/JPY Daily Outlook
Daily Pivots: (S1) 155.23; (P) 155.61; (R1) 155.93; More...
Immediate focus in USD/JPY is now on 156.94 resistance with today's strong rise. Firm break there will argue that larger rally from 139.87 is resuming through 157.88 to 158.85 key structural resistance. Decisive break there will be a strong medium term bullish signal. Risk will now stay on the upside as long as 154.38 support holds, in case of retreat.
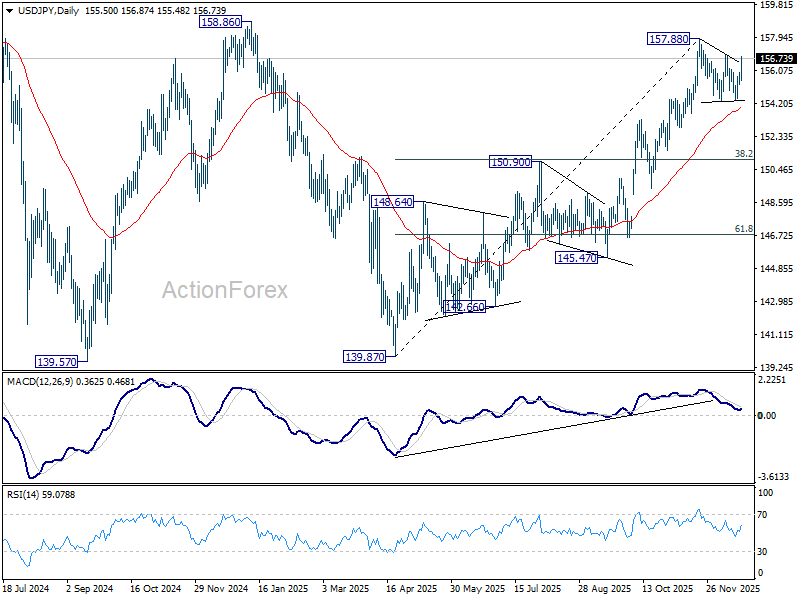
In the bigger picture, corrective pattern from 161.94 (2024 high) could have completed with three waves at 139.87. Larger up trend from 102.58 (2021 low) could be ready to resume through 161.94 high. Decisive break of 158.85 structural resistance will solidify this bullish case and target 161.94 for confirmation. On the downside, break of 150.90 resistance turned support will dampen this bullish view and extend the corrective range pattern with another falling leg.
Yen Slides After BoJ Hike as Markets Sell the News, Dollar Rebounds on CPI Doubts
Yen weakened broadly today despite the BoJ delivering a widely expected 25bps rate hike. The move pushed 10-year JGB yields above the psychologically important 2% level for the first time since 1999, but higher yields failed to translate into currency support.
Part of the reaction reflects a classic sell-on-news dynamic. With the long-anticipated BoJ decision out of the way, markets reverted to the prevailing trend rather than extending positioning on the headline outcome. More importantly, the BoJ offered little clarity on where policy rates are ultimately heading. While the tightening bias was retained, there was no guidance on the destination, leaving investors without a clear anchor for longer-term Yen valuation.
Governor Kazuo Ueda openly acknowledged that estimates of Japan’s neutral rate span a wide range, with no consensus on where it lies. That uncertainty argues for caution, particularly as any further rate increase would push policy closer to neutral, if not into it. As a result, markets are increasingly skeptical that the BoJ will move again any time soon. Without a credible path toward materially higher rates
Elsewhere, Dollar is recovering from its post-CPI selloff. While November inflation data showed a sharp cooling, skepticism has grown around the quality of the report due to gaps caused by the government shutdown. Some economists have labeled the release a “Swiss cheese” CPI report, highlighting missing components as the lots of holes. Most notably, shelter costs—roughly a third of the CPI basket—were absent, significantly distorting the inflation signal. Missing data were effectively treated as showing no price growth, raising concerns about statistical reliability.
That has tempered enthusiasm for aggressive Fed repricing, even as inflation appears to be easing. For now, the Fed is still expected to hold rates in January, with March cut odds hovering around 55%. With three more months of jobs and inflation data still to come, it remains premature to draw firm conclusions.
In FX markets this week so far, Swiss Franc leads, followed by Dollar and Sterling, while Kiwi lags despite strong domestic data today, followed by Aussie and Yen. Euro and Loonie sit in the middle.
In Asia, Nikkei rose 1.03%. Hong Kong HSI rose 0.69%. China Shanghai SSE rose 0.36%. Singapore Strait Times is up 0.10%. Japan 10-year JGB yield rose 0.056 to 2.022. Overnight, DOW rose 0.14%. S&P 500 rose 0.79%. NASDAQ rose 1.38%. 10-year yield fell -0.035 to 4.116.
BoJ raises rates to 0.75%, keeps tightening bias intact
The BoJ raised its policy rate by 25bps to 0.75%, as widely expected, marking another step in its gradual normalization process. Despite the hike, the BoJ emphasized that financial conditions remain highly accommodative, with real interest rates still “significantly negative.”
In its statement, the BoJ reaffirmed a tightening bias. If the outlook laid out in the October 2025 Outlook Report is realized, the Bank said it will "continue to raise the policy interest rate". Policymakers also expressed increased confidence that the likelihood of realizing the outlook "has been rising".
At the post-meeting press conference, Governor Kazuo Ueda stressed future adjustments will depend on incoming data on economic, price, and financial conditions, with policy decisions reassessed at every meeting rather than following a preset path.
On the neutral rate, Ueda acknowledged substantial uncertainty. He described the estimate as sitting within a wide range and said they would assess how the economy and prices respond to each rate move. "We will seek to produce new estimates on Japan's neutral rate, if needed, though I don't think that will help us narrow the range that much," he added.
NZ trade deficit narrows to ND -163m on 9.2% yoy exports surge
New Zealand’s trade balance surprised to the upside in November, with the deficit narrowing sharply to NZD -163m, far smaller than expectations for a shortfall of around NZD -1.2B. The improvement was driven by a solid pickup in exports, which rose 9.2% yoy, or NZD 588m, to NZD 7.0B.
Export performance was mixed by destination. Shipments to Australia surged by 31% yoy, while exports to the EU also rose strongly by 51% yoy. By contrast, exports to China slipped modestly by -0.7%yoy, while shipments to the US fell sharply by -17% yoy, and Japan by -1.9% yoy.
Imports rose at a more moderate pace of 4.4% yoy to NZD 7.2B. Gains were led by stronger inflows from the US (36% yoy), EU (17% yoy) and South Korea (20% yoy). Imports from China rose a modest 1.7% yoy. Imports from Australia declined (-7.7% yoy).
NZ ANZ business confidence hits 30-year high as cyclical recovery gathers pace
New Zealand business confidence surged in December, with the ANZ headline index jumping from 67.1 to 73.6. Firms’ own activity outlook rose sharply from 53.1 to 60.9. Both readings are the strongest in 30 years, pointing to a broad-based improvement in sentiment as the economic cycle turns.
Inflation indicators ticked up modestly but remain contained. The share of firms expecting to raise prices in the next three months rose one point to 52%, while those anticipating cost increases climbed two points to 76%. Inflation expectations, however, were unchanged at 2.69%, suggesting confidence is improving without triggering a renewed inflation scare.
ANZ said “things are clearly looking up,” noting that the earlier slowdown was deliberately engineered by tight monetary policy. With that restraint easing, interest rates and the exchange rate both well below their peaks, and the RBNZ signaling no intention to hike rates any time soon, cyclical forces appear firmly supportive of recovery.
USD/JPY Daily Outlook
Daily Pivots: (S1) 155.23; (P) 155.61; (R1) 155.93; More...
Immediate focus in USD/JPY is now on 156.94 resistance with today's strong rise. Firm break there will argue that larger rally from 139.87 is resuming through 157.88 to 158.85 key structural resistance. Decisive break there will be a strong medium term bullish signal. Risk will now stay on the upside as long as 154.38 support holds, in case of retreat.
In the bigger picture, corrective pattern from 161.94 (2024 high) could have completed with three waves at 139.87. Larger up trend from 102.58 (2021 low) could be ready to resume through 161.94 high. Decisive break of 158.85 structural resistance will solidify this bullish case and target 161.94 for confirmation. On the downside, break of 150.90 resistance turned support will dampen this bullish view and extend the corrective range pattern with another falling leg.