
Sample Category Title
Taking the Temperature on Consumer Sentiment
In focus today
Following the large batch of Central Bank meetings yesterday, attention turns to taking the temperature of consumer well-being through data releases on consumer confidence and retail sales. Both figures are released in the morning for Denmark, Sweden and Germany, while consumer confidence figures are out later in the day for the euro area and the US.
In Sweden, the Economic Tendency Survey (ETS) is released. The main indicator for economic sentiment increased for a fifth consecutive month in November to a level above 100. We expect another print above the 100-level, re-affirming the positive sentiment. Our optimistic growth outlook for 2026 is contingent on a continued improvement in consumer sentiment.
In Norway, we expect the seasonally adjusted unemployment rate to remain unchanged at 2.2% in December, but with the number of unemployed persons rising marginally. Keep an eye on new vacancies as well, as demand for labour still looks strong.
The Finnish State Treasury will publish their funding outlook for 2026. We expect that they will issue some EUR 21-22bn in RFGBs and EUR 2-3bn in their EMTN program. Hence, a total of EUR 23-24bn in long-term debt. However, given yesterday's upward revision of the budget deficit due to additional defence expenditure that was supposed to be due in 2025 and has been pushed to 2026, then there is upward risk to our forecast.
It is crunch time for the French 2026 budget. The parliament is set to vote on the aggregate finance bill (PLF) and it appears difficult to make a sufficient compromise that could be approved. However, many parties would rather move on from the troubling finance bill instead of 'kicking the can' to the beginning of 2026. France's revised fiscal plans for 2026 now anticipate a budget deficit of 5.3% of GDP, notably higher than the initially proposed 4.7% of GDP deficit. Without a budget agreement this week, France will not face a US style government shutdown and can extend the 2025 budget into 2026, while negotiations continue in January like we saw last year. Regardless of the outcome, we expect a limited market reaction except for the case where a new parliamentary election is called, which at the current momentum seems unlikely.
The Danske Morning Mail will be on break until 2 January 2026. We wish you a merry Christmas and a happy New Year.
Economic and market news
What happened overnight
In the Ukraine war, the EU has agreed to lend Ukraine EUR 90bn. The funds will be raised through a loan in capital markets, secured against the EUs shared budget. Ukraine will only have to pay back the loan after Russia has paid reparations. The proposal to use frozen Russian assets did not immediately succeed, but it was suggested that they could be used to repay the loan if no reparations to Ukraine are paid. Hence, there may an increase in the funding for EU, which just recently published their funding outlook for 2026, where the increase their maximum of borrowing from EUR 200bn from EUR 170bn in 2025.
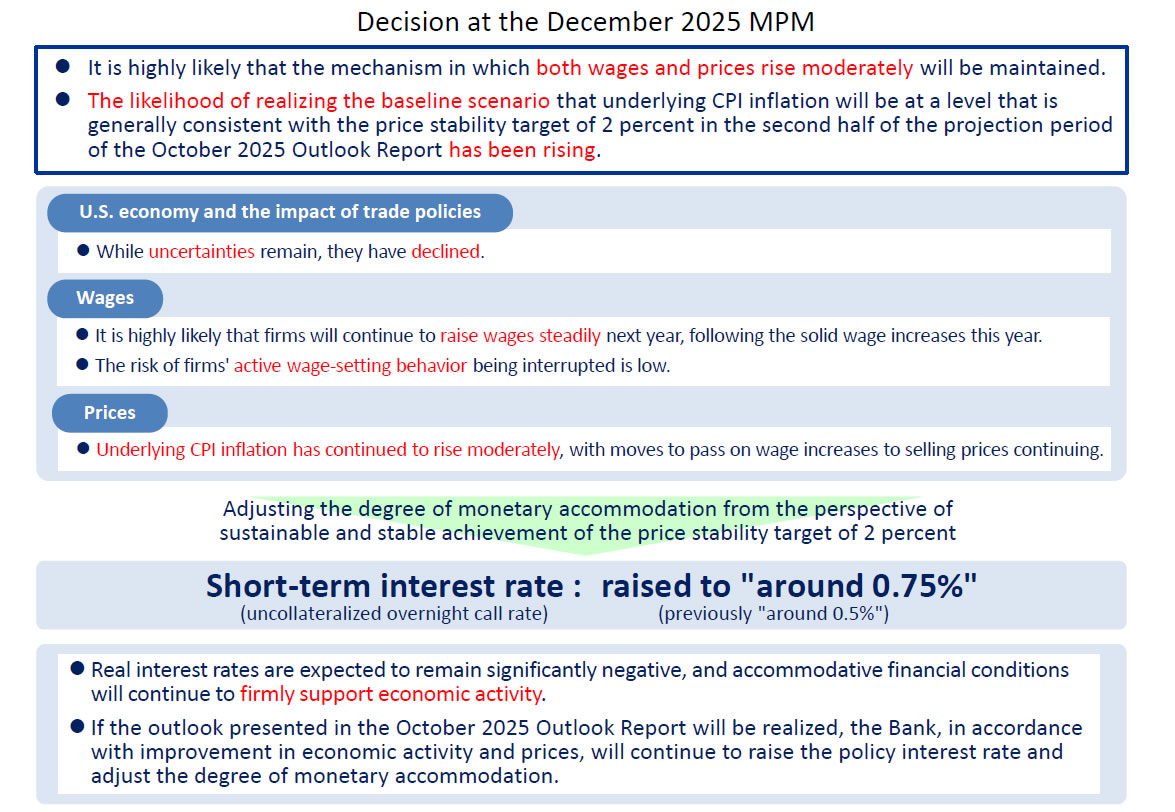
In Japan, the Bank of Japan (BoJ) hiked its policy rate by 0.25bp to 0.75%, the highest level since 1995. In its statement, the BoJ recognises the diminishing risk from US trade policies and highlights its confidence that wages will continue to increase and add further to price pressures. The central bank also states that it still views the policy stance as significantly accommodative and it will continue to raise rates if the October outlook is confirmed. The market reaction has been muted so far. We will listen in later this morning, when Governor Ueda elaborates. The November CPI increased by 2.9% y/y, slightly down from 3.0% in October but within expectations. The core measure (excl. fresh food) stayed at 3.0% y/y.
What happened yesterday
In the euro area, the ECB also kept its policy rates unchanged, leaving the deposit facility rate at 2.0% as expected. The staff projections were revised up for GDP growth across the board and inflation in 2026. The revisions were a larger than expected surprise, however at the press conference, ECB President Lagarde calmed speculations about future interest rate hikes though her "meeting by meeting" approach. We maintain our call that the ECB will leave the deposit rate unchanged at 2.00% throughout both 2026 and 2027. For more details, see our ECB Review - In an even better place, 18 December.
The German Debt Office (Finanzagentur) published their funding outlook for 2026. They plan to issue a record amount of bonds and bills - EUR 512bn (including Green bonds). This is funded through EUR 318bn in German government bonds sold at auctions, EUR 16-19bn in Green bonds, which include a new 15Y Green bond (issued through syndication) and finally, Bubills of EUR 176bn.
In the US, the delayed November CPI release surprised to the downside by quite a margin. Headline inflation slowed to 2.7% y/y (cons: 3.1%) from 3.0% in Sep. and core inflation to 2.6% y/y (cons: 3.0%) also from 3.0% in Sep. The market reaction ended up being relatively muted, which could be caused by changes in shelter prices, the government shutdown and Black Friday. If this was the case, inflation should rebound in December. For the details of our assessment, see our latest overview of global inflation developments, the Global Inflation Watch - Diverging inflation trends, 18 December.
In Sweden, the Riksbank stayed on hold as expected, keeping the policy rate at 1.75%. The policy rate path was revised marginally and by less than we had expected. In the press conference, Riksbank Governor Thedéen said he expected the Riksbank to be forward looking next year, smoothing over spot deviations caused by e.g. the upcoming VAT reduction.
In Norway, Norges Bank left the deposit rate unchanged at 4.00% as widely expected. The central bank signalled that it would keep the door open for interest rate cuts if the economy evolves broadly as projected in the year ahead. The rate path in the new monetary policy report was adjusted downwards but less than we had expected and indicates no probability for a rate cut in March and roughly 1-2 cuts in 2026 as whole.
In the UK, the Bank of England cut the Bank Rate to 3.75% from 4.00% as expected. The Monetary Policy Committee vote split was also in line with expectations, as 5 members voted for reducing the Bank Rate to 3.75% and 4 members voted to maintain the Bank Rate at 4.00%. Judging the guidance, we think the Bank Rate is likely to continue on a gradual downward path. But further policy easing will become a closer call. Bank of England review - Split committee cuts Bank Rate, 18 December.
Equities: Global equities had a strong session yesterday, rising 0.7%, with cyclical sectors clearly outperforming defensives. Consumer discretionary and communication services topped the performance table, while defensive sectors underperformed. In the US, the S&P 500 closed 0.8% higher, the Nasdaq gained 1.4%, Russell 2000 advanced 0.6%, and the Stoxx 600 rose 1.0%. Overnight, Asian equity markets are trading in the green across the board, supporting a constructive risk tone to end the week.
FI and FX: It was a fairly volatile day in the European fixed income market given a somewhat hawkish ECB as well as a record amount of issuance from Germany in 2026. However, lower than expected US inflation data send bond yields lower and we ended the day a few bp lower in 10Y Germany and 3bp lower in 10Y Treasuries. Furthermore, the BTPS-Bund spread tightened and there was a general spread compression between core-EU and the semi-core/periphery. This is the last edition of the FI and FX Daily brief. We will return on 5 January 2026.
BoJ raises rates to 0.75%, keeps tightening bias intact
The BoJ raised its policy rate by 25bps to 0.75%, as widely expected, marking another step in its gradual normalization process. Despite the hike, the BoJ emphasized that financial conditions remain highly accommodative, with real interest rates still “significantly negative.”
In its statement, the BoJ reaffirmed a tightening bias. If the outlook laid out in the October 2025 Outlook Report is realized, the Bank said it will "continue to raise the policy interest rate". Policymakers also expressed increased confidence that the likelihood of realizing the outlook "has been rising".
At the post-meeting press conference, Governor Kazuo Ueda stressed future adjustments will depend on incoming data on economic, price, and financial conditions, with policy decisions reassessed at every meeting rather than following a preset path.
On the neutral rate, Ueda acknowledged substantial uncertainty. He described the estimate as sitting within a wide range and said they would assess how the economy and prices respond to each rate move. "We will seek to produce new estimates on Japan's neutral rate, if needed, though I don't think that will help us narrow the range that much," he added.
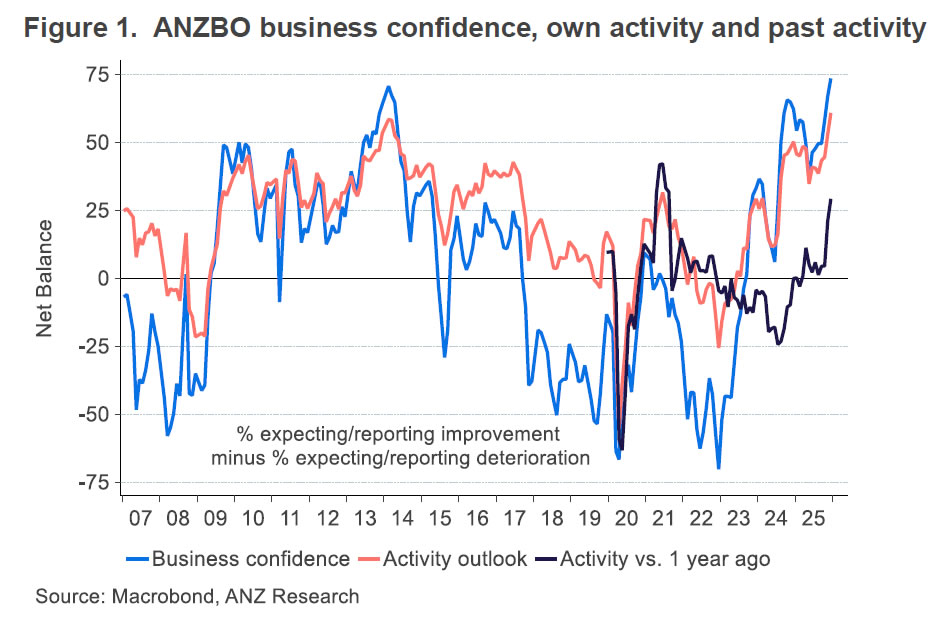
NZ ANZ business confidence hits 30-year high as cyclical recovery gathers pace
New Zealand business confidence surged in December, with the ANZ headline index jumping from 67.1 to 73.6. Firms’ own activity outlook rose sharply from 53.1 to 60.9. Both readings are the strongest in 30 years, pointing to a broad-based improvement in sentiment as the economic cycle turns.
Inflation indicators ticked up modestly but remain contained. The share of firms expecting to raise prices in the next three months rose one point to 52%, while those anticipating cost increases climbed two points to 76%. Inflation expectations, however, were unchanged at 2.69%, suggesting confidence is improving without triggering a renewed inflation scare.
ANZ said “things are clearly looking up,” noting that the earlier slowdown was deliberately engineered by tight monetary policy. With that restraint easing, interest rates and the exchange rate both well below their peaks, and the RBNZ signaling no intention to hike rates any time soon, cyclical forces appear firmly supportive of recovery.
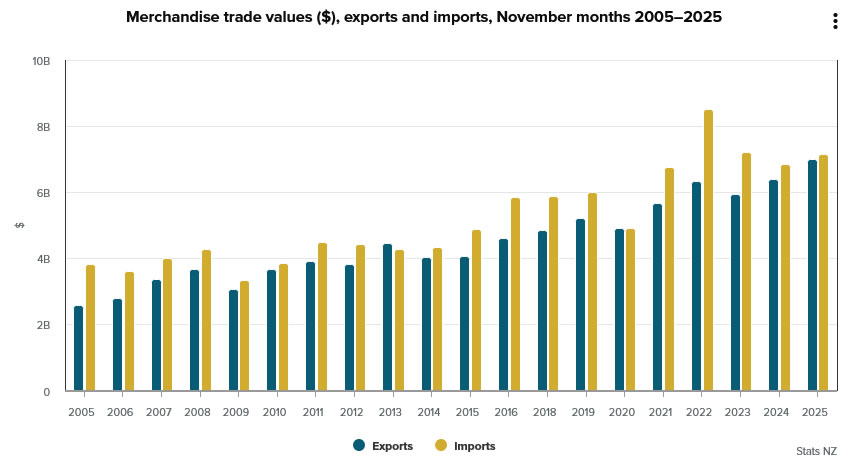
NZ trade deficit narrows to ND -163m on 9.2% yoy exports surge
New Zealand’s trade balance surprised to the upside in November, with the deficit narrowing sharply to NZD -163m, far smaller than expectations for a shortfall of around NZD -1.2B. The improvement was driven by a solid pickup in exports, which rose 9.2% yoy, or NZD 588m, to NZD 7.0B.
Export performance was mixed by destination. Shipments to Australia surged by 31% yoy, while exports to the EU also rose strongly by 51% yoy. By contrast, exports to China slipped modestly by -0.7%yoy, while shipments to the US fell sharply by -17% yoy, and Japan by -1.9% yoy.
Imports rose at a more moderate pace of 4.4% yoy to NZD 7.2B. Gains were led by stronger inflows from the US (36% yoy), EU (17% yoy) and South Korea (20% yoy). Imports from China rose a modest 1.7% yoy. Imports from Australia declined (-7.7% yoy).
Cliff Notes: Into 2026, a Broad Array of Risks Remains
Key insights from the week that was.
Australia’s key release for the week was the Westpac-MI Consumer Sentiment Index which, after November’s ‘net positive’ read, fell 9% to 94.5 in December – a ‘cautiously pessimistic’ level. Responses to questions on news recall suggest consumers were shaken by recent inflation results, the tone of related coverage now viewed as decisively negative versus somewhat mixed three months ago. This has sparked one of the sharpest turnarounds in consumers’ mortgage rate expectations on record, 86% of those with a view now anticipate mortgage rates to be the same or higher in a year’s time.
This has fed into renewed concerns over the economy, the one-year and five-year ahead sub-indexes falling 9.7% and 11.7% respectively. Buyer sentiment also looks to have been crimped, the ‘time to buy a major household item’ sub-index shedding 11.4% to be well below average. Official data is pointing to a genuine consumer upswing, driven by a recovery in real household disposable incomes; however, higher inflation, interest rates and bracket creep threaten the outturn. As a result, the year-ahead outlook for family finances fell 6.1% to be modestly below average.
The RBA has also taken signal from the recent lift in inflation, with only some of the pressures deemed temporary. As detailed by Chief Economist Luci Ellis earlier this week, Westpac continues to believe inflation will moderate through 2026, but the Monetary Policy Board’s more hawkish assessment has pushed back the timing of further policy easing into 2027. There are risks to both sides of our view for policy to remain on hold in 2026 and two cuts in H1 2027. If inflation continues surprising meaningfully to the upside in the near term, a rate hike could become a possibility. But, if the labour market weakens more than expected, the cuts now forecast for 2027 may need to be brought forward.
Fiscal policy developments are also worth monitoring vis a vis inflation and growth. The Federal Government’s MYEFO revealed an $8.7bn improvement in the budget’s bottom line over the forward estimates due to a tax windfall associated with higher commodity prices and a firmer-than-expected economic upswing. If the government elects to save the bulk of the windfall, it would ease near-term inflationary pressures – at the margin.
Before moving offshore, a final note on the local manufacturing sector. The latest Westpac-ACCI Survey of Industrial Trends revealed that the long-awaited improvement in conditions is finally starting to materialise, the Actual Composite bouncing from a broadly neutral read to a solid 55.1 in Q4. The Expected Composite meanwhile continued to lift to fresh cycle highs. Some of the hallmark challenges facing the sector, such as elevated costs, skilled labour shortages and material constraints, has restricted the ability for some manufacturers to respond to firmer demand. Solid investment intentions and plans for hiring, if realised, should go some way to alleviating capacity constraints.
Over in the UK, the Bank of England cut rates by 25bps to 3.75% in a narrow 5-4 vote. Those voting for a cut emphasised the downside risks to growth; those for a pause that inflation, which came in at 3.2%yr earlier in the week, could show greater persistence. On the outlook, Governor Bailey noted that “judgements around further policy easing will become a closer call” suggesting that the BoE is nearing the end of its easing cycle. With GDP growth expected to be only slightly above 1% in 2026 and inflation trending down, we maintain a view of further gradual BoE easing in H1 2026, by 25bp per quarter. However, the committee may proceed more cautiously, delaying cuts to the second half of next year.
Across the English Channel, the European Central Bank kept rates steady at 2.0% with President Lagarde noting once again that "policy is in a good place". Inflation was revised up for 2026 due to a slower descent in services inflation (core inflation now 2.2%yr), but it is still expected to stabilise at target in 2027/2028 (1.9% and 2.0%). The economic growth projections have also been revised up to 1.4% in 2025, 1.2% in 2026 and 1.4% in 2027, where growth is expected to remain in 2028. The statement made clear the "Governing Council is not pre-committing to a particular rate path", highlighting that policy will be fine-tuned depending on how the risks evolve.
In the US, November's inflation read surprised to the downside, the core measure rising 2.6%yr while headline prices rose 2.7%yr, both down from 3.0%yr in September. However, with the government shutdown precluding an October report and essentially no month-to-month detail provided for November, the FOMC is unlikely to take signal from this inflation read. Earlier in the week, non-farm payrolls rose 64k in November after a 105k decline in October, both released at the same time. Average job gains over the last 3 months are circa 20k, towards the bottom of the range estimated to be consistent with balance between labour demand and supply. It is unsurprising then that the unemployment rate edged up 0.2ppts between September and November to 4.6%.
In Asia meanwhile, Chinese partial data came in softer than expected in November. Retail trade was up just 4%ytd, weighed down by persistent weakness in consumer prices, but more significantly weak sentiment and declining wealth. Equities are now trending higher, but house prices continue to decline. Industrial production grew 6%ytd, however, highlighting that the capacity investment of recent years is earning a return. Fixed asset investment fell 2.6%ytd though, as high-tech manufacturing retraced some of its rapid gains of prior years, and property construction continued to contract. Clearly, pro-active stimulus in scale is necessary to put a floor under activity and, in time, see sentiment move back up.
Further east, the Q4 Tankan survey showed conditions improved by two points to 17pts, supporting views for a rate hike later today by the Bank of Japan. The output prices measure remained broadly steady, with one-year, three-year and five-year ahead projections all consistent with at-target inflation. Investment plans remain high, albeit with a slight downgrade from last quarter's expectations. Software investment is anticipated to increase 12.2%, while R&D investment is expected to rise 4.6%. All this is consistent with reports of firms investing to reduce their demand for labour and in pursuit of productivity. Employment conditions remained consistent with a tight labour market; firms expect to hire more new graduates in the following financial year. Overall, the survey points to a tight labour and historically elevated inflation expectations, which should aid workers case for higher wages in FY26 (ending in March 2027).
USD/JPY Turns Heavy—Is the Downtrend Reloading?
Key Highlights
- USD/JPY is struggling to continue higher above 156.00.
- A key bearish trend line is forming with resistance at 156.35 on the 4-hour chart.
- Bitcoin remained in a range above the $85,000 support.
- Gold could continue to rise if it settles above $4,365.
USD/JPY Technical Analysis
The US Dollar formed a base near 154.35 and corrected some losses against the Japanese Yen. USD/JPY climbed above 155.00 before the bears appeared.
Looking at the 4-hour chart, the pair surpassed the 200 simple moving average (green, 4-hour) and tested the 100 simple moving average (red, 4-hour) and. The bears remained active near the 61.8% Fib retracement level of the downward move from the 156.95 swing high to the 154.39 low.
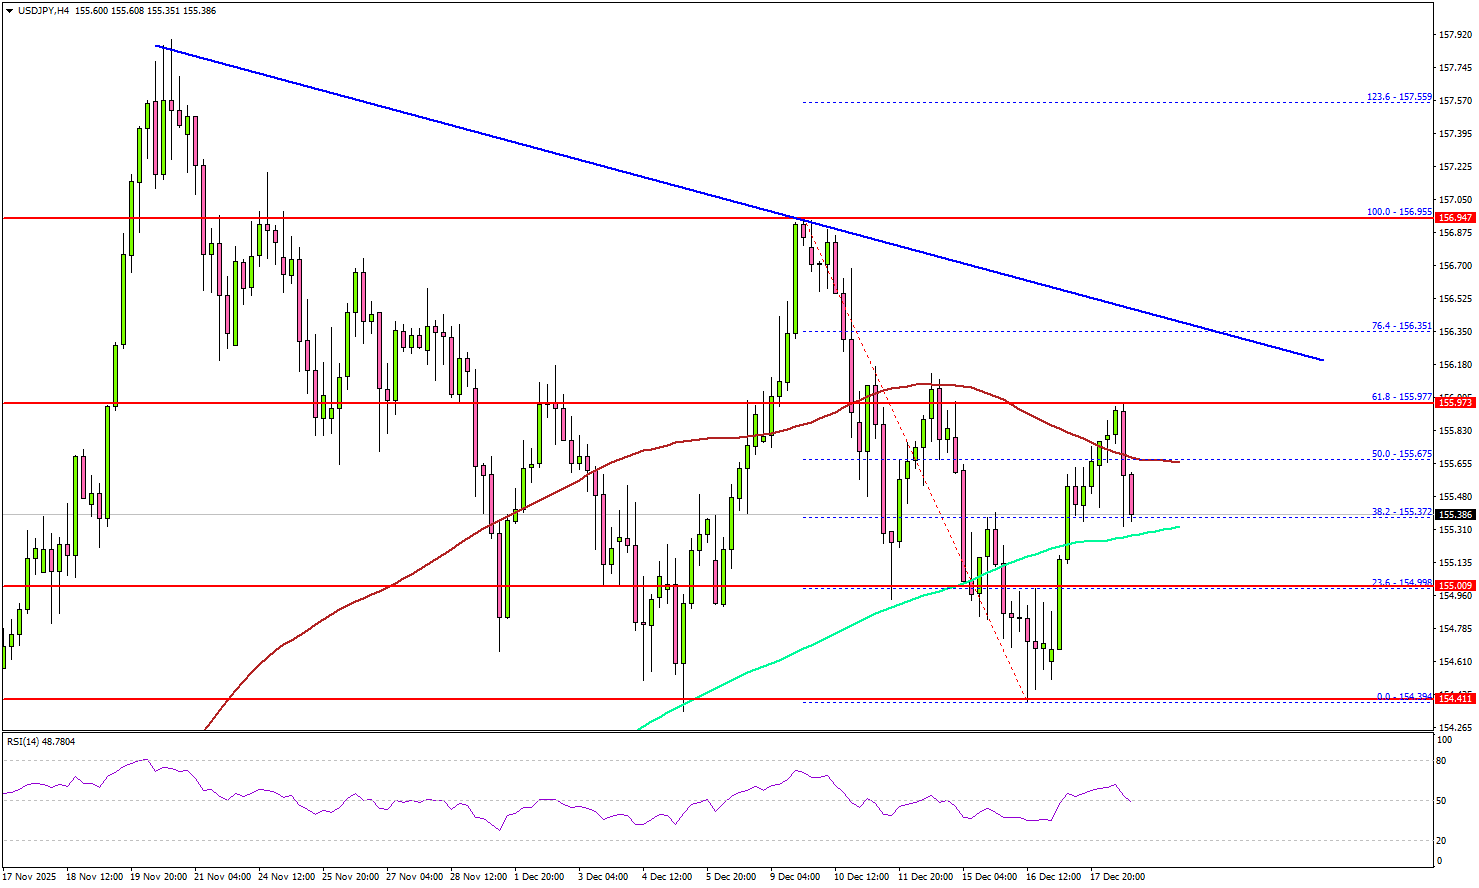
Immediate resistance sits near 156.00. The first key hurdle is seen near 156.30. There is also a key bearish trend line forming with resistance at 156.35.
A close above 156.35 could open the doors for a move toward 157.00. Any more gains could set the pace for a steady increase toward 158.00.
On the downside, there is key support at 155.00. The first major support is 154.50. The next support could be 154.30, below which the bears might aim for a move toward 153.50.
Looking at Gold, the bulls remain in action and might soon aim for a move above the $4,380 level in the near term.
Upcoming Key Economic Events:
- US Existing Home Sales for Nov 2025 (MoM) - Forecast +0.1%, versus +1.1% previous.
- Michigan Consumer Sentiment Index for Oct 2025 (Prelim) – Forecast 54.2, versus 55.1 previous.
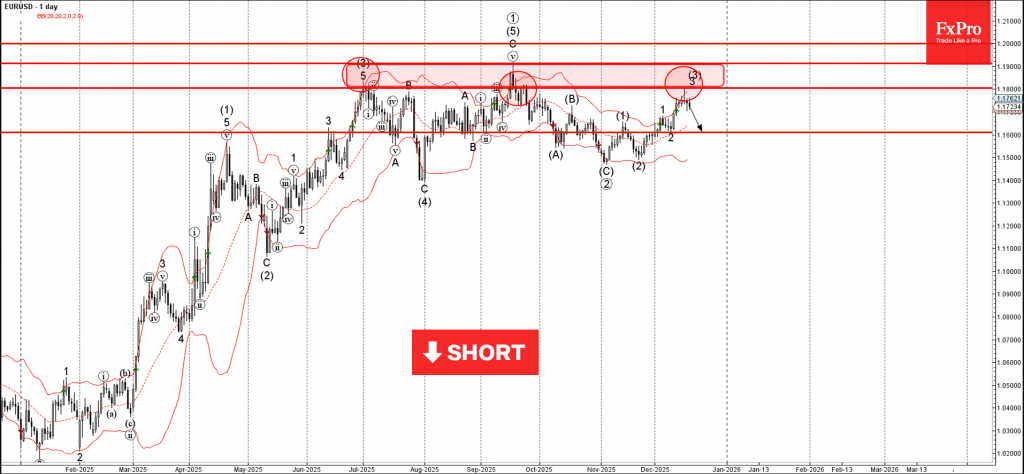
EURUSD Wave Analysis
EURUSD: ⬇️ Sell
- EURUSD reversed from resistance area
- Likely to fall to support level 1.1600
EURUSD currency pair recently reversed from the resistance area between the resistance levels 1.1800 and 1.1910 (former multi-month high from September) – intersecting with the upper daily Bollinger Band.
The downward reversal from this from the resistance area created the daily Japanese candlesticks reversal pattern Shooting Star.
Given the strength of the nearby resistance area, EURUSD currency pair can be expected to fall to the next round support level 1.1600 (low of the previous wave 2).
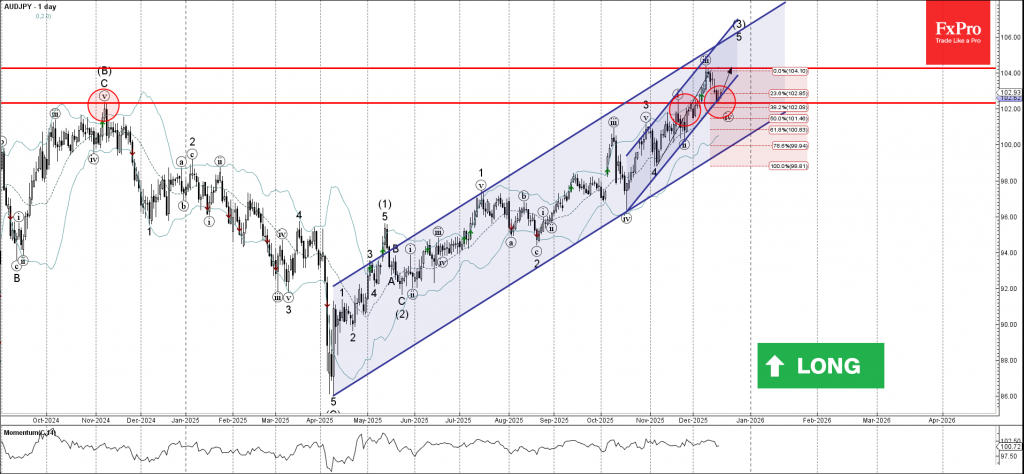
AUDJPY Wave Analysis
AUDJPY: ⬆️ Buy
- AUDJPY reversed from support area
- Likely to rise to resistance level 104.25
AUDJPY currency pair recently reversed up from the support area between the support level 102.30 (former monthly high from November) and the support trendline of the daily up channel from October.
The support level 102.30 was further strengthened by the 38.2% Fibonacci correction of the sharp upward impulse from November.
Given the strong daily uptrend and continuation of the bearish yen sentiment, AUDJPY currency pair can be expected to rise to the next resistance level 104.25 (top of the previous impulse wave iii).
ECB Review: In an Even Better Place
- ECB decided to leave its key policy rates unchanged with the deposit facility rate at 2.00% as widely expected by markets and consensus.
- The new staff projections delivered a hawkish surprise for markets with upward revisions to growth over the entire horizon and to inflation in 2026. However, the moves faded during the press conference as Lagarde’s “meeting by meeting” approach and lack of guidance did not reaffirm Schnabel’s hawkish views.
- We maintain our call that the ECB will leave the deposit rate unchanged at 2.00% throughout both 2026 and 2027.
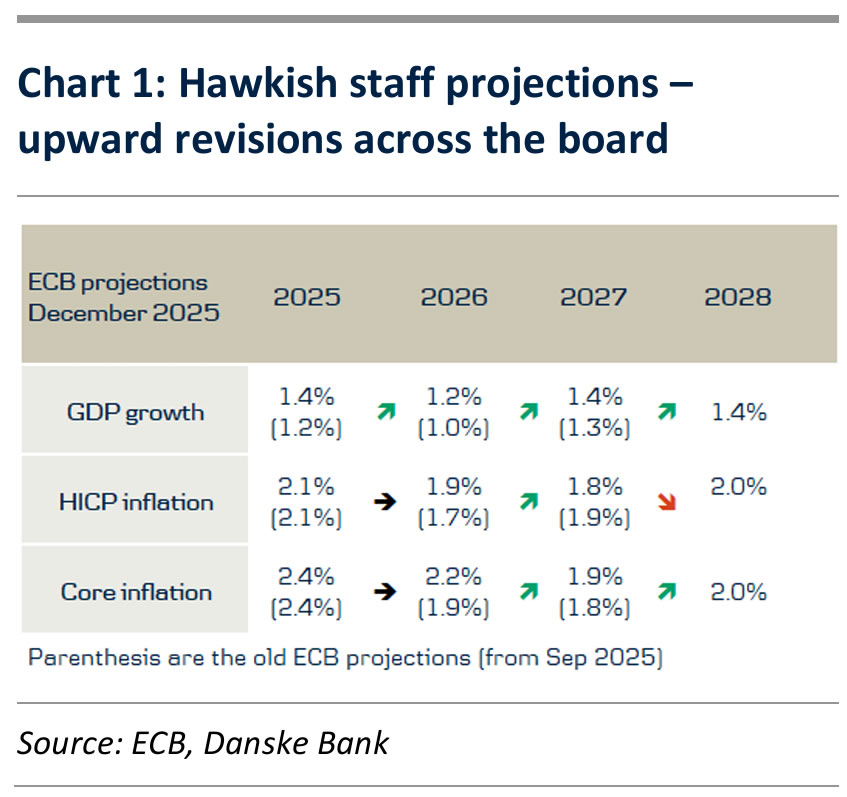
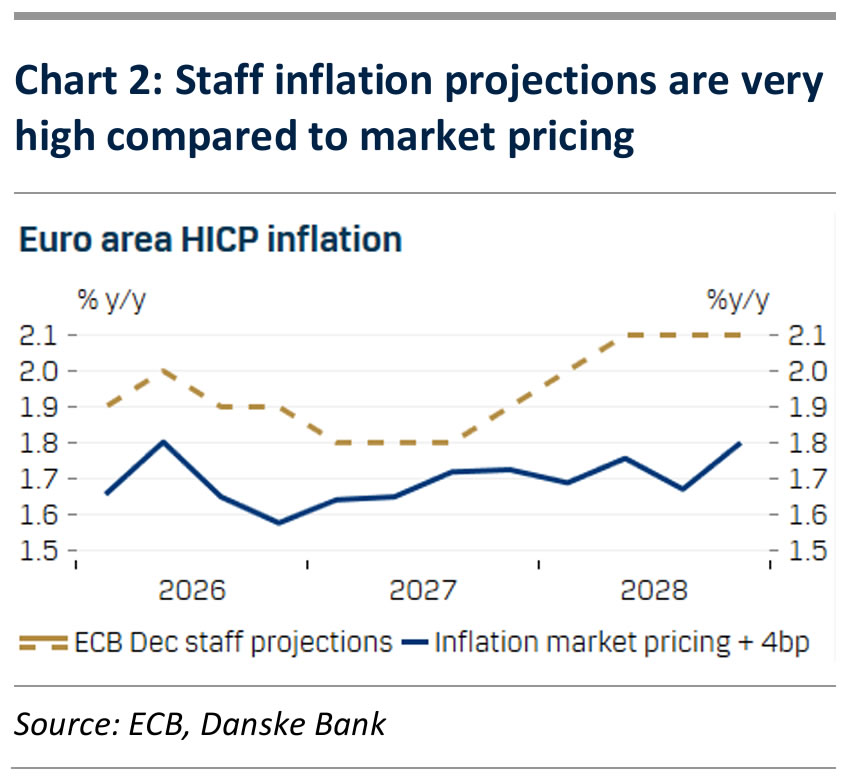
As widely expected, the ECB decided to keep its policy rates unchanged at today’s meeting, leaving the deposit rate at 2.00%. The new staff projections delivered a hawkish surprise for markets with upward revisions to growth over the entire horizon and to inflation in 2026 (see chart 1). The GDP forecast for 2026 was revised up to 1.2% y/y (from 1.0%) and to 1.4% y/y in 2027 (from: 1.3%). Headline inflation was revised up to 2.2% y/y (from: 1.9%) in 2026 and core inflation to 2.2% y/y (from: 1.9%). Markets reacted by sending front-end rates higher and EUR/USD rose on the hawkish staff projections. We note that the inflation projections are on the high side compared to our own, market pricing, and consensus expectations (see chart 2). Hence, we think there is a good chance that the ECB would end up disappointed on inflation in 2026, which should reduce expectations for hikes. While we think the forecasts are optimistic, the staff projections do nevertheless cement the view in the ECBs that they are in a good place with no need for imminent rate cuts.
During the press conference Lagarde was asked whether it was more likely that the next move would be a hike relative to a cut, referencing Schnabel’s recent interview. Lagarde did not answer the question directly and instead said that the consensus in the ECB was that all options remained open and that they stick to a meeting-by-meeting approach. In our view, this highlights that the consensus in the Governing Council is clearly less hawkish compared to Schnabel especially due to diverging views on the inflation outlook. At the same time, Lagarde also said that she would not give forward guidance by commenting on market pricing given that uncertainty is still very high. The fact that she is referring to high uncertainty implies that staff projections play a smaller role in deciding current policy changes like we saw in September. Lagarde’s descriptive comments on the economy and decision not to agree with Schnabel’s view led to a fading of the initial rise in rates following the hawkish staff projections. Hence rates ended the meeting flat and EUR/USD little changed as we expected.
We maintain our call that the ECB will leave the deposit rate unchanged at 2.00% throughout both 2026 and 2027. Higher than expected activity and wage growth has reduced the need for cuts in 2026 while our expectations of a clear undershooting of inflation the comings years should keep the ECB from hiking in 2027. We have liked our paying bias the past months also supported by recent data. While we cannot exclude that rates can continue to move slightly higher in the very near-term, we are increasingly attentive to the risk-reward skew on a 1–3-month basis to start to favour receivers.