
Sample Category Title
EUR/USD Daily Outlook
Daily Pivots: (S1) 1.1710; (P) 1.1734; (R1) 1.1765; More….
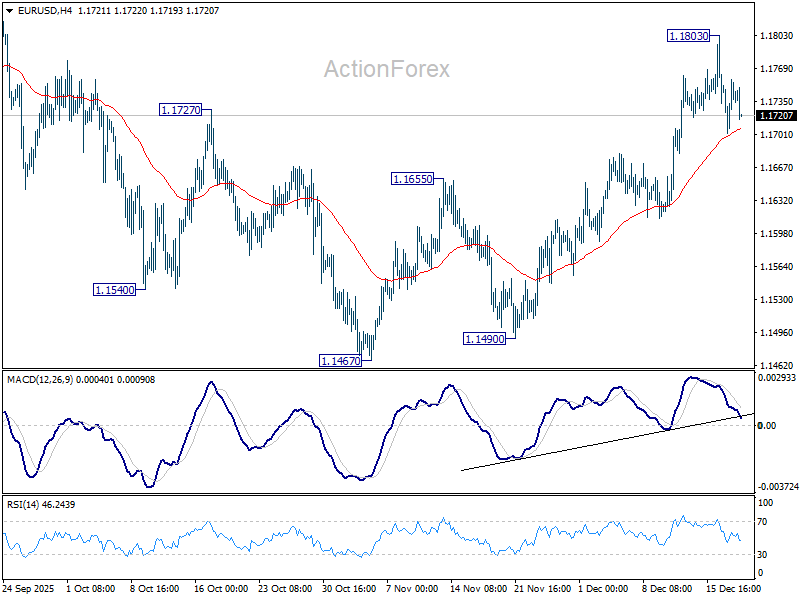
Intraday bias in EUR/USD remains neutral as consolidations continues below 1.1803. On the upside break of 1.1803 will resume the rally from 1.1467 to retest 1.1917 high. Decisive break there will resume larger up trend. On the downside, however, firm break of 55 D EMA (now at 1.1637) will turn bias back to the downside for 1.1467 support, to extend the corrective pattern form 1.19717 with another falling leg.
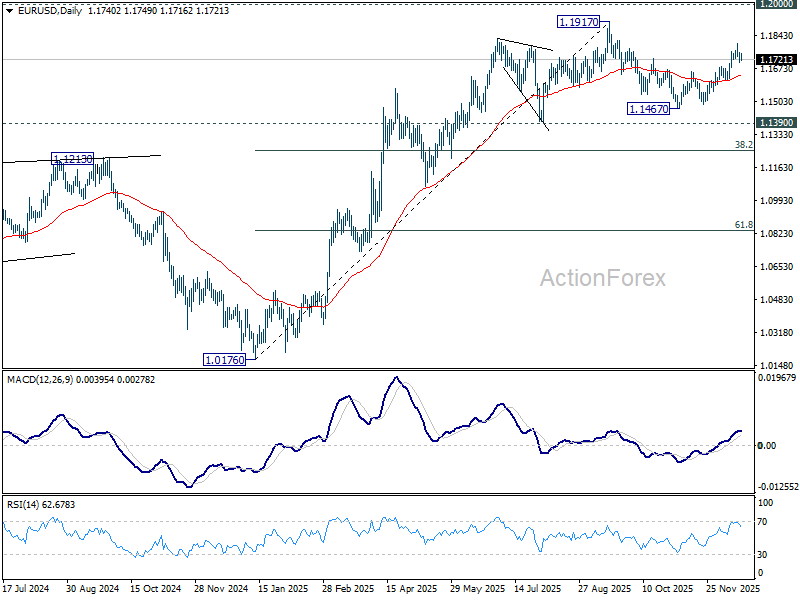
In the bigger picture, as long as 55 W EMA (now at 1.1373) holds, up trend from 0.9534 (2022 low) is still in favor to continue. Decisive break of 1.2 key psychological level will carry larger bullish implication. However, sustained trading below 55 W EMA will argue that rise from 0.9534 has completed as a three wave corrective bounce, and keep long term outlook bearish.
USD/JPY Daily Outlook
Daily Pivots: (S1) 154.89; (P) 155.32; (R1) 156.12; More...
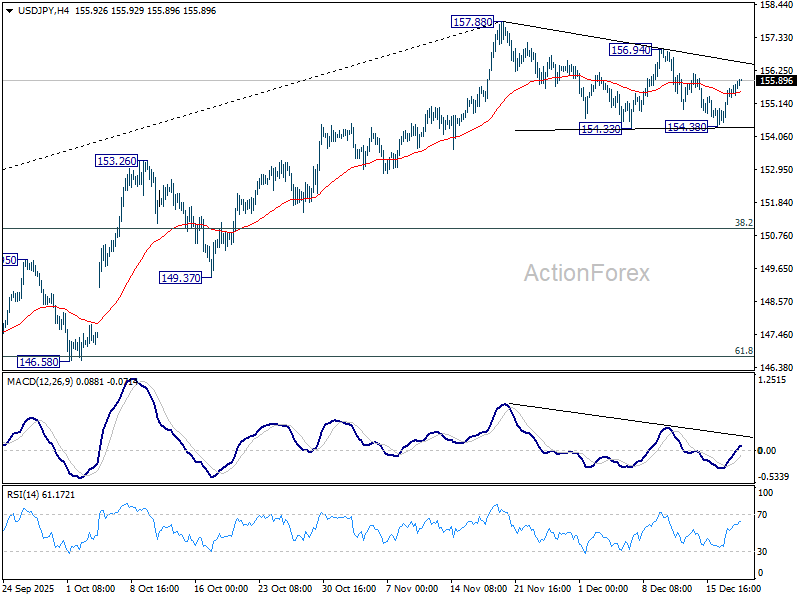
Intraday bias in USD/JPY remains neutral as consolidations from 157.88 continue. On the upside, break of 156.94 will suggests that larger rally from 138.87 is resuming. Retest of 157.88 high should be seen and then 158.85 key structural resistance. On the downside, break of 154.33 will bring deeper correction to 55 D EMA (now at 153.90) and possibly below.
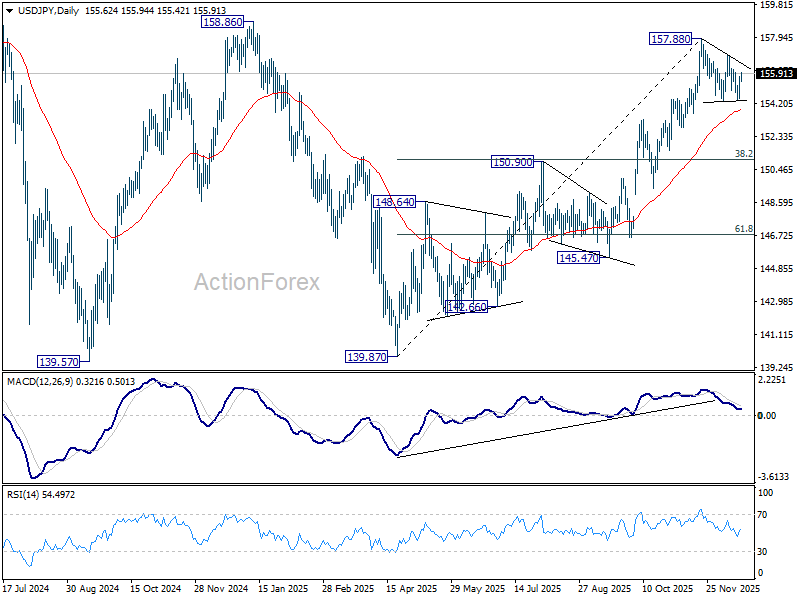
In the bigger picture, corrective pattern from 161.94 (2024 high) could have completed with three waves at 139.87. Larger up trend from 102.58 (2021 low) could be ready to resume through 161.94 high. Decisive break of 158.85 structural resistance will solidify this bullish case and target 161.94 for confirmation. On the downside, break of 150.90 resistance turned support will dampen this bullish view and extend the corrective range pattern with another falling leg.
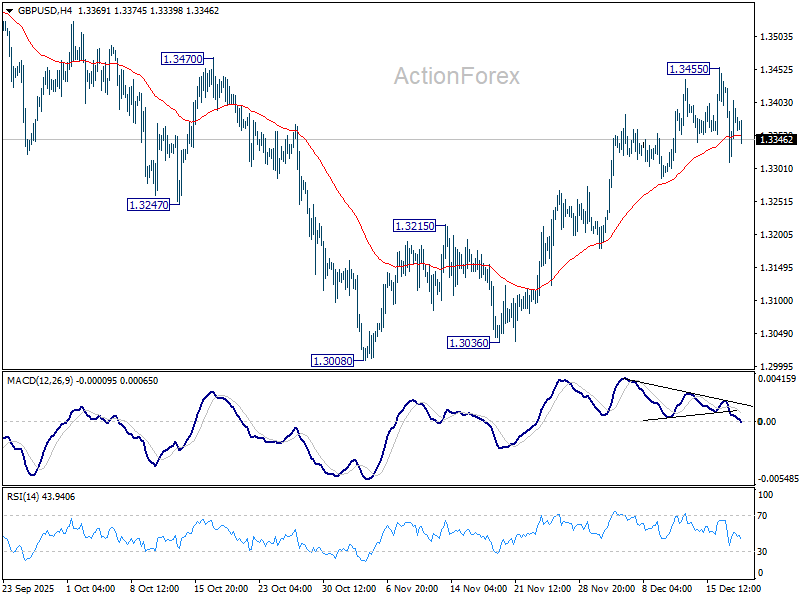
GBP/USD Daily Outlook
Daily Pivots: (S1) 1.3315; (P) 1.3372; (R1) 1.3431; More...
Intraday bias in GBP/USD remains neutral as consolidations continue below 1.3455. On the upside, above 1.3455 will resume the rebound from 1.3008. Firm break of 1.3470 resistance will pave the way to retest 1.3787 high. However, sustained break of 55 D EMA (now at 1.3295) will argue that the rebound has completed. Deeper fall would be seen back to 1.3008 support to resume the whole corrective pattern from 1.3787 high.
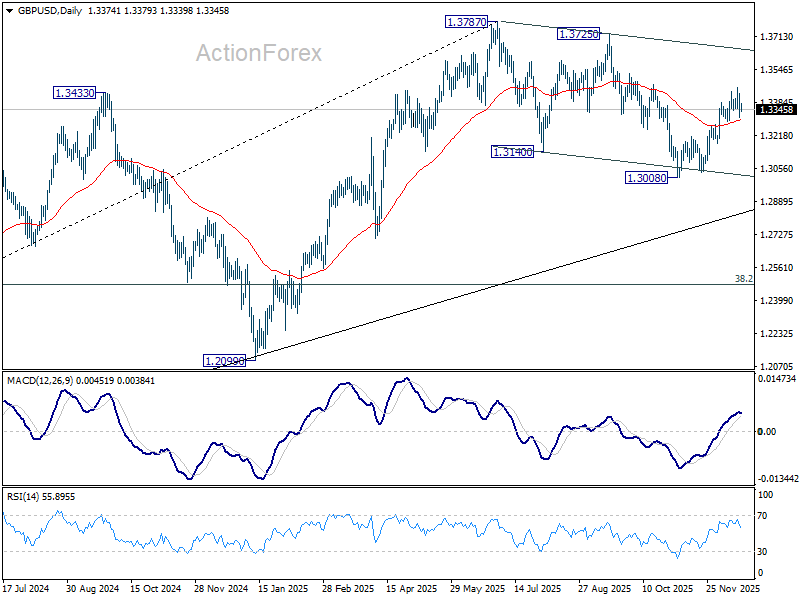
In the bigger picture, current development suggests that fall from 1.3787 is merely a corrective move, and larger rise from 1.0351 (2022 low) is still in progress. Firm break of 1.3787 will target 1.4248 (2021 high) key structural resistance. This will remain the favored case as long as target 38.2% retracement of 1.0351 to 1.3787 at 1.2474 holds, in case of another fall.
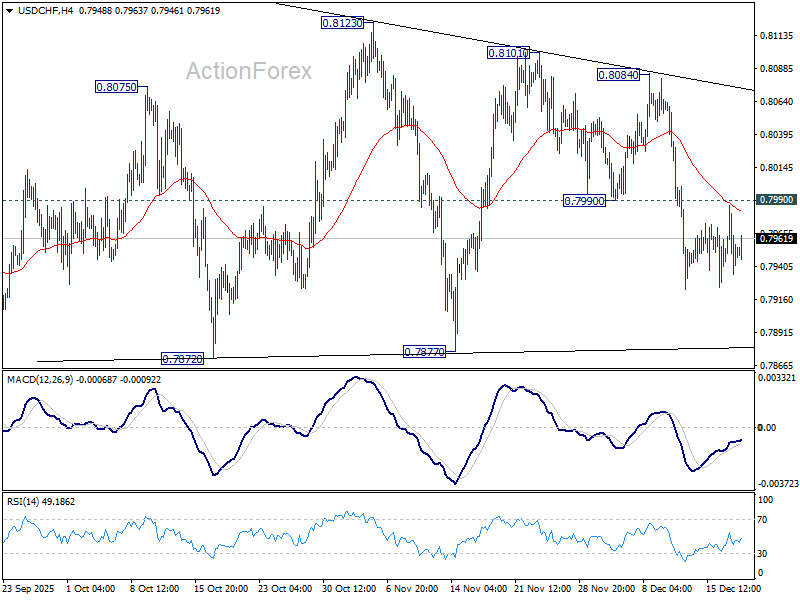
USD/CHF Daily Outlook
Daily Pivots: (S1) 0.7932; (P) 0.7960; (R1) 0.7985; More…
No change in USD/CHF's outlook as sideway trading continues. Intraday bias remains neutral for the moment. Overall, corrective pattern from 0.7828 is still extending. On the upside, break of 0.7990 support turned resistance will bring stronger rebound towards 0.8084. On the downside, below 0.7923 will target 0.7877 support.
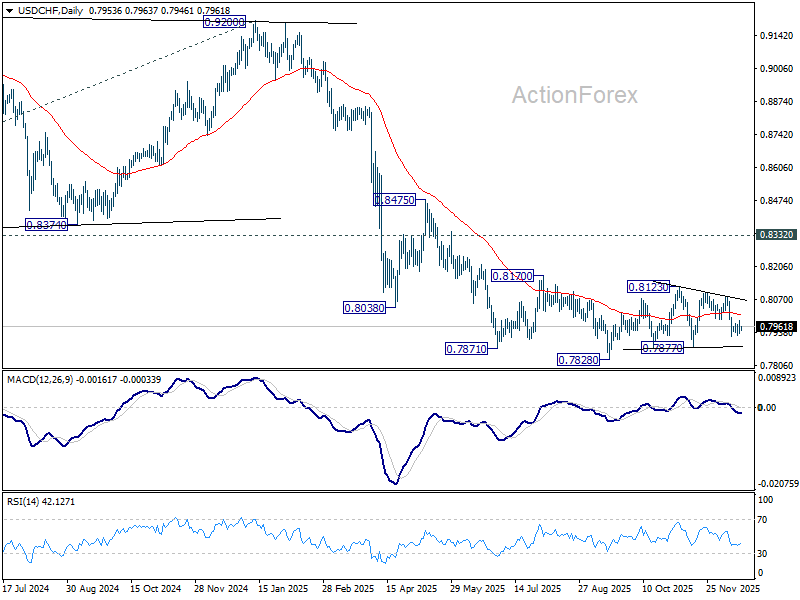
In the bigger picture, outlook will stay bearish as long as 0.8332 support turned resistance holds (2023 low). Long term down trend from 1.0342 (2017 high) is still in progress. Next target is 100% projection of 1.0146 (2022 high) to 0.8332 from 0.9200 at 0.7382.
USD/CAD Daily Outlook
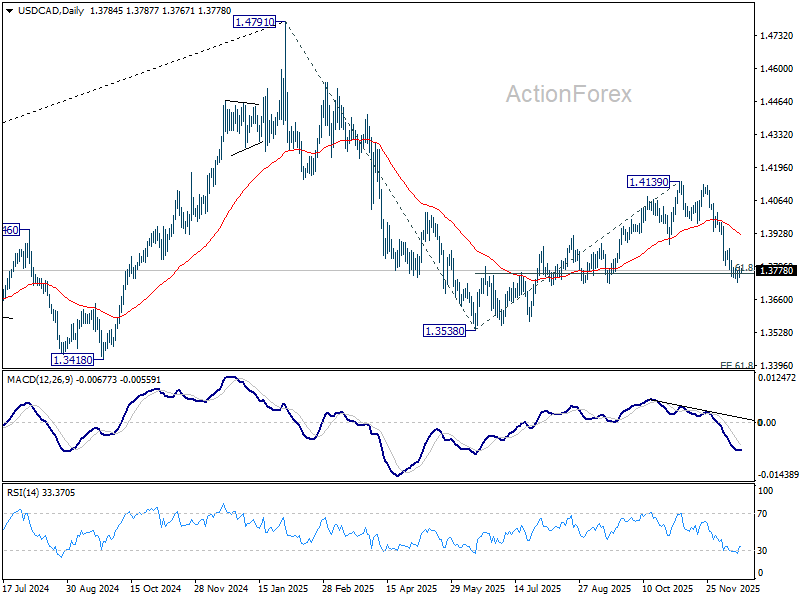
Daily Pivots: (S1) 1.3759; (P) 1.3779; (R1) 1.3806; More...
Intraday bias in USD/CAD remains neutral and further decline is in favor with 1.3879 resistance intact. On the downside, Sustained trading below 61.8% retracement of 1.3538 to 1.4139 at 1.3768 will argue that whole fall form 1.4791 might be ready to resume. Retest of 1.3538 low should be seen next. However, firm break of 1.3870 resistance will confirm short term bottoming, and turn bias back to the upside for stronger rebound.
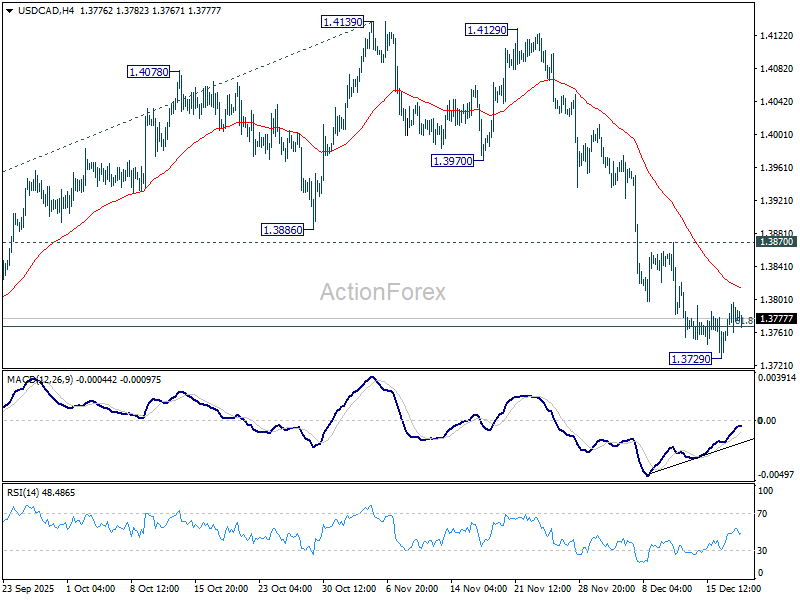
In the bigger picture, current development suggests that price actions from 1.4791 is developing into a deeper, larger scale correction. In the less bearish case, it's just correcting the rise from 1.2005 (2021 low). But even so, break of 1.3538 will pave the way to 61.8% projection of 1.4791 to 1.3538 from 1.4139 at 1.3365. This will remain the favored case as long as 1.4139 resistance holds, in case of rebound.
AUD/USD Daily Report
Daily Pivots: (S1) 0.6591; (P) 0.6614; (R1) 0.6628; More...
AUD/USD's fall from 0.6685 extends lower today. But for now, it's seen as a near term corrective retreat, and intraday bias remains neutral. On the upside, firm break of 0.6706 will confirm resumption of whole rise from 0.5913. Next target is 61.8% projection of 0.5913 to 0.6706 from 0.6420 at 0.6910. However, sustained break of 55 D EMA (now at 0.6561) will extend the corrective pattern from 0.6706 with another falling leg, and target 0.6420 support.
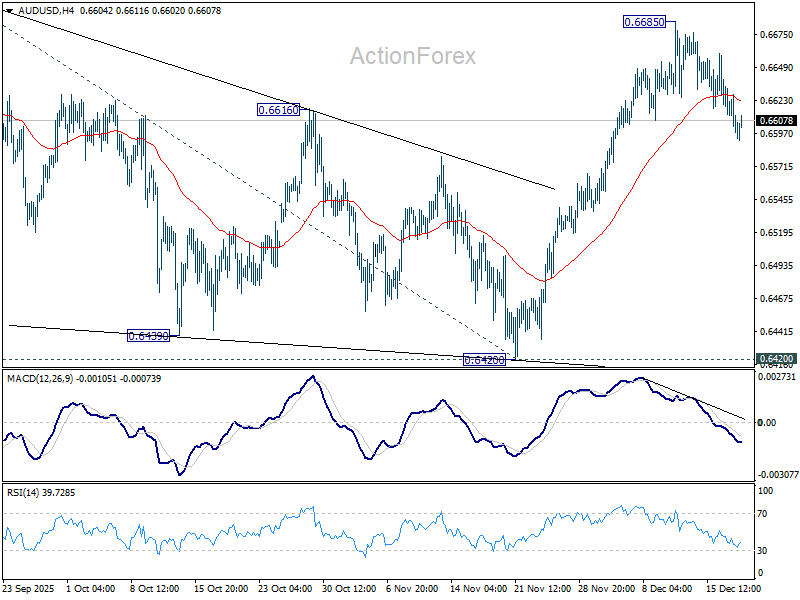
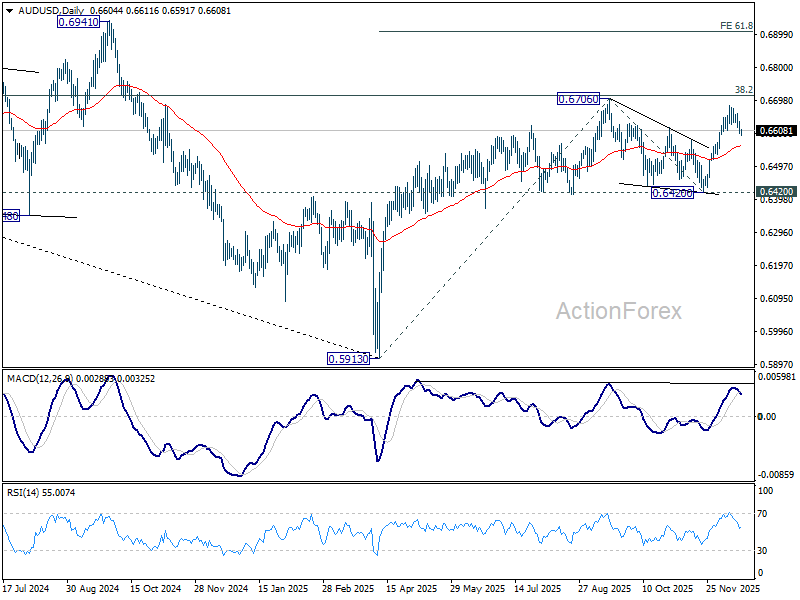
In the bigger picture, the break of multi-year falling trend line resistance suggests that rise from 0.5913 is possibly reversing whole down trend from 08006 (2021 high). Decisive break of 38.2% retracement of 0.8006 to 0.5913 at 0.6713 will solidify this case, and bring further rally to 61.8% retracement at 0.7206. On the downside, however, firm break of 0.6420 support will suggest rejection by 0.6713 and retain medium term bearishness.
Risk-Off Undercurrent Builds as BoE, ECB, CPI Crowd the Session
A volatile trading environment looks all but guaranteed as markets face a rare clustering of major event risks today. BoE and ECB rate decisions headline the European session, while US CPI later on is likely to determine whether recent risk jitters deepen or stabilize.
In FX, much attention centers on EUR/GBP. While the ECB is expected to hold steady with little surprise, the BoE’s rate cut could prove far more influential. The tone of guidance and the voting split will be closely watched for clues on how far easing may extend. The technical backdrop already favors upside in EUR/GBP. Any indication that the BoE’s easing bias is strengthening—especially via reduced hawkish resistance—could quickly propel the cross higher.
Beyond Europe, however, the US CPI release would carry the greatest weight. This comes at a time when risk sentiment is deteriorating, even as markets price in a slightly higher chance of further Fed easing early next year. AI-related valuation concerns remain a persistent overhang, as seen in the sharp selloff in NASDAQ yesterday.
In that context, the danger is not a CPI shock, but what follows once the data risk is removed. With the event out of the way, markets may resume the risk-off behavior already visible beneath the surface.
Currency markets are already reflecting that risk aversion tilt. Kiwi underperforms for the week so far, followed by Aussie and Loonie. Swiss Franc leads, ahead of Dollar and Yen. Euro and Sterling remain caught in the middle.
BoE Tone, Not ECB, Likely to Drive EUR/GBP
BoE and ECB rate decisions dominate the European session today, with EUR/GBP likely to be the key FX mover. Technical signals suggest scope for the cross to retest November’s short-term top, though direction will depend primarily on the BoE outcome rather than the ECB.
The BoE is widely expected to resume policy easing by cutting Bank Rate by 25bps to 3.75%. That move should be seen as a return to form rather than a shift in strategy. The BoE has already been operating on a quarterly cut cadence since mid last year, and today’s move was effectively delayed from November due to the Autumn Budget.
The key questions now are whether the easing cycle continues and how deep it ultimately runs. The answer to the first is likely yes, while the second remains far less clear. Inflation has cooled meaningfully, but it is still above target, leaving policymakers cautious about how far rates can fall.
This week’s weaker-than-expected employment and inflation data may start to soften resistance among more hawkish MPC members. That shift could show up in today’s vote split. Markets will be watching closely for any dissent, and whether a clear majority emerges in favor of the cut.
If the vote shows broad support, expectations for a follow-up cut in February would firm. That would simply mark a return to the quarterly easing rhythm, aligned with the first meeting of the quarter and the release of new economic projections, rather than signaling a more aggressive easing stance.
By contrast, the ECB decision is likely to be a non-event. Policymakers have been clear that rates are comfortable at current levels for the foreseeable future, with inflation anchored close to the 2% target and no immediate risk of deviation.
While speculation has emerged that the ECB’s next move could be a hike, potentially by late 2026, that discussion appears premature. President Christine Lagarde is likely to push back against such talk today.
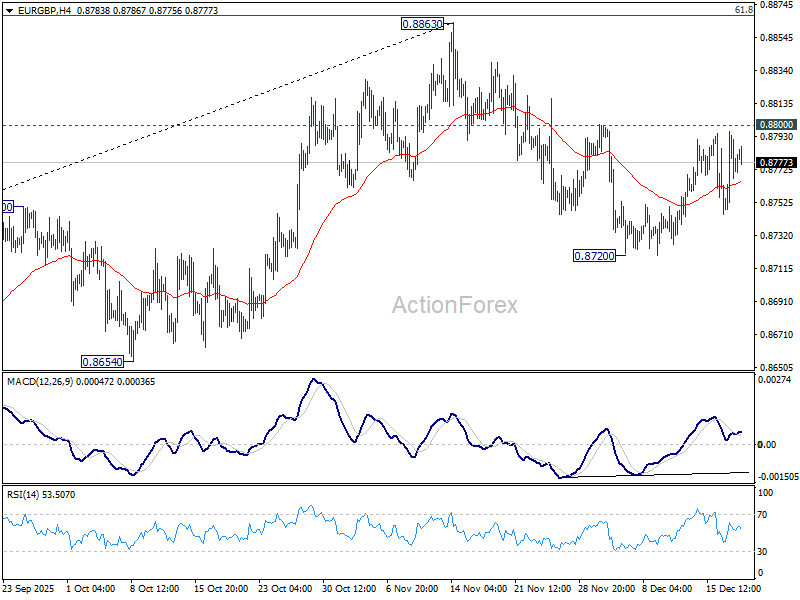
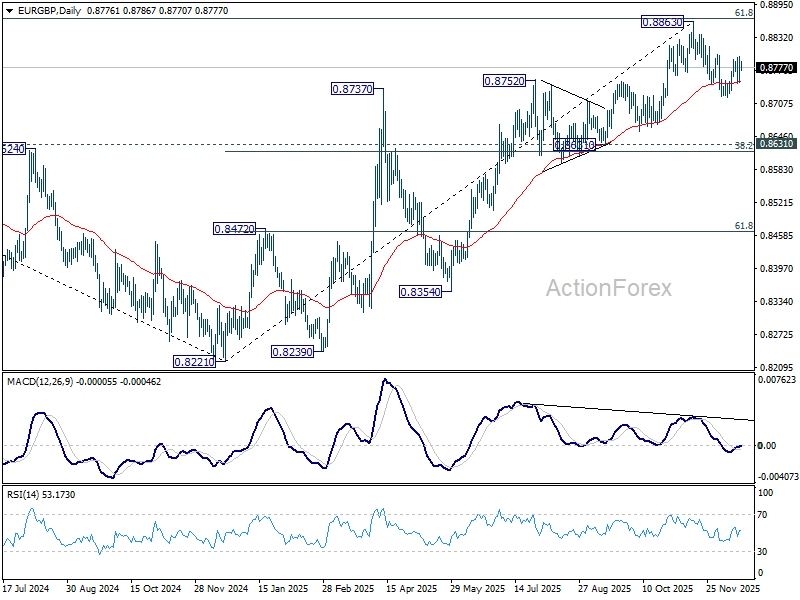
Technically, near term price actions suggests that EUR/GBP's corrective fall from 0.8863 has completed at 0.8720 after drawing support from 55 D EMA. Firm break of 0.8800 resistance will solidify this bullish case. And more importantly, that would suggest that rise the up trend from 0.8221 is in progress and ready to resume through 0.8863. Though, rejection by 0.8800 will open up another fall through 0.8720 towards 0.8631 support instead.
US CPI in focus as NASDAQ breakdown raises risk-off stakes
Attention in US markets centers on November CPI today, against a backdrop of deteriorating risk sentiment. Despite a slight post-NFP lift in March Fed cut pricing, equities have failed to find support, and risk appetite deteriorated sharply overnight.
NASDAQ led the downside overnight, breaking decisively below key near-term support and its 55 D EMA. That move shifts the technical picture bearish for the near term and raises the risk of further downside once the CPI event risk passes.
The inflation data itself will be incomplete. The BLS confirmed that the release will omit certain one-month changes due to missing October data after the extended government shutdown. As a result, the CPI print may lack the usual granularity markets rely on for strong directional signals.
Consensus expects headline CPI to tick up to 3.1% yoy, with core CPI holding at 3.0%. Absent a major deviation, Fed expectations should remain broadly stable. A January hold remains the base case, while March cut odds sit near 55%, with three more months of jobs and inflation data still to come.
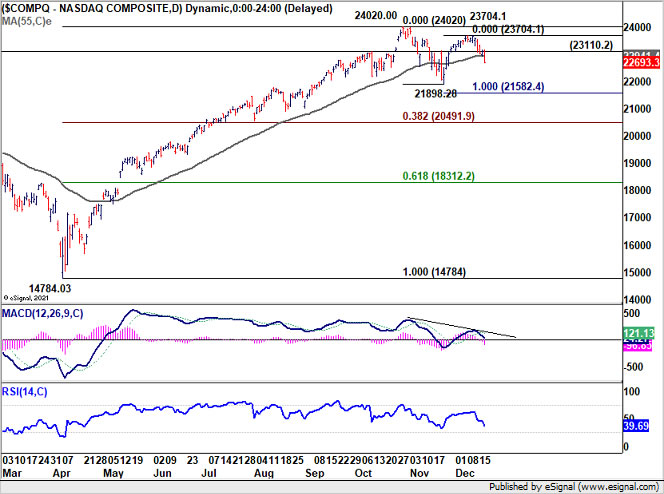
Technically, NASDAQ's strong break of 23110.2 support as well as 55 D EMA suggests that corrective pattern from 24020.00 high is now in the third leg. Deeper fall should be seen to 21898.2 support, and possibly below to 100% projection of 24020.0 to 21898.28 from 23704.1 at 21582.4.
AUD/USD Daily Report
Daily Pivots: (S1) 0.6591; (P) 0.6614; (R1) 0.6628; More...
AUD/USD's fall from 0.6685 extends lower today. But for now, it's seen as a near term corrective retreat, and intraday bias remains neutral. On the upside, firm break of 0.6706 will confirm resumption of whole rise from 0.5913. Next target is 61.8% projection of 0.5913 to 0.6706 from 0.6420 at 0.6910. However, sustained break of 55 D EMA (now at 0.6561) will extend the corrective pattern from 0.6706 with another falling leg, and target 0.6420 support.
In the bigger picture, the break of multi-year falling trend line resistance suggests that rise from 0.5913 is possibly reversing whole down trend from 08006 (2021 high). Decisive break of 38.2% retracement of 0.8006 to 0.5913 at 0.6713 will solidify this case, and bring further rally to 61.8% retracement at 0.7206. On the downside, however, firm break of 0.6420 support will suggest rejection by 0.6713 and retain medium term bearishness.
US CPI in focus as NASDAQ breakdown raises risk-off stakes
Attention in US markets centers on November CPI today, against a backdrop of deteriorating risk sentiment. Despite a slight post-NFP lift in March Fed cut pricing, equities have failed to find support, and risk appetite deteriorated sharply overnight.
NASDAQ led the downside overnight, breaking decisively below key near-term support and its 55 D EMA. That move shifts the technical picture bearish for the near term and raises the risk of further downside once the CPI event risk passes.
The inflation data itself will be incomplate. The BLS confirmed that the release will omit certain one-month changes due to missing October data after the extended government shutdown. As a result, the CPI print may lack the usual granularity markets rely on for strong directional signals.
Consensus expects headline CPI to tick up to 3.1% yoy, with core CPI holding at 3.0%. Absent a major deviation, Fed expectations should remain broadly stable. A January hold remains the base case, while March cut odds sit near 55%, with three more months of jobs and inflation data still to come.
Technically, NASDAQ's strong break of 23110.2 suppor as well as 55 D EMA suggests that corrective patternf rom 24020.00 high is now in the third leg. Deeper fall should be seen to 21898.2 support, and possibly below to 100% projection of 24020.0 to 21898.28 from 23704.1 at 21582.4.
BoE Tone, Not ECB, Likely to Drive EUR/GBP
BoE and ECB rate decisions dominate the European session today, with EUR/GBP likely to be the key FX mover. Technical signals suggest scope for the cross to retest November’s short-term top, though direction will depend primarily on the BoE outcome rather than the ECB.
The BoE is widely expected to resume policy easing by cutting Bank Rate by 25bps to 3.75%. That move should be seen as a return to form rather than a shift in strategy. The BoE has already been operating on a quarterly cut cadence since mid last year, and today’s move was effectively delayed from November due to the Autumn Budget.
The key questions now are whether the easing cycle continues and how deep it ultimately runs. The answer to the first is likely yes, while the second remains far less clear. Inflation has cooled meaningfully, but it is still above target, leaving policymakers cautious about how far rates can fall.
This week’s weaker-than-expected employment and inflation data may start to soften resistance among more hawkish MPC members. That shift could show up in today’s vote split. Markets will be watching closely for any dissent, and whether a clear majority emerges in favor of the cut.
If the vote shows broad support, expectations for a follow-up cut in February would firm. That would simply mark a return to the quarterly easing rhythm, aligned with the first meeting of the quarter and the release of new economic projections, rather than signaling a more aggressive easing stance.
By contrast, the ECB decision is likely to be a non-event. Policymakers have been clear that rates are comfortable at current levels for the foreseeable future, with inflation anchored close to the 2% target and no immediate risk of deviation.
While speculation has emerged that the ECB’s next move could be a hike, potentially by late 2026, that discussion appears premature. President Christine Lagarde is likely to push back against such talk today.
Technically, near term price actions suggests that EUR/GBP's corrective fall from 0.8863 has completed at 0.8720 after drawing support from 55 D EMA. Firm break of 0.8800 resistance will solidify this bullish case. And more importantly, that would suggest that rise the up trend from 0.8221 is in progress and ready to resume through 0.8863. Though, rejection by 0.8800 will open up another fall through 0.8720 towards 0.8631 support instead.
November CPI Inflation Numbers Highlight of US Calendar
Markets
The tech-heavy Nasdaq underperformed yesterday (-1.8%) with AI-heavyweights ceding more ground. Their lofty valuations have been topic of debate the past couple of weeks. Yesterday’s hiccup came after Blue Owl Capital withdrew from financing (the equity part) a data center involving Oracle. While this doesn’t derail the project, some interpreted it as a sign to take some more chips off the table. Both the Nasdaq and the S&P 500 are now in the final innings of completing a technical head-and-shoulders formation (September-December) with necklines around respectively 6500 and 22 000. Losing those would set the stage for a technical acceleration of the current correction.
The ECB will keep its policy rates unchanged today. Updated GDP projections are expected to show upward revisions for this year and next as flagged by several ECB members. 2027 inflation forecasts will see a downward shift because of the delay in the implementation of the Emissions Trading System (2) but this could be compensated for in the first view on inflation for 2028. We expect ECB President Lagarde to keep a neutral line, calling for interest rate stability in months to come. We don’t think that she will echo ECB Schnabel’s suggestion that the next ECB move will be a rate hike. It’s in the central bank’s interest to make today’s gather as much as possible a non-events. We don’t expect it to trigger any directional market moves. EUR/USD is going nowhere at 1.1750.
The Bank of England is expected to cut its policy rate by 25 bps to 3.75% as two consecutive inflation reports (stronger than hoped disinflation forces) should have convinced at least BoE governor Bailey to switch sides. Recall that the BoE in November by the smallest of margins voted to keep its policy rate unchanged (5-4). The amount of dissenters could be a cue for investors to shape expectations going into Q1. We err on the dovish side of expectations with markets probably underestimating the risk of a faster move towards neutral territory. Apart from the disinflationary forces, the UK economy fails to really gain traction. UK Gilts yesterday outperformed following the November CPI report with the front end of the curve dipping up to 5.8 bps and sending EUR/GBP towards 0.88. These moves can continue today.
November CPI inflation numbers are the highlight of the US calendar. It’s the first update since September numbers with the BLS skipping the October report. Consensus expects headline and core CPI at respectively 3.1% Y/Y and 3% Y/Y. We don’t expect big deviations. If any, they probably carry little market-moving potential as US markets currently focus on activity and labour market data.
News & Views
The New Zealand economy grew by 1.1% Q/Q and 1.3% Y/Y in Q3, rebounding from a 1% Q/Q contraction in Q2. Still GDP was 0.5% lower in the four quarters between September 2024-2025. The Q3 recovery was broad-based with growth in 14 out of 16 industries. Business services were the largest contributor to the overall increase in GDP, up 1.6% Q/Q, Manufacturing was up 2.2% Q/Q (after a 3.9% fall in Q2), driven by food, beverage, and tobacco manufacturing. Information media and telecommunications was the largest drag on growth (-2.1%Q/Q). GDP per capita rose 0.9%. On the demand side, the expenditure measure of GDP rose 1.3% Q/Q. However, household consumption expenditure only rose 0.1% Expenditure on durables rose by 2%, while expenditure on services fell 0.1%% and non-durables fell 0.2%. Gross fixed capital formation, up 3.2%, and exports contributed to the rise. The Reserve Bank of New Zealand at its November meeting indicated that it probably finished its easing cycle at 2.25%. Both ST yields (2-y: -1.6 bps at 2.72%) and the kiwi dollar (NZD/USD 0.576) are slightly softer this morning.
After a mild setback in November, Hungarian economic sentiment improved further this month, with the overall GKI-index rising from -14.4 to -11.7, the best level since June last year. Both business confidence (-8.1 from -9.9) and consumer confidence (-22.0 from -27.2) improved. The forint over the previous days corrected after a protracted rally earlier this year as the MNB changed its forward guidance. The door is now again open for some gradual further easing to be evaluated on a meeting-meeting approach. The forint trades near EUR/HUF 390.