
Sample Category Title
ECB, BoE Decide, US Reveals CPI
Market sentiment is weak after Tuesday’s US jobs data failed to spark optimism for more Federal Reserve (Fed) cuts next year, and the AI selloff intensified yesterday on two major developments that aggravated investors’ concerns about circularity and leveraged-debt risks.
First, Amazon is reportedly in talks to invest $10bn in OpenAI. In return, OpenAI would buy Amazon’s homegrown Trainium chips — a deal reminiscent of its recent contract with Nvidia, which raised questions about circularity, contagion risk, and marked the start of waning AI enthusiasm.
Second, Oracle said that negotiations for an equity deal for a Michigan data center project did not include Blue Owl Capital, and that its development partner had instead chosen “the best equity partner from a competitive group,” without specifying who that partner is. The suspense is forcing investors to reassess who is actually backing the project and how secure the funding is — especially given spiking credit default swaps, which suggest rising fears of default tied to Oracle’s leveraged projects, one of which was recently delayed due to labour and material shortages.
The result: Oracle’s share price dropped another 5%, bringing its total loss since the September peak to 45%. Nvidia fell 3.8%. Amazon was down 0.58%, a disappointing reaction compared with Google’s jump weeks ago after Meta announced it would use Google’s TPUs. Even Google — outside the OpenAI-Nvidia circle — fell more than 3%.
Perhaps it is happening: the AI bubble may be deflating. How far the selloff will go remains unclear, but high valuations could justify a 10–20% drop from peak to trough, implying the Nasdaq could fall below 21’000. Not the Season Finale investors had hoped for after a strong year.
The good news: Micron’s earnings lifted tech sentiment after the bell, with both revenue and profits beating forecasts as demand for memory used in data centers and AI applications stayed strong. The results confirm that the memory cycle recovery is gaining traction, supported by tight supply and rising prices, reassuring investors that Micron is benefiting from the AI spending boom.
Nasdaq futures are trading higher this morning as attention shifts back to economic data, with the US set to release the first CPI figures since the government shutdown.
As an economist, I note that today’s inflation data is a key driver of Fed expectations. Inflation remains sticky and above the Fed’s target, making a 1% Fed rate — as Donald Trump has advocated — unrealistic without risking a spike in prices for Main Street. Normally, a weakening jobs market helps tame inflation because lower incomes reduce spending. But tariffs complicate the jobs-inflation equation: if tariff-driven inflation materializes, demand could fall enough to control inflation. The latter would require a severe hit to the labour market. This is why markets have been closely monitoring US jobs data: its resilience could shift attention back to inflation.
Interpreting inflation data is straightforward: softer figures should keep Fed-cut bets alive, supporting equities and bonds and weighing on the dollar, while stronger-than-expected data would threaten dovish Fed expectations, weighing on equities and bonds and boosting the dollar. The dollar index is slightly higher ahead of the data, the EURUSD is flat and Cable is under pressure ahead of European Central Bank (ECB) and the Bank of England (BoE) decisions today.
The ECB is expected to keep rates unchanged. ECB Chief Christine Lagarde is likely to reiterate that policy is appropriately positioned and that the committee will continue monitoring data. The base case is no change today or next year.
The BoE faces a tougher backdrop: UK growth is weak, productivity gains are minimal and budget pressures persist. Inflation has begun easing, but remains above the BoE’s target (~3%), likely heading toward 2% by next spring. A rate cut today, with a dovish statement, would keep sterling under pressure.
In summary: the Fed’s dovish pricing will be tested by today’s CPI, the ECB is unlikely to offer surprises and the BoE could be more dovish than expected. The US dollar could strengthen, sterling remain under pressure, and the euro may follow broader trends.
Tomorrow, the Bank of Japan (BoJ) concludes the global policy dance with a widely anticipated rate hike. Japanese 10-year yields are just below 2%, pressuring other DM yields higher and further weighing on risk sentiment.
Happily, Fed’s repo purchases are rising, offering some comfort to risk investors.
Central Bank Decisions Headline the Day
In focus today
Central bank interest rate decisions are on the agenda and are kicked off by the Riksbank in the morning. We expect the central bank to stay on hold at 1.75%, which is in line with market consensus. We anticipate unchanged communication regarding the interest rate in the near term, with some upward adjustments to the rate path further out.
Also in the morning, we expect Norges Bank to keep the policy rate unchanged at 4.00% at the MPC-meeting. Based on the developments since the monetary policy report in September, we think Norges Bank will send moderately more dovish signals at this juncture and open the door for a rate cut in March.
In the afternoon the Bank of England is expected to cut the Bank Rate to 3.75% from 4.00% following softer PMI and CPI figures in recent months. Despite the very high market pricing we expect a relatively close vote split of 5-4. For the preview see Bank of England Preview - Slowdown paves way for rate cut, 12 December.
The ECB meeting follows thereafter, and we expect the ECB to leave the deposit rate unchanged at 2.0% line with consensus and market pricing. Data has come in stronger than expected by ECB staff, so we predict an upward revision to the growth forecasts with the inflation forecast remaining relatively steady. We see the ECB holding rates steady at 2.0% in both 2026 and 2027 due to undershooting inflation. We expect a muted market reaction as Lagarde will likely signal ECB being on hold for a while, reiterating the 'good place' assessment. For the details, please see our ECB Preview: Hold on, we're not hiking, 11 December.
From the US, the November CPI is due for release in the afternoon. We forecast headline inflation steady at +0.3% m/m SA and 3.0% y/y (September +0.3% m/m SA & 3.0% y/y) and core inflation picking up to +0.3% m/m SA & 3.0% y/y (September +0.2% m/m SA & 3.0% y/y).
Overnight the Bank of Japan is expected to hike interest rates at the December meeting after Governor Ueda said he would "consider pros and cons" at the meeting. Despite wage growth struggling to compensate for inflation, economic momentum has been strong throughout the year. Ahead of the meeting, November CPI data is released.
The German Debt Office (the Finanzagentur) will publish their funding outlook. Germany has a gross funding need of around EUR 520bn, which must be financed through issuance of bonds and bills. We expect that they will sell EUR 340bn-350bn in bonds.
Economic and market news
What happened overnight
In the US, President Trump addressed the nation in a 20-minute speech. He focused entirely on the domestic economy and particularly on the cost of living. Polling numbers from the likes of Politico have indicated that Americans are increasingly unhappy with the cost of living. Trump also said he would soon announce the next Fed chairman who "believes in lower interest rates by a lot".
What happened yesterday
In the euro area, the final HICP inflation print for November was revised down to 2.1% y/y from 2.2% in the flash print. The details show this was due to rounding, as inflation was revised from 2.15% y/y to 2.14% y/y. The final data allows a calculation of the "LIMI" measure of domestic inflation, which again remained very sticky at 3.5% for six consecutive months. Surprisingly elevated wage growth in Q3 is causing the stickiness in LIMI inflation. This is used as a hawkish argument for the ECB despite headline inflation being forecasted to undershoot the target in the coming months due to low energy inflation.
The December German Ifo index declined against expectations to 87.6 (cons: 88.2) from 88.0. The assessment of the economic situation was stable at 85.6 (cons: 85.5) like in November, while the expectations component took a hit declining to 89.7 (cons: 90.5) from 90.5. With the PMI data also correcting lower in November and December from the relatively high level in September, the German economy likely ended the year with only a small expansion in activity. While German activity has remained low in 2025, we expect a clear rebound next year with real GDP rising 1.4% y/y as tax cuts and subsidies take effect.
In Sweden, the quarterly Origo inflation survey showed CPIF expectations on the 1y horizon declining from 2.1% to 1.6%, most likely due to the upcoming VAT reduction. The 2y and 5y horizons remained stable at 2.0% and 2.1%, respectively. Wage expectations on the 5y horizon rose slightly for both employee and employers' organizations, which point towards higher wage growth ahead compared to the years before the pandemic.
In the UK, November CPI inflation released considerably lower than expected. Inflation measures declined across the board, with headline inflation at 3.2% (cons: 3.5%) from 3.6%, core at 3.2% (cons: 3.4%) from 3.4% and services at 4.4% (cons: 4.5%) from 4.5%. This is the second soft CPI surprise over the recent three months. It aligns well with recent PMI indicators, which suggested lower inflation in November, and markets are now pricing in an almost 99% likelihood of the Bank of England cutting the Bank Rate today.
In the US, Federal Reserve Governor Waller said he thinks that current interest rates are 50-100bp above the neutral level. Waller said he sees room to cut interest rates as the labour market is very soft, and inflation is unlikely to reaccelerate. The remarks were on the dovish side even for Waller, with the WSJ reporting that he was interviewed for the Fed chair position by US President Trump yesterday.
Equities: Global equities had a rough trading session yesterday, with a broad-based decline of about 0.9%, marking the fourth consecutive session of overall declines. The defensive sectors ended mostly in green, led by energy, staples, and materials, while the more classical cyclical sectors posted significantly negative returns. Tech declined 2.2% in the US. Overall, the S&P 500 fell 1.2%, with Nasdaq down 1.8% and the Russell 2000 lower by 1.1%. In Europe, the Euro Stoxx declined 0.4%. This risk-off sentiment carried over into the overnight session, with Asian equity markets trading lower.
FI and FX: Today, we have a string of central bank meetings from BoE, ECB. Sweden and Norway as well as US CPI data. BoE is expected to cut rates, ECB, the Riksbank and Norges Bank are expected to be on hold, and here it is more about the comments for monetary policy in 2026 that attract the attention of the markets.
The German Debt Office will launch their funding outlook for 2026. The consensus forecast for the bond issuance is some EUR 350bn. In this case there is a going to be a very active issuance calendar. Despite the solid issuance, then Bund and Buxl's have performed well in the recent week versus swaps.
WTI Crude Oil Slips Lower—Why Fresh Gains Could Be Limited
Key Highlights
- WTI Crude Oil prices started a fresh decline below $58.50.
- A key bearish trend line is forming with resistance at $57.00 on the 4-hour chart.
- Gold started a fresh increase above $4,300 and $4,320.
- EUR/USD is consolidating gains above the 1.1680 support zone.
WTI Crude Oil Price Technical Analysis
WTI Crude Oil price gained bearish momentum below $60.00 against the US Dollar. It declined below $58.00 and $56.50 to enter a bearish zone.
Looking at the 4-hour chart of XTI/USD, the price even spiked below $55.00. A low was formed at $54.98 on TitanFX, and the price is now consolidating losses. There was a minor recovery above the $55.50 level.
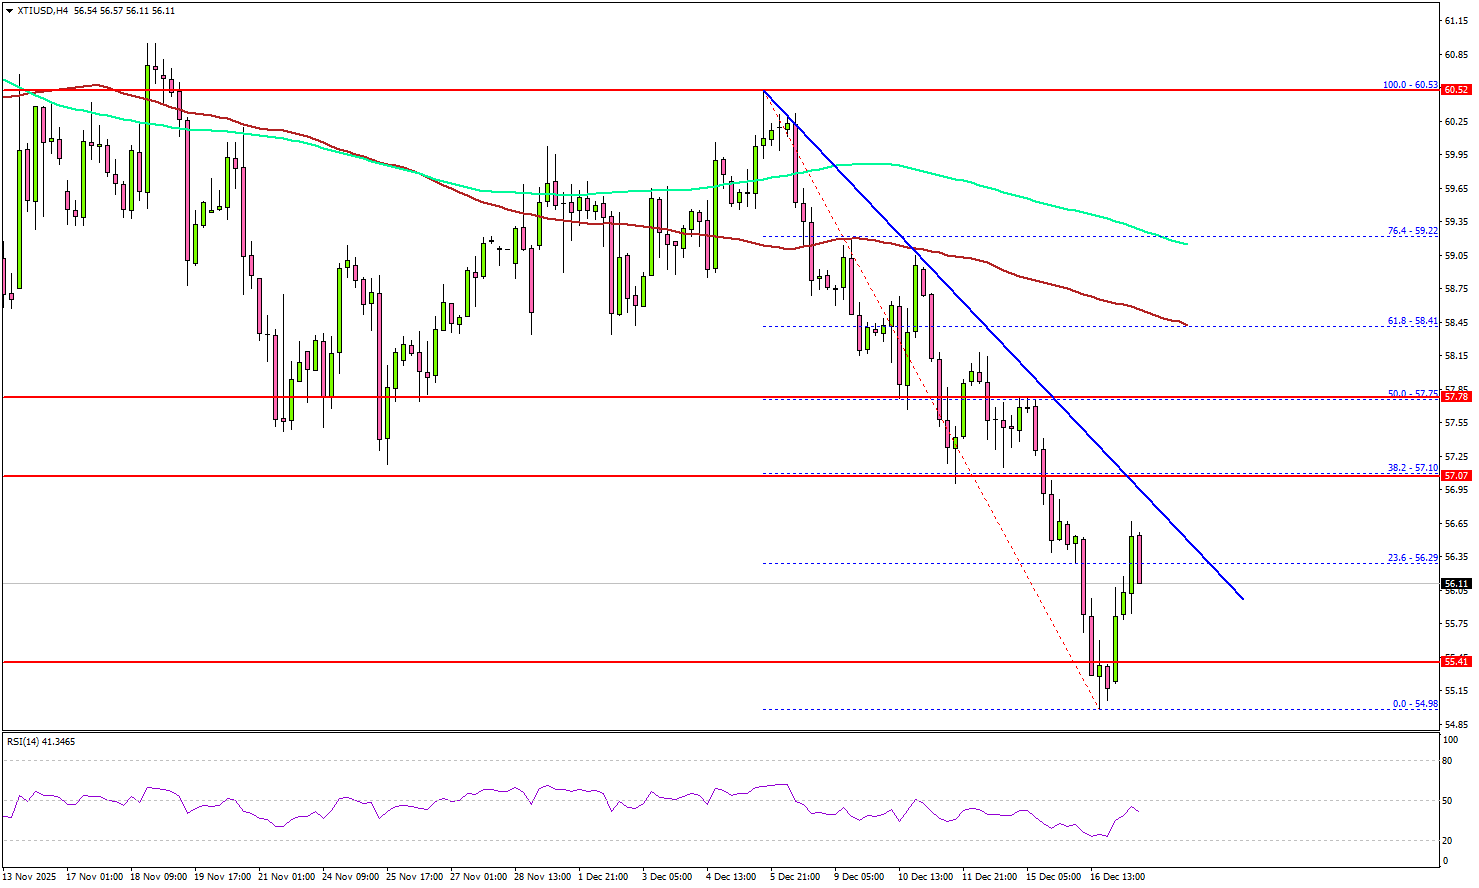
The price climbed above the 23.6% Fib retracement level of the downward move from the $60.53 swing high to the $54.98 low. However, the price remained well below the 100 simple moving average (red, 4-hour) and the 200 simple moving average (green, 4-hour).
On the upside, immediate resistance is near the $56.80 level. The first key hurdle for the bulls could be $57.00. There is also a bearish trend line forming with resistance at $57.00. The main hurdle sits at $58.50.
A close above $58.50 might send Oil prices toward $59.20. Any more gains might call for a test of $60.00 in the near term. On the downside, the first major support sits near the $55.40 zone.
The next support could be $55.00. A daily close below $55.00 could open the doors for a larger decline. In the stated case, the bears might aim for a drop toward $53.20.
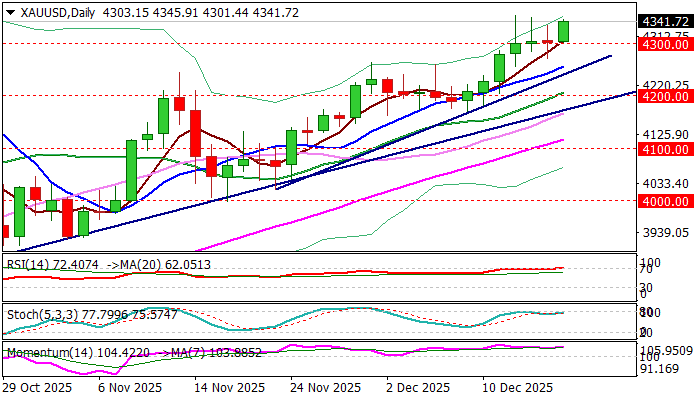
Looking at Gold, the bulls remained in action, and the price started a fresh increase above the $4,320 resistance.
Economic Releases to Watch Today
- US Consumer Price Index for Nov 2025 (YoY) – Forecast +3%, versus +3% previous.
- US Initial Jobless Claims - Forecast 225K, versus 236K previous.
GOLD: Bulls Hold Grip for Retest of New Record High
Gold bounced from key $4300 support zone (which contained attacks in past three days) with the price being on track for the fourth consecutive daily close above this level that adds to positive outlook.
Fresh demand emerged from growing market expectations for more Fed rate cuts, keeping the price underpinned for probe through near-term congestion top ($4353), the last obstacle on the way towards all-time high at $4381).
Geopolitical situation remains highly volatile as peace talks about Ukraine so far do not show any firmer signs of potential agreement, with high uncertainty over the case about frozen Russian assets, contributing to strengthening bullish view.
Technical studies on daily chart are positive, but overbought conditions may slow the action.
Res: 4353; 4381; 4400; 4425
Sup: 4325; 4300; 4271; 4255
Dow Jones Wave Analysis
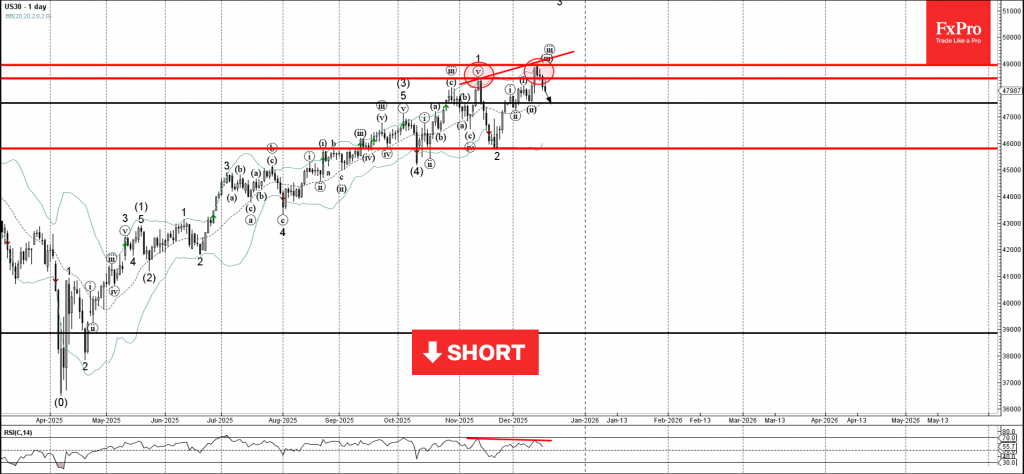
Dow Jones: ⬇️ Sell
- Dow Jones reversed from resistance level 49000.00
- Likely to fall to support level 47525.00
Dow Jones index recently reversed from the resistance area between the resistance level 49000.00 and the upper daily Bollinger Band.
The downward reversal from this resistance area stopped the previous minor impulse waves iii and 3.
Given the strength of the resistance level 49000.00 and the bearish divergence on the daily RSI indicator, Dow Jones index can be expected to fall further to the next support level 47525.00 (low of the previous correction ii).
Platinum Wave Analysis
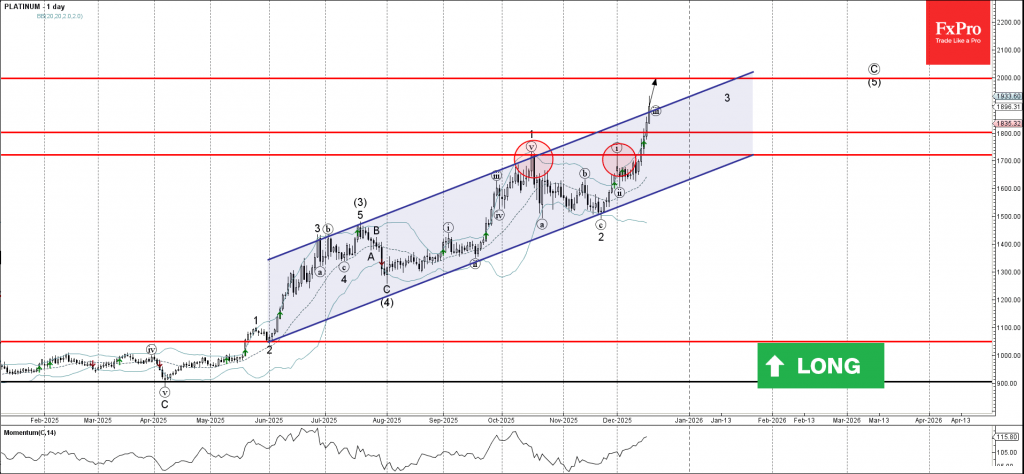
Platinum: ⬆️ Buy
- Platinum broke resistance level 1800.00
- Likely to rise to resistance level 2000.00
Platinum rising inside the accelerated the impulse wave 3 which recently broke the resistance area between the resistance level 1800.00 and the resistance trendline of the daily up channel from June.
The breakout of this resistance area strengthened the bullish pressure on Platinum.
Given the predominant daily uptrend, Platinum can be expected to rise further to the next round resistance level 2000.00 (target price for the completion of the active impulse wave (5)).
Silver Wave Analysis
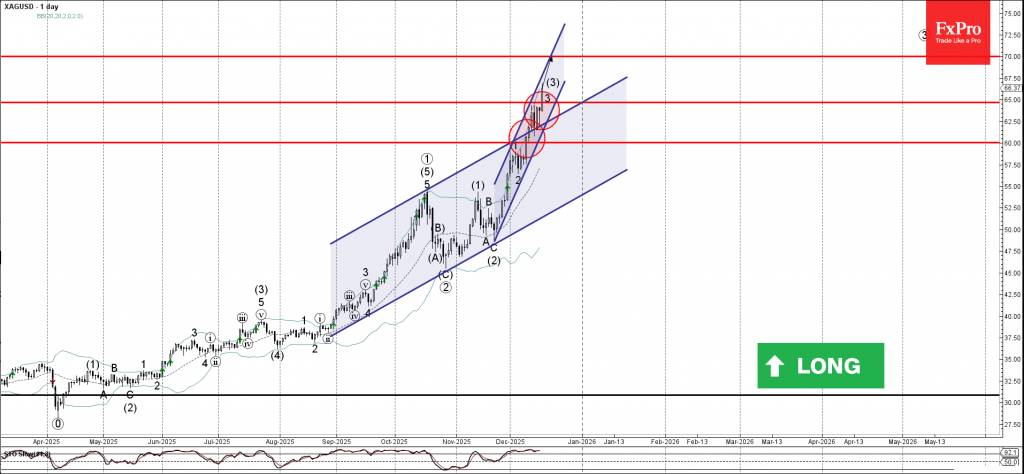
Silver: ⬆️ Buy
– Silver broke resistance zone
– Likely to rise to resistance level 70.00
Silver recently broke the resistance zone between the resistance levels 60.00 and 65.00 as well as the resistance trendline of the daily up channel from August.
The breakout of this resistance zone accelerated the active short-term impulse wave 3 of the intermediate impulse wave (3) from the end of November.
Given the strong daily uptrend, Silver can be expected to rise further to the next round resistance level 70.00 (target price for the completion of the active impulse wave (3)).
Metals Explode: Silver (XAG/USD) Hits Record $66 as Platinum (XPT/USD) Breaks 2011 Highs
The Debasement Trade continues to roar today.
Despite slowing inflows into Cryptocurrencies and Stocks sending mixed signals since Friday, Metals are shining bright.
As observed in our Overnight brief, Silver has exploded to yet another fresh record at $66, surpassing targets explored in our pre-FOMC analysis. There are some technical warnings arising however,
Platinum is also profiting massively from these inflows, finally breaking its 2011 highs of $1,915.
More rare than Gold, the White Metal is now standing just 15% away from its 2008 All-Time Highs ($2,300) and appears on track to test that historic level.
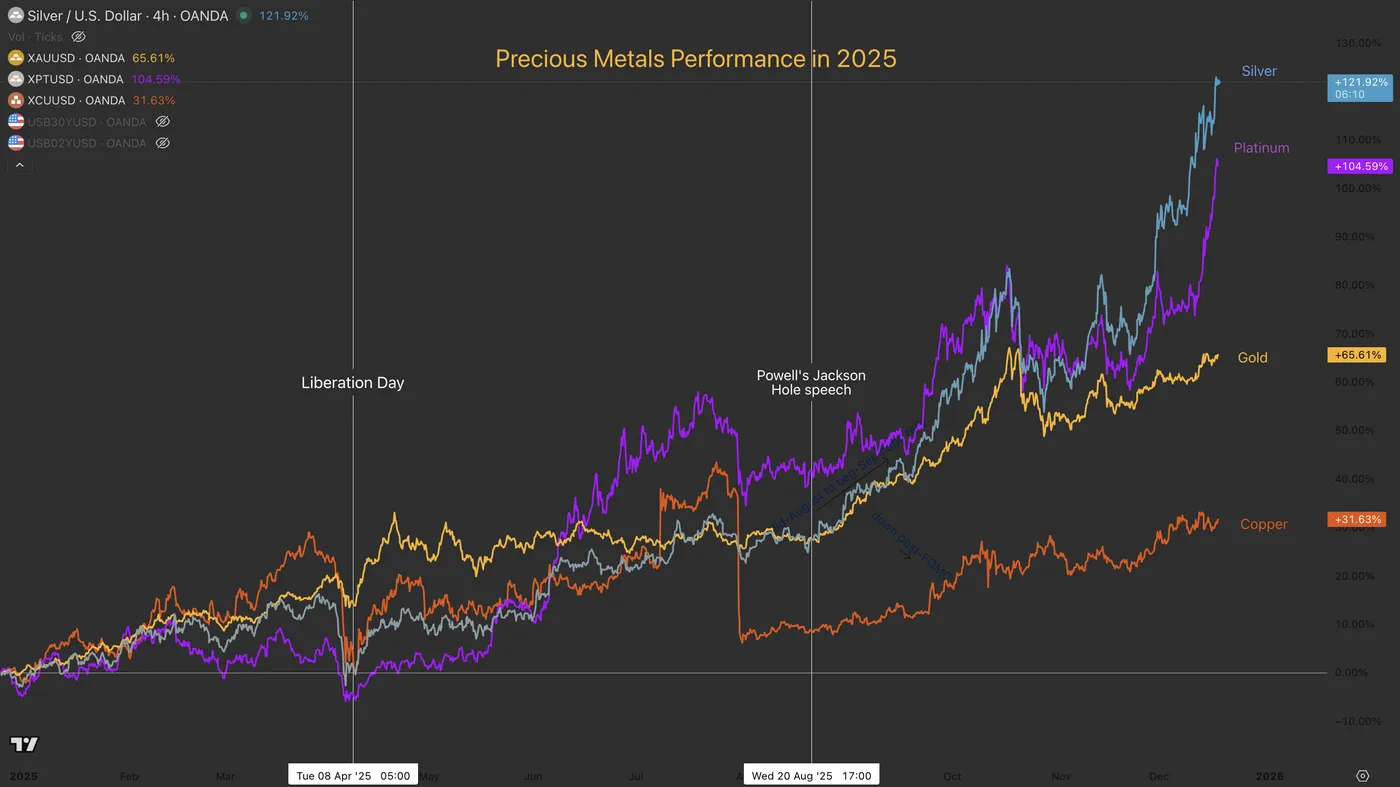
Metal Performance in 2025. December 17, 2025 – Source: TradingView. Spot the accelerations after Liberation Day and Powell's Jackson Hole Speech.
Why are metals rallying again?
The answer lies in the aftermath of the recent Non-Farm Payrolls report.
While the Unemployment Rate ticked higher, overall employment levels still do not guarantee a Fed cut in January. This policy ambiguity, combined with lingering doubts regarding the future path of the economy, is bolstering demand for precious metals as primary safe havens amidst the uncertainty.
However, the picture may only clear up after tomorrow's high-importance CPI report.
Let's dive into a multi-timeframe analysis (Monthly and Intraday) of Silver and Platinum to spot what technical levels and signals are arising.
Silver (XAG/USD) Monthly Chart
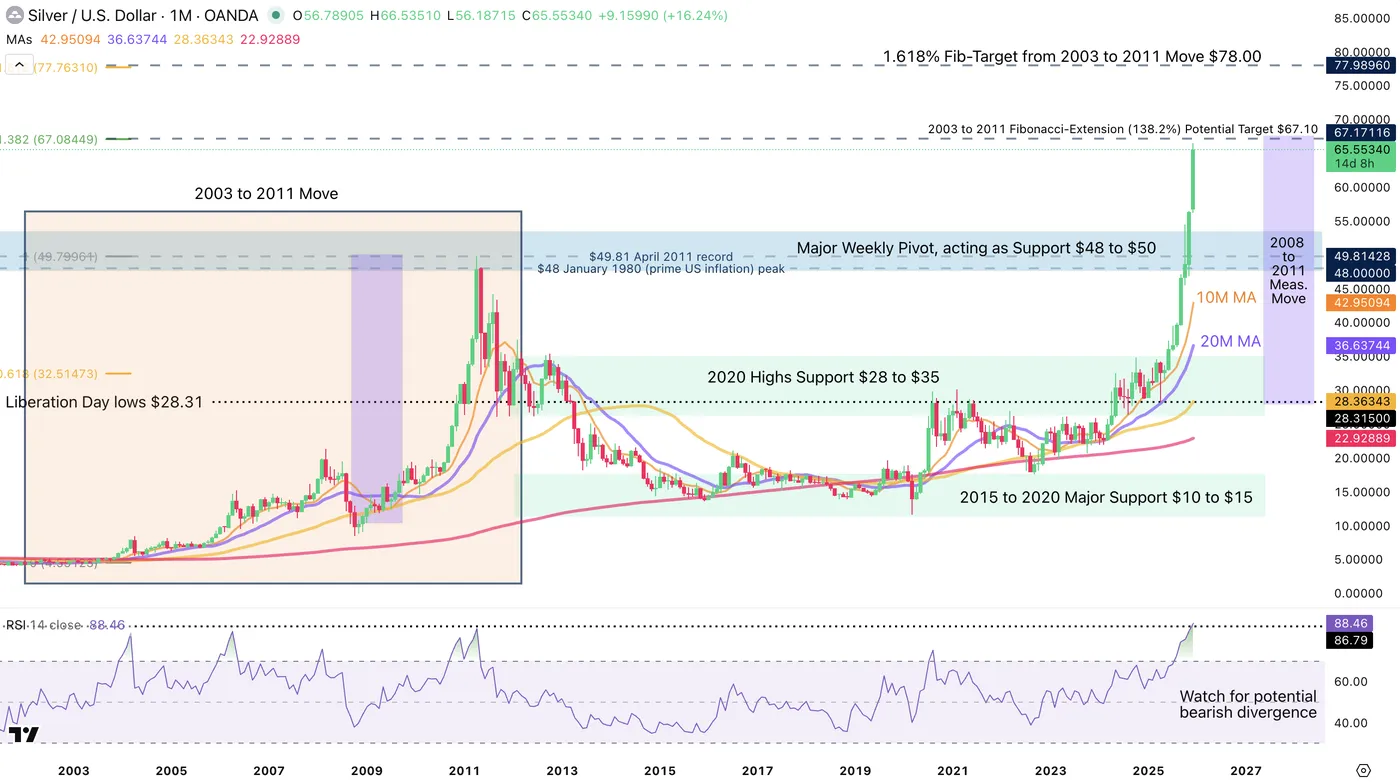
Silver (XAG/USD) Monthly Chart. December 17, 2025 – Source: TradingView
Silver is exploding to its record prices in quite a high fashion.
The Monthly chart offers a stellar view of how significant the move is.
Up 100% since June, what recently were historic peaks are now far-away.
The $48 to $53 zone acts as a major high timeframe pivot of the price action in the event of any retracement.
Moving below could trigger a huge bearish event, while holding above in a retest would allow for a significant dip-buying opportunity.
Keep an eye on Weekly RSI bearish divergence if a top forms anywhere near current levels.
A Fibonacci-Extension from the 2003 to 2011 could point to $67.10 potentially acting as major resistance, particularly with the current breakout reaching similar stretches as the 2008-2011 move (purple squares)
Silver (XAG/USD) 4H Chart and Technical Levels
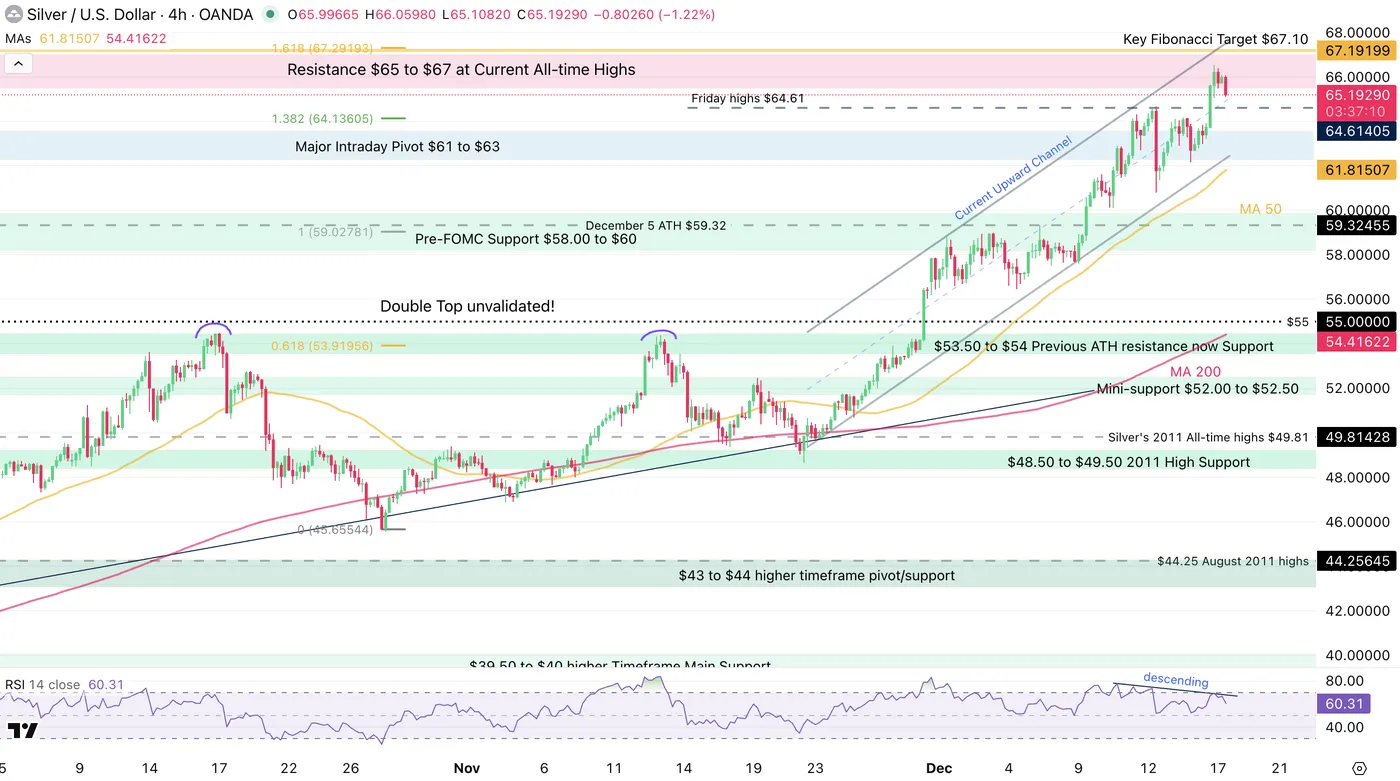
Silver (XAG/USD) 4H Chart. December 17, 2025 – Source: TradingView
Silver is still evolving within its intraday upward channel.
Keep an eye on how it reacts to its boundaries. Currently at its highs, some profit-taking (Selling) flows could arise.
Naturally, watch for a potential breakout to the upside or downside depending on tomorrow's CPI!
Levels to watch for Silver (XAG/USD) trading:
Resistance Levels:
- Resistance $65 to $67 at Current All-time Highs
- Key Fibonacci Target $67.10
- 1.618% Potential Fib-Target from 2003 to 2011 Move $78.00
- $66.53 session highs
Support Levels:
- Major Intraday Pivot $61 to $63
- Pre-FOMC Support $58.00 to $60
- $53.50 to $54 Previous ATH resistance now Support
- Major Weekly Pivot, acting as Support $48 to $50
- $45 October Lows
Platinum (XPT/USD) Monthly Chart
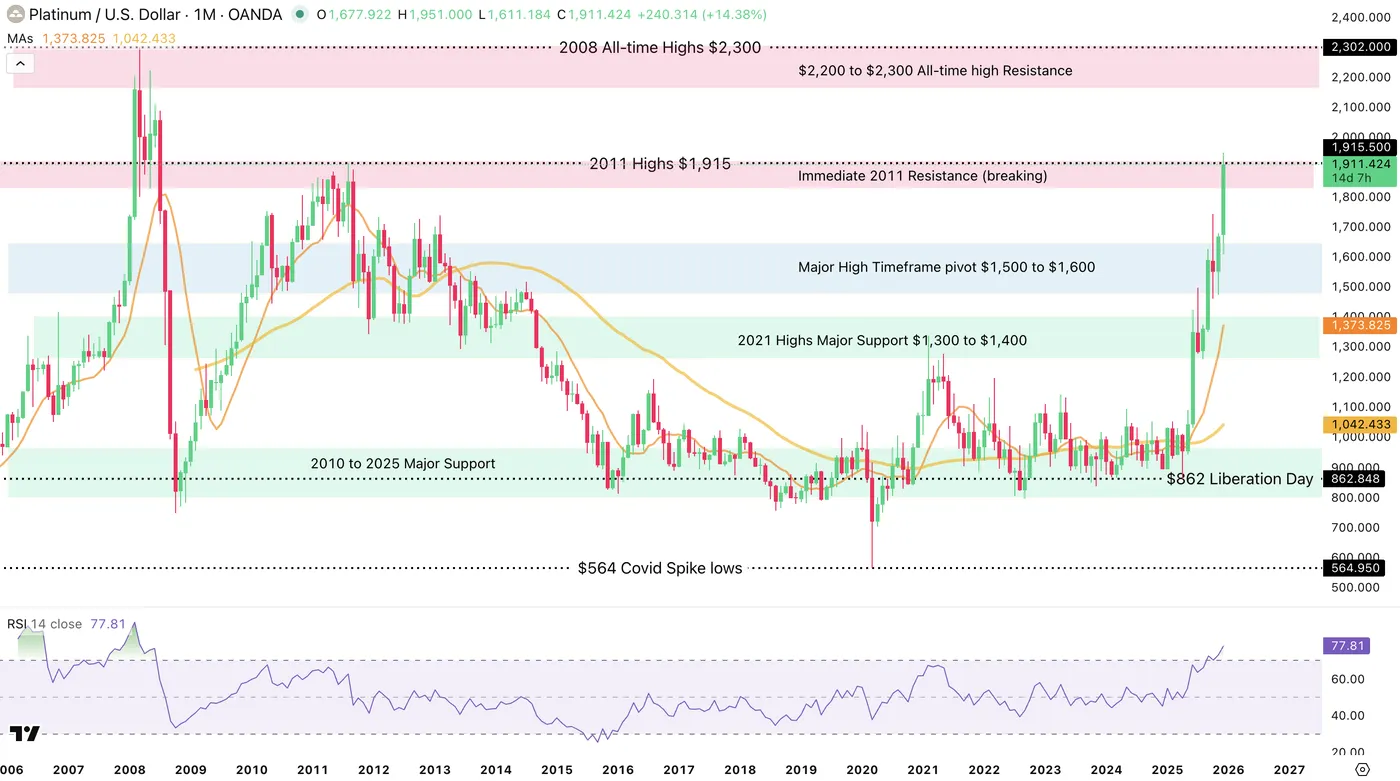
Platinum (XPT/USD) Monthly Chart. December 17, 2025 – Source: TradingView
Platinum is a late bloomer within the current Metal Supercycle, but it's catching up to its peers quite fast.
Our previous analysis of the Metal pointed to the idea of Platinum potentially catching up to Gold. Necessary for many technological developments, its demand should keep increasing throughout the years – But what prevents it from reaching similar levels to Gold is Central Bank demand (A huge fundamental boost to all metals since 2025).
After stalling its ascent while Silver and Gold advanced, bulls are now breaking above its 2008 highs.
Inflows into the metal are still dependent on other metals such as Gold or Silver advancing further, but XPT/USD could offer a very interesting option for those who missed the rally in the yellow and grey precious metals.
From what it looks like, the current rally is occurring on these flows. To get more details of Platinum fundamentals, I strongly invite you to check out our End-November analysis.
Platinum (XPT/USD) 4H Chart and Technical Levels

Platinum (XPT/USD) 4H Chart. December 17, 2025 – Source: TradingView
XPT/USD has broken out to the upside from its 2025 ascending channel.
The ongoing move is a very strong one (look at how steep the current uptrend is.)
Some small profit-taking flows are occurring at overbought levels, indicative of a prompt retracement – The new 14 year highs are at $1,950 and breaking higher would see no resistance until $2,050 to $2,100.
For dip-buyers, keep a close look at how the metal reacts to the retest of the 2025 highs upper bound at $1,850.
The same occurred in Silver and led to a 100% move since.
Platinum Technical Levels to keep on your charts:
Resistance levels
- Immediate Resistance at 2011 Highs $1910 to $1,950 (breaking?)
- Session highs $1,950
- May 2008 Pivotal Resistance $2,050 to $2,100
- $2,300 2008 All-time highs
Support levels
- 2025 Channel upper bound $1,850 (Mini-Support)
- 2013 and Current year highs $1,700 to $1,750
- $1,620 to $1,650 FOMC Support
- Major High Timeframe pivot $1,500 to $1,600
Safe Trades!
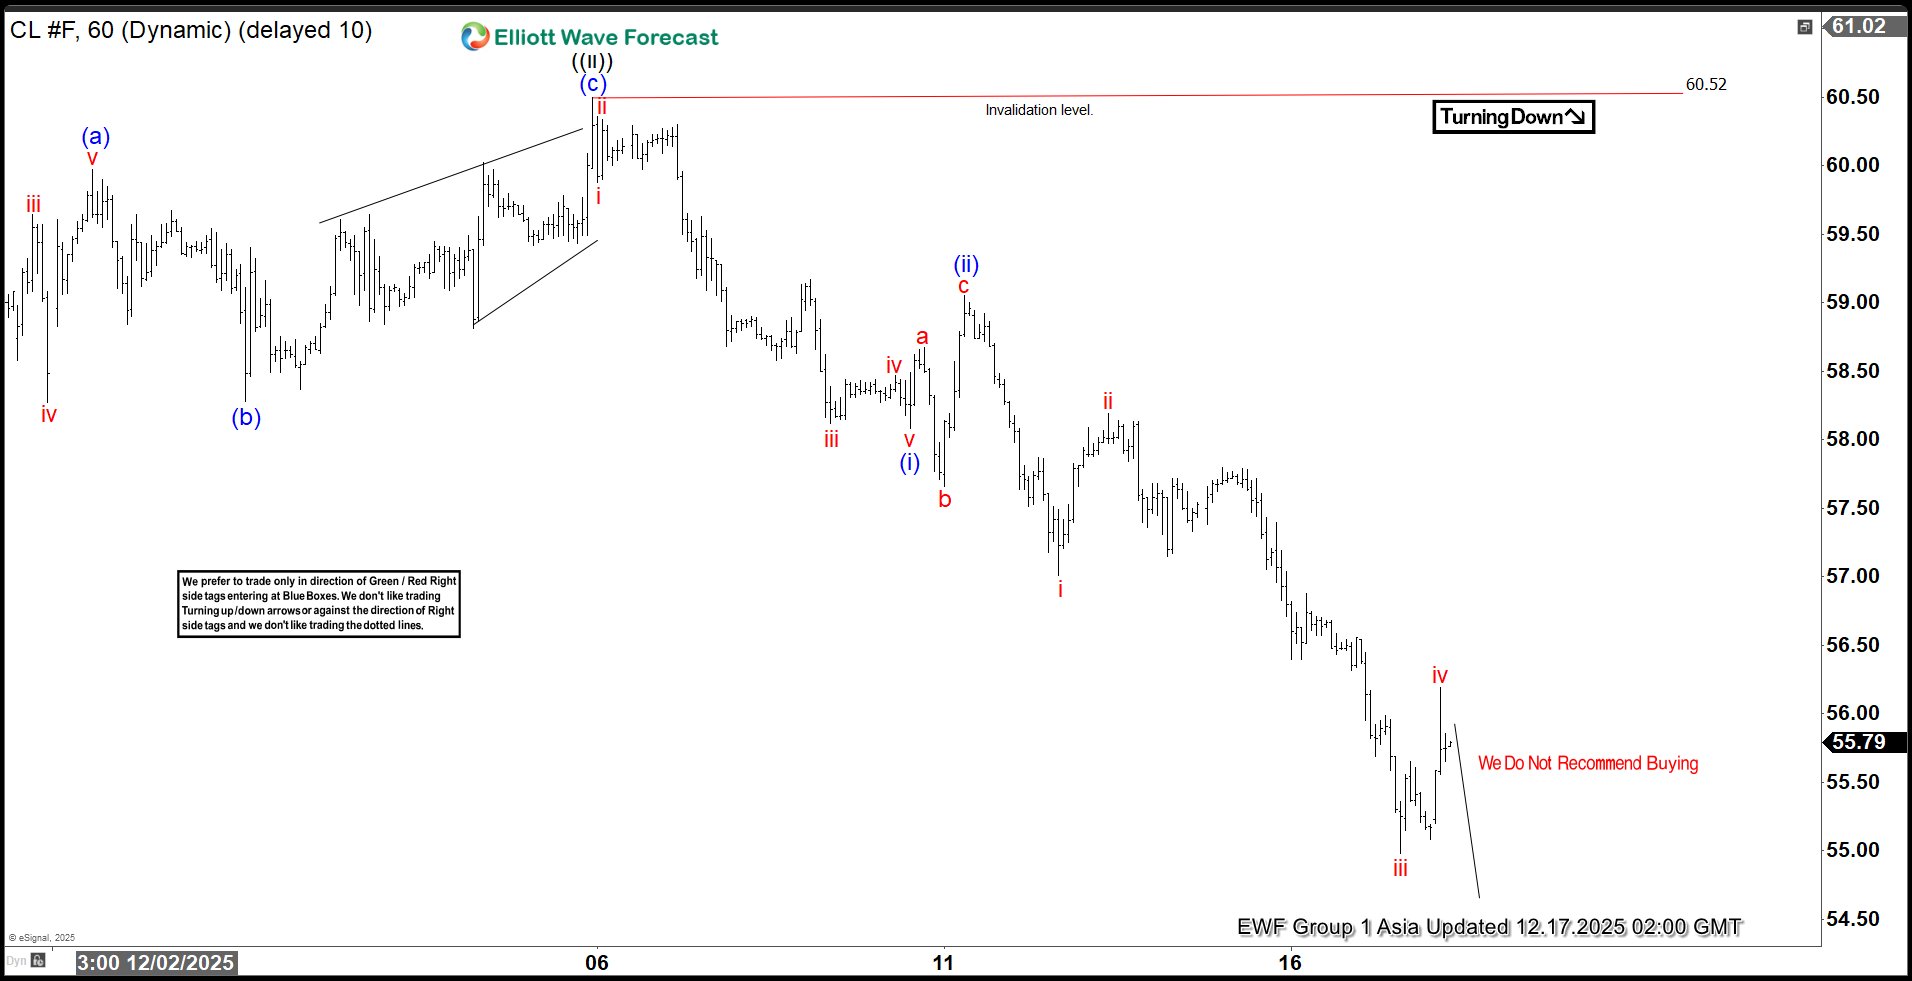
Bearish Sequence Pressures Oil (CL) Lower
Light Crude Oil (CL) has decisively broken below the April 2025 low of $55.12. This breach confirms a continuation of the bearish sequence that has persisted since the March 2022 peak. The short-term decline from the October 24, 2025 high is unfolding in the form of a five-wave Elliott Wave impulse, which provides a clear structural framework for the ongoing weakness.
From the October 24 peak, wave ((i)) concluded at $57.10. The subsequent rally in wave ((ii)) developed as a zigzag Elliott Wave structure. Within this corrective phase, wave (a) terminated at $59.97, wave (b) ended at $58.28, and wave (c) advanced to $60.50. This final push completed wave ((ii)) at a higher degree, setting the stage for renewed downside pressure.
Oil then turned lower in wave ((iii)). From the termination of wave ((ii)), wave (i) ended at $58.08, while the rally in wave (ii) reached $59.05. The decline in wave (iii) is now progressing as an impulse of lesser degree. Within this sequence, wave i ended at $57.01, wave ii rallied to $58.19, and wave iii dropped sharply to $54.98. A corrective bounce in wave iv extended to $59.19, but momentum remains tilted to the downside. Near term, as long as the pivot at $60.50 holds firm, rallies are expected to fail in corrective sequences of three, seven, or eleven swings. This technical condition suggests further weakness ahead, reinforcing the broader bearish outlook for crude oil prices.
Light Crude Oil (CL) 60-Minute Elliott Wave Chart From 12.17.2025
CL Elliott Wave Video:
https://www.youtube.com/watch?v=WVXexahQ3pw