Sample Category Title
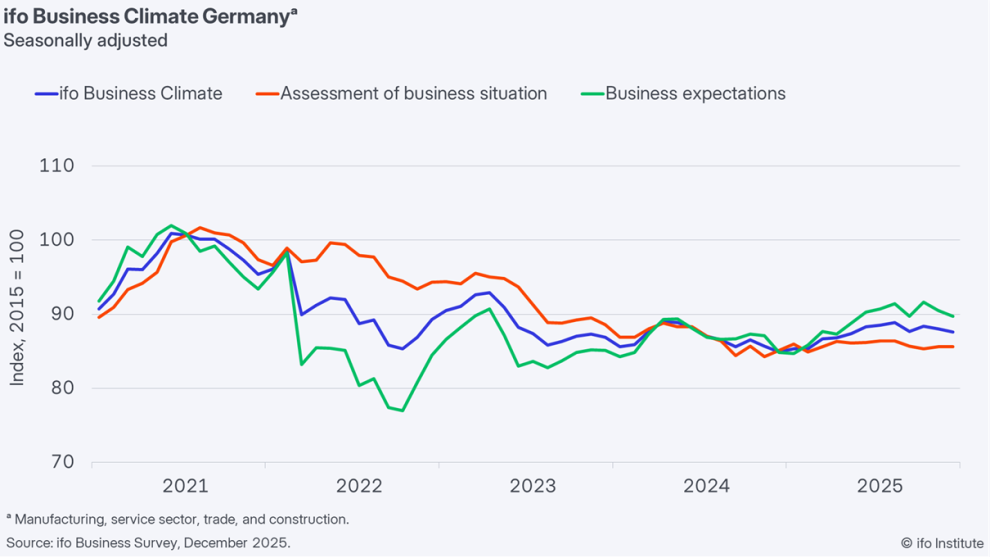
German Ifo sentiment falls to 87.7, ends year on downbeat note
Germany’s Ifo survey delivered weaker-than-expected readings in December, confirming that business confidence remains under strain. The headline Business Climate index fell to 87.7 from 88.0, missing forecasts of 88.5. Current Assessment remained unchanged at a subdued 85.6. Expectations also softened to 89.7, pointing to a more cautious outlook.
Sector-level details showed little relief. Manufacturing confidence deteriorated further from -13.8 to -14.8. Services sentiment turned negative again fro 0.6 to -2.1. Trade conditions weakened from -22.6 to -24.6. Construction remained stuck at deeply negative levels of -15.2.
According to Ifo, the year is ending "without any sense of optimism". The combination of weak current conditions and declining expectations suggests Germany is struggling to build momentum heading into the new year.
BoJ Preview: Interest Rate Hike Baked in, What’s Next for JPY (Further Appreciation)?
Key elements
BoJ hike is fully priced, normalization to continue: Markets assign a ~94% probability to a 25bp BoJ hike to 0.75%, backed by firm wage growth, improving consumer confidence, and strong Tankan sentiment—pointing to further gradual tightening into 2026.
Policy divergence favours JPY structurally: A December hike would underscore the BoJ as the lone major central bank tightening while the Fed eases, reinforcing medium-term appreciation bias for the yen.
USD/JPY near-term bias turns bearish: Technicals signal fading upside momentum; below 156.10, risks skew toward a pullback toward 154.40 and lower, with rallies vulnerable unless resistance is decisively cleared.
The short-term overnight interest rate swap market in Japan has already priced in a high chance of 94% chance that the Bank of Japan (BoJ) will hike for the second time this year (within its current gradual normalization monetary policy stance) by 25 basis points this Friday, 19 December to bring the overnight policy rate to 0.75%, the highest level in 30 years.
A move on Friday would cement the BOJ’s status as the only major central bank raising rates this year. It would also mark the first instance since the BOJ adopted its two-day meeting format in 1998 that it and the Federal Reserve move policy rates in opposite directions within the same month.
Rising wages, consumer confidence, and Tankan business sentiment
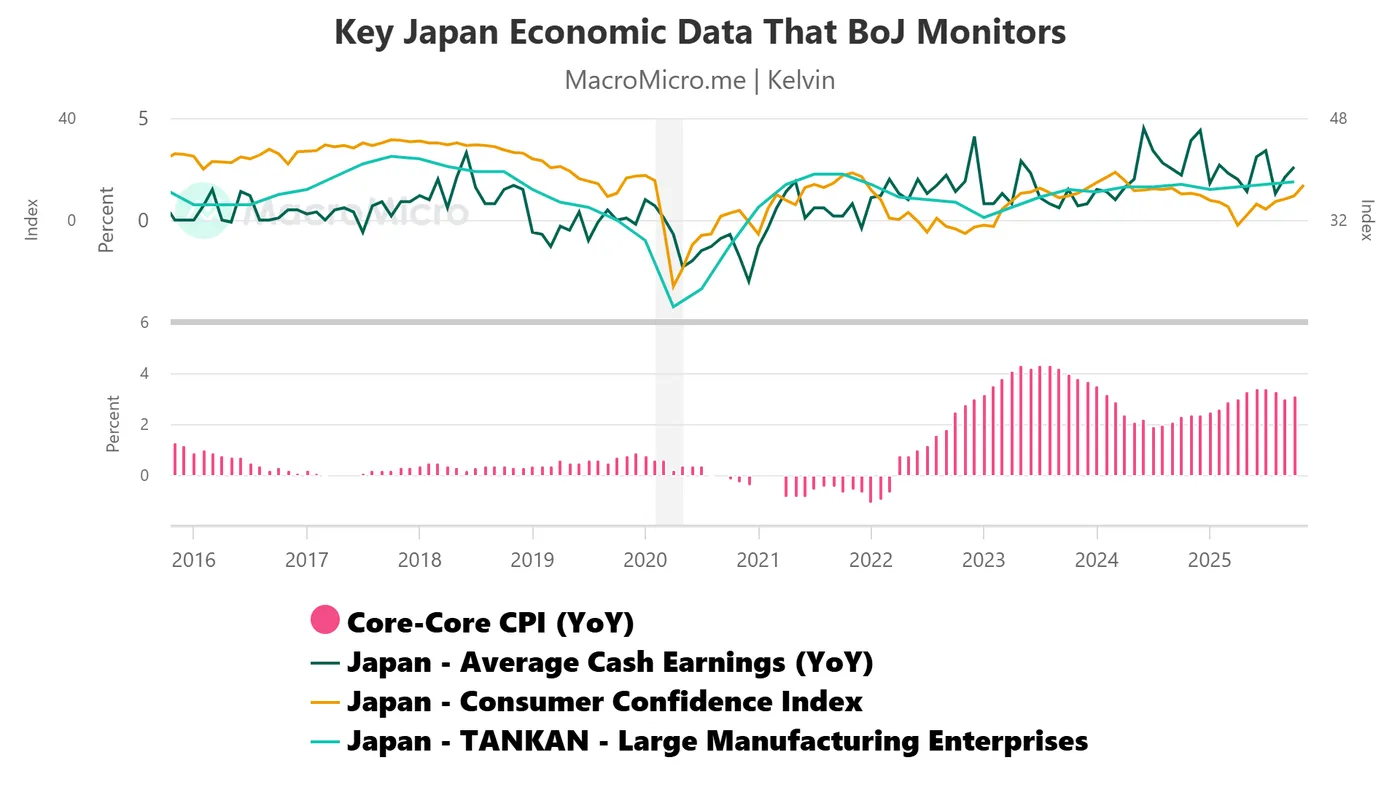
Fig. 1: Key Japan economic data that BoJ watches as of 15 Dec 2025 (Source: MacroMicro)
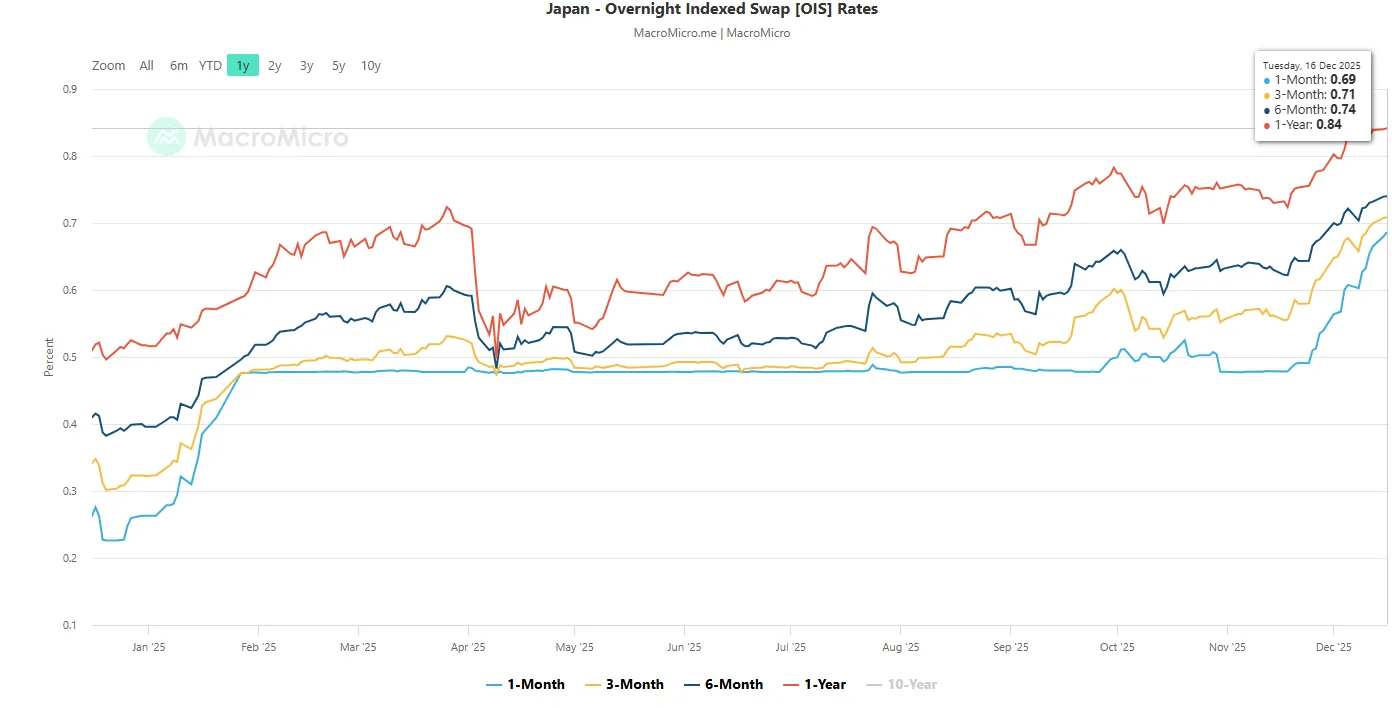
Fig. 2: Japan overnight indexed swap rates as of 16 Dec 2025 (Source: MacroMicro)
On top of BoJ Governor Ueda’s recent hawkish remarks on the justification to maintain the BoJ’s stance of gradual interest rate rises, several key economic data points other than the core-core CPI trend (excluding fresh food and energy) that the BoJ monitors have flashed out “all clear” signs to enact another rate hike after an 11-month pause since January’s hike.
The latest Q4 Tankan business sentiment survey for large manufacturing companies operating in Japan has risen to almost a 3-year high at 15.0. The mood of Japanese consumers has also improved since April 2025, when consumer sentiment rose to a 19-month high of 37.50 in November 2025 (see Fig. 1).
In addition, the latest BoJ’s report on wages published on Monday, 15 December 2025, has indicated that a firm wage growth momentum is likely to continue into the new fiscal year of 2026 at the same average growth rate of 5.25% in fiscal year 2025 as secured by Rengo, the largest trade union confederation in Japan.
Hence, the BoJ is likely to continue its gradual interest rate hike cycle into 2026, as priced in by the interest rate swap market. The 1-year overnight-indexed swap rate has increased to 0.84% as of 16 December 2025 (see Fig. 2).
Let’s now uncover the potential short-term directional movement of the USD/JPY from a technical analysis perspective.
Preferred trend bias (1-3 days) of USD/JPY – Bearish below 156.10
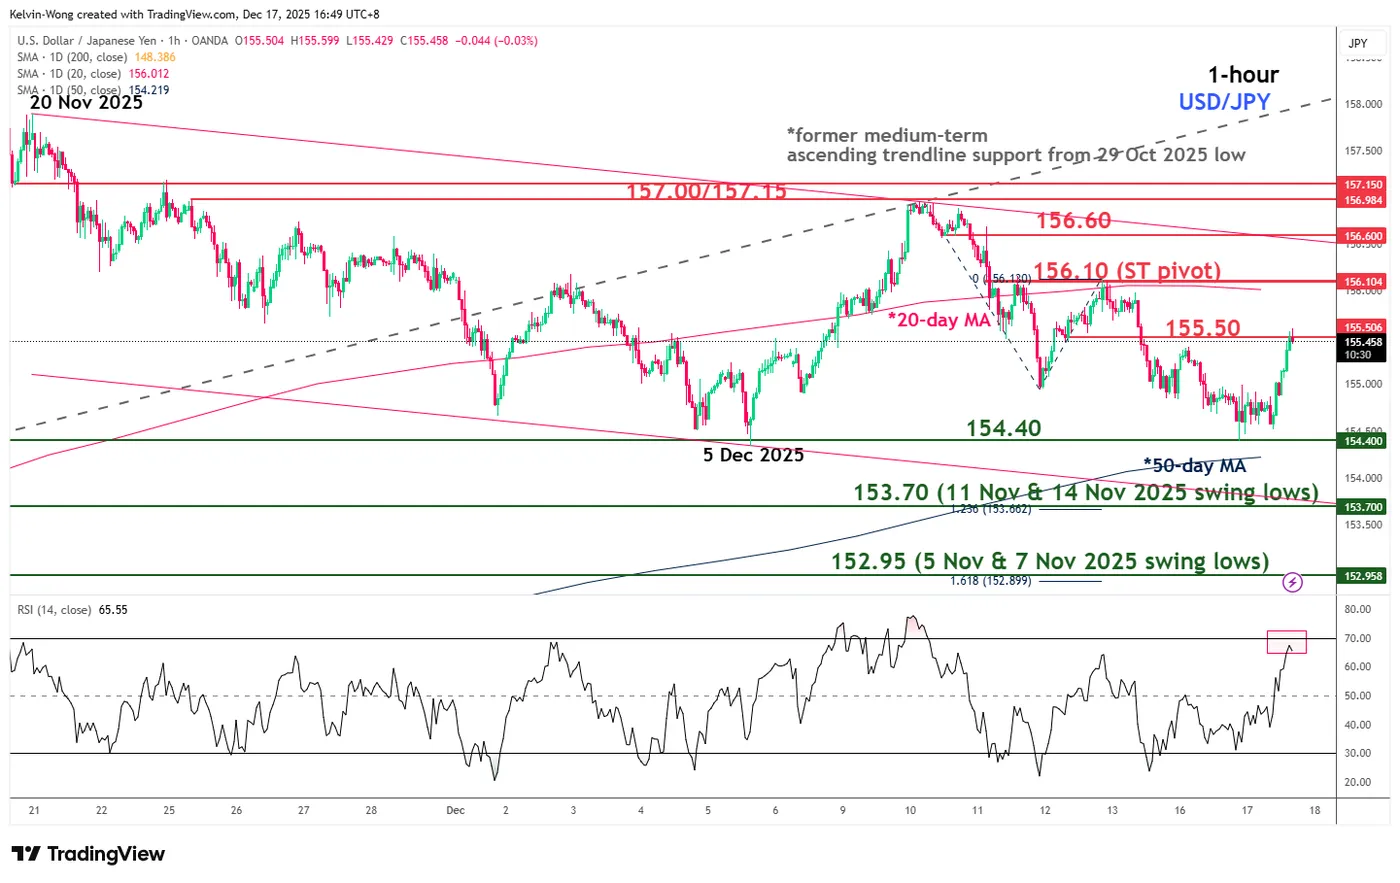
Fig. 3: USD/JPY minor trend as of 17 Dec 2025 (Source: TradingView)
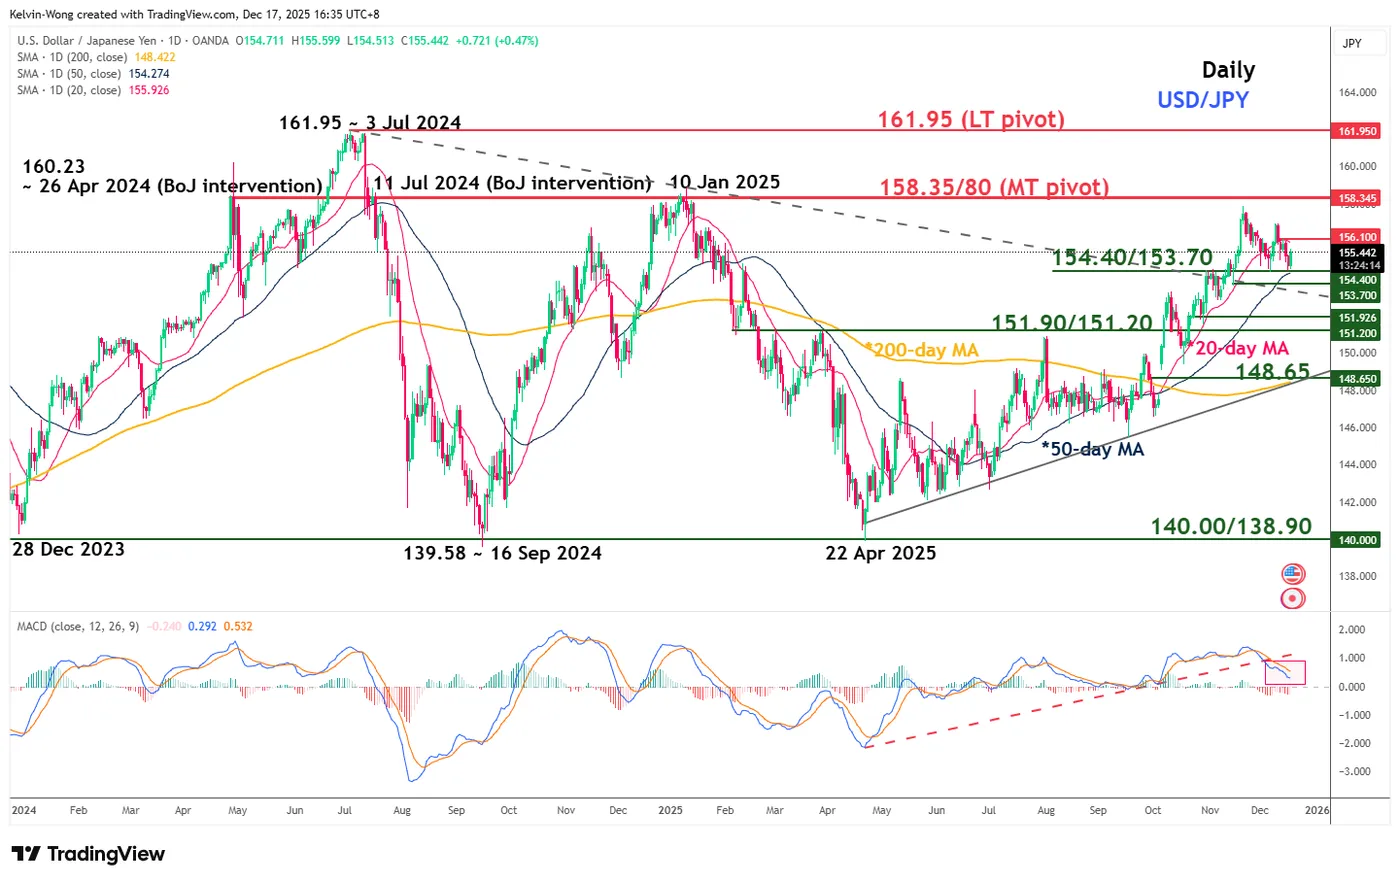
Fig. 4: USD/JPY medium-term & major trends as of 17 Dec 2025 (Source: TradingView)
The USD/JPY has continued to oscillate within a minor descending channel that has been in place since reaching a 10-month high of 157.90 on 20 November 2025.
Bearish bias below 156.10 key short-term pivotal resistance, and a break below 154.40 near-term support resumes the minor bearish impulsive down move sequence to expose the next intermediate supports at 153.70 and 152.95 (see Fig. 3).
Key elements
- The daily MACD trend indicator of the USD/JPY has staged a bearish breakdown below a key ascending support on 4 December 2025 and is trending downwards steadily towards its centre line (see Fig. 4).
- These observations from the daily MACD trend indicator suggest the multi-month up move of the USD/JPY from April 2025 low to November 2025 high is at a rising risk of a trend change towards a bearish bias (see Fig. 4).
- The hourly RSI on USD/JPY is rapidly approaching overbought territory (above 70), signalling that the rebound seen during the Asia session on Wednesday, 17 December 2025, is likely to lose bullish momentum in the near term (see Fig. 3).
Alternative trend bias (1 to 3 days)
A clearance above 156.10 invalidates the bearish bias on the USD/JPY to see a further potential squeeze up to retest the next intermediate resistances at 156.60 and 157.00/157.15.
Silver Hits Record High on Demand and Data
On Wednesday, silver surged past 66 USD per ounce, setting a new all-time high. The rally was driven by a mixed US employment report, which sparked investor interest in alternative high-return assets for portfolio diversification.
The November labour market data revealed the unemployment rate climbing to 4.6% – its highest level since 2021 – even as job creation exceeded expectations.
Silver’s year-to-date gain of nearly 130% is further supported by declining inventories and robust demand from both retail investors and industrial users. In particular, expanding sectors such as solar energy, electric vehicles, and data centres are driving increased industrial consumption.
Technical Analysis: XAG/USD
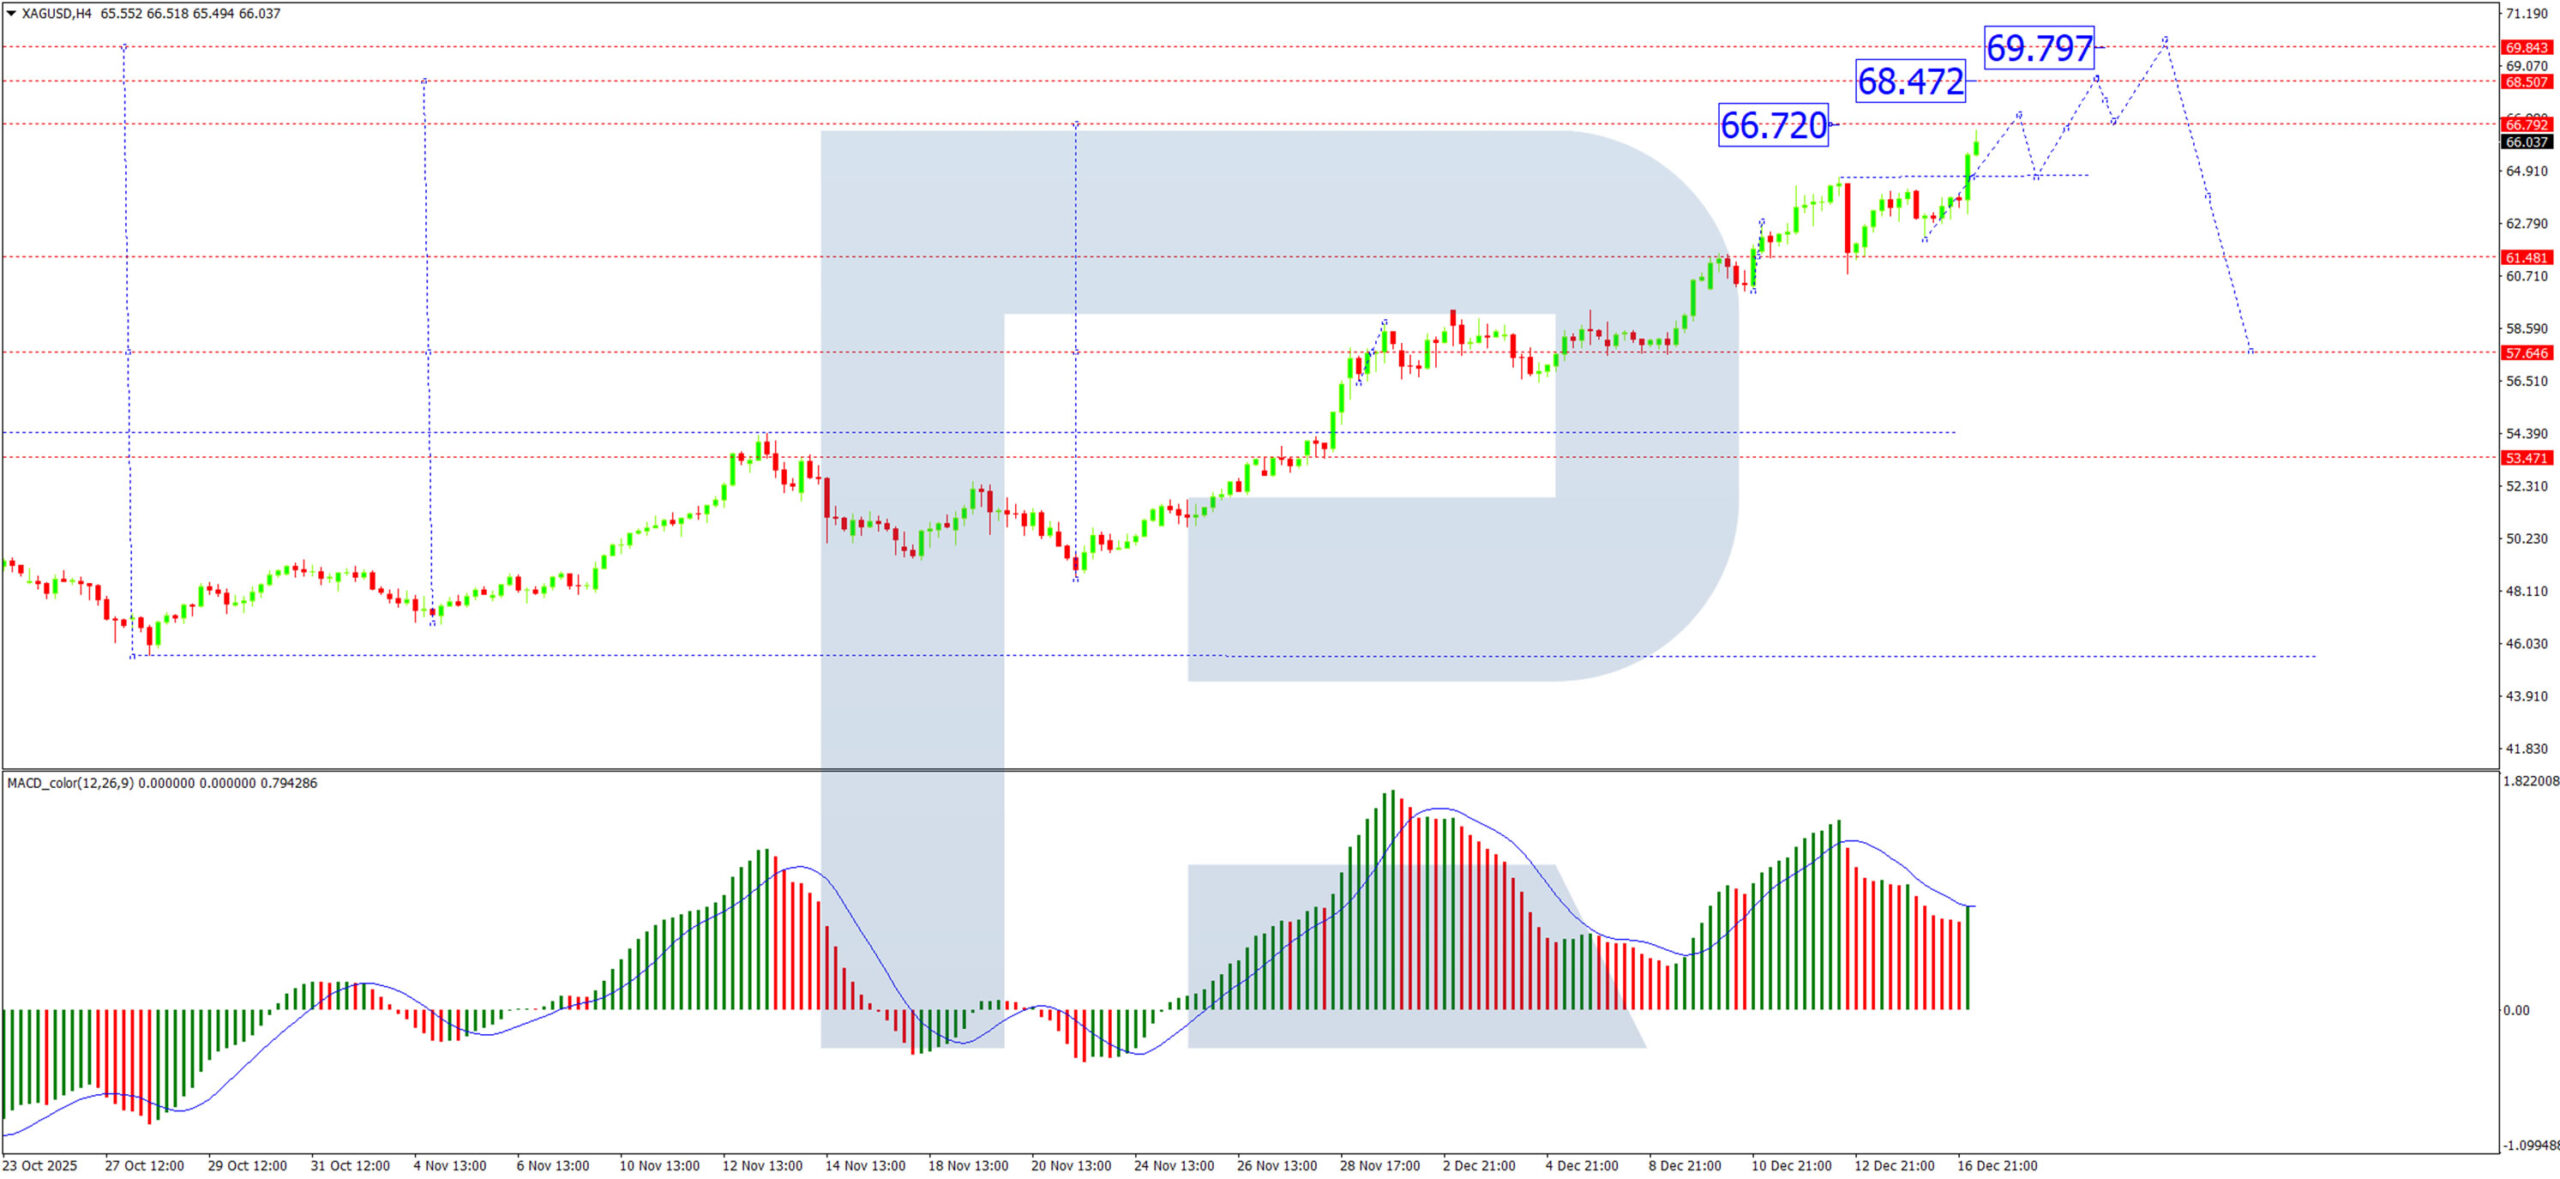
H4 Chart:
On the H4 chart, XAG/USD established a consolidation range around 57.65 USD. Following an upward breakout, the market has extended to 66.72 USD, with scope for further gains towards 69.79 USD. Having completed a growth impulse to 66.51 USD, a minor correction towards 64.64 USD appears possible before the uptrend resumes.
The MACD indicator supports the bullish outlook, with its signal line firmly above zero, indicating sustained upward momentum.
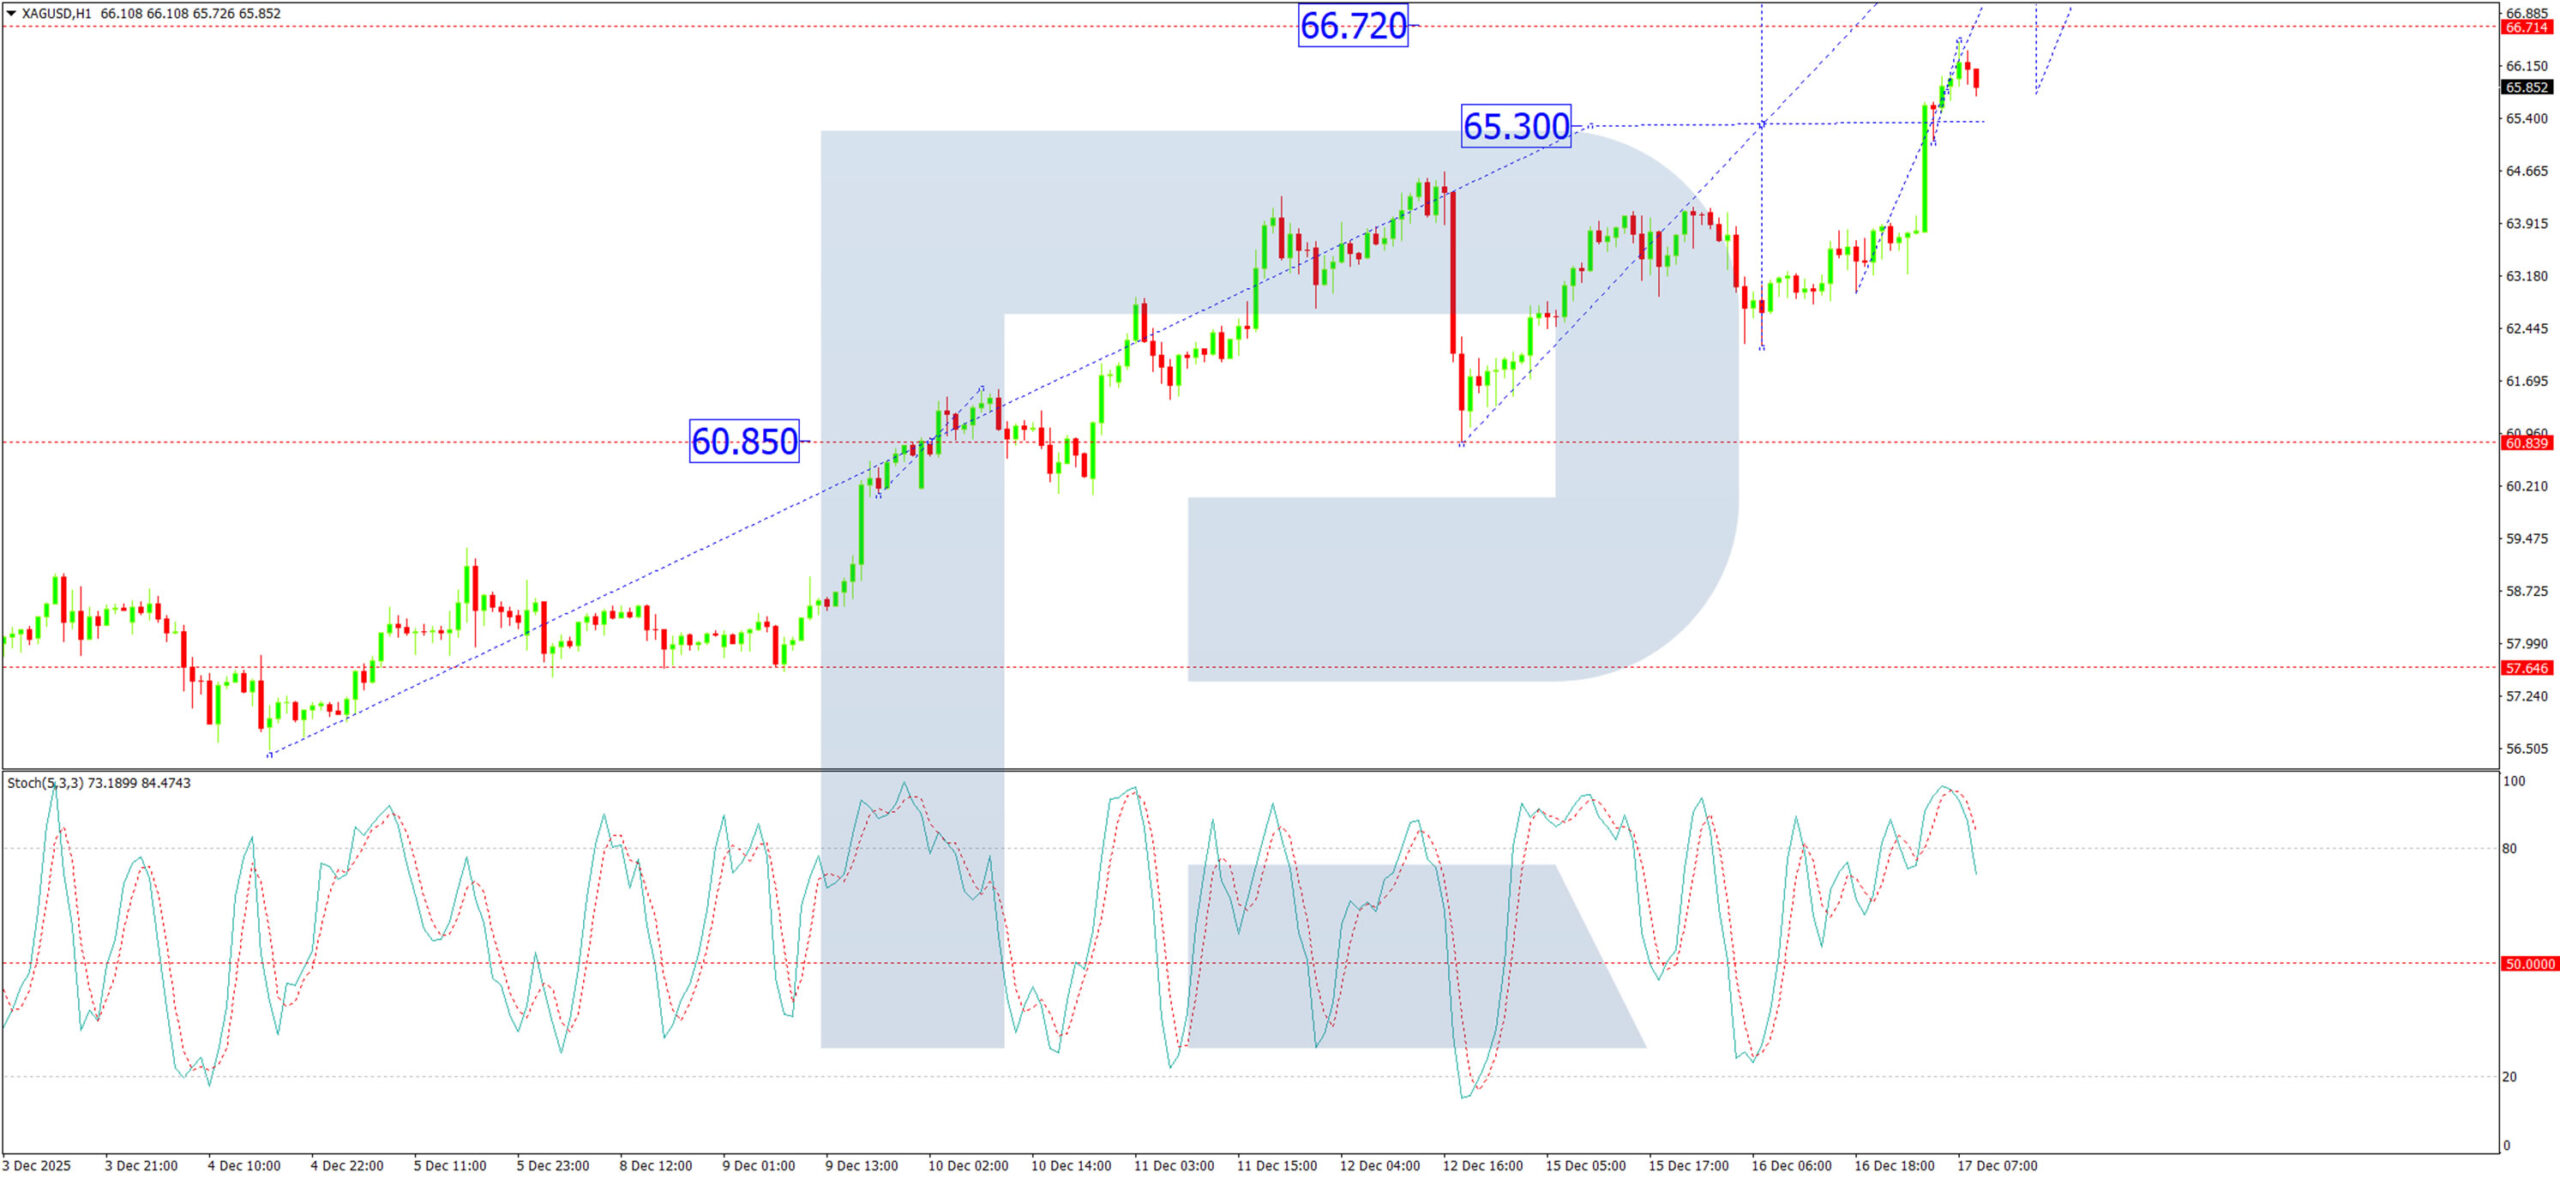
H1 Chart:
On the H1 chart, silver completed a growth wave to 65.30 USD and has since formed a consolidation range around this level. An upward breakout has extended the move to 66.51 USD. A technical pullback towards 65.65 USD may occur; a break below this level could extend the correction towards 60.85 USD. Conversely, a rebound from 65.65 USD would favour a continuation of the uptrend toward 66.72 USD.
The Stochastic oscillator aligns with this view, with its signal line above 80 and trending upward, though nearing overbought territory.
Conclusion
Silver’s record rally reflects strong fundamentals – tightening supply, robust industrial demand, and its appeal as a hedge amid economic uncertainty. While the near-term trend remains bullish, the market is approaching overextended levels, increasing the likelihood of a short-term correction. Key support lies around 65.65 USD, with a break below potentially signalling a deeper pullback. Until then, the momentum favours further tests towards 66.72 USD and possibly 69.79 USD.
GBP/USD Back In Demand as USD/CAD Slides Further
GBP/USD started a fresh increase above 1.3350 and 1.3400. USD/CAD declined and is now consolidating losses below 1.3800.
Important Takeaways for GBP/USD and USD/CAD Analysis Today
- The British Pound is eyeing more gains above 1.3430.
- There is a key bullish trend line forming with support at 1.3390 on the hourly chart of GBP/USD at FXOpen.
- USD/CAD started a fresh decline after it failed to stay above 1.3800.
- There is a connecting bearish trend line with resistance at 1.3780 on the hourly chart at FXOpen.
GBP/USD Technical Analysis
On the hourly chart of GBP/USD at FXOpen, the pair formed a base above the 1.3300 level. The British Pound started a steady increase above 1.3350 against the US Dollar, as discussed in the previous analysis.
The pair gained strength above 1.3380 and the 50-hour simple moving average. It even cleared the 1.3400 handle and tested 1.3450. It is now consolidating gains below 1.3430. There was a minor pullback below the 50% Fib retracement level of the upward move from the 1.3354 swing low to the 1.3456 high, and the RSI dipped below 50.
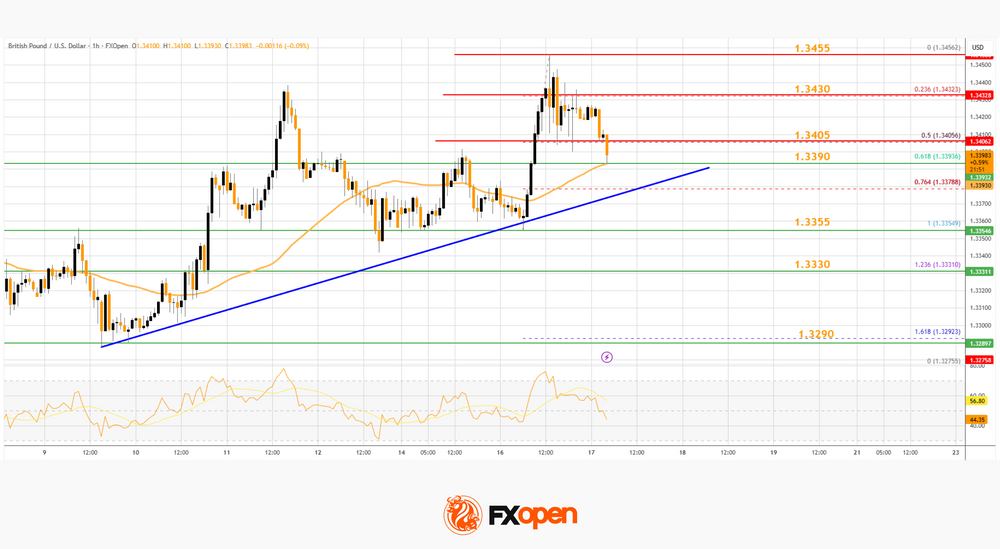
However, there is a key bullish trend line forming with support at 1.3390. On the upside, the bulls face resistance near 1.3405 on the GBP/USD chart. The first major hurdle could be 1.3430.
An upside break above 1.3430 could send the pair toward 1.3455. Any more gains might open the doors for a test of 1.3500. If there is a downside correction, immediate support is near the 1.3390 level, the trend line, the 61.8% Fib retracement, and the 50-hour simple moving average.
The first major area of interest for the bulls could be near 1.3355. The next pivot level sits near 1.3330. If there is a break below 1.3330, the pair could extend the decline. In the stated case, the pair could drop and test 1.3290. Any more losses might call for a move toward 1.3250.
USD/CAD Technical Analysis
On the hourly chart of USD/CAD at FXOpen, the pair climbed toward 1.3880 before the bears appeared. The US Dollar formed a swing high near 1.3872 and recently declined below 1.3800 against the Canadian Dollar.
There was also a close below the 50-hour simple moving average and 1.3780. The bulls are now active near 1.3730, but they might fail to protect more losses. If there is an upside correction, the pair could face resistance near 1.3780 and a connecting bearish trend line.
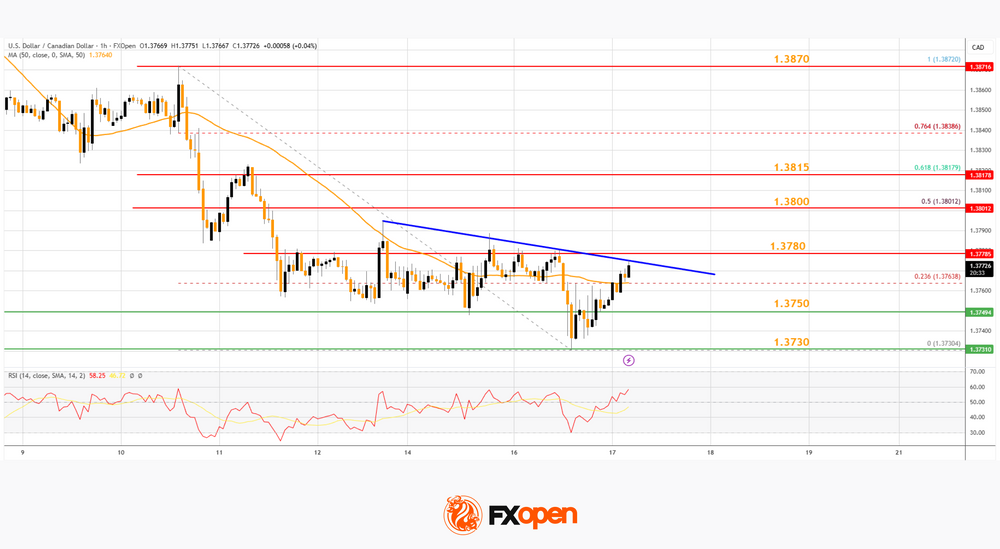
An upside break above the trend line might send the pair toward the 50% Fib retracement level of the downward move from the 1.3872 swing high to the 1.3730 low.
The next key hurdle on the USD/CAD chart is near the 61.8% Fib retracement at 1.3815. If there is a close above 1.3815, the pair could rise toward 1.3870. The next major sell zone is 1.3900, above which it could rise steadily toward the 1.4000 handle.
Immediate support is near the 1.3750 level. The first major area of interest for the bulls could be 1.3730. A close below the 1.3730 level might trigger a strong decline. In the stated case, USD/CAD might test 1.3650. Any more losses may possibly open the doors for a drop toward 1.3600.
Trade over 50 forex markets 24 hours a day with FXOpen. Take advantage of low commissions, deep liquidity, and spreads from 0.0 pips. Open your FXOpen account now or learn more about trading forex with FXOpen.
This article represents the opinion of the Companies operating under the FXOpen brand only. It is not to be construed as an offer, solicitation, or recommendation with respect to products and services provided by the Companies operating under the FXOpen brand, nor is it to be considered financial advice.
Dollar Index (DXY) Rebounds from a Two-Month Low
A week ago, we:
→ updated a system of two trend channels;
→ identified signs of selling pressure dominance;
→ outlined a scenario in which price could slide towards the lower boundary of the blue channel, potentially acting as key support.
As the arrow on the chart shows, this scenario largely played out:
→ The US dollar index fell to a two-month low yesterday. The decline was driven by economic news, including weak US housing data. Both housing starts and building permits came in below expectations, reinforcing the view that the US economy is losing momentum.
→ Today, the DXY is rebounding sharply amid sterling weakness, after UK consumer price index (CPI) data revealed a sharp slowdown in inflation to 3.2%, versus a 3.5% forecast.
From a technical perspective, the price action points to a fairly aggressive bullish reversal from the lower boundary of the ascending channel. In particular:
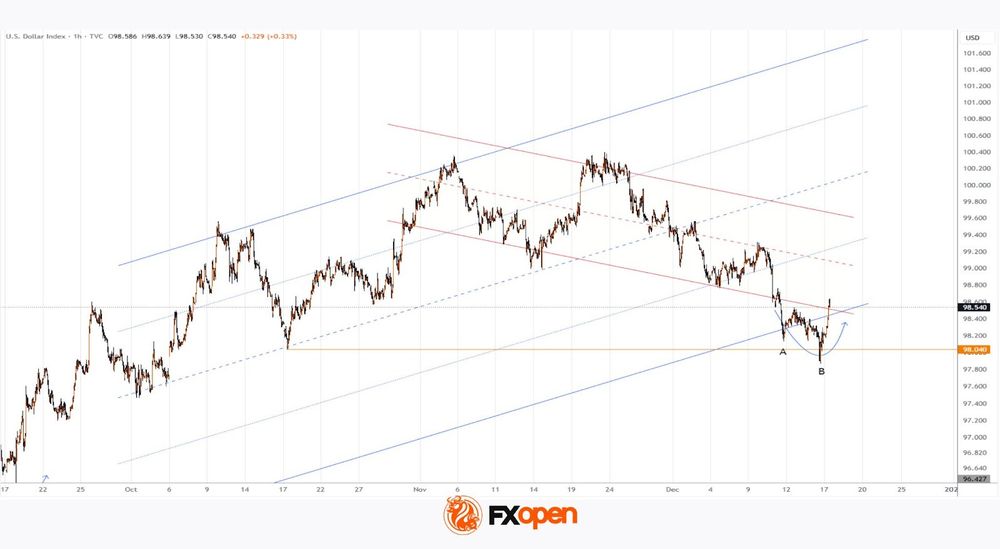
→ the brief dip below the key October low appears to be a bear trap, showing characteristics of a Liquidity Grab in Smart Money Concept terminology;
→ several indicators (including the RSI) are likely to display signs of bullish divergence between lows A and B.
Taking all of the above into account, there are grounds to suggest that the US dollar may regain attractiveness towards year-end. It cannot be ruled out that the DXY will recover towards the median of the red channel and potentially move on to test its upper boundary.
Trade global index CFDs with zero commission and tight spreads. Open your FXOpen account now or learn more about trading index CFDs with FXOpen.
This article represents the opinion of the Companies operating under the FXOpen brand only. It is not to be construed as an offer, solicitation, or recommendation with respect to products and services provided by the Companies operating under the FXOpen brand, nor is it to be considered financial advice.
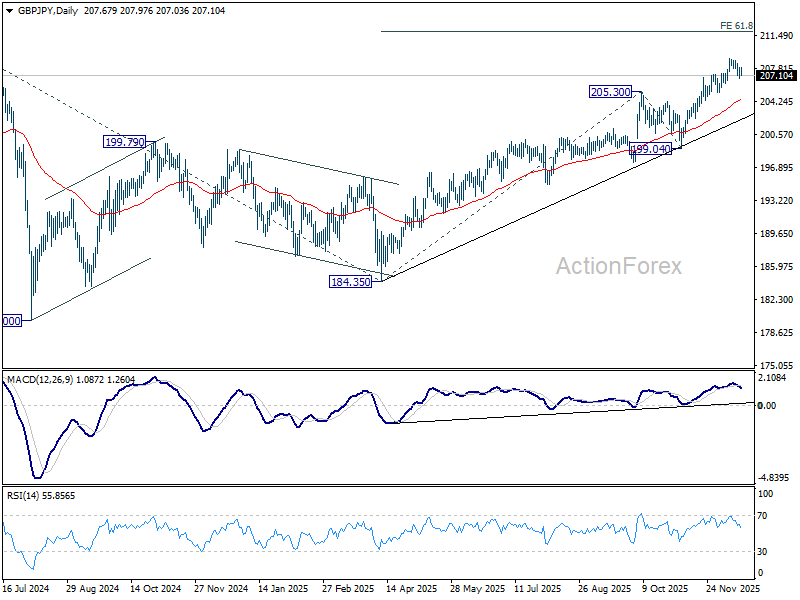
GBP/JPY Daily Outlook
Daily Pivots: (S1) 206.94; (P) 207.47; (R1) 208.16; More...
GBP/JPY is still extending the consolidations from 208.92 and intraday bias remains neutral. Further rally is expected as long as 205.17 support holds. On the upside, break of 208.92 will resume larger up trend and target 61.8% projection of 184.35 to 205.30 from 199.04 at 211.98 next.
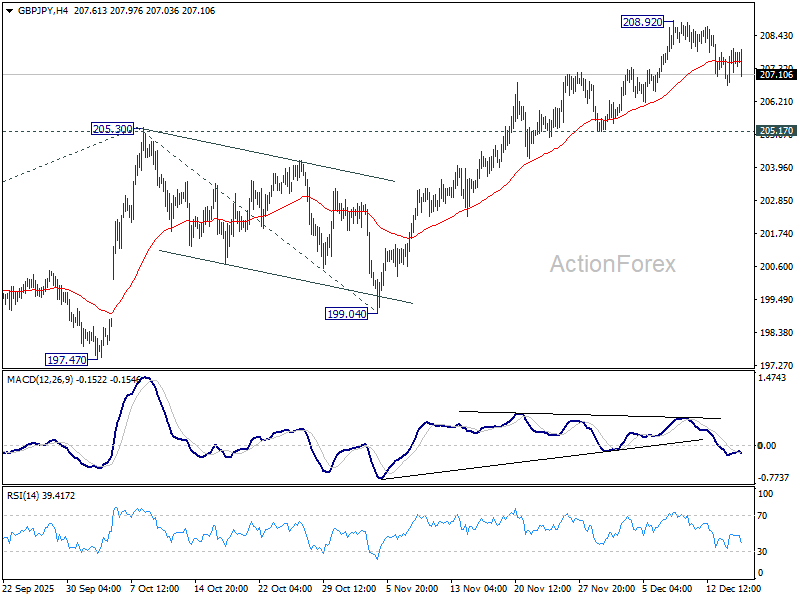
In the bigger picture, up trend from 123.94 (2020 low) is resuming. Next target is 61.8% projection of 148.93 to 208.09 from 184.35 at 220.90. On the downside, break of 199.04 support is needed to indicate medium term topping. Otherwise, outlook will stay bullish even in case of deep pullback.
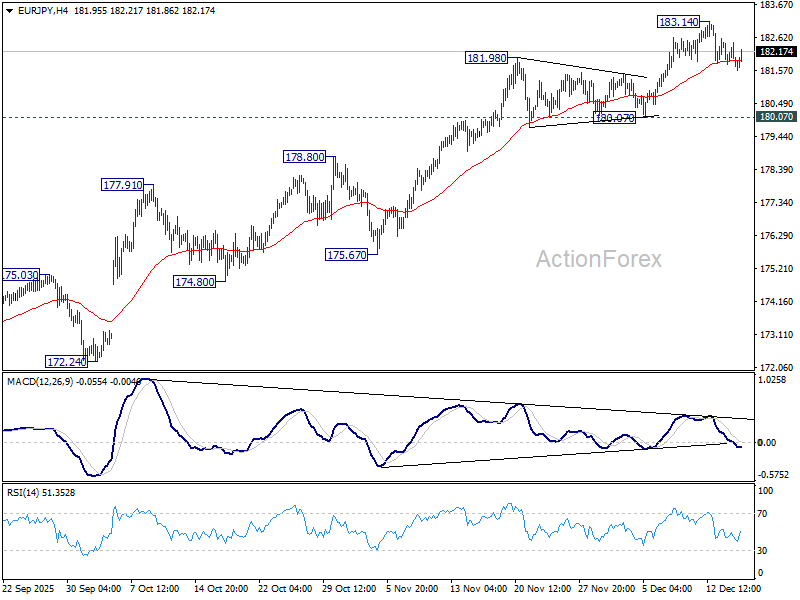
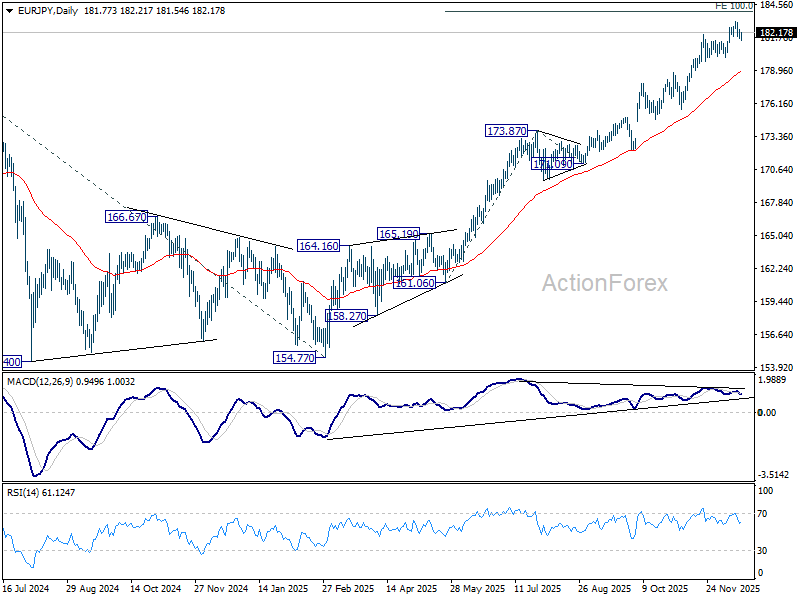
EUR/JPY Daily Outlook
Daily Pivots: (S1) 181.48; (P) 182.00; (R1) 182.28; More...
EUR/JPY is staying in consolidations below 183.14 and intraday bias remains neutral. Further rally is in favor as long as 180.07 support holds. But considering bearish divergence condition in both 4H and D MACD, upside should be limited 100% projection of 161.06 to 173.87 from 171.09 at 183.90, at least on first attempt. Meanwhile, firm break of 180.07 will confirm short term topping, and bring deeper correction to 55 D EMA (now at 178.95).
In the bigger picture, up trend from 114.42 (2020 low) is in progress and should target 61.8% projection of 124.37 to 175.41 from 154.77 at 186.31. However, considering bearish divergence condition in D MACD, upside should be capped by 186.31 on first attempt. Outlook will continue to stay bullish as long as 55 W EMA (now at 170.73) holds, even in case of deep pullback.
EUR/GBP Daily Outlook
Daily Pivots: (S1) 0.8736; (P) 0.8766; (R1) 0.8784; More…
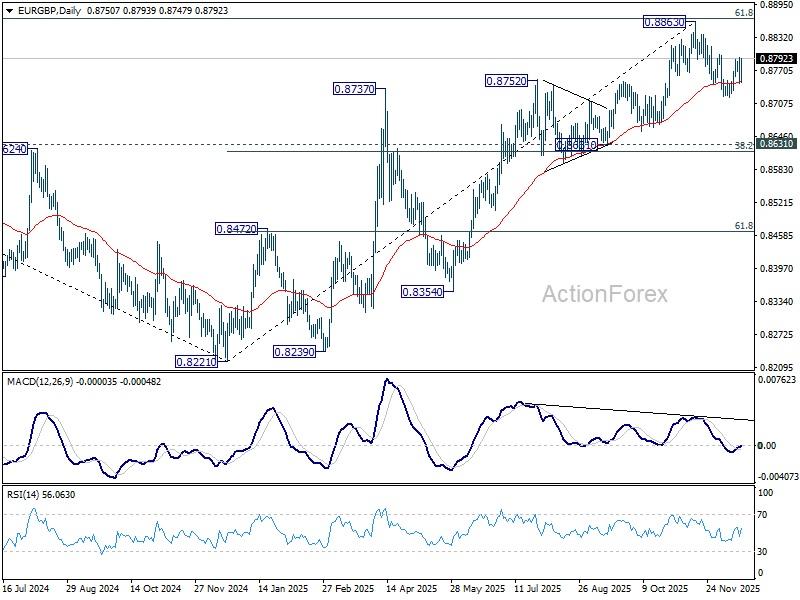
EUR/GBP recovers notably today but stays below 0.8800 resistance and intraday bias stays neutral. Nevertheless, firm break of 0.8800 will suggest that corrective fall from 0.8863 has completed at 0.8720. Stronger rally should be seen to retest 0.8863 high. On the downside, below 0.8720 will target 0.8631 cluster (38.2% retracement of 0.8221 to 0.8663 at 0.8618).
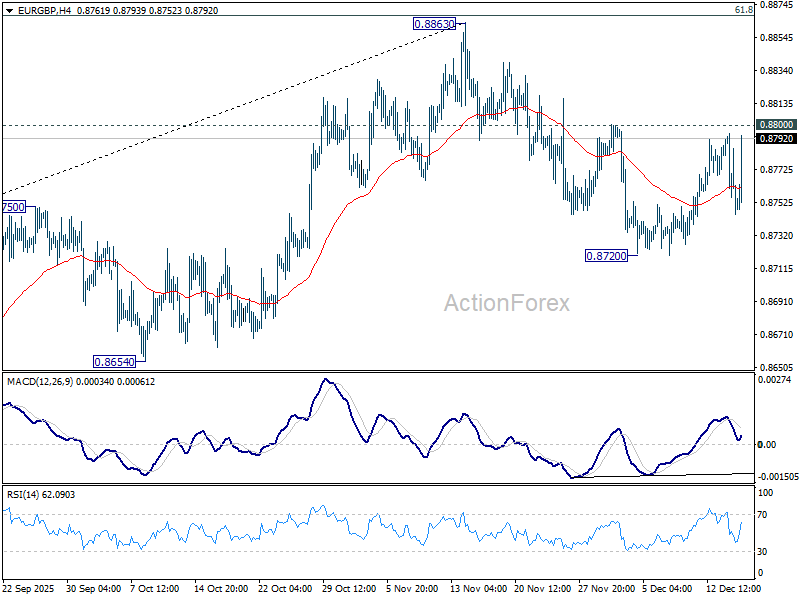
In the bigger picture, rise from 0.8221 medium term bottom is still seen as a corrective move. Upside should be limited by 61.8% retracement of 0.9267 to 0.8221 at 0.8867. Sustained trading below 55 W EMA (now at 0.8605) should confirm that this corrective bounce has completed. However, decisive break of 0.8867 will suggest that EUR/GBP is already reversing whole decline from 0.9267 (2022 high). That should pave the way back to 0.9267.
EUR/AUD Daily Outlook
Daily Pivots: (S1) 1.7670; (P) 1.7721; (R1) 1.7762; More...
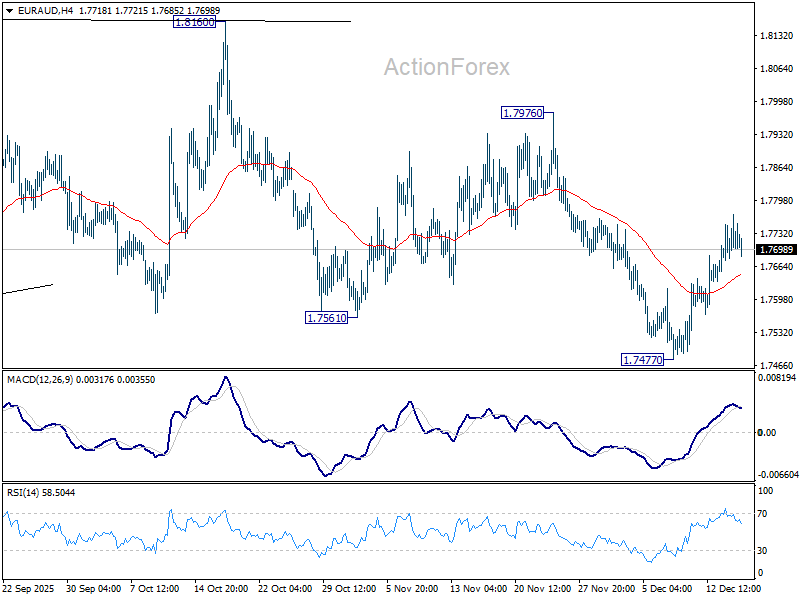
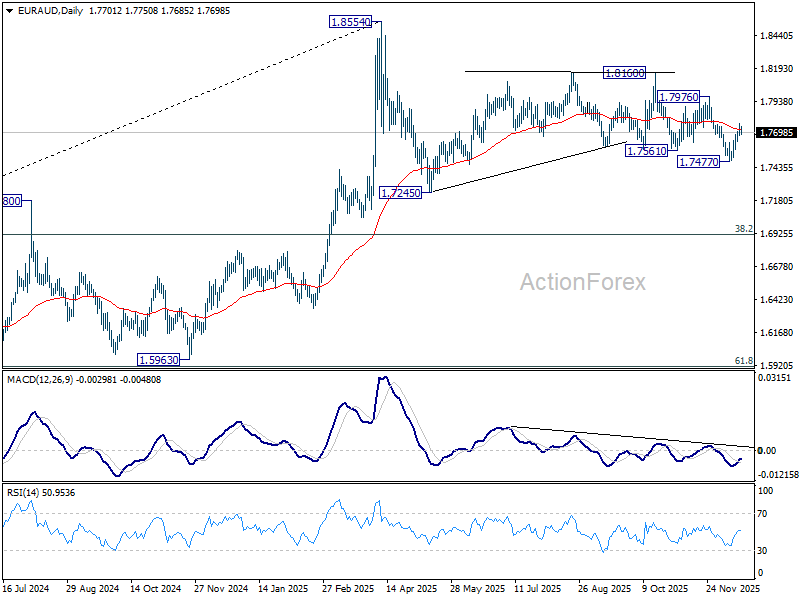
Intraday bias in EUR/AUD remains neutral with focus on 55 D EMA (now at 1.7725). Sustained break there would argue that fall from 1.8160 has completed, and bring stronger rise back to 1.7976 resistance next. Rejection by 55 D EMA will keep near term outlook bearish. Below 1.7477 will target 1.7245 support and possibly below. Overall, price actions from 1.8554 are seen as a corrective pattern that would still extend.
In the bigger picture, as long as 55 W EMA (now at 1.7465) holds, price actions from 1.8554 could still be a correction to rise from 1.5963 only. However, sustained break of the EMA will argue that it's already correcting the whole up trend from 1.4281 (2022 low). In this case, deeper decline would be seen to 38.2% retracement of 1.4281 to 1.8554 at 1.6922.
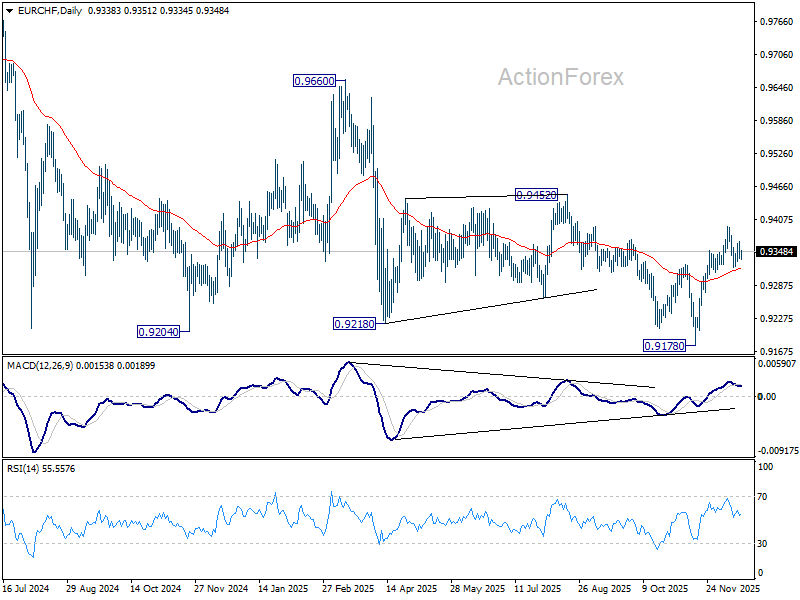
EUR/CHF Daily Outlook
Daily Pivots: (S1) 0.9330; (P) 0.9349; (R1) 0.9361; More....
Intraday bias in EUR/CHF stays neutral at this point and more consolidations could be seen. On the upside, break of 0.9394 will resume the rebound from 0.9178 to 0.9452 structural resistance. Decisive break there will carry larger bullish implications. However, firm break of 0.9311 support will argue that the rebound has completed, and turn bias back to the downside for retesting 0.9178 low.
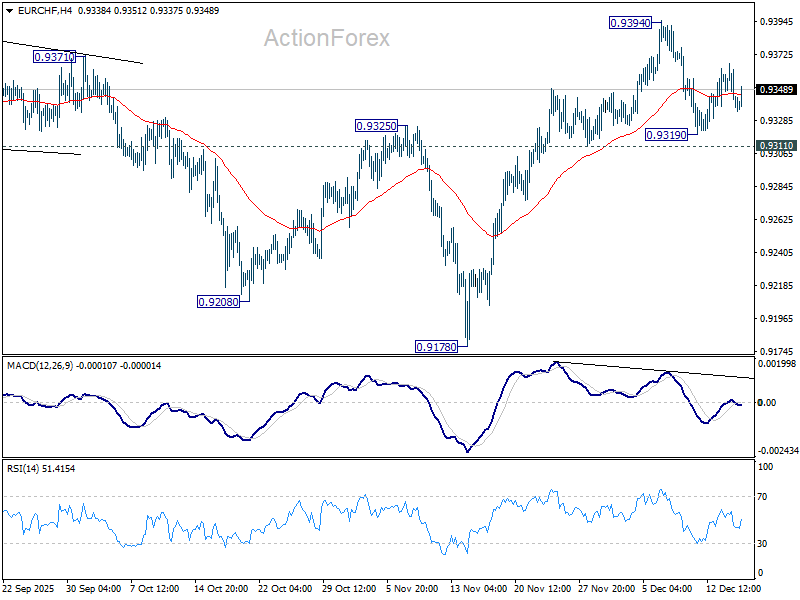
In the bigger picture, EUR/CHF has breached long term falling channel resistance as the rebound from 0.9278 extends. Considering bullish convergence condition in W MACD, sustained trading above 55 W EMA (now at 0.9316) will indicate medium term bottoming at 0.9178, and suggests that it's already in larger scale rebound. Further break of 0.9452 resistance will bring stronger medium term rally towards 0.9928 resistance next. Nevertheless, rejection by 55 W EMA will retain bearishness for another fall through 0.9278 at a later stage.