Sample Category Title
USD/CHF Mid-Day Outlook
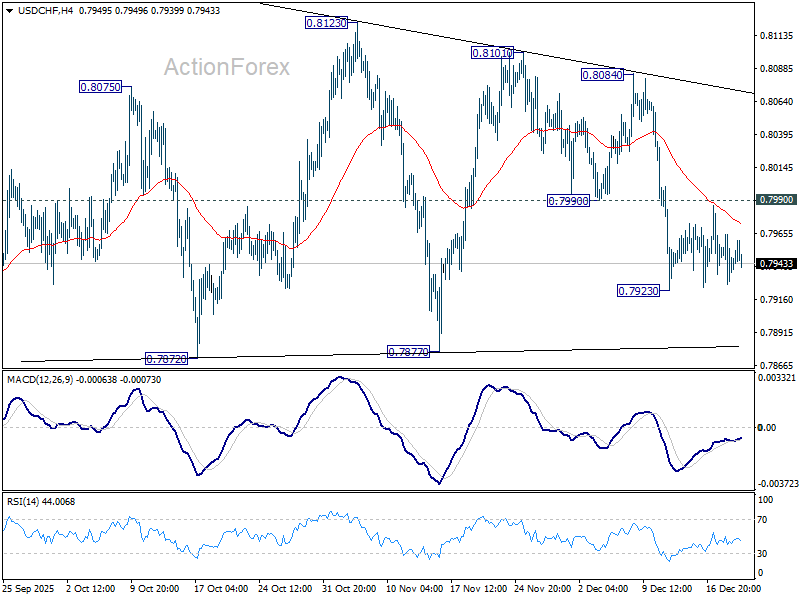
Daily Pivots: (S1) 0.7924; (P) 0.7945; (R1) 0.7961; More….
USD/CHF is still bounded in tight range and intraday bias remains neutral at this point. Overall, corrective pattern from 0.7828 is still extending. On the upside, break of 0.7990 support turned resistance will bring stronger rebound towards 0.8084. On the downside, below 0.7923 will target 0.7877 support.
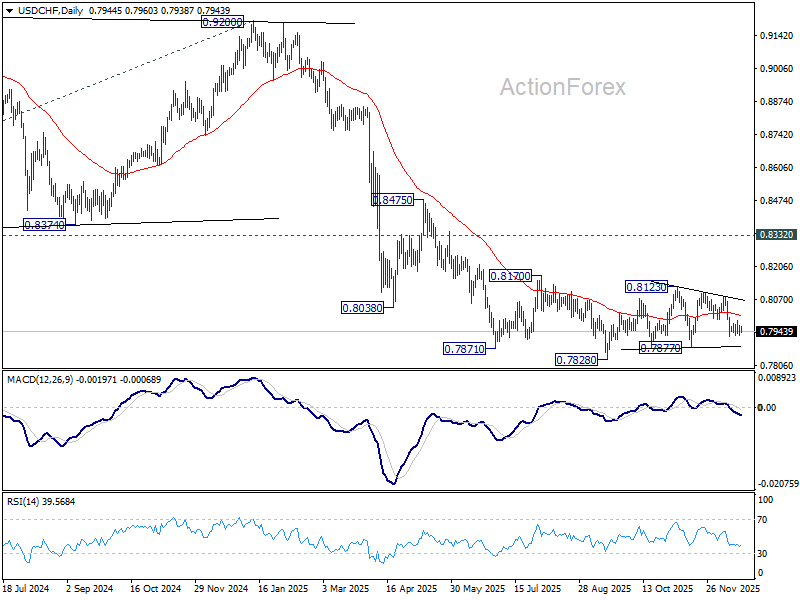
In the bigger picture, outlook will stay bearish as long as 0.8332 support turned resistance holds (2023 low). Long term down trend from 1.0342 (2017 high) is still in progress. Next target is 100% projection of 1.0146 (2022 high) to 0.8332 from 0.9200 at 0.7382.
USD/JPY Mid-Day Outlook
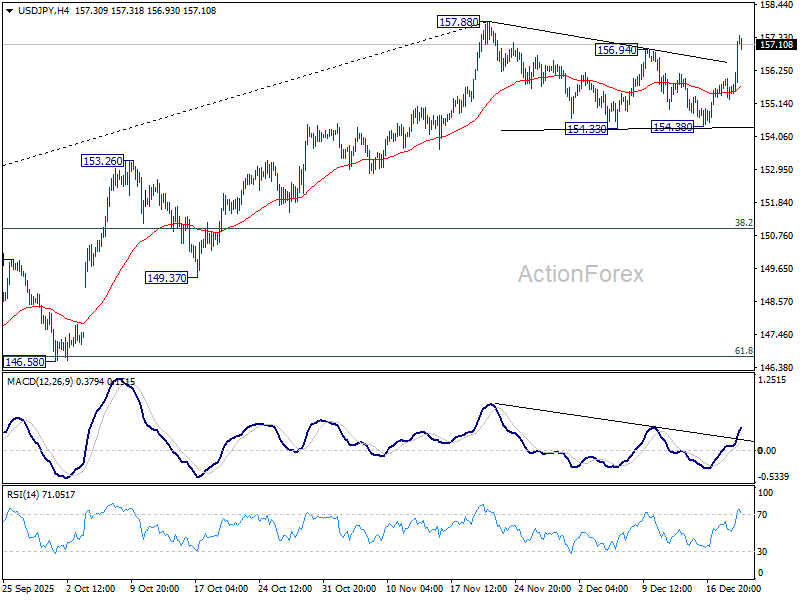
Daily Pivots: (S1) 155.23; (P) 155.61; (R1) 155.93; More...
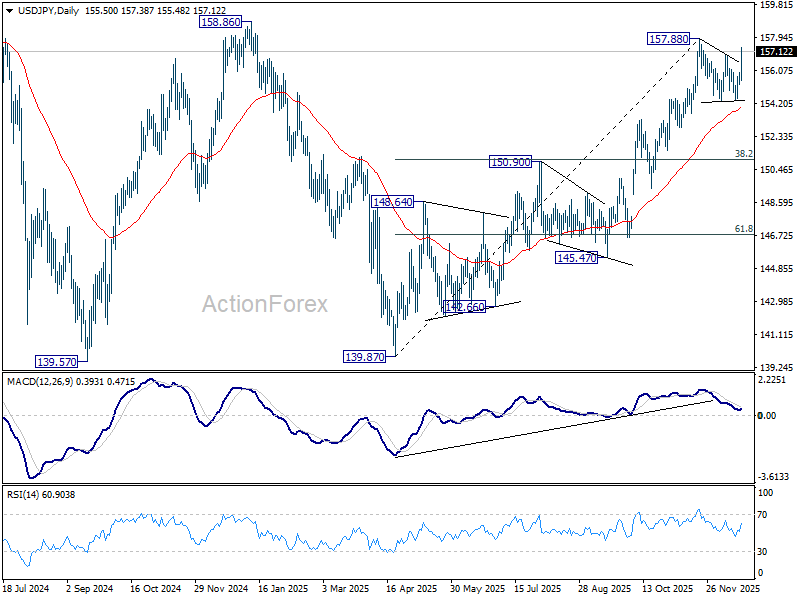
USD/JPY's rally continues today and the break of 156.94 solidify that case that corrective pattern from 157.88 has completed with three waves to 154.38. That is, rally form 139.87 is ready to resume. Intraday bias is back to the upside for 157.88 and above. Firm break of 158.85 key structural resistance will be an important medium term bullish sign. Next target will be 158.85 high. Risk will now stay on the upside as long as 154.38 support holds, in case of retreat.
In the bigger picture, corrective pattern from 161.94 (2024 high) could have completed with three waves at 139.87. Larger up trend from 102.58 (2021 low) could be ready to resume through 161.94 high. Decisive break of 158.85 structural resistance will solidify this bullish case and target 161.94 for confirmation. On the downside, break of 150.90 resistance turned support will dampen this bullish view and extend the corrective range pattern with another falling leg.
Fed’s Williams flags CPI distortions, plays down urgency to cut again
New York Fed President John Williams said today that November’s inflation data were likely distorted by "technical factors", cautioning against overinterpreting the downside surprise. He estimated that such distortions may have pushed the CPI reading down by around a tenth of a percentage point.
Williams said it remains difficult to fully assess the size of the impact until December data become available, which should provide a clearer picture of how much the technical effects influenced November’s figures.
On policy, Williams struck a measured tone, saying he does not feel a "sense of urgency" to lower interest rates further. He argued that the cuts already delivered have positioned the Fed well to continue easing inflation pressures while also supporting a labor market that is cooling in an orderly fashion.
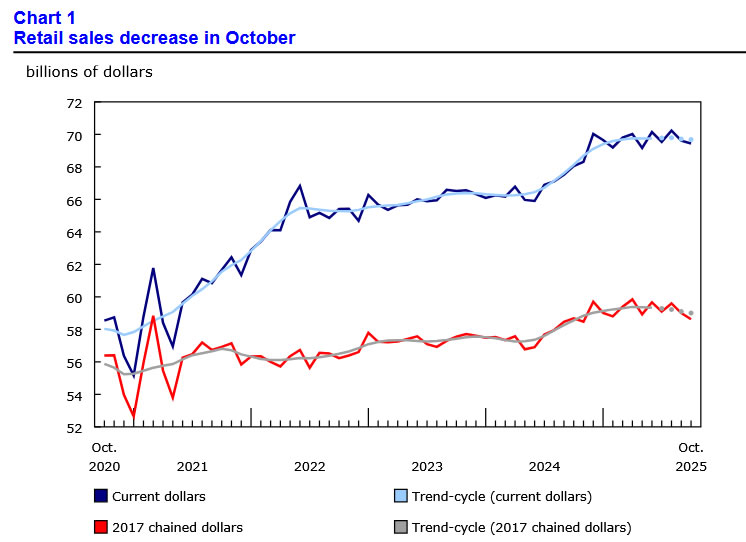
Canada retail sales fall -0.2% mom in October, November rebound eyed
Canada’s retail sales edged down by -0.2% mom to CAD 69.4B in October, extending signs of soft consumer demand. Sales declined in four of nine subsectors, led by weakness at food and beverage retailers, pointing to ongoing pressure on discretionary spending.
Underlying momentum was weaker than the headline suggested. Core retail sales, excluding autos and gasoline, fell -0.5% mom. Sales volumes declined -0.6% mom.
Statistics Canada’s advance estimate points to a 1.2% mom rebound in November. While the estimate is based on a lower-than-usual response rate of 60%, it hints at a potential stabilization in consumption as financial conditions ease, though confirmation will depend on the final data.
Euro Holds Near 1.1700 Following ECB Policy Stance
The EUR/USD pair declined to around 1.1700 after the European Central Bank (ECB) left key interest rates unchanged, a widely anticipated decision that provided little fresh directional impetus for the single currency.
As expected, the main refinancing rate was held at 2.15%, with the deposit facility rate unchanged at 2.0%. ECB officials reiterated their commitment to a meeting-by-meeting, data-dependent approach.
During the subsequent press conference, President Christine Lagarde stated that policymakers did not discuss either a rate hike or a cut at this juncture. She emphasised that the ECB does not have a pre-set path for interest rates and, given the prevailing high uncertainty, cannot provide forward guidance on future policy moves.
In parallel, the central bank released its latest quarterly economic projections. Growth forecasts were revised upwards to 1.4% for 2025, 1.2% for 2026, and 1.4% for 2027. The inflation outlook for 2026 was also adjusted higher, primarily driven by persistent price pressures in the services sector.
Technical Analysis: EUR/USD
H4 Chart:
On the H4 chart, the pair completed a corrective rebound to 1.1760 and is now forming a downward impulse targeting 1.1706. A break below this level is anticipated, which would set the next local bearish target at 1.1640.
This scenario is technically confirmed by the MACD indicator. Its signal line is positioned above zero but is pointing sharply downwards, reflecting sustained bearish momentum and the potential for a further extension of the downtrend.

H1 Chart:
On the H1 chart, the market has finished a first decline to 1.1705, followed by a correction to 1.1755. A second downward impulse towards 1.1705 is currently developing. A clear break below this support would signal the potential for a third wave of decline, targeting the 1.1645 level as a local objective.
This outlook is supported by the Stochastic oscillator, whose signal line is below the 50 level and trending firmly downwards.

Conclusion
The euro remains range-bound following a largely uneventful ECB meeting, with the central bank's cautious, data-dependent stance offering little support. The technical structure points to further downside risk, with a break below immediate support at 1.1705 likely to trigger a move towards the 1.1640 area.
Nikkei 225: A Gradual Interest Rate Hike Stance by BoJ Maintains Bullish Trend
Key takeaways
BoJ policy supportive for equities: The BoJ’s expected 25bp hike to 0.75% and guidance for a gradual, data-dependent tightening path into 2026 signal policy normalization without destabilising financial conditions, reducing downside risks for Japanese equities.
Stronger JPY no longer a headwind: Domestic-oriented Nikkei 225 stocks are outperforming export-heavy names, indicating that modest JPY strength and improving consumer confidence can coexist with a sustained equity uptrend.
Technical backdrop constructive: The Nikkei 225 is showing signs of a minor bullish reversal after a shallow pullback, with momentum indicators improving and key supports holding, suggesting limited risk of a major corrective decline.
The Bank of Japan (BoJ) has hiked its overnight policy rate by 25 basis points (bps) to 0.75% on Friday, 19 December 2025, as expected, its highest level in 30 years.
In its policy statement, the BoJ said it will continue raising the policy rate as long as economic activity and inflation evolve in line with its projections, signalling a conditional bias toward further tightening. Policymakers noted that the probability of achieving the baseline outlook has increased, underscoring growing confidence that inflation is becoming more entrenched rather than transitory.
The BoJ also reaffirmed its commitment to achieving the 2% inflation target in a sustainable and stable manner, while guarding against overly aggressive tightening that could disrupt financial conditions. Officials highlighted that wages and prices are expected to rise at a moderate and coordinated pace, reinforcing the view that inflation is increasingly underpinned by domestic demand rather than one-off cost shocks.
In essence, the BoJ is signalling its intention to continue a gradual rate-hiking path into 2026, with a clear emphasis on managing volatility in the Japanese Government Bond (JGB) market. Policymakers are wary that a rapid, one-way rise in 10-year and 30-year JGB yields could tighten financial conditions prematurely and undermine Japan’s economic growth prospects.
Markets now await further clarity from BoJ Governor Ueda’s press conference at 0630 GMT on how cautiously the BoJ intends to proceed into 2026 and beyond.
The Nikkei 225 advanced for a second straight session, up 0.8% intraday at the time of writing, rebounding after a four-day pullback that began on Friday, 12 December 2025.
We will now highlight several technical factors that support the BoJ’s current gradual and bit-sized monetary tightening policy, which, in turn, leads to a stronger JPY, and is unlikely to trigger a significant major corrective decline sequence in the Nikkei 225.
Gone are the days when a broad major bullish trend of the Nikkei 225 requires a weak JPY to support it.
Japan’s equities with high domestic exposure are outperforming exporters

Fig. 1: Nikkei 225 Domestic Exposure & Global Exposure indices major trends as of 18 Dec 2025 (Source: MacroMicro)
A stronger JPY is likely to negate the current higher cost-of-living squeeze in Japan, in turn, further boosting consumer confidence, which leads to an increase in domestic spending.
Within the Nikkei 225, stocks with a higher reliance on domestic Japanese sales are outperforming export-heavy names, particularly technology equipment and automobile manufacturers with greater overseas exposure.
Since 9 December 2025, the Nikkei 225 Domestic Exposure 50 Index (domestic sales) has outperformed the Nikkei 225 Global Exposure 50 Index (international sales), where its ratio jumped by 5.4% as of Thursday, 18 December 2025 (see Fig. 1).
Hence, this observation supports the view that a gradual BoJ rate-hiking cycle is unlikely to trigger a major corrective decline in the Nikkei 225.
Preferred trend bias (1-3 days) of Nikkei 225 – Minor bullish reversal in progress

Fig. 2: Japan 225 CFD Index minor trend as of 19 Dec 2025 (Source: TradingView)
Watch the 49,130 short-term pivotal support on the Japan 225 CFD Index (a proxy of the Nikkei 225 futures), and a clearance above near-term resistance of 49,850 (also the 20-day and 50-day moving averages) is likely to reinforce a potential minor bullish reversal towards the next intermediate resistances of 50,490 and 50,985 in the first step (see Fig. 2).
Key elements
- The recent 4-day decline has stalled at the 76.4% Fibonacci retracement of the prior minor bullish impulsive up move sequence from 21 November 2025 low to 12 December 2025 high.
- The hourly RSI momentum indicator has continued to flash bullish momentum conditions since the emergence of a bullish divergence signal on 18 December 2025 at its oversold region.
Alternative trend bias (1 to 3 days)
A break below 49,130 invalidates the bullish bias on the Japan 225 CFD Index to expose the 48,450 key medium-term pivotal support next.
Gold Price Analysis: Price Retreats From Record Highs
As the XAU/USD chart shows, gold rallied yesterday to near its October all-time high around the 4,380 level, before pulling back (as indicated by the arrow).
The surge in volatility was driven by a combination of factors:
→ Expectations of US rate cuts. According to media reports, data released yesterday showed that inflation slowed to 2.7% in November, below the 3.1% forecast, while core CPI eased to 2.6%, the lowest reading since March 2021. Markets are currently pricing in roughly a 25% chance of a rate cut in January, with a cut by April seen as almost certain.
→ Geopolitical tensions. Traders are closely monitoring developments linked to Venezuela, where the risk of an armed conflict involving the United States has increased. Market participants also reacted to statements from UK and European politicians ahead of the EU summit.

On 5 December, we:
→ noted that the lack of a clear trend had resulted in the formation of a symmetrical triangle, with its midline around $4,205;
→ suggested that this pattern on the XAU/USD chart could act like a “compressed spring”, eventually leading to a volatility breakout.
Such a volatility surge materialised on 11–12 December, when gold broke out of the triangle and posted a high near $4,340.
Since then, a new triangle has begun to form, with a central axis around $4,316, reflecting a developing balance between supply and demand. In this context, it is worth highlighting that:
→ yesterday’s rally and subsequent reversal can be interpreted as a false bullish breakout, signalling strong selling pressure near the record high and suggesting that gold may retreat towards the lower boundary of the emerging triangle;
→ the approaching holiday period is typically associated with thinner market liquidity, which often amplifies price swings. In such conditions, gold could still surprise traders with another push to fresh record highs.
Start trading commodity CFDs with tight spreads. Open your trading account now or learn more about trading commodity CFDs with FXOpen.
This article represents the opinion of the Companies operating under the FXOpen brand only. It is not to be construed as an offer, solicitation, or recommendation with respect to products and services provided by the Companies operating under the FXOpen brand, nor is it to be considered financial advice.
GBP/JPY Daily Outlook
Daily Pivots: (S1) 207.68; (P) 208.35; (R1) 208.82; More...
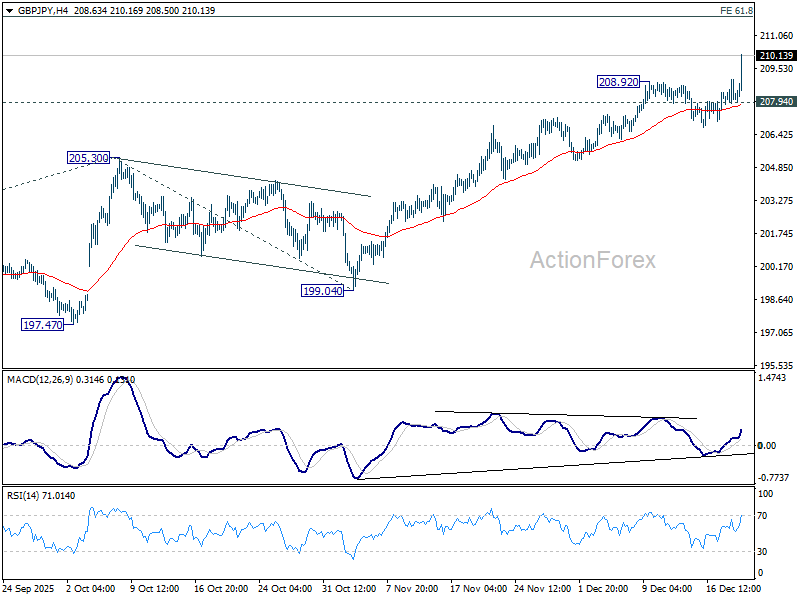
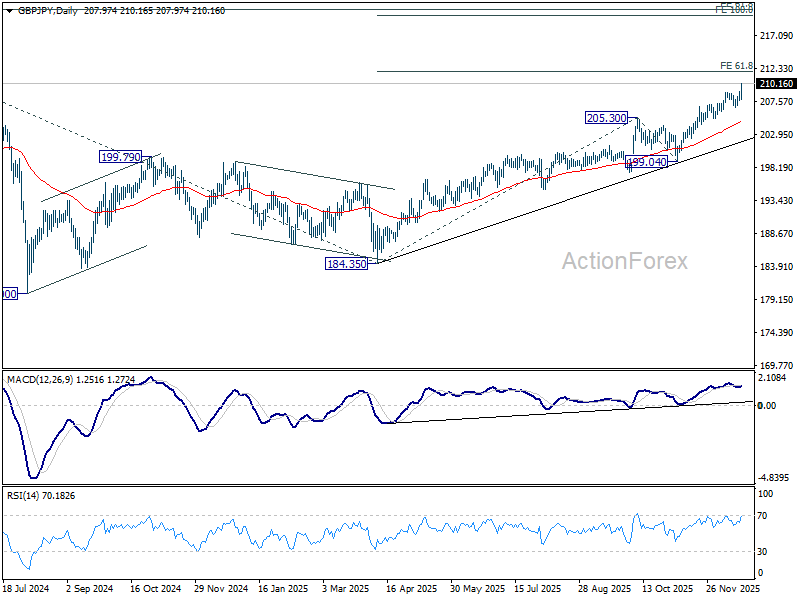
GBP/JPY's up trend resumed by breaking through 208.92 and intraday bias is back on the upside, next target is 61.8% projection of 184.35 to 205.30 from 199.04 at 211.98. On the downside, below 207.94 support will turn intraday bias and bring consolidations again.
In the bigger picture, up trend from 123.94 (2020 low) is resuming. Next target is 61.8% projection of 148.93 to 208.09 from 184.35 at 220.90. On the downside, break of 199.04 support is needed to indicate medium term topping. Otherwise, outlook will stay bullish even in case of deep pullback.
EUR/JPY Daily Outlook
Daily Pivots: (S1) 182.06; (P) 182.61; (R1) 182.94; More...
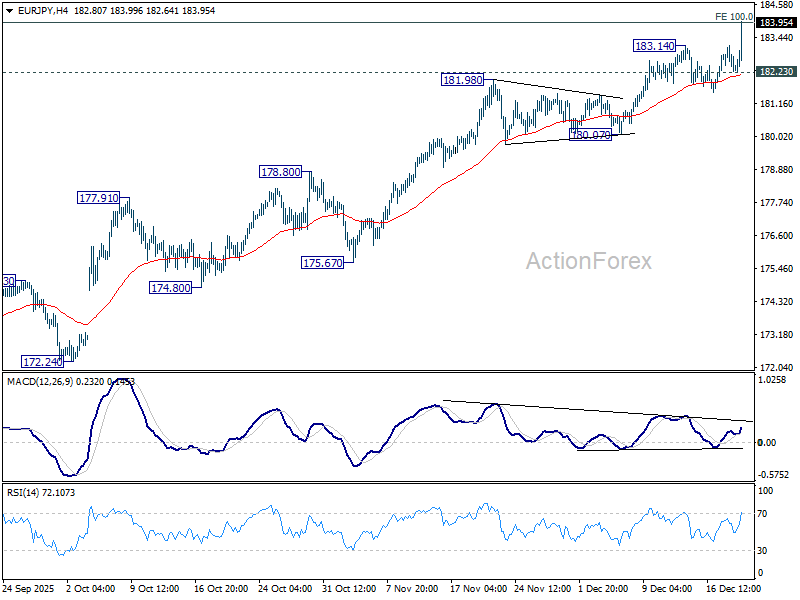
EUR/JPY's up trend resumed with today's strong rally and met 100% projection of 161.06 to 173.87 from 171.09 at 183.90. Strong resistance could be seen from this level to limit upside, and below 182.23 minor support will turn bias to the downside for 180.07. However, decisive break of 183.90 will pave the way to long term projection at 186.31 next.
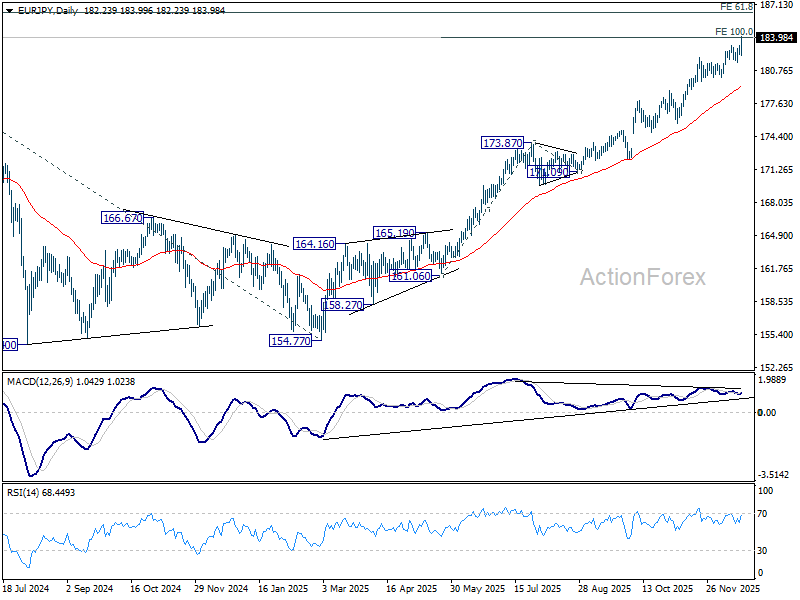
In the bigger picture, up trend from 114.42 (2020 low) is in progress and should target 61.8% projection of 124.37 to 175.41 from 154.77 at 186.31. However, considering bearish divergence condition in D MACD, upside should be capped by 186.31 on first attempt. Outlook will continue to stay bullish as long as 55 W EMA (now at 170.73) holds, even in case of deep pullback.
EUR/GBP Daily Outlook
Daily Pivots: (S1) 0.8735; (P) 0.8761; (R1) 0.8788; More…
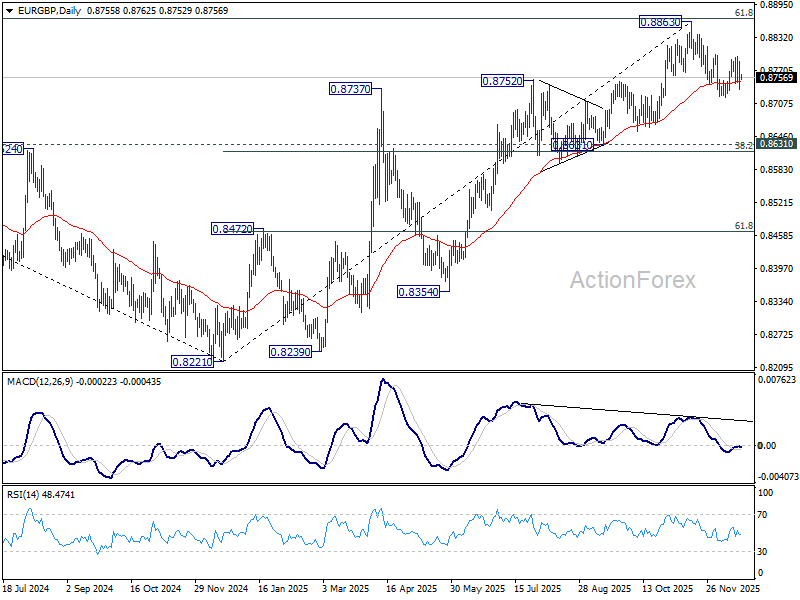
Range trading continues in EUR/GBP and intraday bias stays neutral. Further decline remains in favor with 0.8800 resistance intact. Break of 0.8720 will resume the fall from 0.8863 short term top to 0.8631 cluster (38.2% retracement of 0.8221 to 0.8663 at 0.8618). Nevertheless, firm break of 0.8800 will suggest that corrective fall from 0.8863 has completed at 0.8720. Stronger rally should be seen to retest 0.8863 high.
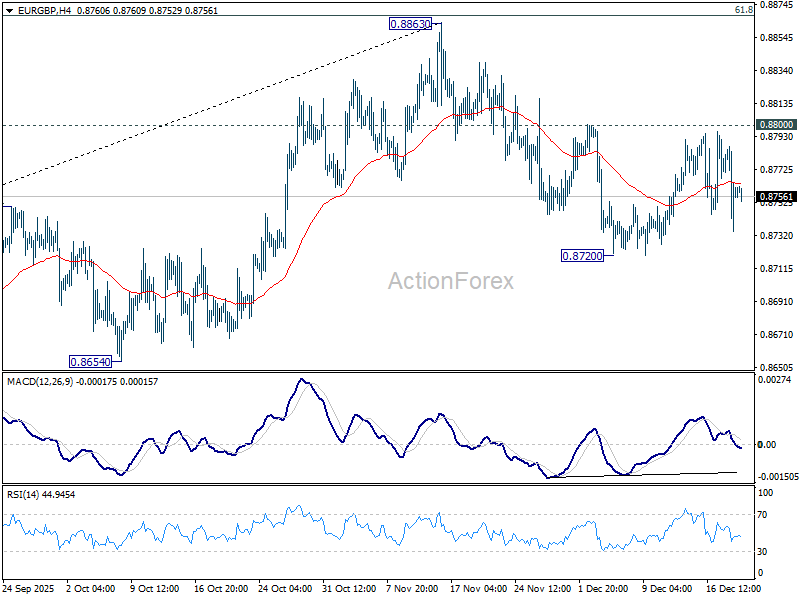
In the bigger picture, rise from 0.8221 medium term bottom is still seen as a corrective move. Upside should be limited by 61.8% retracement of 0.9267 to 0.8221 at 0.8867. Sustained trading below 55 W EMA (now at 0.8605) should confirm that this corrective bounce has completed. However, decisive break of 0.8867 will suggest that EUR/GBP is already reversing whole decline from 0.9267 (2022 high). That should pave the way back to 0.9267.