Sample Category Title
Nikkei 225 Wave Analysis
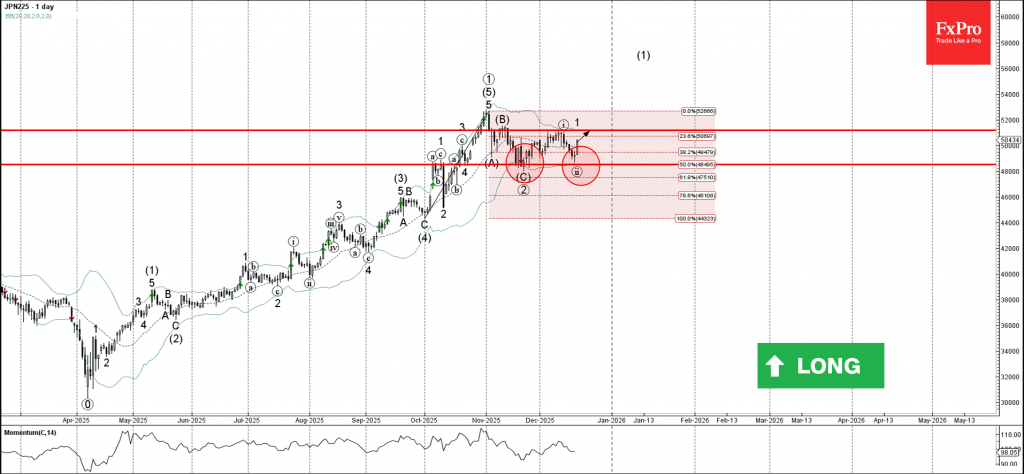
Nikkei 225: ⬆️ Buy
- Nikkei 225 reversed from support area
- Likely to rise to resistance level 51150.00
Nikkei 225 index recently reversed from the support area between the pivotal support level 48500.00 (which has been reversing the price from November) and the lower daily Bollinger Band.
The support level 48500.00 was strengthened by the 50% Fibonacci correction level of the previous sharp upward impulse from September.
Given the clear daily uptrend, Nikkei 225 index can be expected to rise to the next resistance level 51150.00 (which stopped earlier waves B and 1).
Ethereum Wave Analysis
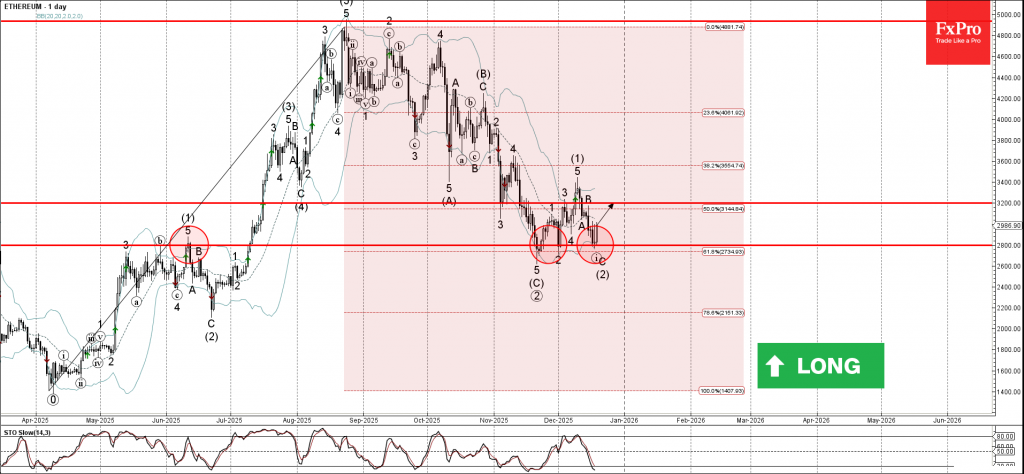
Ethereum: ⬆️ Buy
- Ethereum reversed from support area
- Likely to rise to resistance level 3200.00
Ethereum cryptocurrency recently reversed from the support area between the strong support level 2800.00 (former resistance from June, which has been reversing the price from November) and the lower daily Bollinger Band.
The upward reversal from this from the support area will likely form the daily Japanese candlesticks reversal pattern Morning Star – strong buy signal for Ethereum.
Given the strength of the support level 2800.00 and the oversold daily Stochastic, Ethereum cryptocurrency can be expected to rise to the next resistance level 3200.00.
Dollar Mirrors Market Doubt, Sterling Saved, Yen Sinks
The past week delivered no shortage of surprises, yet markets ended it with remarkably little conviction. Key macro data and central bank decisions challenged prevailing assumptions, but follow-through across major assets proved elusive.
US economic releases hinted at a faster cooling in both employment and inflation. Under normal circumstances, that combination would have fueled enthusiasm for deeper policy easing from the Fed. Instead, markets paused, choosing caution over commitment.
The result was indecision across major asset classes. Equity benchmarks failed to break free from recent ranges, bond yields wobbled without direction, and Dollar drifted rather than trended. The sense was not disbelief—but doubt.
Elsewhere, Sterling narrowly avoided what had looked like an inevitable slide. A surprisingly hawkish rate cut from the BoE shifted the tone just enough to halt bearish momentum, forcing markets to reconsider how far UK easing can realistically go. Yen told the opposite story. The BoJ finally delivered a long-awaited rate hike, yet the currency continued to weaken.
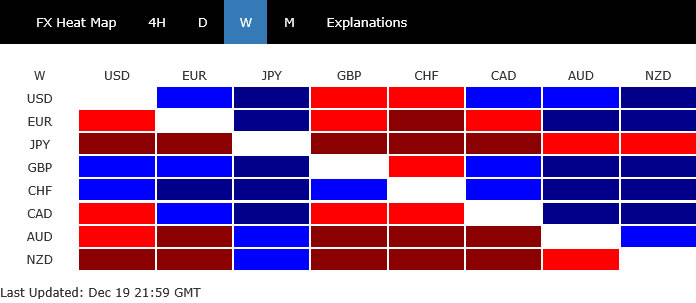
At the end, Yen was the worst performer of the week, followed by Kiwi and then Aussie. Swiss Franc was the best, followed by Sterling and then Dollar. Euro and Loonie ended in the middle.
Blurred Signals from Jobs and CPI Keep Fed Bets Contained
Markets looked to the delayed US labor and inflation data for direction. Instead of resolving uncertainty, the releases reinforced it, leaving investors hesitant to push either risk assets or Fed expectations decisively.
October’s payrolls collapse immediately caught attention, with -105k decline marking the weakest print since the pandemic era. Yet the bulk of that fall stemmed from federal employment, distorted by the delayed exit of workers who had previously accepted voluntary separation offers. Adjusted for that factor, labor market momentum remains weak but far from broken. November’s payroll gain of 64k, slightly above forecasts, suggested some rebound as government operations normalized and trade tensions eased under the one-year US–China tariff truce.
The inflation side of the story was equally inconclusive. November CPI undershot expectations, but the absence of October data due to the government shutdown undermined confidence in the result. Key components were missing, reducing the reliability of the headline slowdown. That concern was echoed by New York Fed President John Williams, who warned that technical distortions likely pushed CPI lower. He estimated the impact at roughly a tenth of a percentage point and urged caution until December figures are available.
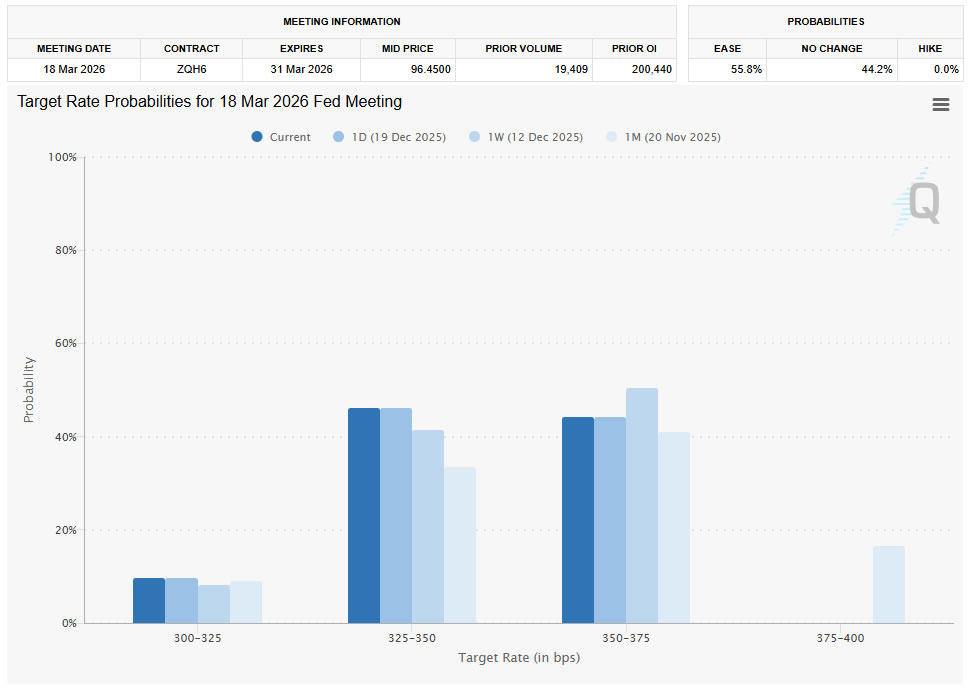
With both jobs and inflation signals blurred, Fed expectations barely shifted. A January hold remains the base case, while the probability of a March cut nudged up only marginally to around 54%—still little more than a coin toss. Importantly, there are still three full rounds of employment and inflation data before the March FOMC meeting. That makes any firm conclusion on the next policy move premature, and markets appear keenly aware of that constraint.
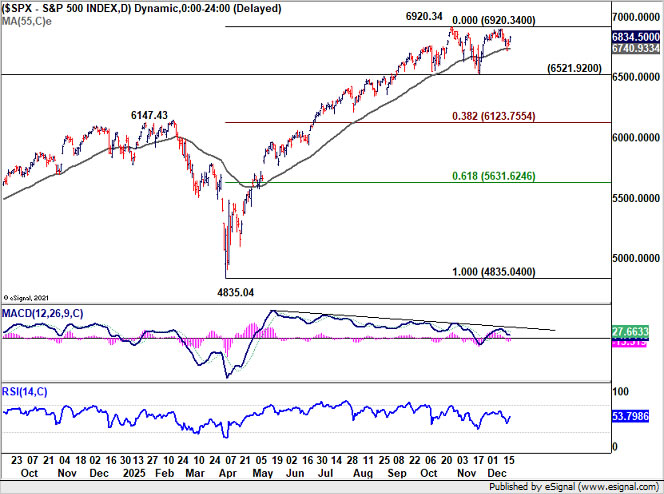
Technically, after initial dip, S&P 500 drew notable support from 55 D EMA (now at 6,740.93) and recovered. Yet, upside is limited below 6,920.34 high. Hence, more consolidations could still be seen with risk of another dip towards 6,521.92 support.
Firm break of this support will target deeper correction to 38.2% retracement of 4,835.04 to 6,920.34 at 6,123.75. Meanwhile, in case of stronger rise, the focus will be on whether S&P 500 could sustain above 7,000 psychological level.
Rates and Dollar Mirror Market Hesitation
The uncertainty surrounding US macro signals was clearly reflected in both Treasury yields and the Dollar. Neither market showed the conviction needed to confirm a new trend.
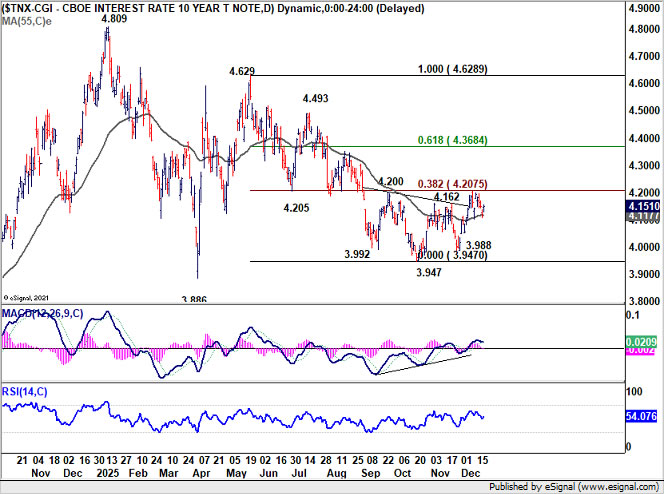
Technically, 10-year yield failed to break through 4.2000 key cluster resistance (38.2% retracement of 4.628 to 3.947 at 4.207) and gyrated lower. However, some support was seen from flat 55 D EMA (now at 4.117).
On the downside, sustained break of 55 D EMA will confirm rejection by 4.200. More importantly, that would keep near term outlook bearish and affirm that recent rebound from 3.947 was merely a correction to the fall from 4.628. Deeper decline would then be seen back to retest 3.947.
However, decisive break of 4.2 will argue that fall from 4.629 has already completed, and further rise should be seen to 61.8% retracement at 4.368 and possibly above.
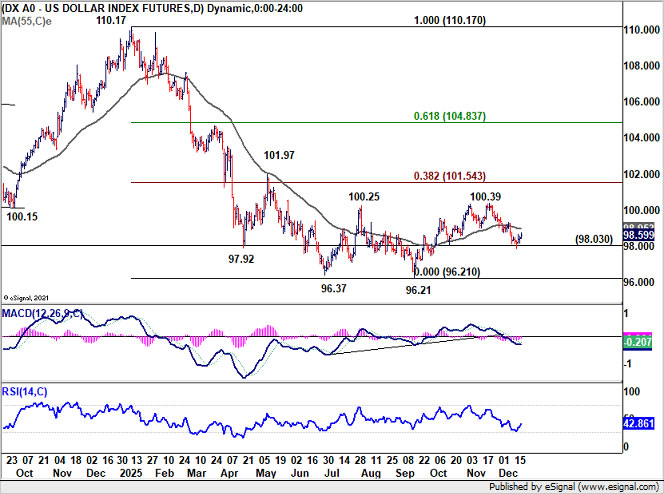
Dollar Index also gyrated lower last week but failed to sustain below 98.03 support. The break of flat 55 D EMA (now at 98.95) is a near term bearish sign. Yet, firm break of 98.03 is still needed to confirm that rebound from 96.21 has completed as correction at 100.39.
However, strong bounce from current level and sustained trading above 55 D EMA will bring another rise to 100.39 resistance and possibly further to 38.2% retracement of 110.17 to 96.21 at 101.54.
Hawkish BoE Surprise Rescues Sterling
Sterling spent the early part of last week on the defensive, with markets positioned for a dovish rate cut and a continuation of the easing narrative. Softer employment data and sharper-than-expected slowdown in inflation appeared to leave little room for resistance within the MPC.
Instead, the BoE delivered a cut that was hawkish in its details. While Bank Rate was lowered by 25bps to 3.75% as expected, the 5–4 vote split came as a clear surprise, immediately forcing markets to reassess the pace of easing ahead.
Four MPC members voted to hold rates unchanged, signaling deep unease about declaring victory over inflation. Despite the recent disinflation, concerns over services prices, wage dynamics, and inflation expectations remain entrenched among the more hawkish bloc.
Crucially, the BoE acknowledged that further easing decisions would now become a “closer call.” That explicit language marked a shift away from the assumption of an automatic quarterly cutting cycle, injecting uncertainty into the outlook for 2026.
Governor Andrew Bailey reinforced that message after the meeting, noting that while rates are likely to come down over time, the pace of cuts will ease at some point. He stressed that judging exactly when remains highly uncertain.
Markets still see February as the most logical timing for the next cut, given the availability of new economic projections. Even so, conviction has faded, with some analysts now shifting expectations toward March or even later.
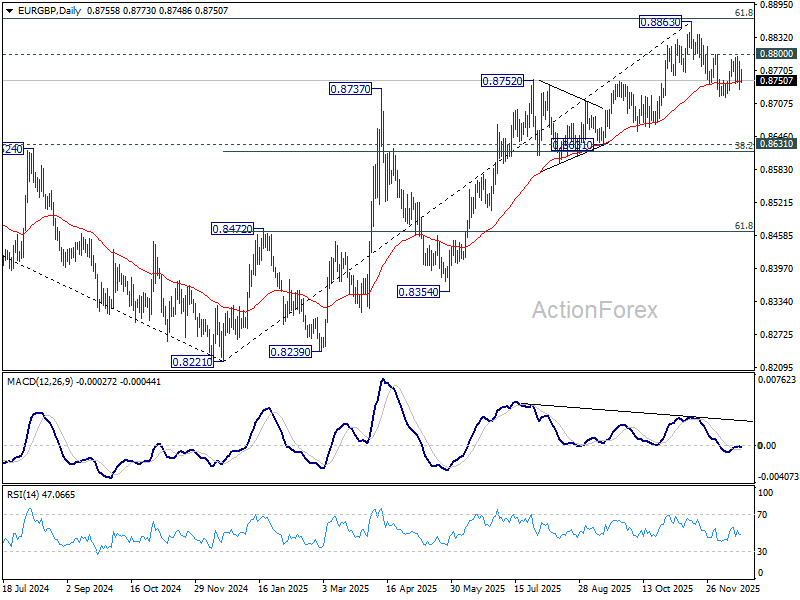
From a market perspective, that was enough to stabilize Sterling. Technically, risks stay on the downside for EUR/GBP as last week's recovery was limited below 0.8800 resistance. Next target will likely bring sustained trading below 55 D EMA (now at 0.8479), and pave the way to 0.8631 cluster support (38.2% retracement of 0.8221 to 0.8663 at 0.8618).
BoJ Tightening Ceiling and Fiscal Reality Combine to Weigh on Yen
The BoJ’s long-awaited rate hike to 0.75% marked an important symbolic step, but it did little to alter the Yen’s broader down trend. Instead of finding support, the currency weakened further as markets looked past the headline move and reassessed what comes next.
From a policy perspective, expectations for further tightening remain restrained. While the BoJ has retained tightening bias, guidance has been deliberately vague. Market consensus now points to the next hike only around mid-2026. Even then, rates are expected to rise merely to around 1.00%, placing policy just at the lower bound of the estimated 1.00–2.50% neutral range. Some investors are already questioning whether 1.00% could mark the terminal rate of the current cycle. Without clarity on a path deeper into neutral, expectations for sustained Yen appreciation remain muted.
Running alongside these policy limits are growing fiscal concerns. Prime Minister Sanae Takaichi's large-scale fiscal stimulus is expected to be debt financed. With Japan’s debt-to-GDP ratio already above 230%, markets assume the BoJ will remain under pressure to keep long-term borrowing costs contained. Allowing long-term yields to rise meaningfully would risk destabilizing public finances. This alone is a main driving force behind Yen's current depreciation cycle.
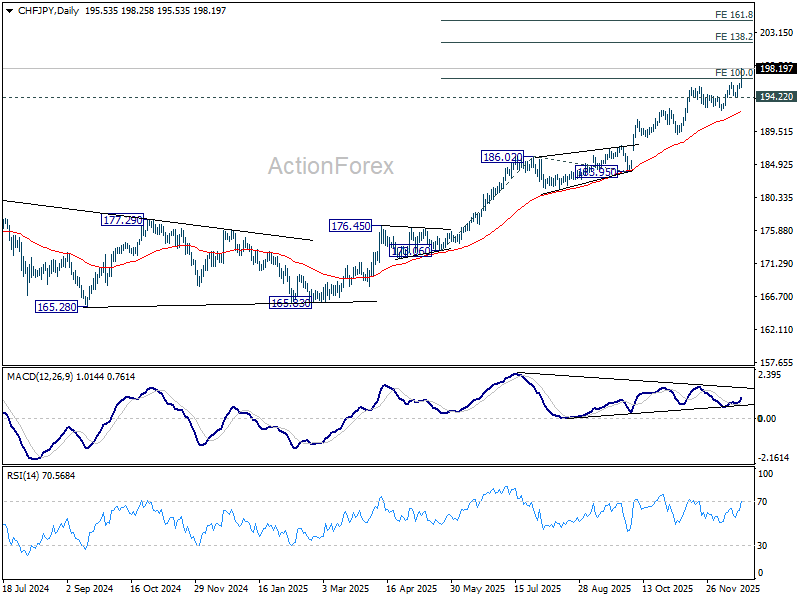
CHF/JPY was among the top movers last week, gaining 1.24%. Technically, CHF/PY has surged through 100% projection of 173.06 to 186.02 from 183.95 at 196.91. Near term outlook will stay bullish as long as 194.22 support holds. Next target is 138.2% projection at 201.86. But there is risk of more upside reacceleration to 161.8% projection at 204.91 before topping.
EUR/USD Weekly Outlook
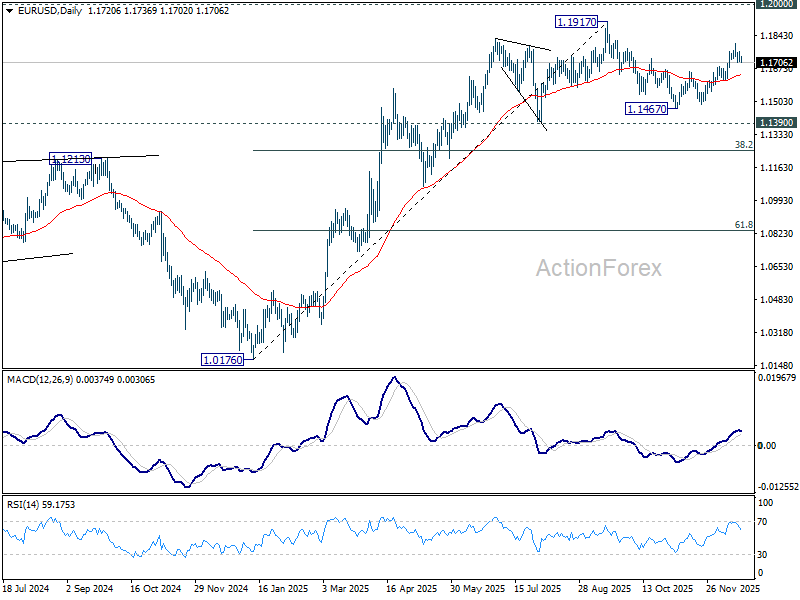
EUR/USD edge higher to 1.1803 last week but retreated. Initial bias remains neutral this week first. On the upside, break of 1.1803 will extend the rally from 1.1467 to retest 1.1917 high. However, firm break of 55 D EMA (now at 1.1640) will turn bias back to the downside for 1.1467 support, to extend the corrective pattern form 1.19717 with another falling leg.
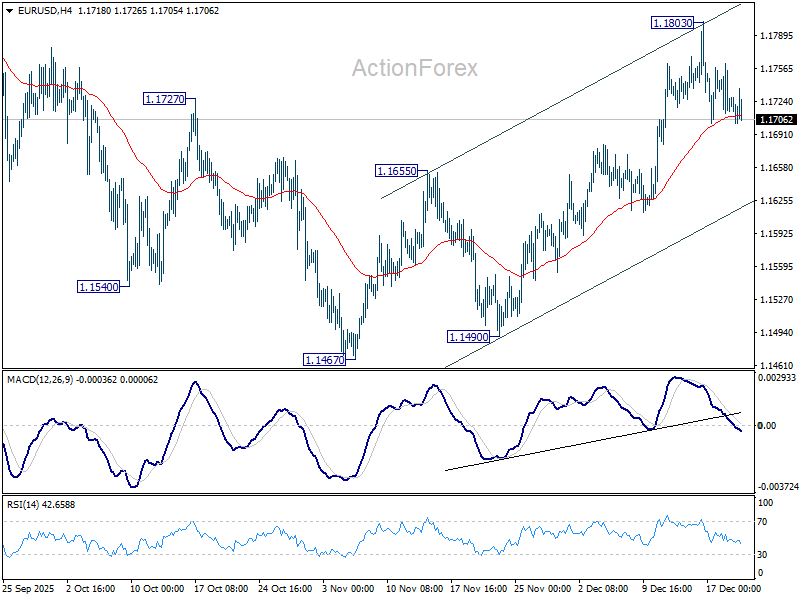
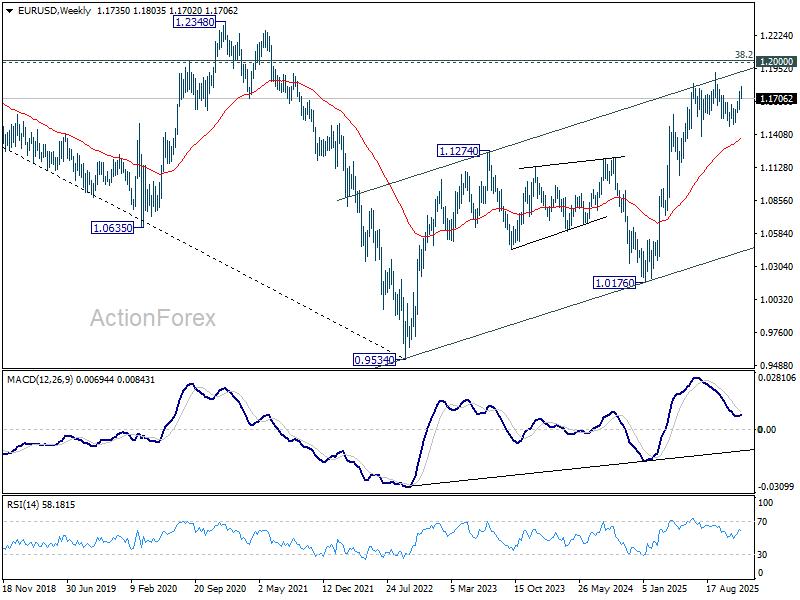
In the bigger picture, as long as 55 W EMA (now at 1.1360) holds, up trend from 0.9534 (2022 low) is still in favor to continue. Decisive break of 1.2 key psychological level will carry larger bullish implication. However, sustained trading below 55 W EMA will argue that rise from 0.9534 has completed as a three wave corrective bounce, and keep long term outlook bearish.
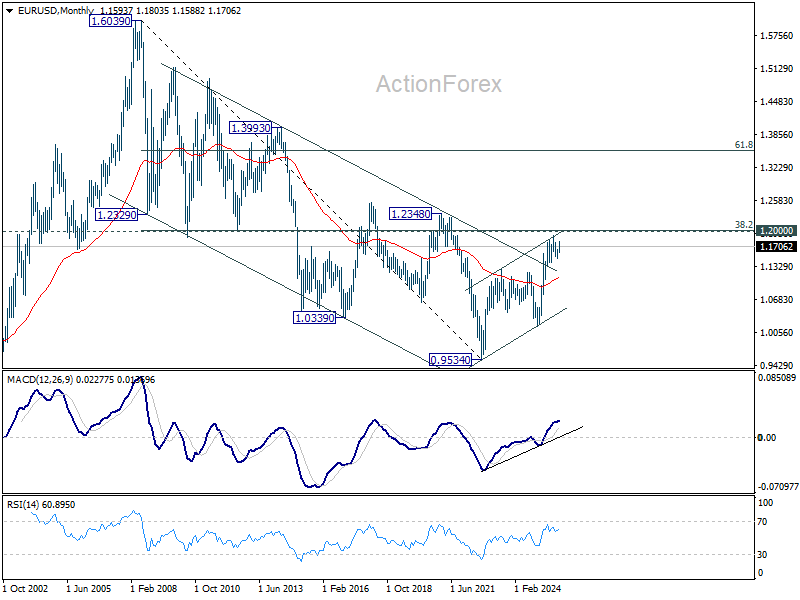
In the long term picture, 38.2% retracement of 1.6039 to 0.9534 at 1.2019, which is close to 1.2000 psychological level is the key for the outlook. Rejection by this level will keep the multi decade down trend from 1.6039 (2008 high) intact, and keep outlook neutral at best. However, decisive break of 1.2000/19, will suggest long term bullish trend reversal, and target 61.8% retracement at 1.3554.
EUR/USD Weekly Outlook
EUR/USD edge higher to 1.1803 last week but retreated. Initial bias remains neutral this week first. On the upside, break of 1.1803 will extend the rally from 1.1467 to retest 1.1917 high. However, firm break of 55 D EMA (now at 1.1640) will turn bias back to the downside for 1.1467 support, to extend the corrective pattern form 1.19717 with another falling leg.
In the bigger picture, as long as 55 W EMA (now at 1.1360) holds, up trend from 0.9534 (2022 low) is still in favor to continue. Decisive break of 1.2 key psychological level will carry larger bullish implication. However, sustained trading below 55 W EMA will argue that rise from 0.9534 has completed as a three wave corrective bounce, and keep long term outlook bearish.
In the long term picture, 38.2% retracement of 1.6039 to 0.9534 at 1.2019, which is close to 1.2000 psychological level is the key for the outlook. Rejection by this level will keep the multi decade down trend from 1.6039 (2008 high) intact, and keep outlook neutral at best. However, decisive break of 1.2000/19, will suggest long term bullish trend reversal, and target 61.8% retracement at 1.3554.
USD/JPY Weekly Outlook
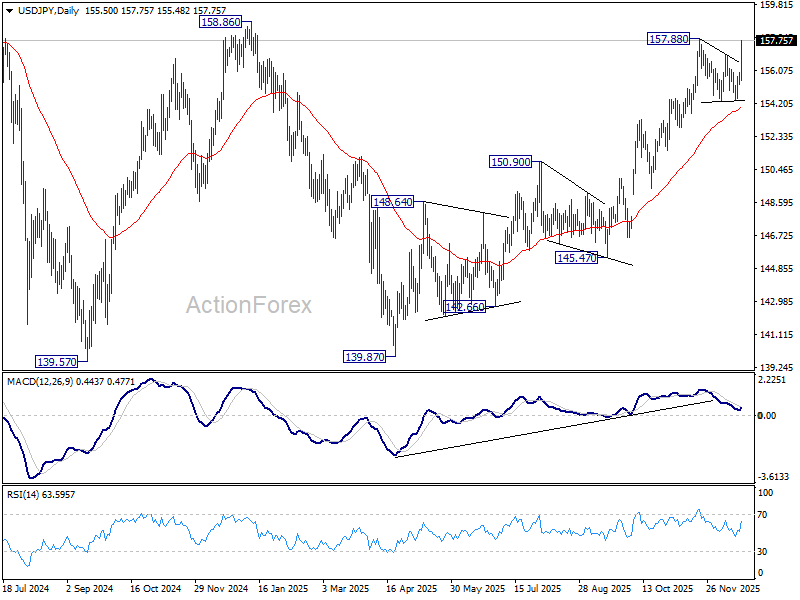
USD/JPY's strong rally last week suggests that consolidation from 157.88 has completed and rise from 139.87 is resuming. Initial bias stays on the upside this week. Decisive break of 158.85 key structural resistance will be a strong medium term bullish sign, and bring retest of 161.94 high. For now, outlook will stay bullish as long as 154.38 support holds, in case of retreat.
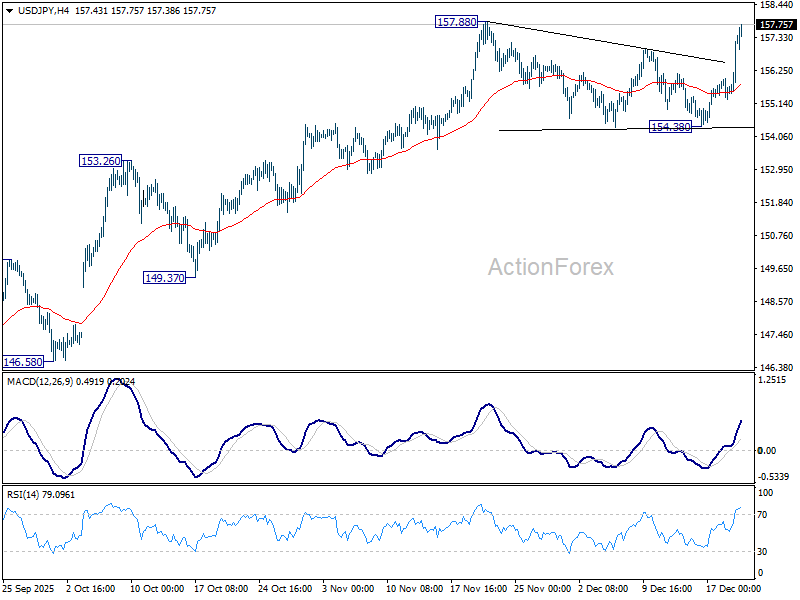
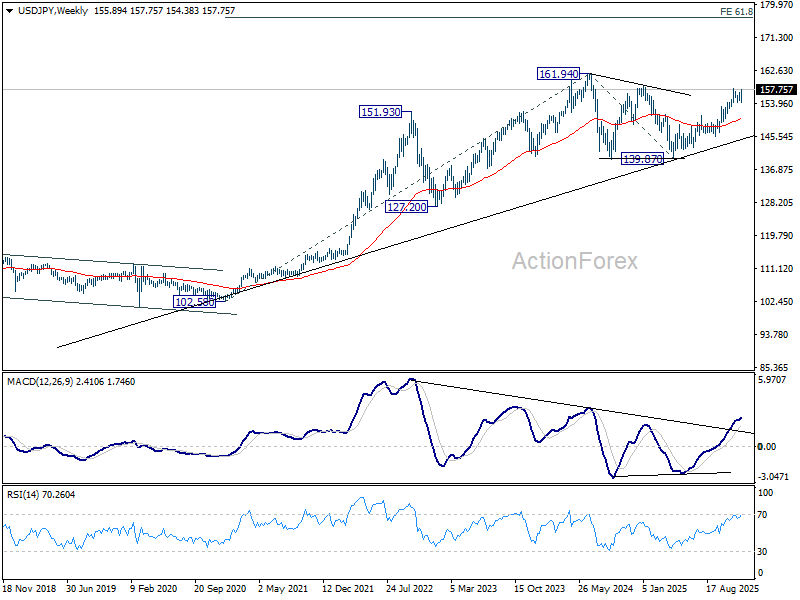
In the bigger picture, corrective pattern from 161.94 (2024 high) could have completed with three waves at 139.87. Larger up trend from 102.58 (2021 low) could be ready to resume through 161.94. Decisive break of 158.85 structural resistance will solidify this bullish case and target 161.94 for confirmation. On the downside, break of 150.90 resistance turned support will dampen this bullish view and extend the corrective range pattern with another falling leg.
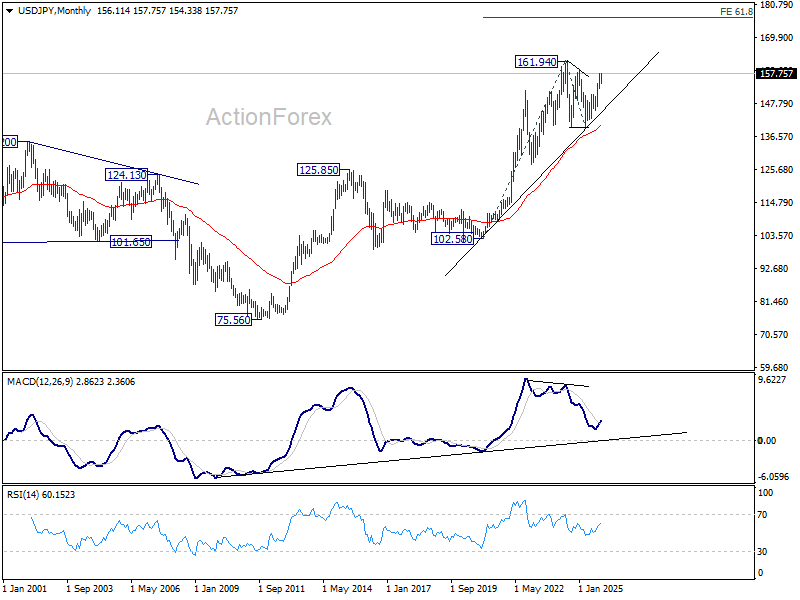
In the long term picture, up trend from 75.56 (2011 low) is still in progress and might be ready to resumption. Firm break of 161.94 will target 61.8% projection of 102.58 (2020 low) to 161.94 (2024 high) from 139.87 at 176.55 in the medium term.
GBP/USD Weekly Outlook
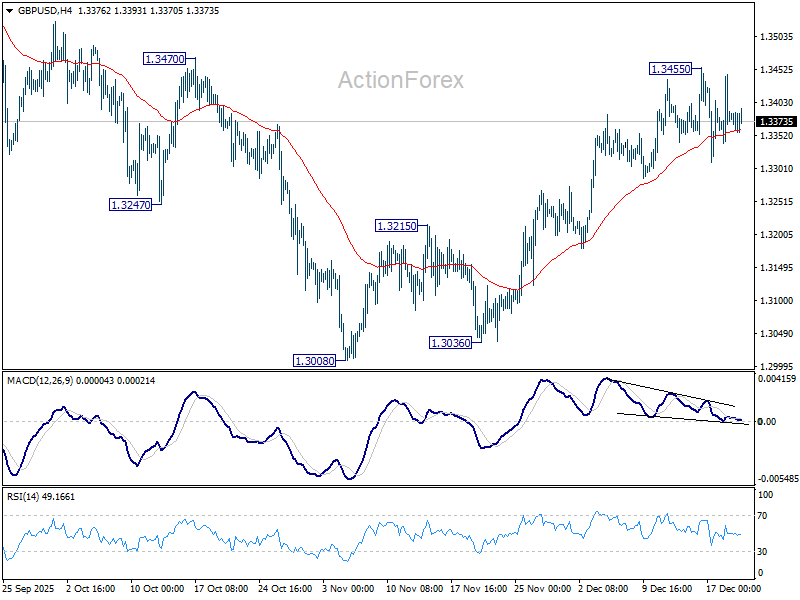
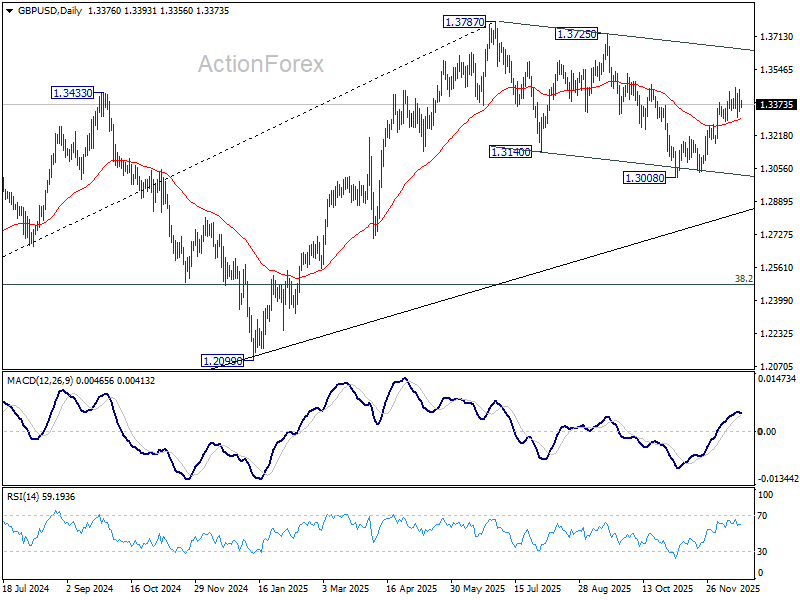
GBP/USD edged higher to 1.3455 last week but quickly retreated. Initial bias remains neutral this week first, On the upside, above 1.3455 will resume the rebound from 1.3008. Firm break of 1.3470 resistance will pave the way to retest 1.3787 high. However, sustained break of 55 D EMA (now at 1.3301) will argue that the rebound has completed. Deeper fall would be seen back to 1.3008 support to resume the whole corrective pattern from 1.3787 high.
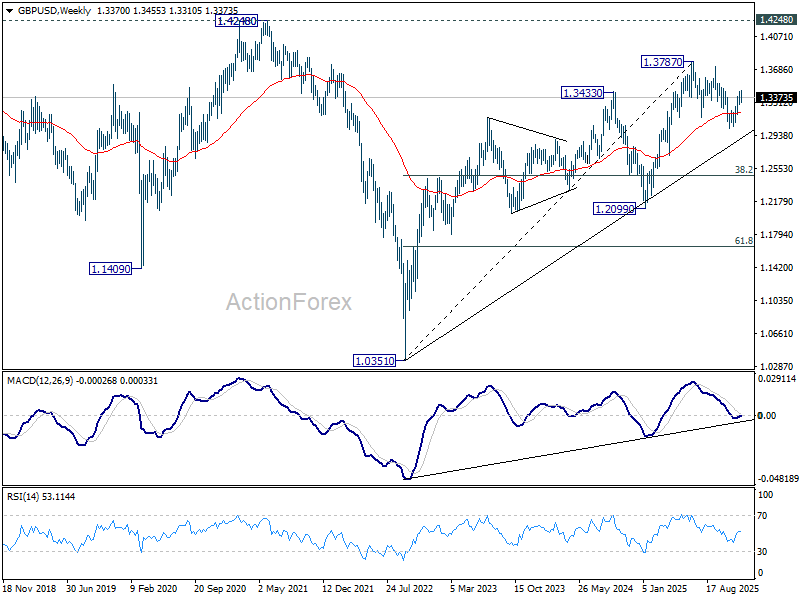
In the bigger picture, current development suggests that fall from 1.3787 is merely a corrective move, and larger rise from 1.0351 (2022 low) is still in progress. Firm break of 1.3787 will target 1.4248 (2021 high) key structural resistance. This will remain the favored case as long as target 38.2% retracement of 1.0351 to 1.3787 at 1.2474 holds, in case of another fall.
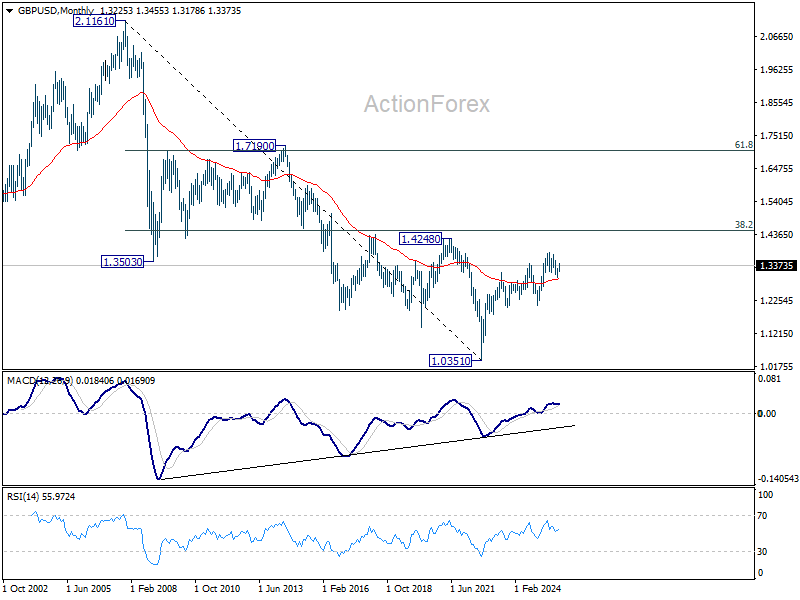
In the long term picture, as long as 1.4248/4480 resistance zone holds (38.2% retracement of 2.1161 to 1.0351 at 1.4480), the long term outlook will remain bearish. That is, price actions from 1.3051 are seen as a corrective pattern to down trend from 2.1161 (2007 high) only. Nevertheless, decisive break of 1.4248/4480 will be a strong sign of long term bullish reversal.
USD/CHF Weekly Outlook
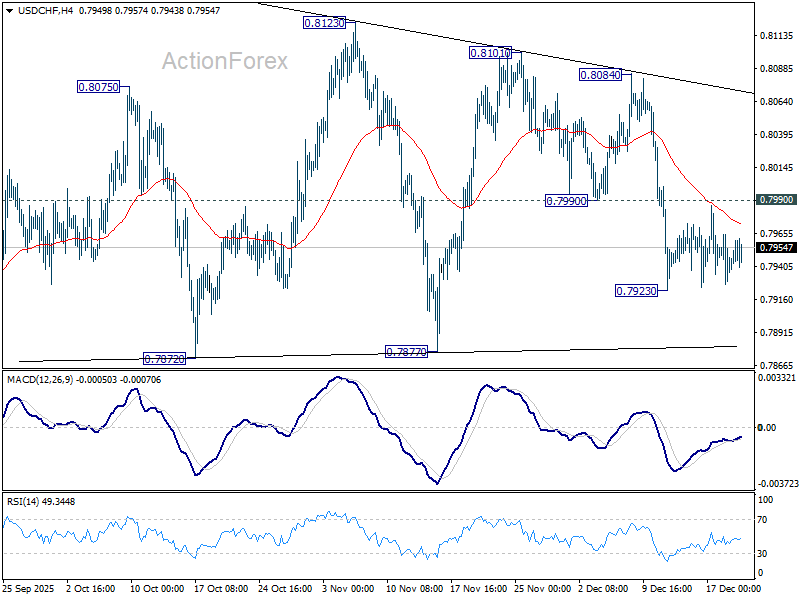
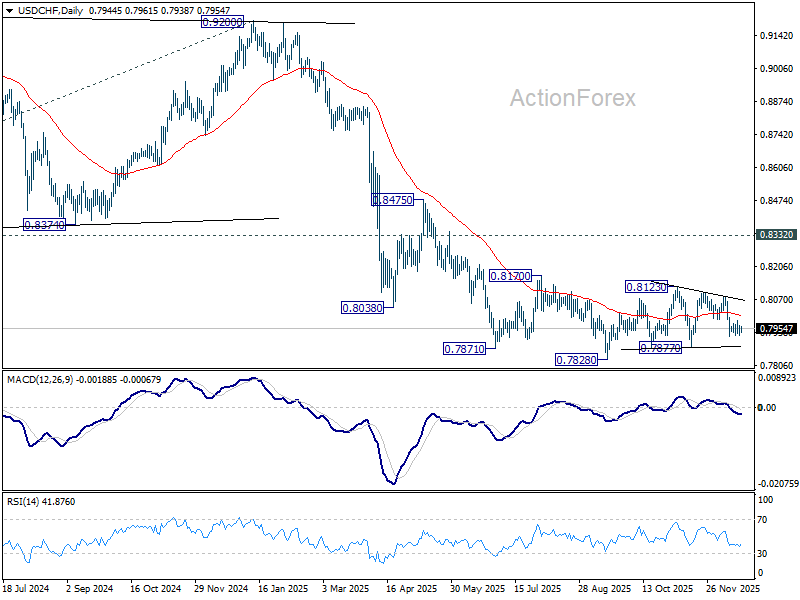
USD/CHF stayed in tight range above 0.7923 last week and outlook is unchanged. Overall, corrective pattern from 0.7828 could extend further. On the downside, below 0.7923 will target 0.7877 support. On the upside, though, break of 0.7990 support turned resistance will bring stronger rebound towards 0.8084.
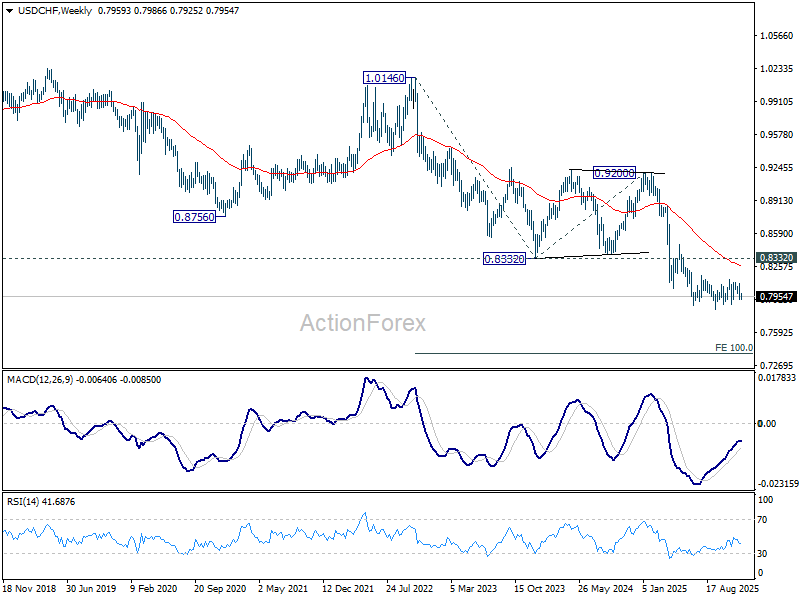
In the bigger picture, outlook will stay bearish as long as 0.8332 support turned resistance holds (2023 low). Long term down trend from 1.0342 (2017 high) is still in progress. Next target is 100% projection of 1.0146 (2022 high) to 0.8332 from 0.9200 at 0.7382.
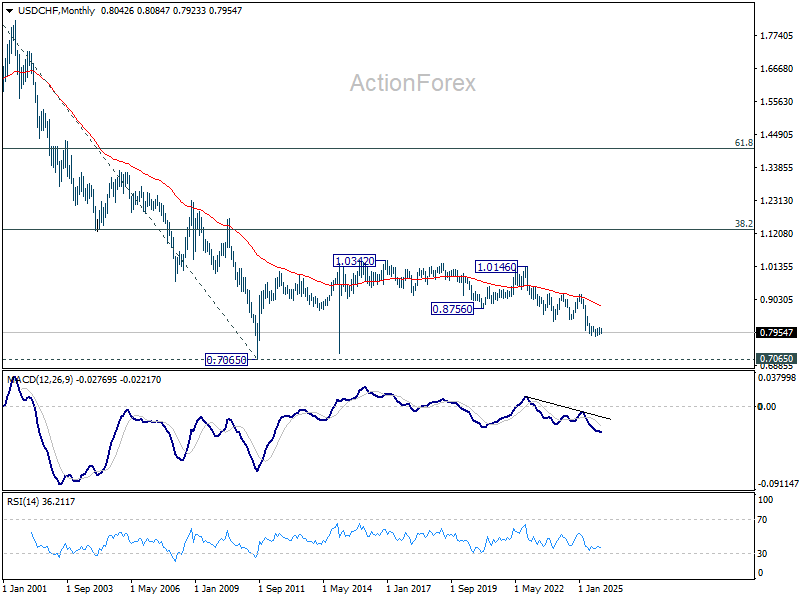
In the long term picture, price action from 0.7065 (2011 low) are seen as a corrective pattern to the multi-decade down trend from 1.8305 (2000 high). It's uncertain if the fall from 1.0342 is the second leg of the pattern, or resumption of the downtrend. But in either case, outlook will stay bearish as long as 0.8756 support turned resistance holds (2021 low). Retest of 0.7065 should be seen next.
AUD/USD Weekly Report
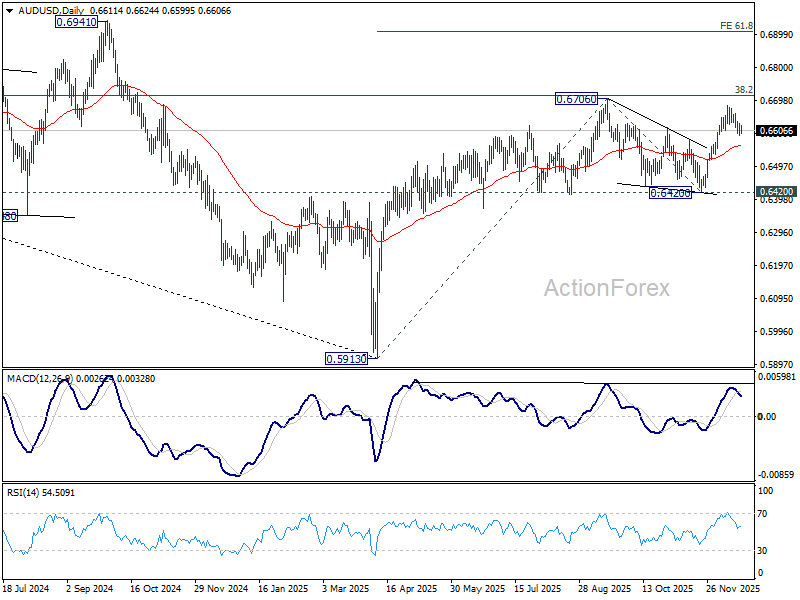
AUD/USD gyrated lower last week as consolidations from 0.6685 continues but outlook is unchanged. Further rally is expected for now. Decisive break of 0.6706 will resume the whole rise from 0.5913 and target 61.8% projection of 0.5913 to 0.6706 from 0.6420 at 0.6910. However, sustained break of 55 D EMA (now at 0.6561) will extend the corrective pattern from 0.6706 with another falling leg back to 0.6420 support.
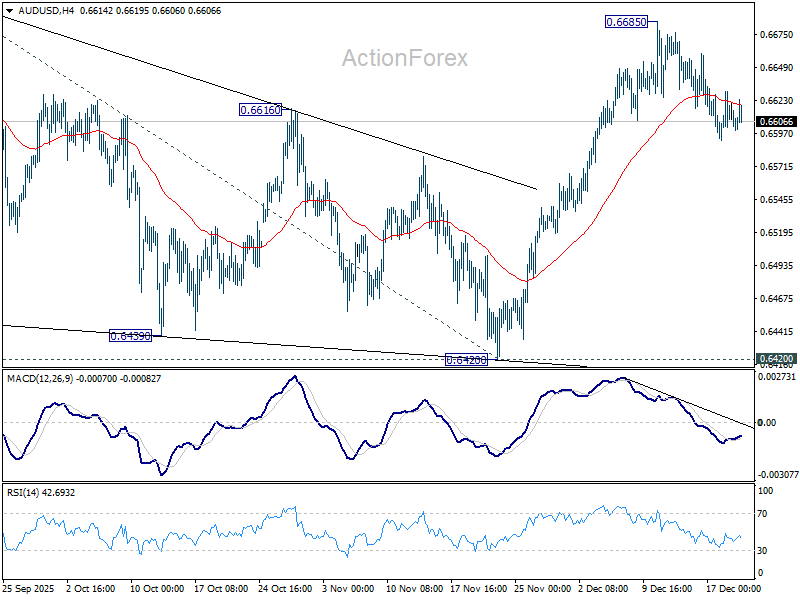
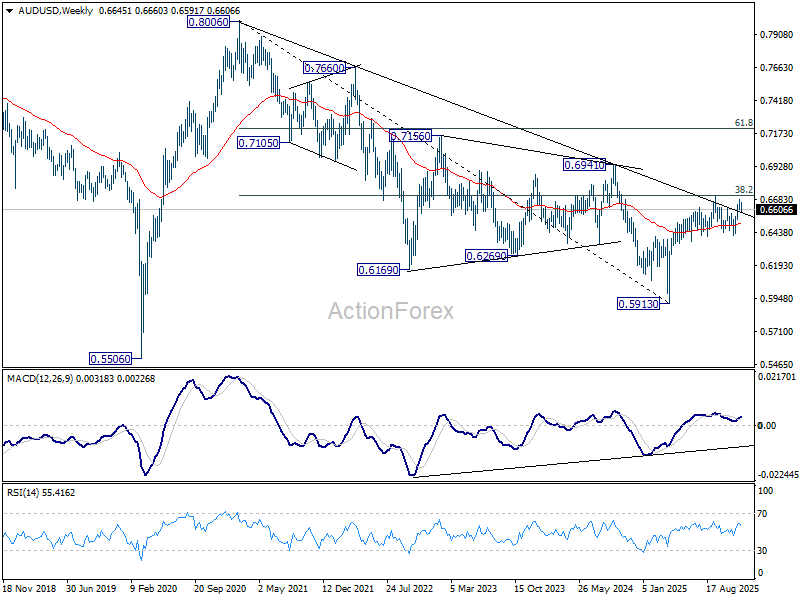
In the bigger picture, the break of multi-year falling trend line resistance suggests that rise from 0.5913 is possibly reversing whole down trend from 0.8006 (2021 high). Decisive break of 38.2% retracement of 0.8006 to 0.5913 at 0.6713 will solidify this case, and bring further rally to 61.8% retracement at 0.7206. On the downside, however, firm break of 0.6420 support will suggest rejection by 0.6713 and retain medium term bearishness.
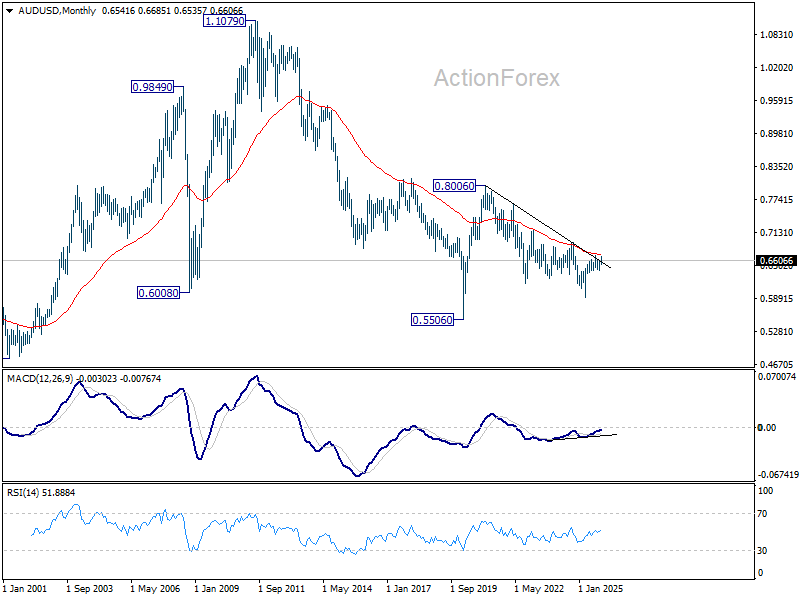
In the long term picture, fall from 0.8006 is seen as the second leg of the corrective pattern from 0.5506 long term bottom (2020 low). Hence, in case of deeper decline, strong support should emerge above 0.5506 to contain downside to bring reversal. On the upside, firm break of 0.6941 will argue that the third leg has already started back to 0.8006 and above.
USD/CAD Weekly Outlook
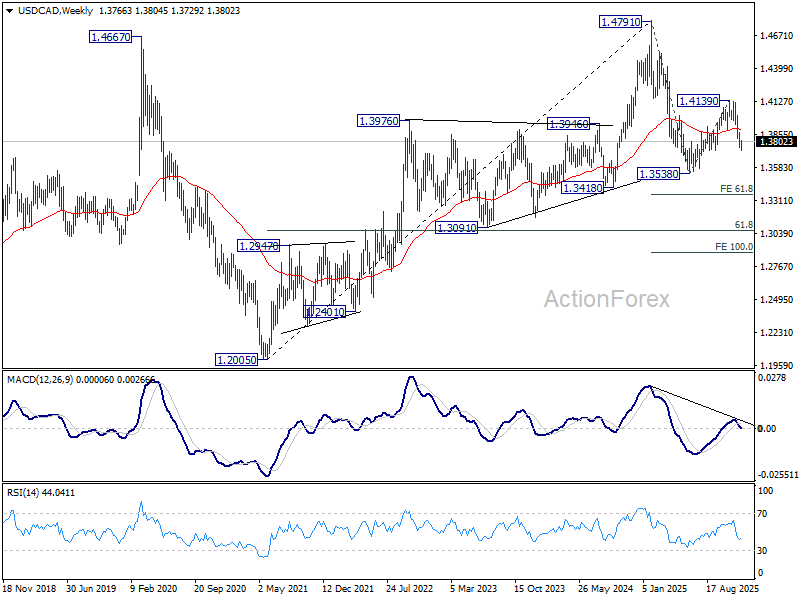
USD/CAD edged lower to 1.3728 last week but recovered after drawing support from 61.8% retracement of 1.3538 to 1.4139 at 1.3768. Initial bias stays neutral this week first. On the downside, sustained trading below 1.3768 will argue that whole decline form 1.4791 might be ready to resume, and bring retest of 1.3538 low next. However, break of 1.3870 resistance will indicate short term bottoming, and turn bias back to the upside for stronger rebound.
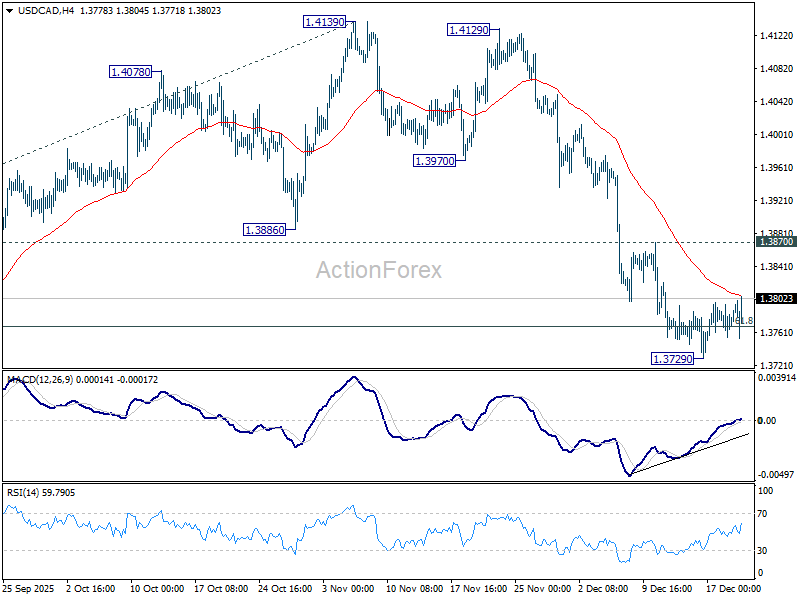
In the bigger picture, current development suggests that price actions from 1.4791 is developing into a deeper, larger scale correction. In the less bearish case, it's just correcting the rise from 1.2005 (2021 low). But even so, break of 1.3538 will pave the way to 61.8% projection of 1.4791 to 1.3538 from 1.4139 at 1.3365. This will remain the favored case as long as 1.4139 resistance holds, in case of rebound.
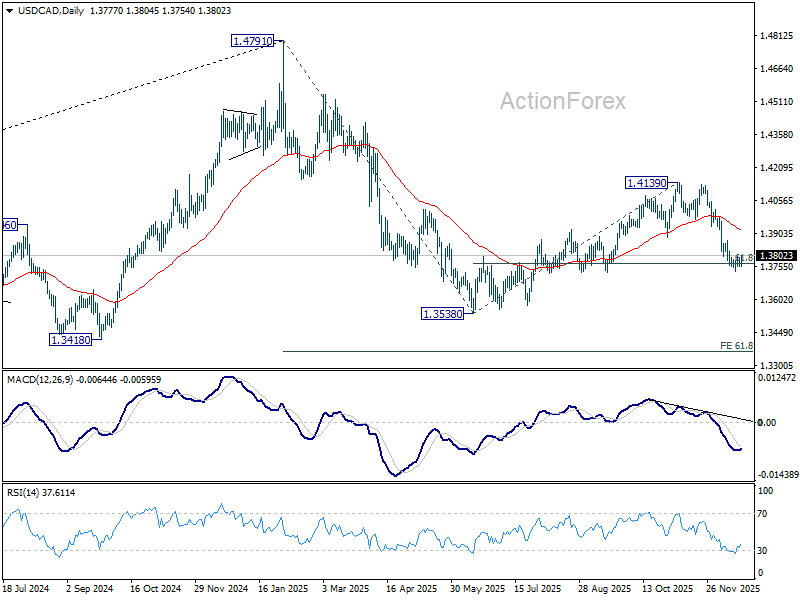
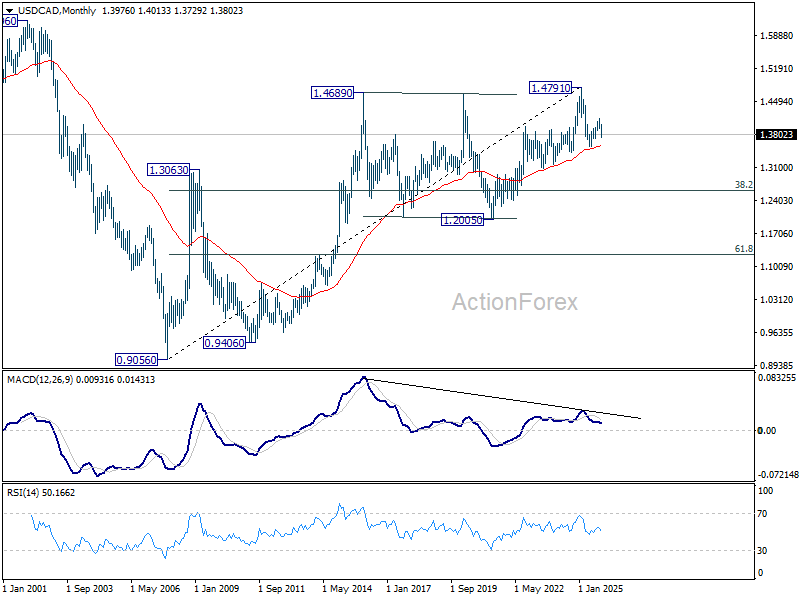
In the long term picture, rising 55 M EMA (now at 1.3567) remains intact. Thus, up trend from 0.9056 (2007 low) should still be in progress. However, considering bearish divergence condition M MACD, sustained trading below 55 M EMA will argue that the up trend has completed with five waves up to 1.4791, and turn medium term outlook bearish for correction to 38.2% retracement of 0.9056 to 1.4791 at 1.2600.