

Sample Category Title
The ECB Is Likely To Start Reducing Its Asset Repurchase Program In The Next Quarter
The number of initial jobless claims in the US fell to an 18-month low (currently 310,000, previously 345,000). This statistics dispelled fears of slowing economic recovery, but also increased other concerns that the Fed would start to reduce the QE program as early as November this year. The main US stock indexes closed in the red zone yesterday. The S&P 500 and Dow Jones indices decreased for the fourth session in a row. This is not a good sign, which indicates that investors are closing their positions. Many analysts expect the market to fall in the coming months. The head of the Federal Reserve Bank of Atlanta Rafael Bostic says that the Fed may start to reduce the asset purchase program this year and make the appropriate decision at the next meeting. Only an increase in the number of COVID-19 cases can put off the decision, but the situation is under control so far.
European stock indices traded mixed yesterday. The British FTSE 100 decreased by 1% to its lowest level since July 28, while Spain's IBEX 35 decreased to its lowest level since early August. Meanwhile French CAC 40 increased by 0.2%, German DAX added 0.08%, Italian FTSE MIB added 0.1%. The ECB announced that the volume of its Pandemic Emergency Purchase Program (PEPP) would remain unchanged, but it's possible the regulator would begin to reduce the bond-buying program in the next quarter. Also, the ECB raised its forecast for Eurozone GDP growth in 2021, while lowering its forecast for 2022 and keeping its 2023 forecast unchanged. The region's inflation forecast for 2021 was raised to 2.2% from 1.9%, for the next year to 1.7% from 1.5%, and for 2023 to 1.5% from 1.4%.
The situation in the oil market is getting more complicated. Yesterday, China began selling oil from its strategic reserves to ease inflationary pressures in the country. Such news led to a sharp drop in oil prices. Asian buyers of oil from the US Gulf of Mexico platforms, which were shut down due to Hurricane Ida, are now looking for alternatives from Russia and the Middle East, which also puts pressure on prices. On the other hand, US oil inventories decreased by 1.5 million barrels per week, which plays in favor of higher prices.
The uncertainty over the timing of QE program cuts puts pressure on gold prices. With a high probability, investors will not see significant growth before the start of the "tapering", so both gold and silver are likely to trade in a wide corridor.
China's Shanghai Composite closed at its highest level in six years. A phone call between the US and Chinese leaders added to investors' optimism. Asian stock indexes increased on Friday as Chinese tech stocks recovered. Stocks added more than 1% in Japan and Hong Kong.
Main market quotes:
- S&P 500 (F) 4,493.28 −20.79 (−0.46%)
- Dow Jones 34,879.38 −151.69 (−0.43%)
- DAX 15,623.15 +12.87 (+0.08%)
- FTSE 100 7,024.21 −71.32 (−1.01%)
- USD Index 92.52 −0.13 (−0.14%)
Important events for today:
- UK GDP (q/q) at 09:00 (GMT+3);
- UK Manufacturing Production (m/m) at 09:00 (GMT+3);
- Canada Unemployment Rate (m/m) at 15:30 (GMT+3);
- US Producer Price Index (m/m) at 15:30 (GMT+3).
The Analytical Overview Of The Main Currency Pairs
The EUR/USD currency pair
Technical indicators of the currency pair:
Prev Open: 1.1818
Prev Close: 1.1823
% chg. over the last day: +0.04%
The European Central Bank has kept the interest rate unchanged, but the regulator will cut the bond purchase program in the next quarter. ECB officials made it clear that the economy still needs support as business activity in the Eurozone should return to pre-pandemic levels only at the end of this year, while the spread of the delta strain can delay the full opening of the economy.
Trading recommendations
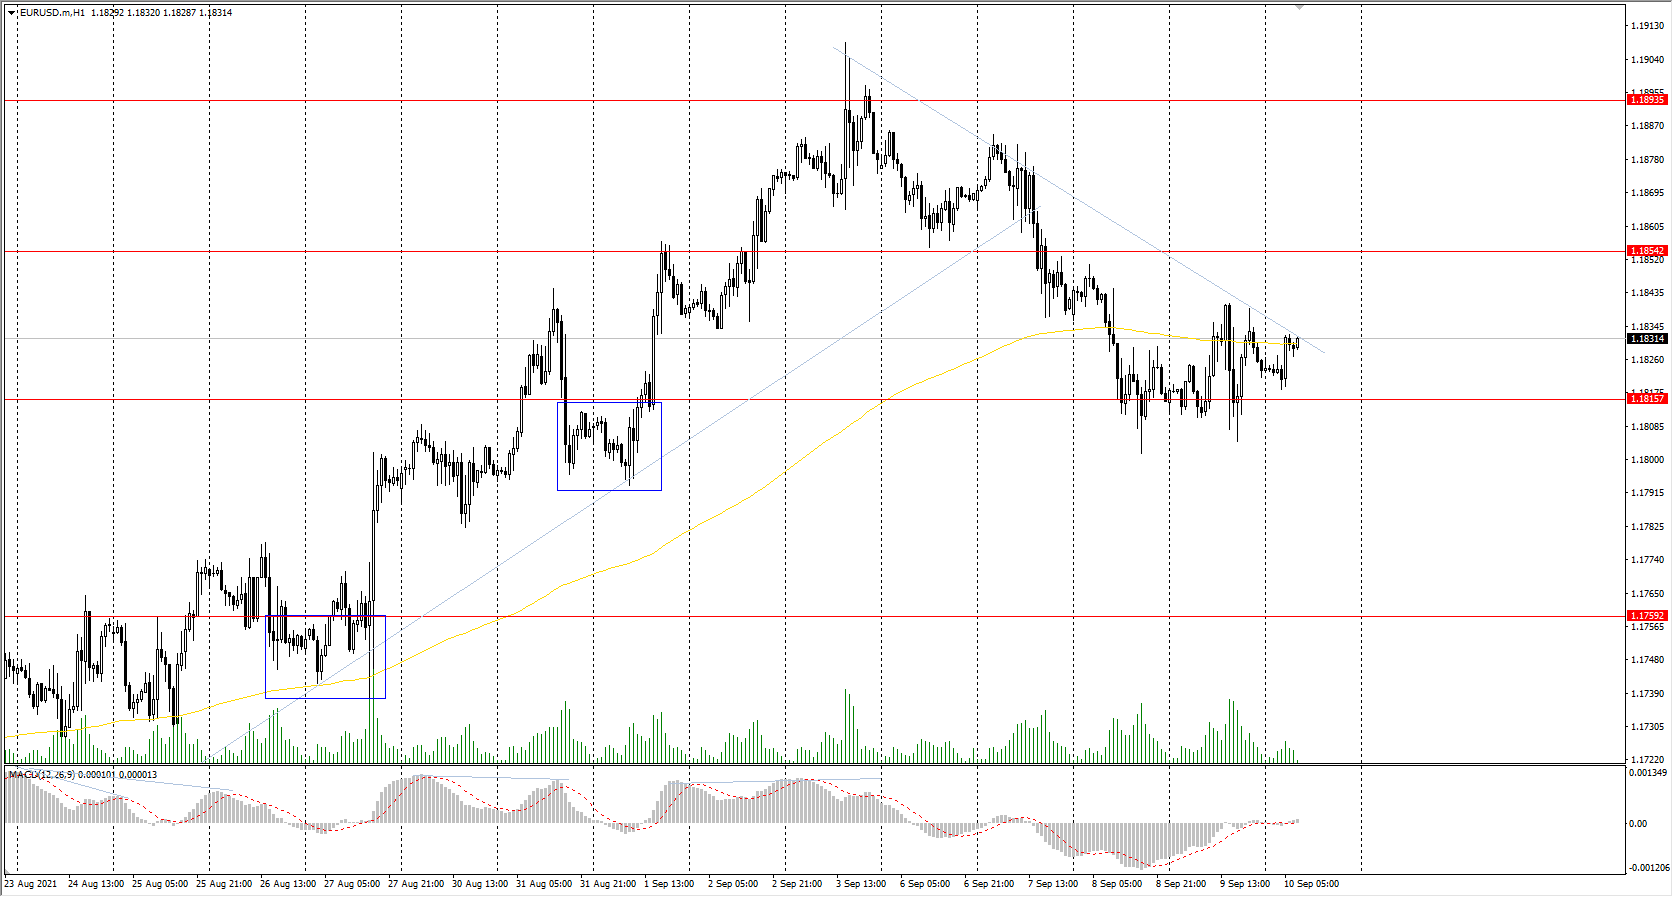
Support levels: 1.1816, 1.1799, 1.1759, 1.1704, 1.1620
Resistance levels: 1.1854, 1.1894, 1.1934, 1.1969
From a technical point of view, the general trend of the EUR/USD currency pair is bullish, but there is also a corrective downward movement observed on the hourly time frame. The MACD indicator became inactive. Under such market conditions, it is better to look for sell trades from the resistance levels, where sellers show initiative. Buy trades can be considered from the support levels near the moving average, or after the breakout of the downtrend line.
Alternative scenario: if the price breaks through the 1.1704 support level and fixes below, the mid-term uptrend will likely be broken.
News feed for 2021.09.10:
- US Producer Price Index (m/m) at 15:30 (GMT+3).
The GBP/USD currency pair
Technical indicators of the currency pair:
Prev Open: 1.3771
Prev Close: 1.3836
% chg. over the last day: +0.47%
On the background of the dollar index decline, the British pound significantly strengthened yesterday. An important macro statistical data is expected to be released during the European session today, so the currency pairs with the pound sterling will be more volatile.
Trading recommendations
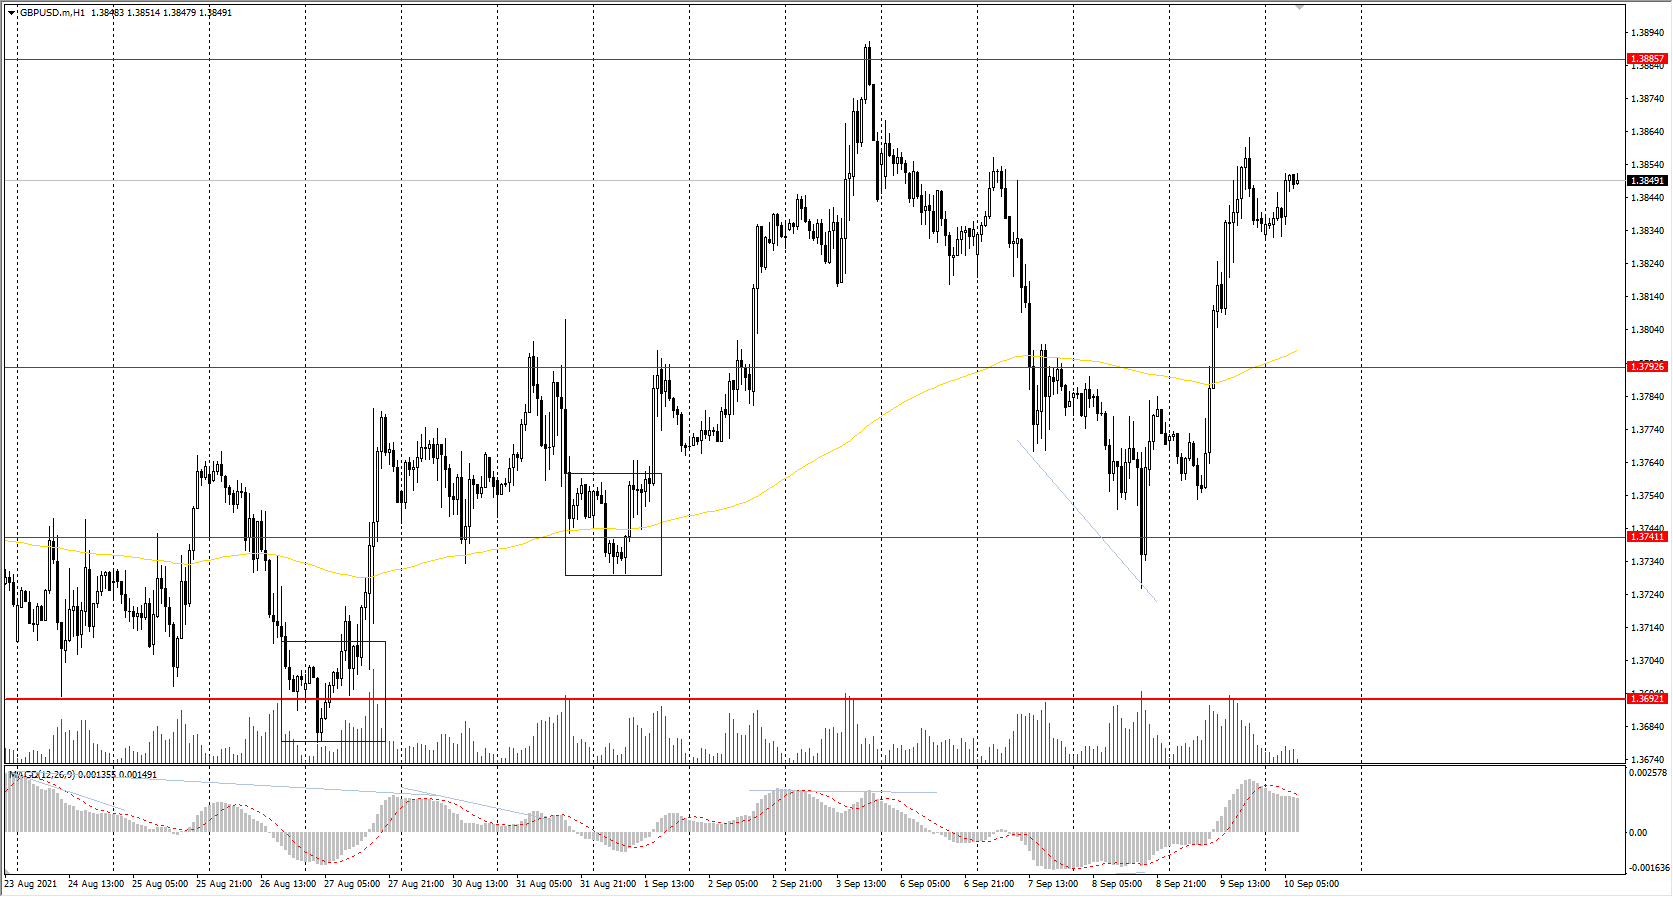
Support levels: 1.3793, 1.3741, 1.3692, 1.3632, 1.3614, 1.3525
Resistance levels: 1.3886, 1.3935, 1.4002
On the hourly time frame, the GBP/USD trend is bullish. Yesterday, the price confidently rebounded from the support level near the moving average. The MACD indicator became positive with no signs of reversal. Under such market conditions, it is better to look for buy trades from the support levels, where buyers show initiative. Sell positions can only be considered with short targets from the resistance levels.
Alternative scenario: if the price breaks through the 1.3692 support level and consolidates below, the bearish scenario will likely resume.
News feed for 2021.09.10
- UK GDP (q/q) at 09:00 (GMT+3);
- UK Manufacturing Production (m/m) at 09:00 (GMT+3).
The USD/JPY currency pair
Technical indicators of the currency pair:
Prev Open: 110.21
Prev Close: 109.73
% chg. over the last day: -0.44%
Japanese Finance Minister Taro Aso, speaking at a regular press conference, said that Japan should not make its public finances the target of experiments for weak financial management. The diplomat reacted to a proposal by Sanae Takaichi, a contender for leadership in the ruling party, to postpone the progress of the primary budget balance target until inflation of 2% is achieved.
Trading recommendations
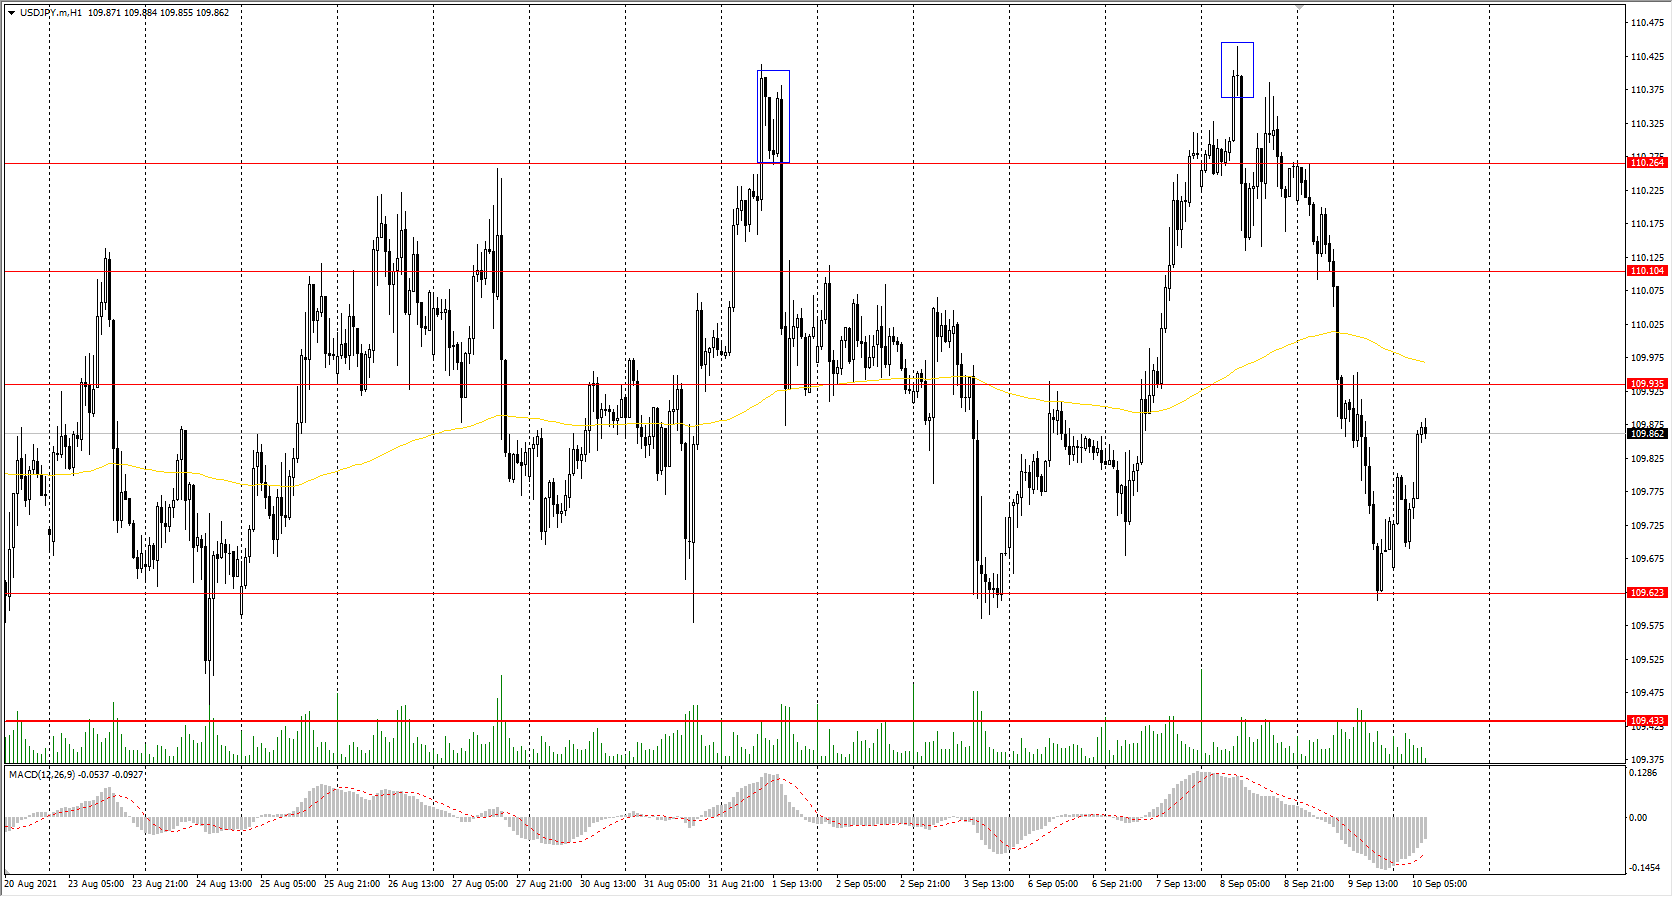
Support levels: 109.62, 109.43, 109.19, 108.65
Resistance levels: 109.94, 110.11, 110.26, 110.66, 110.95, 111.48
The main trend of the USD/JPY currency pair is bullish. But against the background of the dollar weakness, the price of USD/JPY sharply decreased yesterday. The MACD indicator became negative. Under such market conditions, traders should look for buy trades from the support level, where buyers show initiative. Sell positions should be considered on the lower time frames from the zones where sellers show initiative.
Alternative scenario: if the price falls below 109.43, the uptrend is likely to be broken.
The USD/CAD currency pair
Technical indicators of the currency pair:
Prev Open: 1.2685
Prev Close: 1.2662
% chg. over the last day: -0.18%
The Canadian dollar is a commodity currency, so the USD/CAD currency pair is highly dependent on the dynamics of the dollar index and oil prices. Both the dollar index and oil prices decreased yesterday. As a result, the USD/CAD currency pair is trading without dynamics.
Trading recommendations
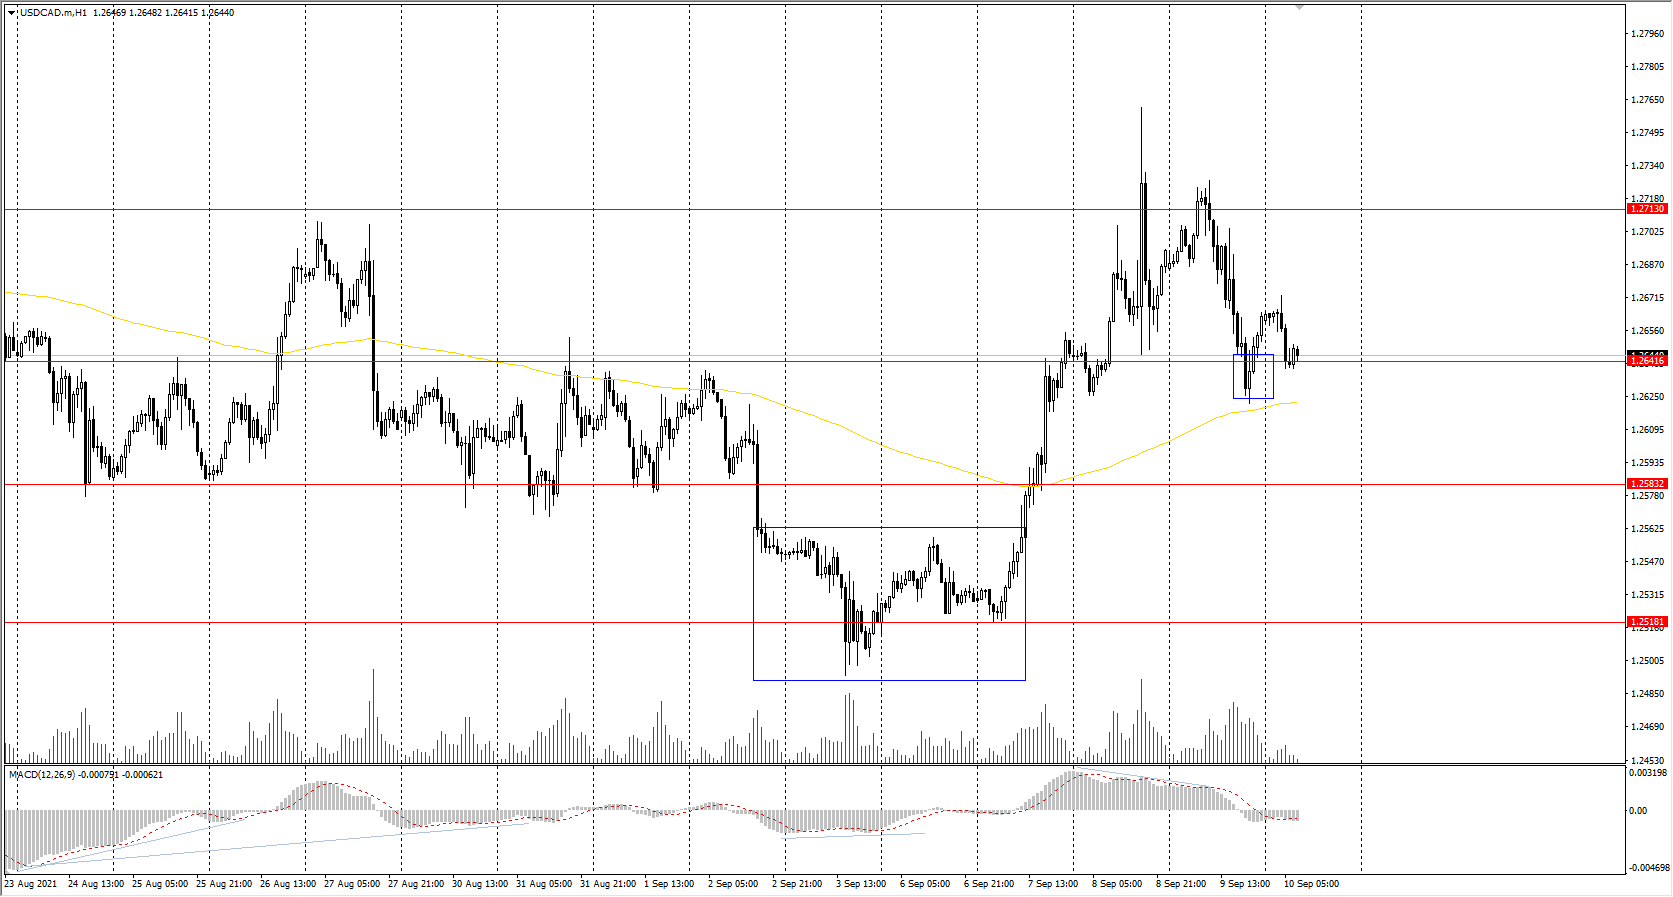
Support levels: 1.2641, 1.2583, 1.2518, 1.2425
Resistance levels: 1.2713, 1.2812, 1.2891, 1.2951
In terms of technical analysis, the trend on the USD/CAD currency pair is bearish. But the price has consolidated in a local correctional upward movement. The MACD indicator shows weak sellers' pressure. It is better to consider sell positions from the resistance levels, where sellers show initiative. Buy positions can be considered with short targets from the support levels where buyers show initiative.
Alternative scenario: if the price breaks through the 1.2812 resistance level and fixes above, the uptrend will likely resume.
News feed for 2021.09.10:
- Canada Unemployment Rate (m/m) at 15:30 (GMT+3).
GBP/USD Outlook: Bulls Hold Grip Despite Weak GDP And Pressure Key 1.39 Resistance Zone
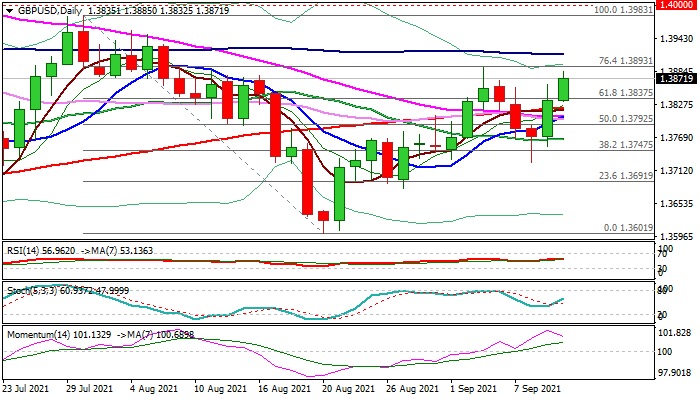
Cable extends strong advance into the second straight day as bulls ignored weak July GDP data but remain underpinned by weaker dollar and BOE’s 4-4 split on possible rate hike, ahead of central bank’s Sep 23 policy meeting. The action was also supported by Wednesday’s Hammer candle which signaled reversal and Thursday’s bullish signal on close above 200DMA (1.3822), while long tail of this week’s candle adds to positive signals.
Bulls pressure key barriers at 1.3900 zone (Fibo 76.4% of 1.3983/1.3601 at 1.3893, daily cloud top at 1.3910 and 100DMA at 1.3915), with sustained break here to open way towards next key levels at 1.3983/1.4000 (July 30 peak/psychological).
Caution on fading bullish momentum on daily chart which may provide headwinds but bulls are expected to remain in play while holding above key supports at 1.3822/18 (broken 200DMA/daily cloud base).
Res: 1.3893, 1.3910, 1.3957, 1.3983.
Sup: 1.3837, 1.3818, 1.3800, 1.3765.
NZD/JPY Breakout Could Occur
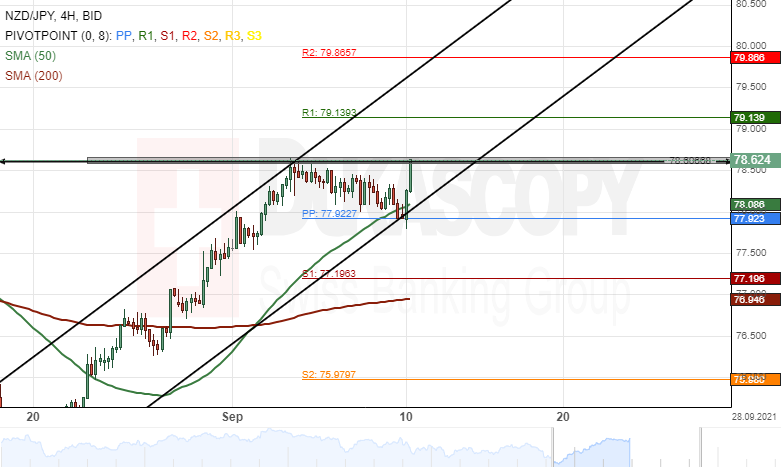
The NZD/JPY currency pair has been trading in an ascending channel pattern since August 20. The New Zealand Dollar has surged by 4.90% against the Japanese Yen during this period.
Currently, the exchange rate is trading near the lower boundary of an ascending channel pattern and could be set for a breakout.
If the breakout occurs, a decline towards the 200– period simple moving average at 77.00 could be expected next week.
However, if the channel pattern holds, buyers could drive the currency exchange rate higher during the following trading sessions.
CAD/CHF Two Scenarios Likely
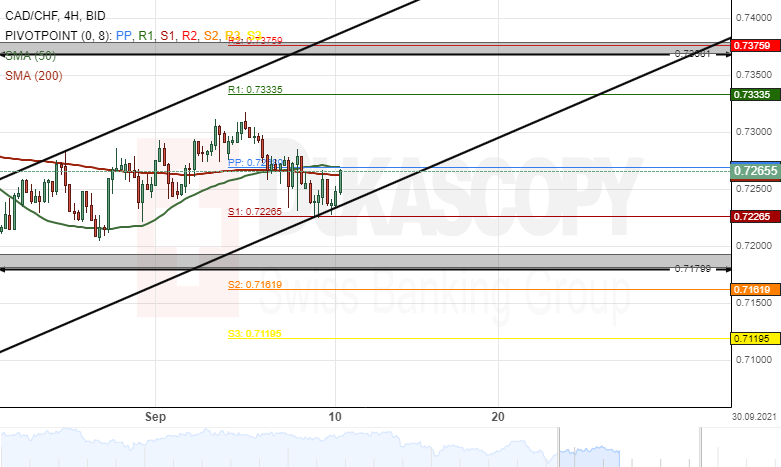
Since this week's trading sessions, the Canadian Dollar has declined by 82 pips or 1.12% against the Swiss Franc. The currency pair tested the lower boundary of an ascending channel pattern at 0.7226 on September 9.
Everything being equal, the exchange rate could continue to trend lower. Sellers are likely to target the psychological support level at 0.7100 during next week's trading sessions.
However, if the channel pattern holds, the CAD/CHF currency exchange rate would make a pullback towards the resistance line at 0.7375 next week.
EUR/USD Analysis: Passes Resistance Of SMAs
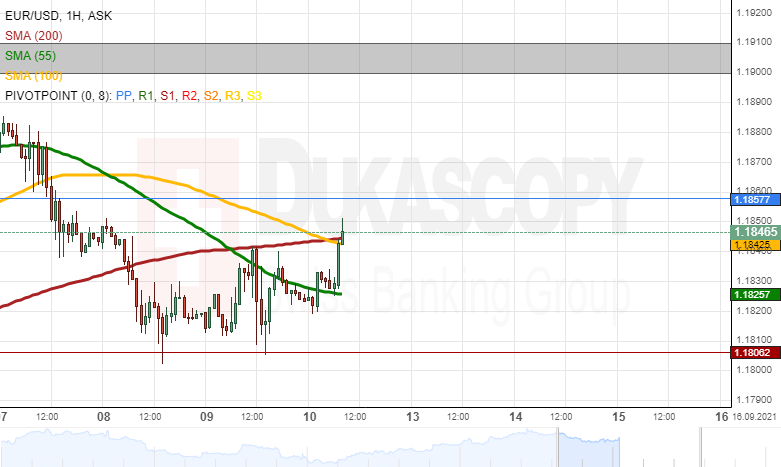
On Friday morning, the EUR/USD currency exchange rate passed the resistance of the 55, 100 and 200-hour simple moving averages and reached the 1.1850 level.
In the near term future, the currency exchange rate could test the resistance of the weekly simple pivot point at the 1.1858 level. Above this level, the pair could test the July and August high level zone near 1.1900.
On the other hand, a decline of the rate would look for support in the 100 and 200-hour simple moving averages near 1.1840. Afterwards, the 55-hour SMA at 1.1825 might also provide support. Below the SMAs, the weekly S1 simple pivot point at 1.1806 could once again support the EUR/USD.
GBP/USD Analysis: Tests September High
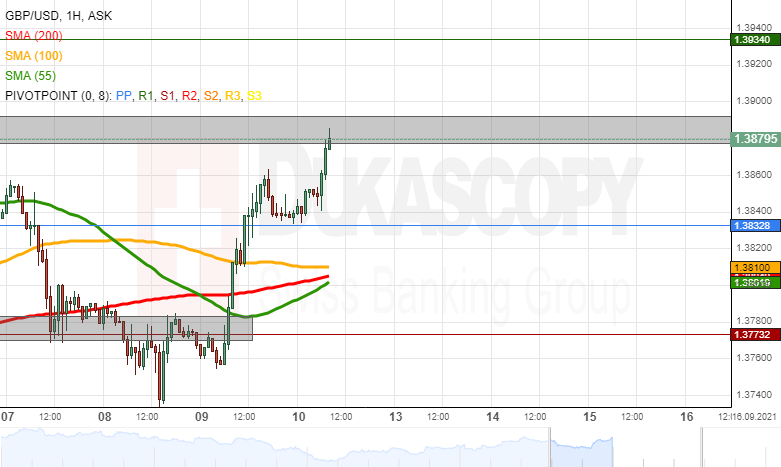
The GBP/USD passed all technical resistance levels up to the September high level zone. On Friday morning, the rate was testing the resistance of the zone. Future forecasts depended on whether the resistance holds.
In the case that the September high zone holds, a potential decline wouldaim at the weekly simple pivot point at 1.3833. Below the pivot point, the pair could find support in the combination of the 55, 100 and 200-hour simple moving averages near 1.3810.
However, a passing of the September high level zone could result in the pair first testing the 1.3900 level. Afterwards, the 1.3934 level where the weekly R1 simple pivot point is located at might serve as resistance.
USD/JPY Analysis: Bounces Off SMAs
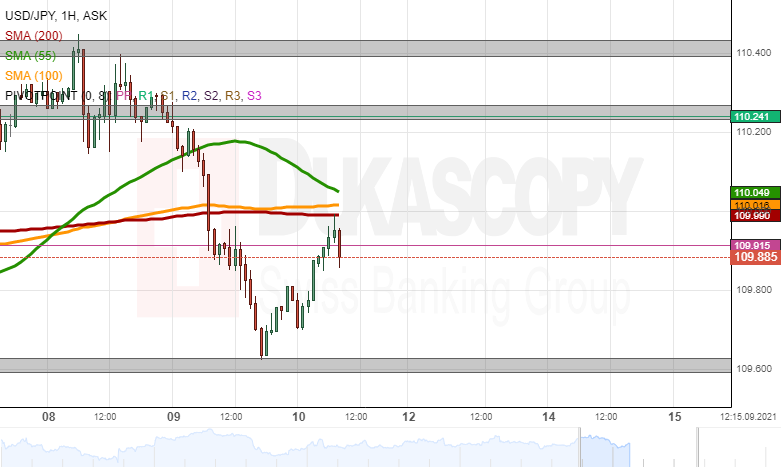
On Friday morning, the USD/JPY bounced off the combined resistance of the 55, 100 and 200-hour simple moving averages and the 110.00 round exchange rate level. Meanwhile, note that the rate ignored the support and resistance of the weekly simple pivot point at 109.82.
In the case that the rate declines, it could look for support near the 109.60 level. A support zone near this level has kept the pair up throughout September.
On the other hand, a potential surge would once again test the resistance of the 110.00 level and the three simple moving averages. Above these levels, the 110.25 might provide additional resistance.
Gold Analysis: Pierces 1,800.00 Level
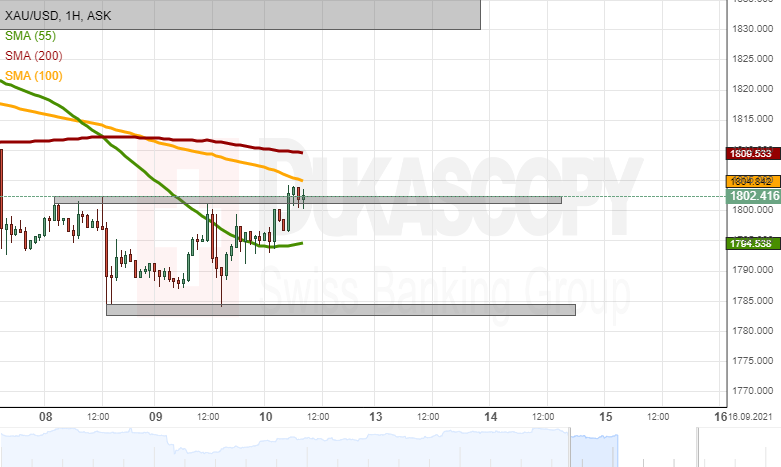
The yellow metal's price passed the resistance of the 1,800.00 level on Friday morning. The 1,800.00 kept the rate from surging since the start of September 8. However, the price almost immediately found resistance in the 100-hour simple moving average near 1,805.00.
In the case that the price passes the 100-hour simple moving average, the bullion could test the resistance of the 200-hour SMA at 1,809.50. Above the 200-hour SMA, the summer high levels at 1,830.00/1,835.00 might once again serve as resistance.
However, a bounce off from resistance would possibly look for support in the 55-hour simple moving average at 1,795.00. Below the SMA, the support zone just below the 1,785.00 might provide support.
It’s Good To Talk
You know it's a quiet week when the weekly US Initial Jobless Claims spurs Fed tapering fears and leads to a stock market sell-off. That's pretty much what happened, though. This was despite a strong US 30-year bond auction sending yields lower and the US dollar falling. All-in-all it sums up what I had telegraphed earlier in the week, a lack of tier-1 data points would lead to a choppy market dominated by intra-sentiment.
Perhaps the only theme I can glean from this week is that despite the nightmare Non-Farm's last Friday, high-frequency surveys and the JOLTS Job Openings data suggest there are a vast number of jobs in America, the problem is getting Americans to take them. Thus, the headline Non-Farms may not be telling the whole story, and the Fed taper could still be on at year's end.
However, sentiment has abruptly reversed in Asia today as news that President Biden and President Xi had had their first phone call in seven months. China state television is also running a story saying that President Xi wants better trading relationships with ASEAN countries. China has also sent an olive branch letter to Australia's government, asking them to support China's application to join the CPTPP, the old Trans-Pacific Partnership.
All of that is music to the ears of the Asia-Pacific, improved trade with the region, tick. Potentially thawing relations with Australia; tick. President Biden and President Xi talking in person as the first step to warming relations between the two superpowers; tick, tick, tick, tick, my pen has run out of ink. Unsurprisingly, Asian equities are following the China charm offensive and heading north. It certainly has more substance than using the weekly Initial Jobless Claims to justify a mini taper-tantrum.
ECB reduces PEPP bond-buying
Last night's ECB policy meeting was a bit of a non-event. The ECB didn't taper (ask Christine Lagarde), but they decided to reduce the front-loaded pace of PEPP bond-buying and extend it over a longer period into the programme's termination around March 2022. What they didn't say was by how much they would reduce their bond-buying to. Still, it left the hawks and the doves with their dignity intact, and its impact on markets was minimal to non-existent.
Later today, German Inflation and US PPI might spark some intra-day volatility. However, today's Asian calendar is more threadbare than my tee-shirt today (none of Mrs Halley's online shopping lands on this pauper's back), leaving markets in Asia to bask in the warm afterglow of hope that is improving US/China, ASEAN/China and Australia/China relations. As good a reason to fill ‘yah boots on the global recovery trade as any. Happy Friday.