Sample Category Title
Stocks Perk Up But Shaky After Biden-Xi Call, Dollar Pares Weekly Gains
- Global equities in better mood, Biden-Xi call helps, but Wall Street still looking wobbly
- Euro buys Lagarde’s ‘not tapering’ depiction, stays sluggish after ECB cuts QE pace
- Dollar slides again but on track for weekly gains as Fed officials reaffirm taper timeline
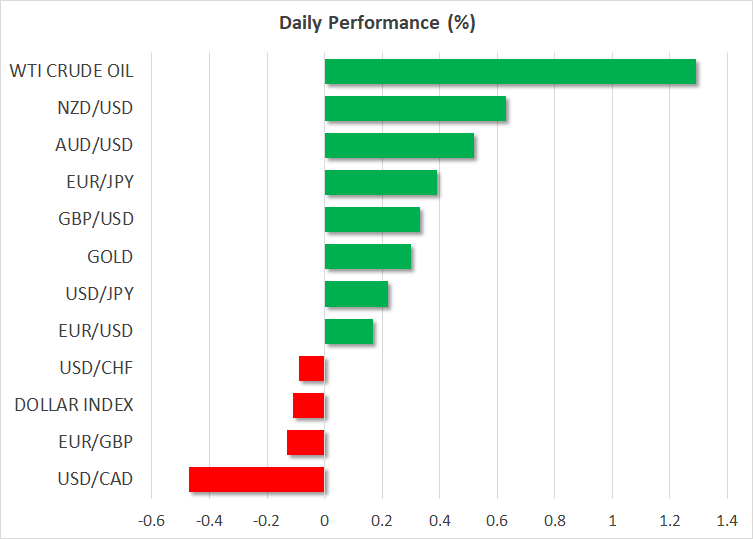 Stocks buoyed by hopes of improved Sino-US ties
Equity markets were looking more cheery on Friday after somewhat of a tumultuous week. Renewed concerns about economic growth amid rising inflation and ongoing disruptions caused by the Delta variant, China’s broadening crackdown on private enterprises, and fears that central banks may remove stimulus too soon all came to a head this week to knock stocks off their pedestal.
However, whilst the losses were widespread across different sectors and regions, US tech stocks had a less disastrous week due to their defensive appeal. But it was Japanese stocks that bucked the global trend as they continued to rally on expectations that whoever replaces outgoing Prime Minister Yoshihide Suga will add more fiscal stimulus to Japan’s virus-stricken economy.
As for the improved mood today, investors were encouraged by signs of a thaw in relations between Washington and Beijing after President Biden had a 90-minute call with his Chinese counterpart – the first in seven months. Disputes over China’s trade practices and influence in the South China Sea have been some of the White House’s frustrations in recent years. And although it’s too early to say whether anything substantive has come out of the talks, it’s provided a much needed lift in Asian markets today, especially as worries remain about China’s tightening grip on the private sector.
The gaming industry is the latest to come under the scrutiny of Chinese regulators, though there was some relief after authorities said they will be slowing not halting the approval of online games following earlier reports that they would be suspending them.
A late bounce back for stocks
China’s CSI 300 index jumped 0.9% today, while in Tokyo, the Nikkei 225 index closed at a six-month high. In Europe, the Euro Stoxx 50 was up 0.3% in early trade and US stock futures were also pointing to solid gains, particularly the Dow Jones, which was last indicated up 0.5%.
Heading towards the September FOMC policy meeting in just under two weeks’ time, Wall Street might struggle to maintain its recent bullish momentum as the Fed looks almost certain to flag tapering for later in the year, most likely in November. Fed Governor Michelle Bowman was the latest FOMC member this week to downplay the surprise miss in the August payrolls number and call for some scaling back of the Fed’s asset purchases.
Better-than-expected jobless claims numbers on Thursday and record job openings in Wednesday’s JOLTS survey underscored the view that the US labour market remains in good shape.
Few fireworks after ECB taper
However, as the Fed still ponders it’s next move, the European Central Bank has beaten it to it, announcing yesterday that it will slow its bond purchases to a “moderately lower pace” as the Eurozone recovery solidifies and inflation picks up.
Not only was the decision widely expected, but so was President Lagarde’s attempt to brand the policy change as ‘recalibration’ rather than tapering. Nevertheless, investors are more likely to get hot and bothered about the ECB’s tapering strategy closer to December when policymakers will have to decide whether to use the PEPP’s full allotment and if the regular asset purchase programme should be ramped up once PEPP ends.
That might explain why the euro posted only modest gains on Thursday, while its advances today were mainly on the back of a weaker US dollar.
The euro is testing the $1.1850 level as the greenback skids again despite steadying overnight. The Japanese yen also pulled back today amid the more positive risk tone.
Kiwi leads gainers, pound shrugs off soft GDP data
The New Zealand dollar was the best performer, shooting up towards $0.7150 to nearly wipe out its weekly losses. Aside from the stronger risk appetite today, signs that New Zealand is bringing the Delta outbreak under control, paving the way for a rate hike by the RBNZ in October, is also boosting the kiwi. The aussie wasn’t that far behind and sterling also gained, climbing to one-week highs in spite of disappointing growth data out of the UK.
UK GDP barely expanded in July, sharply missing estimates, but the Bank of England will probably still be able to hike rates next year so this is likely to keep the pound supported.
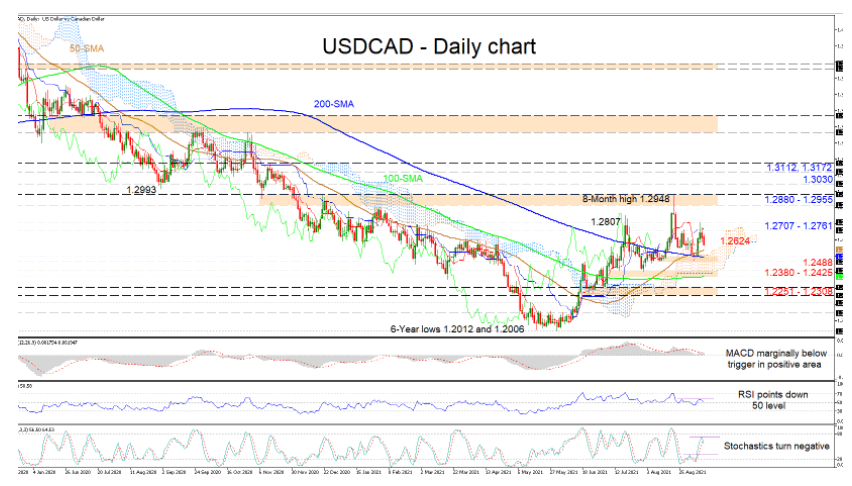
USDCAD Loses Steam Above SMAs, Sellers Step Up
USDCAD, currently at the red Tenkan-sen line at 1.2624, is surrendering ground from the 1.2761 high after its recently made headways, resulting from a bounce off the 200-day simple moving average (SMA). The longer-term 100- and 200-day SMAs are validating a more neutral tone in the pair. That said, the bullish crossover of the 200-day SMA by the 50-day SMA has yet to confirm that sellers are now taking the lead.
The somewhat static Ichimoku lines are indicating a pause in downward forces since the price retreated from the 1.2948 high, while the short-term oscillators are negatively skewed. The MACD, in the positive zone, is being capped by its red trigger line, while the downward facing RSI is flirting with the 50 threshold. The negative charge in the stochastic oscillator is promoting additional bearish price action.
If sellers stay in the driver’s seat, initial downside friction could arise at the 50-day SMA at 1.2573 ahead of the support belt of 1.2488-1.2521. Diving beneath the 200-day SMA, the pair may target the support barricade of 1.2380-1.2425, which encompasses the Ichimoku cloud’s floor as well. From here, a deeper decline could then encounter its next obstruction around the 1.2251-1.2308 barrier.
If buying interest increases, the first region to try and mute upside forces may reside between 1.2707 and 1.2761. However, conquering it could catapult the price to challenge the tough resistance section of 1.2880-1.2955. Passing this reinforced boundary, the pair may then meet the 1.3030 barrier, while another push higher could face the 1.3112 and 1.3172 highs from mid-November 2020.
Summarizing, USDCAD seems to lack convincing upside power and is somewhat adopting a sideways pattern. A clearer price direction could evolve either with a break above 1.2761 or below 1.2488.
EUR/USD Pair Is Now Attempting A Recovery From The 1.1802 Low
The Euro started a fresh decline from well above 1.1880 against the US Dollar. The EUR/USD pair traded below the 1.1860 and 1.1850 support levels.
The pair even declined below the 1.1820 zone and settled below the 50 hourly simple moving average. A low is formed near 1.1802 and the pair is now attempting a recovery. It is now trading near a major bearish trend line with resistance 1.1835 on the hourly chart.
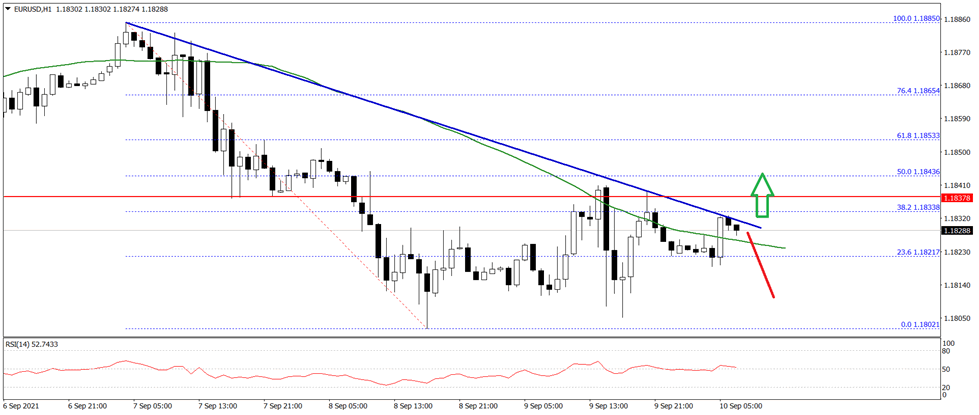
A clear break above the 1.1835 and 1.1840 resistance levels could lead the pair towards the 1.1900 zone. The next major resistance sits near 1.1950 on FXOpen.
On the downside, an initial support is near the 1.1810 level. The key support is near 1.1800, below which there is a risk of a larger decline. The next major support is near the 1.1765 level.
US Oil Consolidates Gains
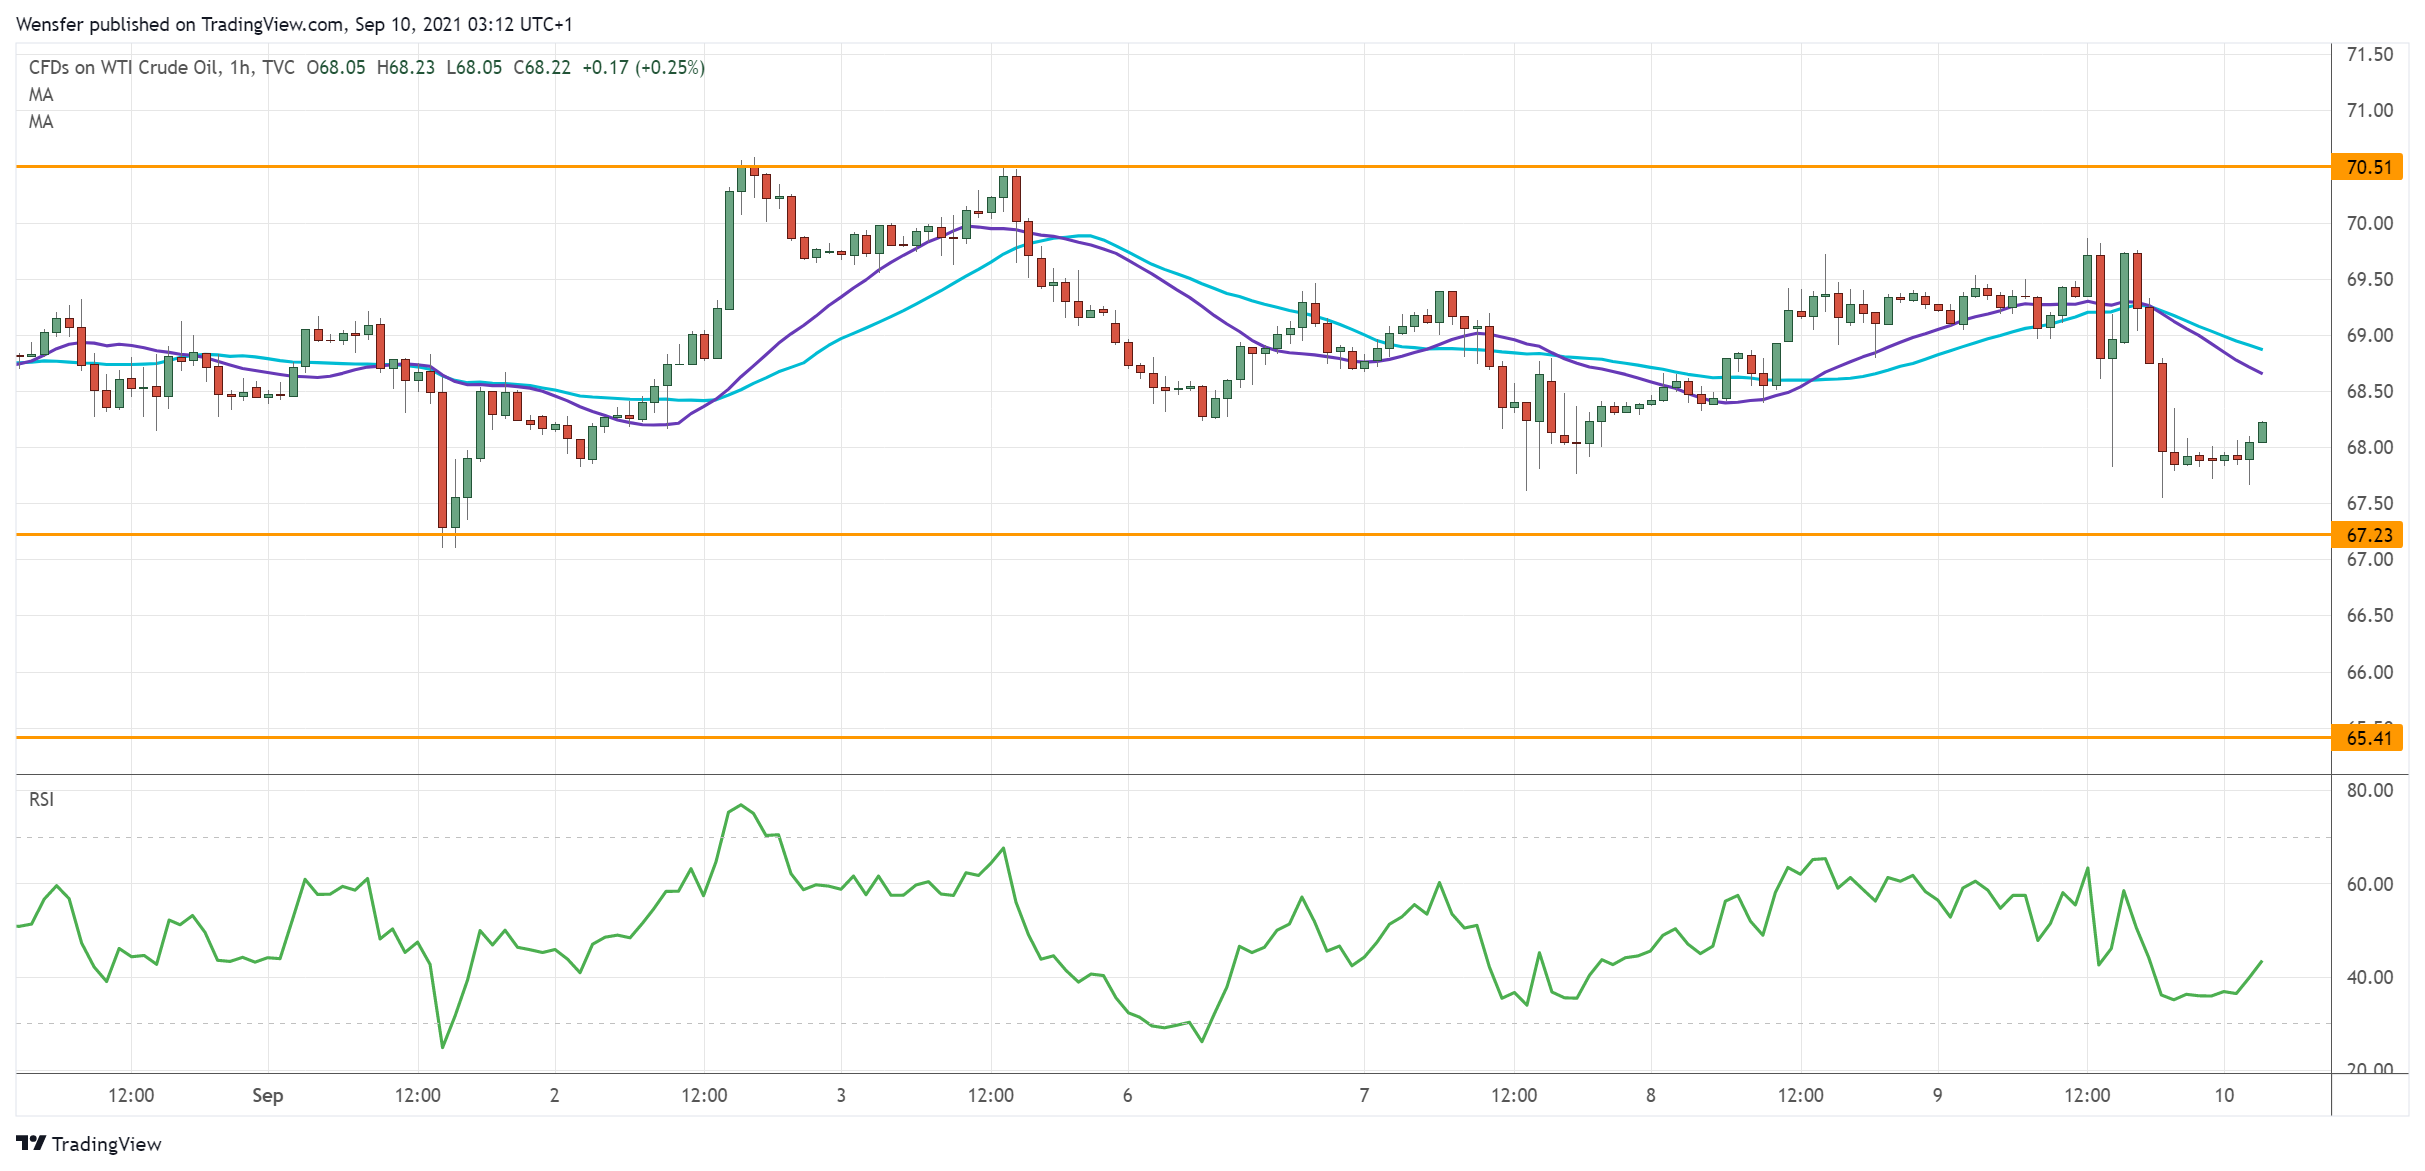
WTI crude tumbled after the EIA reported only a slight decrease in stockpiles.
Sentiment has shifted to the bullish side after a recovery above the daily resistance at 69.50. The sideways action has allowed buyers to hold onto recent gains.
The RSI’s double-dip in the oversold area has soaked up bids with 67.20 as fresh support.
If the bulls succeed in lifting the hurdle at 70.50, 74.10 could be the next target when momentum makes its return. 65.40 would be the second line of defense in case of a pullback.
US 30 Struggles To Rebound
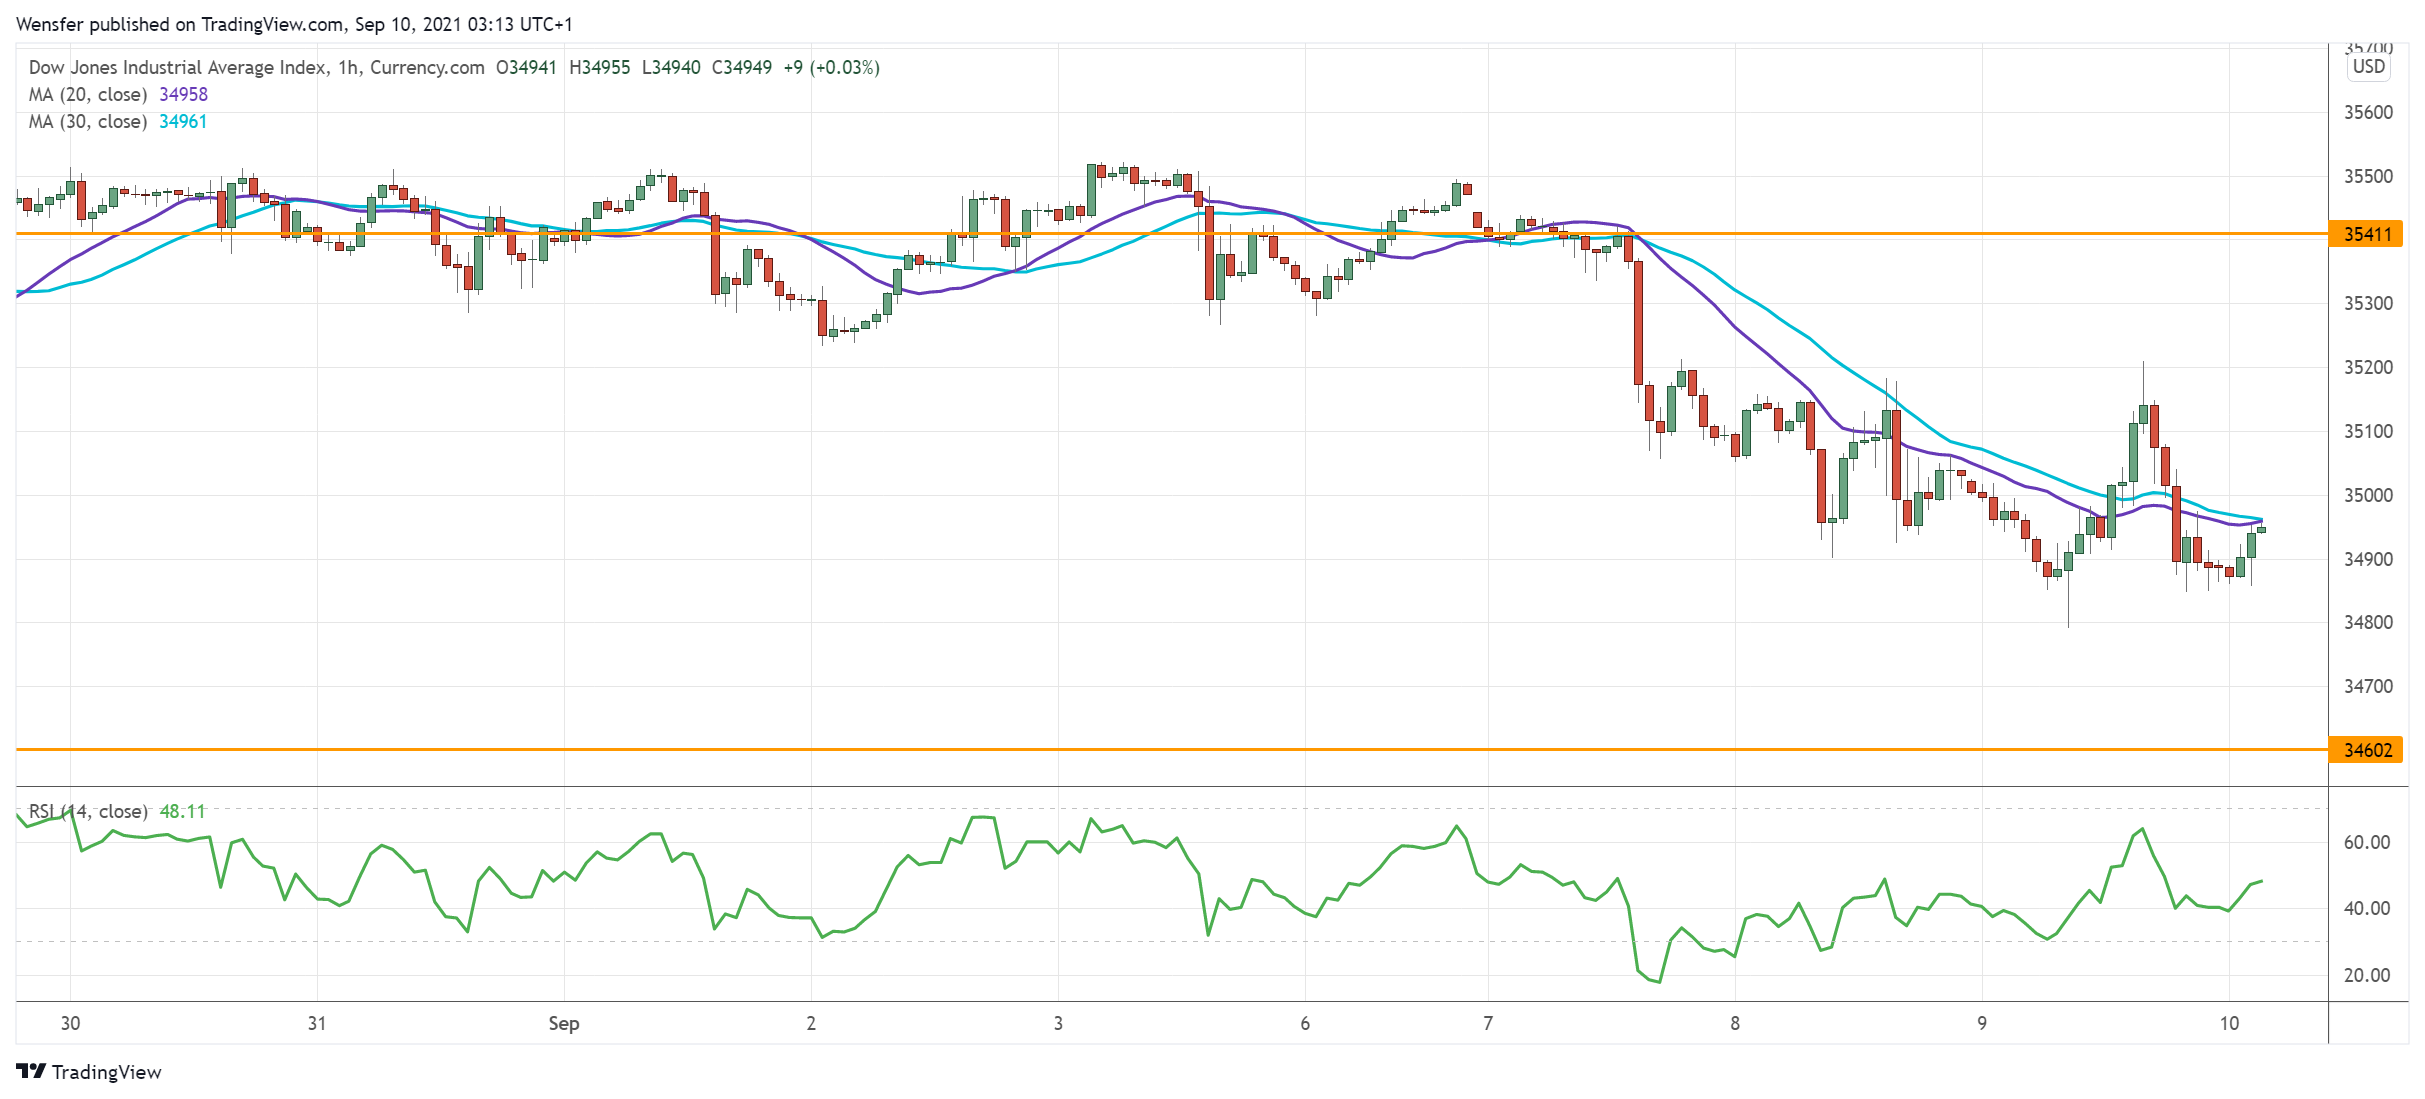
The Dow Jones 30 recoups losses over new low jobless claims. Price action’s struggle near the top at 35630 suggests a lack of commitment for a new high.
The subsequent drop below the consolidation range (35200) has prompted short- term buyers to take the exit. However, an oversold RSI has drawn a buy-the-dips crowd.
After a bounce above 35150, the index will need to clear 35400 before the rally could resume. 34600 is critical support on the daily chart to keep the bullish bias valid.
EUR/USD Tests Support
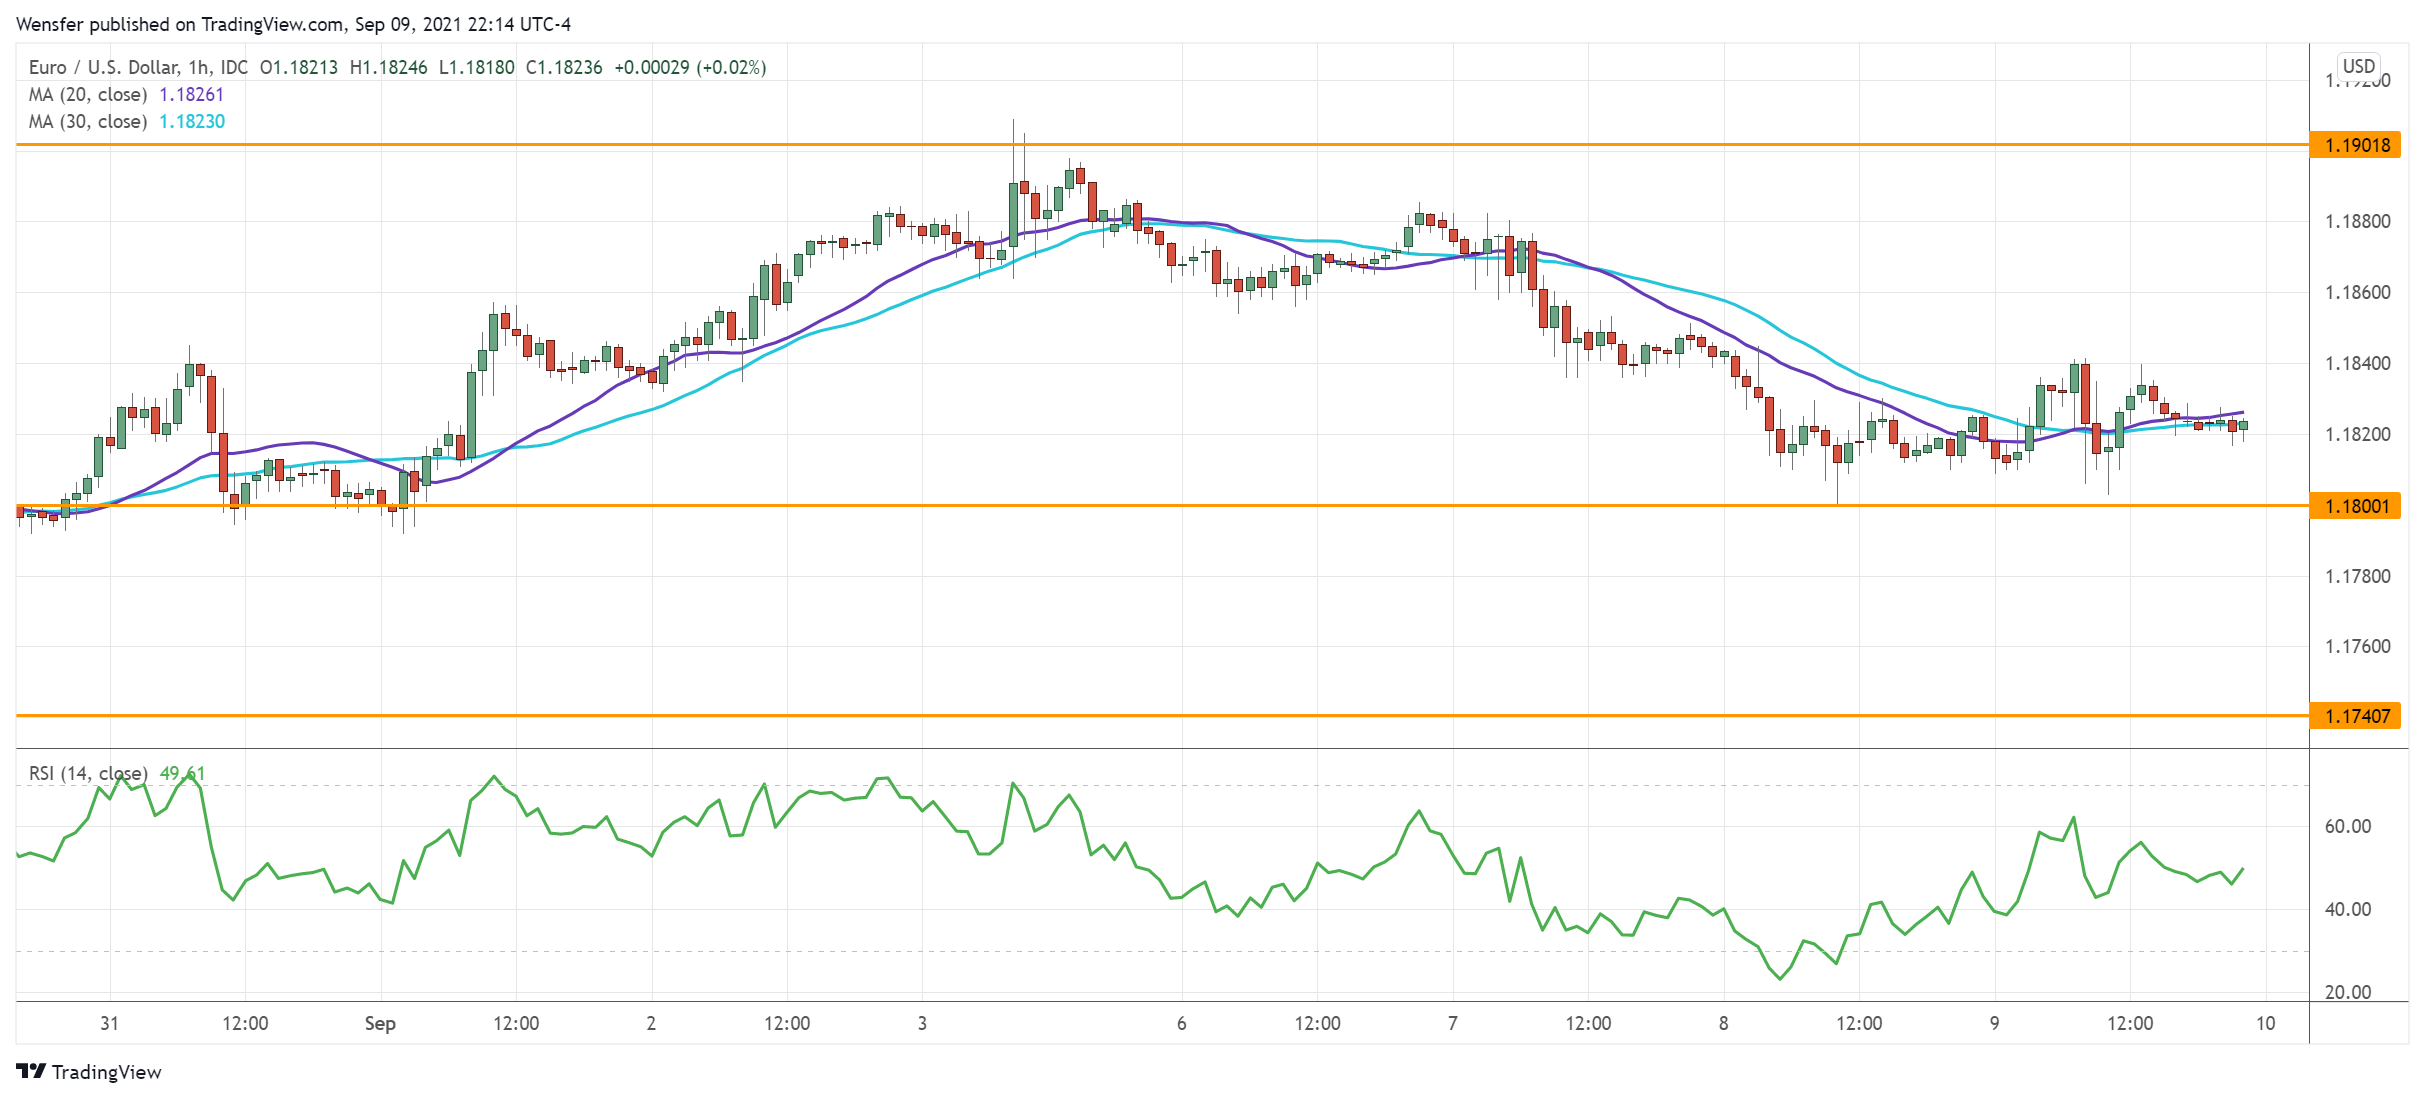
The euro steadied after the ECB signaled it would reduce its bond-buying under PEPP.
The pair is looking for support after it met strong selling pressure at the daily resistance near 1.1900. An oversold RSI has attracted buying interest as the price tests the support at 1.1800.
A rebound above the double top (1.1900) would put the single currency back on track and extend the rally to 1.1970.
A close below said support would deepen the correction to 1.1740 at the origin of the late August breakout.
GBPJPY Stubbornly Tests A Bullish Trendline Breakout
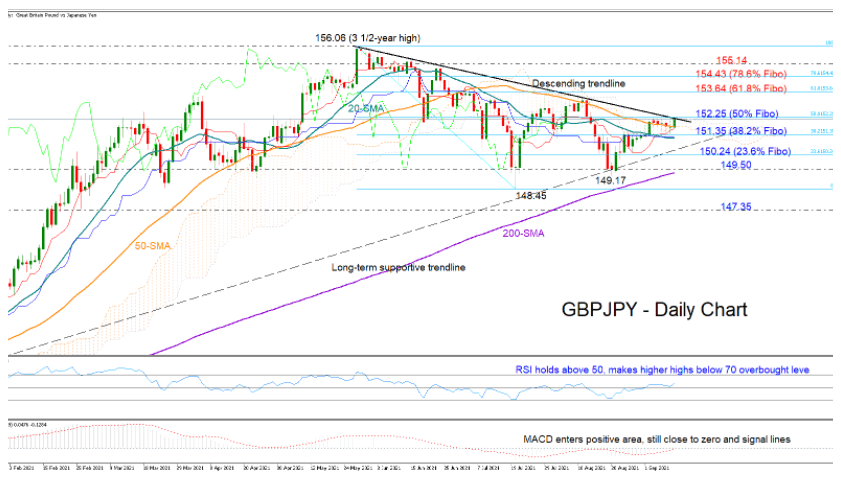
GBPJPY has been in a tight range over the past week but still stubbornly active near the tough resistance trendline, which has been cancelling bullish actions for the third consecutive month.
With the price gaining stronger positive traction early on Friday and the RSI escaping a drop below its 50 neutral mark and printing fresh higher highs below its 70 overbought mark instead, the odds are in favor of an upside breakout. Encouragingly, the MACD managed to enter the positive area despite its anemic upturn, backing this narrative as well.
Note that the 50% Fibonacci of the 156.06 – 148.45 down leg at 152.25 and the surface of the Ichimoku cloud are also positioned in the same neighborhood. Therefore, technically, a clear close above this bar is expected to take a rapid turn up to the 61.8% Fibonacci of 153.64. Slightly higher, the price could face some congestion between the 78.6% Fibonacci of 154.43 and the 155.15 resistance territory before approaching the crucial top of 156.06.
On the downside, the 38.2% Fibonacci of 151.35 and the 20-day simple moving average (SMA) have been on the defense against the bears recently. Nevertheless, even if they give way, a negative correction would not result in an outlook deterioration if the long-term dashed supportive trendline drawn from the 2020 lows strictly rejects the bears with the help of the 23.6% Fibonacci of 150.24. Failure to hold above the latter would bring the downtrend from the 156.06 peak back under examination, though the key support of 149.50 and the 200-day SMA could delay any selling practises. If not, a dip below July's low of 148.45 would give shape to fears of a down-trending market.
In summary, the short-term risk for GBPJPY is still skewed to the upside despite the latest narrow trading, with the bulls expected to pick up steam once the restrictive trendline pulls over.
Daily Technical Analysis
EUR/USD
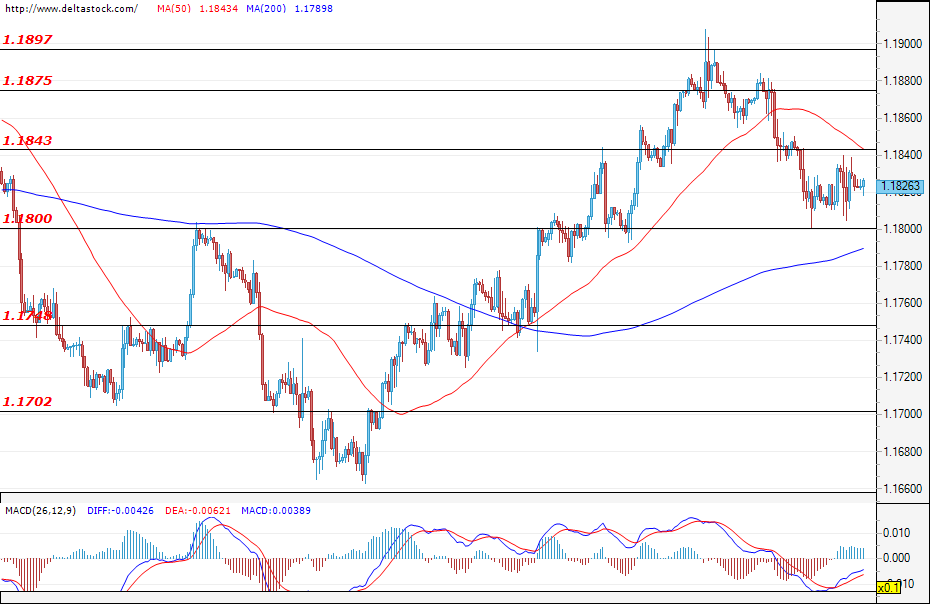
Current level - 1.1826
The consolidation of the currency pair remains between 1.1800 - 1.1843 as part of a corrective move that has been ongoing since the end of last week. The sentiment is still positive, with the main resistance for the bulls being the zone at 1.1843. On the other hand, if the bears manage to maintain their positions and succeed in establishing themselves on the market, we may expect a further decline and a breach of the zone at 1.1800, which would strengthen the expectations for a prolonged sell-off
| Resistance | Support | ||
| intraday | intraweek | intraday | intraweek |
| 1.1843 | 1.1900 | 1.1800 | 1.1700 |
| 1.1875 | 1.1950 | 1.1748 | 1.1700 |
USD/JPY
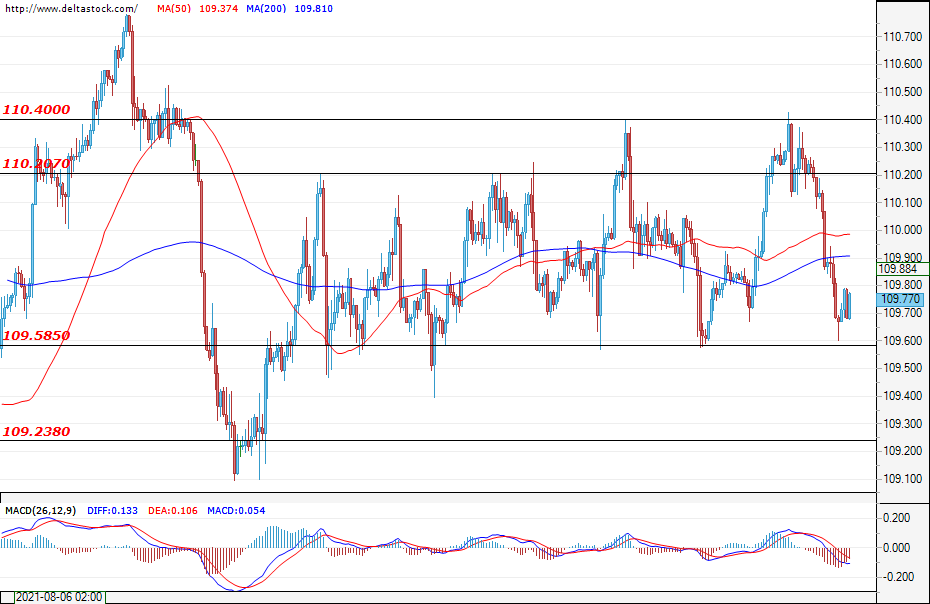
Current level - 109.77
The situation for the U.S. dollar against the Japanese yen remains unchanged as the range between 109.60 - 110.40 is still intact. At the moment, neither the bulls nor the bears have managed to prevail, but the bulls' second failed attempt to breach the resistance at the upper boundary of the channel apparently encouraged the bears and they took the move towards the support zone at 109.60. At the time of writing, the currency pair is consolidating just above the mentioned support, but with a successful breach of this level, the bears could prevail and pave the way for an attack on the next support zone of 109.23.
| Resistance | Support | ||
| intraday | intraweek | intraday | intraweek |
| 110.20 | 110.78 | 109.58 | 109.23 |
| 110.40 | 111.00 | 109.58 | 108.74 |
GBP/USD
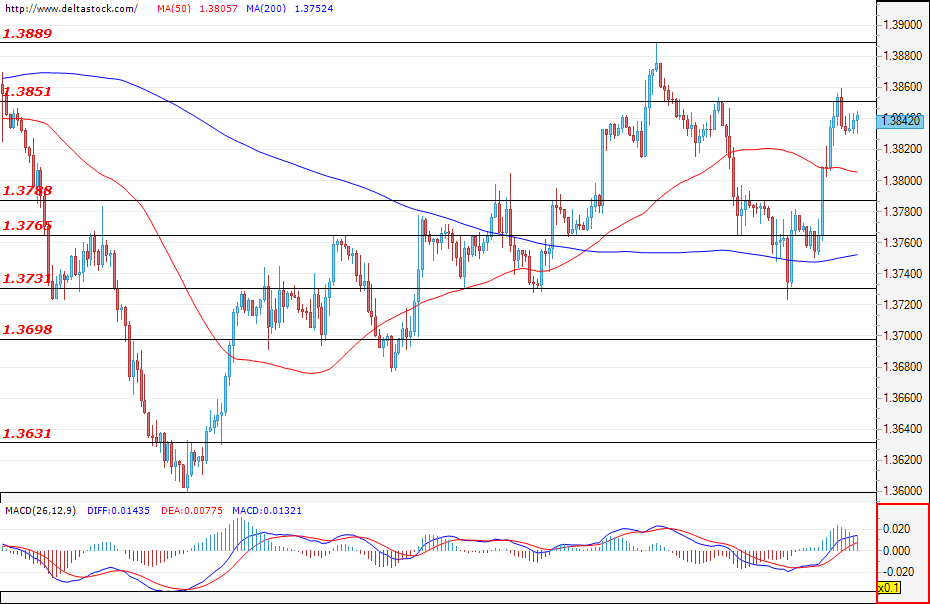
Current level - 1.3842
The corrective phase for the currency pair ended as the bulls managed to limit the sell-off at the 1.3730 support level. After the British pound rose against the U.S. dollar during yesterday's trading session, the pair is now preparing to test the resistance at 1.3851. A successful breach of the mentioned level would confirm the positive sentiment, which is aiming to reach the local high at 1.3890, and we may witness the formation of a range before that. Today, investors will focus their attention on the GDP data for the UK (06:00 GMT).
| Resistance | Support | ||
| intraday | intraweek | intraday | intraweek |
| 1.3851 | 1.3890 | 1.3788 | 1.3731 |
| 1.3890 | 1.4000 | 1.3765 | 1.3698 |
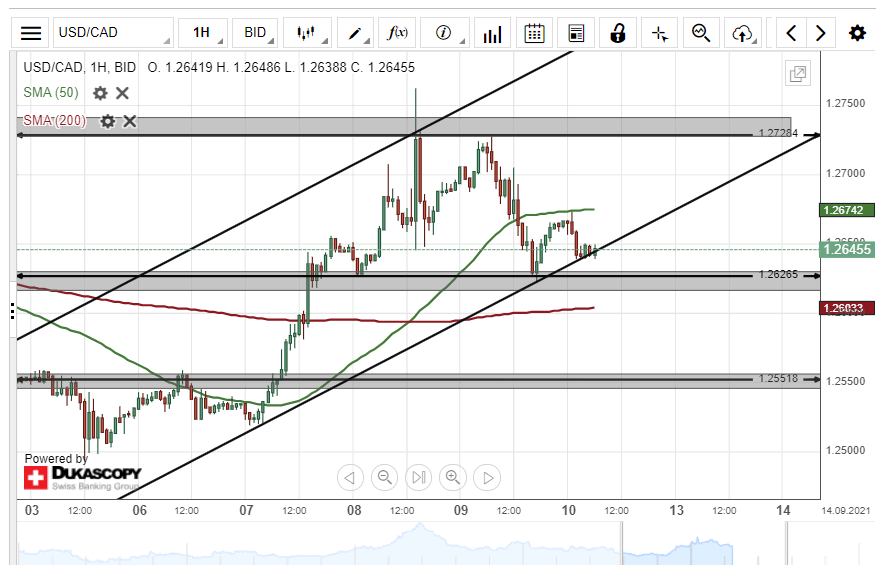
USD/CAD Tests Channel Pattern
On Thursday, the US Dollar declined by 92 pips or 0.72% against the Canadian Dollar. The currency pair tested the lower boundary of an ascending channel pattern at 1.2629 during yesterday's trading session.
The exchange rate is currently trading near the lower line of the channel pattern and could be set for a breakout. If the breakout occurs, a decline towards the 1.2550 level could be expected within this session.
However, if the channel pattern holds, buyers may drive the price towards the resistance level at 1.2750 today.
GBP/JPY Breakout Occurs
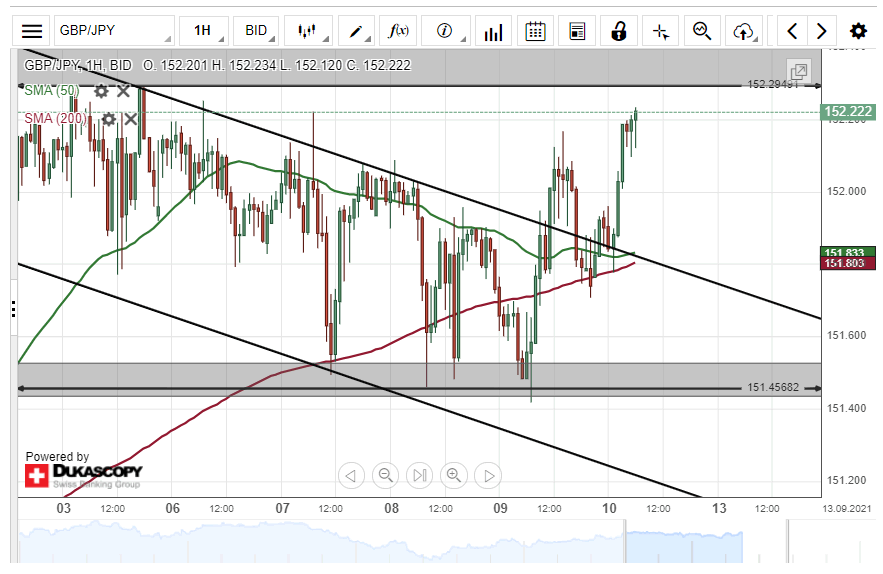
On Thursday, the British Pound surged by 59 pips or 0.39% against the Japanese Yen. A breakout occurred through the upper boundary of a descending channel pattern during Thursday's trading session.
Given that a breakout has occurred, bullish traders are likely to continue to pressure the exchange rate higher during the following trading session. The potential target for buyers will be near the 153.80 area.
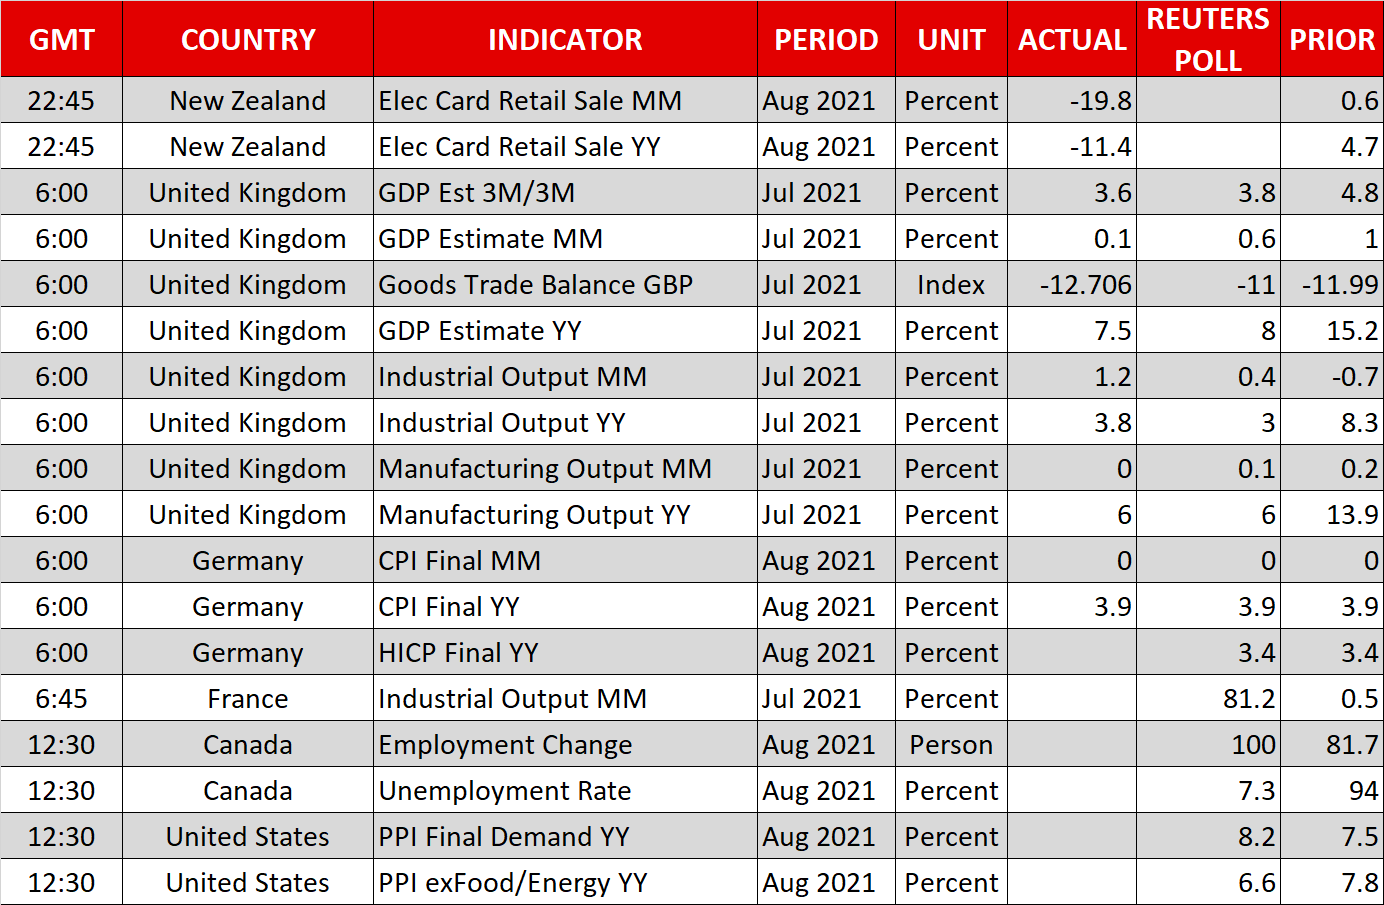
However, the GBP/JPY currency exchange rate might encounter resistance at 152.20 within this session.