Sample Category Title
USDCAD Looks For Buyers Near 1.2440, Bears Could Dominate
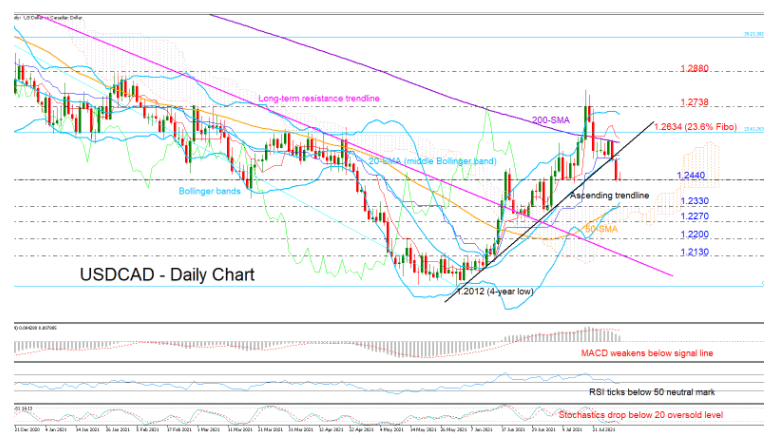
USDCAD retreated below the short-term supportive trendline and to a two-week low of 1.2431 on Thursday following the multiple rejections from the 200-day simple moving average (SMA).
The current consolidation area around 1.2440 overlaps with July 9-13’s support region and the 200-period SMA on the four-hour chart. Hence, it could be an ideal pivot point as the Stochastics sink in the oversold territory. Yet, with the price trading some distance away from the lower Bollinger band, the RSI set to explore the bearish zone, and the MACD strengthening its negative momentum below its red signal line, the bears could rule the roost afterall.
If the bearish scenario unfolds, the pair may dip to meet fresh demand near the lower Bollinger band and the 50-day SMA at 1.2330. The surface of the Ichimoku cloud is also located in the same neighborhood, adding extra importance to the region. Breaking that floor too, the former support area around 1.2270 may attempt to catch the fall before the focus turns to the 1.2200 – 1.2130 restrictive zone, and the broken long-term descending trendline.
Should the 1.2440 base stand firm, the price could push for a close above the 20-day SMA (middle Bollinger band) and the short-term trendline around 1.2545. The 200-day SMA is also converging to the same location, while the 23.6% Fibonacci retracement of the 1.4667 – 1.2012 downleg is within breathing distance at 1.2634. Therefore, stronger buying pressures will be needed to knock that wall and bring the 1.2738 resistance and the 1.2800 peak back into view. Beyond the latter, the bulls could pin a new higher high around 1.2880.
As regards the market trend, the bullish cross between the 20- and 50-day SMAs is still defending the upward move from the four-month low of 1.2012. A potential bullish intersection between the 20- and 200-day SMAs could further enhance trend optimism.
Summarizing, USDCAD is expected to trade bearish in the short-term, though the pair could find some footing around 1.2440 before heading lower again.
GBP/USD Outlook: Cable Is On Track For Strong Weekly Gains, Bulls Pressure Key 1.40 Resistance Zone
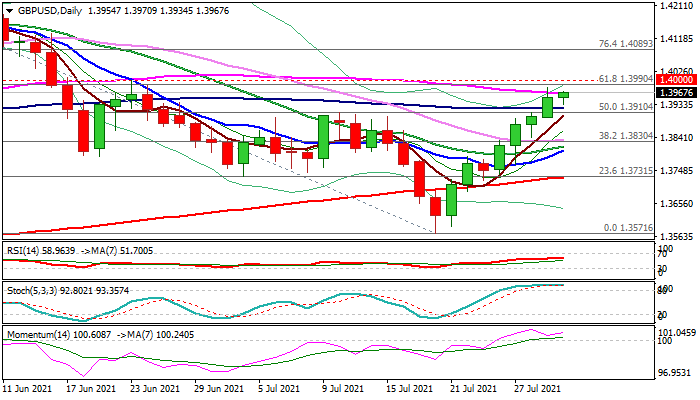
Cable remains firm and holding near a five-week high on Friday, pressuring key barriers at 1.3990/1.4000 (Fibo 61.8% of 1.4249/1.3571/twisting daily cloud/psychological).
The pair advanced strongly this week and is on track for the biggest weekly gains since the last week of August 2020, lifted by the softer dollar after dovish Fed and improved sentiment on a fall in coronavirus cases in Britain.
Technical studies on the daily and weekly charts are in bullish setup and support the advance, however, strongly overbought daily stochastic warns that bulls may face headwinds from 1.40 resistance zone.
End of week profit-taking after about 1.5% weekly advance, could also contribute.
Corrective dips are expected to offer better buying opportunities and should be ideally contained at 1.3920/00 zone (100DMA/former lower high), with possible extended downticks to find ground above 1.3824 (Fibo 38.2% of 1.3571/1.3981 rally) to keep bulls in play.
Completion of reversal pattern on weekly chart signals that 1.4249/1.3571 corrective phase is likely over that gives boost bulls for push through 1..40 pivot.
Res: 1.3990, 1.4000, 1.4073, 1.4089.
Sup: 1.3922, 1.3900, 1.3842, 1.3824.
US Goes For Worst–Case Scenario For The Dollar
Asian markets are losing again on Friday and are on track for their worst monthly decline since last March. However, we do note a marked improvement in sentiment compared to the start of the week. Friday's 0.8% drop in Asian indices on the MSCI Asia-Pacific is quite understandable due to the pull into the dollar and the pressure on risky assets later in the month and week, which could stretch into the end of the day.
At the same time, the news backdrop so far remains on the side of a weaker dollar. Macroeconomic data failed to surprise. The number of people receiving unemployment benefits in the USA stagnates again after the momentum of decline at the beginning of the second quarter. The number of initial applications for them over the last two weeks is again over 400K.
According to the provisional US GDP estimates for the second quarter, the economy was 0.5% above its pre-pandemic peak. However, the growth rate last quarter did not accelerate as economists on average expected. Announced growth was 6.5% compared to 6.3% the previous quarter.
The data generally indicates a relatively high economic growth rate. Still, the stagnating labour market is a cause for caution and does not pave the way for a normalisation of monetary policy. At the same time, GDP is recovering quite rapidly to its pre-crisis trajectory.
This appears like a worst-case scenario for the dollar as it would force the Fed to take a wait-and-see approach, turning a blind eye to high inflation and continuing to feed the economy with easy money. Part of this liquidity is going into the markets, causing a further rise in the prices of listed assets.
We should not forget the fundamental reason for the dollar's weakening: High inflation is eating away at its purchasing power. The two-year US bond now yields 0.2% in a situation with 5.4% inflation and price growth of 3.4% in 2021 and 2.1% in 2022.
Fundamentally, the dollar is only sustained by its reserve currency status and a high degree of uncertainty in a world where it isn't easy to find an alternative right now. Each region has its own set of doubts, from fears of stagnation in Europe to threats of market capitalism in China.
However, investors should remember that the British Pound was once the main reserve currency, with its strength based on power in the colonies. But that did not stop the Pound from declining in the middle of the century. The UK of half a century ago and the US now have in common their reserve currency status and the high debt burden. A stagnant labour market will tie the hands of the Fed in normalising monetary policy.
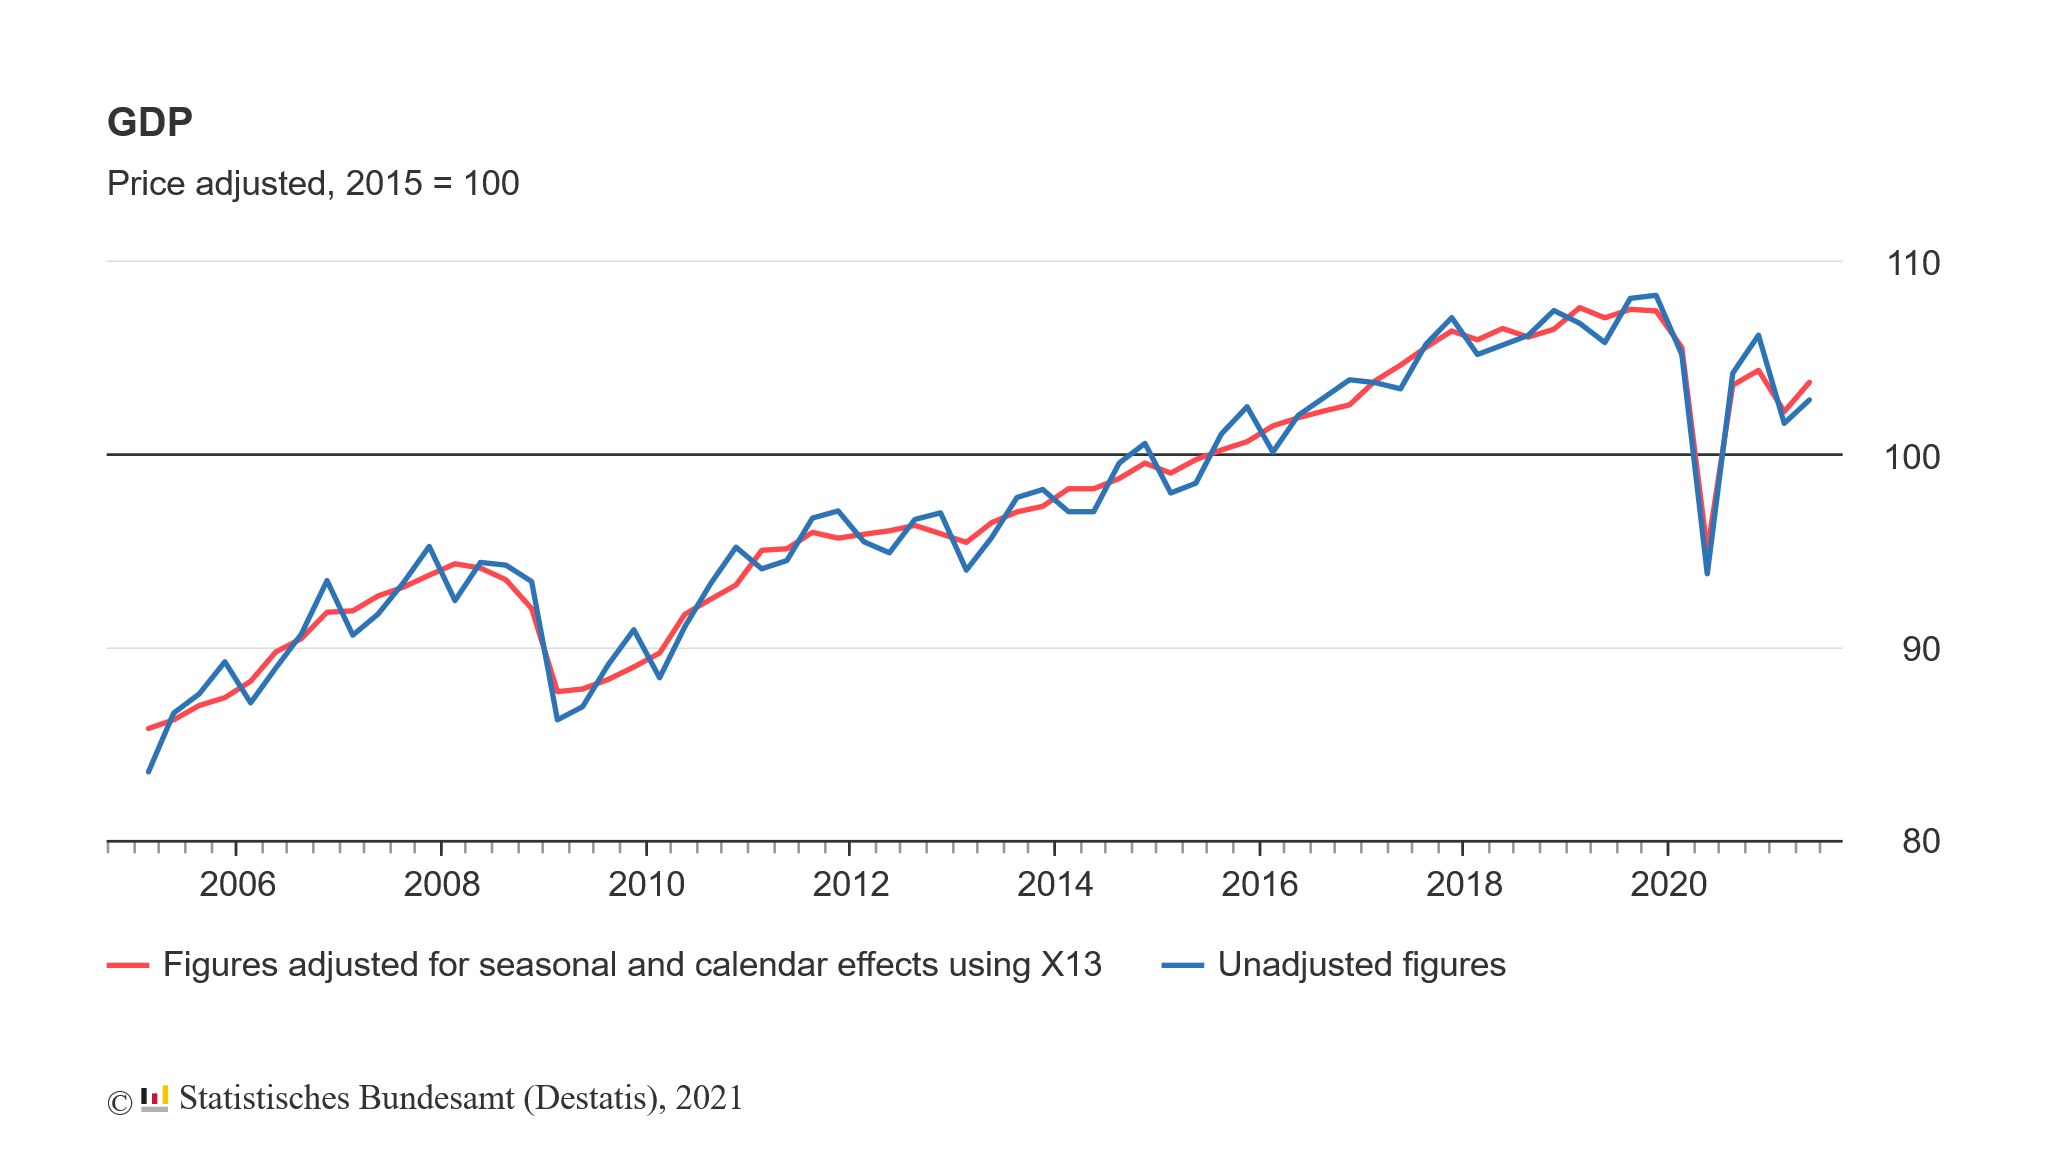
Germany GDP grew 1.5% qoq in Q2, -3.4% below pre-pandemic level
Germany GDP grew 1.5% qoq in Q2, below expectation of 2.0% qoq. Comparing to Q2 2020, GDP was up a price-adjusted 9.6% and a a price- and calendar-adjusted 9.2%. GDP was still -3.4% lower compared to Q2 2019, before the pandemic.
Destatis said, "after the coronavirus crisis had caused another decline in economic performance at the beginning of 2021 (-2.1% in the first quarter, according to most recent calculations), the German economy recovered in the second quarter. This was mainly due to higher household and government final consumption expenditure."
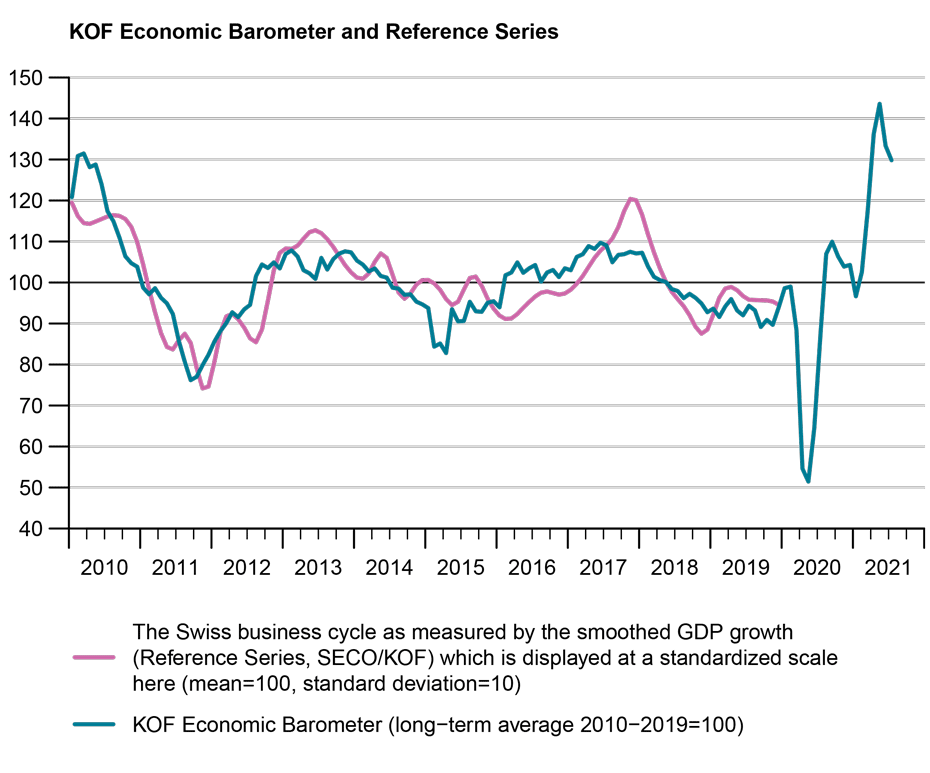
Swiss KOF economic barometer dropped to 129.8, economy still on a strong expansion path
Swiss KOF economic barometer dropped from 133.3 to 129.8 in July. But the indicate is still clearly above the long-term average. KOF added, "the economy is still on a strong expansion path, although the high pace of recent months may not to be sustained."
"The outlook for manufacturing, foreign demand, construction, financial and insurance services as well as private consumption remains favourable but is not quite as positive as in the previous month. In contrast, the outlook for accommodation and food service activities and for other services is improving," KOF said.
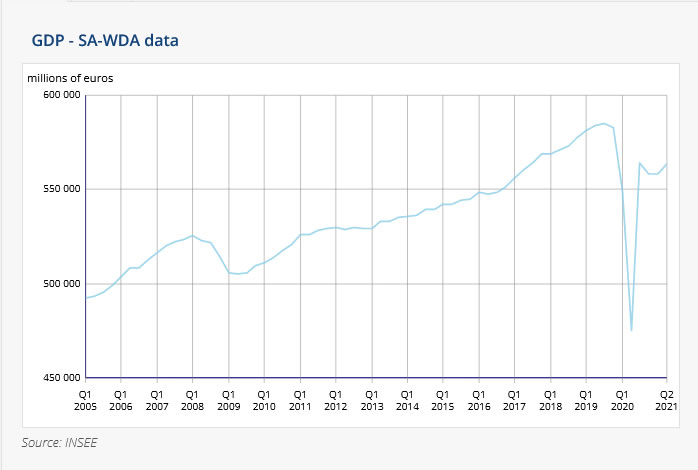
France GDP grew 0.9% qoq in Q2, slightly above expectations
France GDP grew 0.9% qoq in Q2, slightly above expectation of 0.8% qoq. GDP still stood -3.3% below the level of Q4 2019, before the pandemic.
Final internal demand (excluding inventory changes) made a positive contribution to GDP growth this quarter (+0.9 points after +0.1 points in the previous quarter). Gross fixed capital formation (GFCF) accelerated (+1.1% after +0.4%), as households' consumption expenditure (+0.9% after +0.2%).
In Q2 2021, imports (+1.9%) increased more than exports (+1.5%). Overall, foreign trade made a slightly negative contribution to GDP growth this quarter: –0.1 points, after –0.5 points in the previous quarter. Lastly, the contribution of inventory changes to the growth of the GDP was slightly positive this quarter (+0.2 points after +0.4 points in Q1 2021).
GBPJPY Attempts To Overcome 40-Day SMA
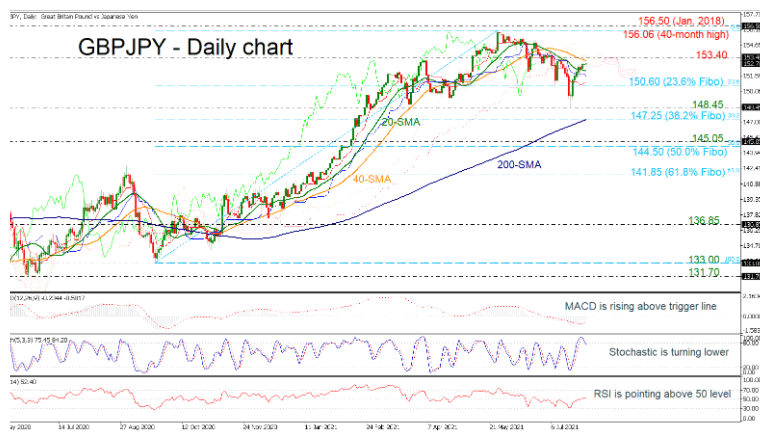
GBPJPY is challenging the 40-day simple moving average (SMA) and the 153.40 resistance, following the bounce off the 148.45 support level. A successful jump above 153.40 could take the market towards the 40-month peak of 156.06 before meeting the 156.50 barrier, reached in January 2018. Moving higher, the 162.80 line, taken from the inside swing high in April 2016 may halt the bullish actions.
According to the technical indicators, the MACD oscillator is gaining ground in the negative territory, jumping above its trigger line, while the RSI is extending its positive move above the neutral threshold of 50. However, the stochastic oscillator created a bearish crossover within the %K and %D lines above the 80 level, suggesting an overbought market.
In case the price retreats below the 20-day SMA, immediate support could come from the 23.6% Fibonacci retracement level of the upward move from 133.00 to 156.06 at 150.60 before pausing the decline at 148.45. Underneath these obstacles, the 200-day SMA, which overlaps with the 38.2% Fibonacci of 147.25 could be in the spotlight.
In conclusion, GBPJPY is in a positive move in the near-term and in a declining tendency in the medium-term after the fall from 156.06.
Fed Communication In Focus
Market movers today
- Today, we have plenty of interesting data releases. After the preliminary US Q2 GDP data released yesterday, estimates for Q2 GDP for the euro area (including country-specific data for Germany, France, Italy and Spain) are due out today at 11:00.
- Also flash euro area HICP inflation is due out today at 11:00.
- In Norway, unemployment data for July are due out at 10:00 CEST.
- The monthly US private consumption and inflation (PCE) data out at 14:30 are always interesting to look at but we implicitly got the data yesterday in connection with the Q2 GDP data.
- FOMC members are allowed to speak again after the July meeting so keep an eye in the coming weeks on comments from individual FOMC members. Fed Chair Jerome Powell sounded more dovish during the press conference than the hawkish shift in the statement so seems like disagreements are growing within the committee.
The 60 second overview
Markets: Yesterday's session was generally characterized by a small Fed-induced relief boost to reflation-sensitive assets. Long-end inflation expectations rose, the USD weakened, rates curves steepened, value outperformed growth in equities and EM/Scandi FX did well.
Meanwhile, overnight sentiment has turned somewhat sour again with similar drivers as in the early parts of this week; namely growth/delta fears and concerns as to the regulatory clampdowns in China. Consequently, most Asian (not least Chinese) equity indices, as well as developed market futures, are found in 'red' this morning. Also, the flattening pressure on rates curves has returned.
US economy: Yesterday's national account figures fell slightly short of expectations as they revealed second-quarter growth of 6.5% Q/Q annualized with negative revisions. Private consumption beat expectations but government consumption, private investments, and net export were somewhat disappointed. That said, with this release US nominal GDP is now back to the pre-crisis trend path which highlights the much more forceful policy response to this crisis compared to the financial crisis of 2007-2009.
The Fed: One of the most important drivers of markets in H2 will be the monetary policy signals from the Fed. With nominal GDP back to pre-crisis trends it highlights the need for gradually removing record stimulus from the economy and markets. We continue to expect that the Fed will turn more and more hawkish in coming months so that actual bond buying tapering will start in Q4. We think it is too early for the Fed to make the next change in connection with the Jackson Hole (also given Fed Chair Powell's more dovish comments during the press conference Wednesday) but we think the September meeting is more likely (two jobs reports away). We still expect the first rate hike in H2 2022. Overall, we see a road from here with tapering, rate hikes, and mild liquidity tightening in the coming years.
FX: USD declined on a broad basis yesterday as the market continued to digest Wednesday's FOMC meeting. EUR/USD rose closer to 1.19 and USD/JPY fell firmly below 110. USD/CNY dropped to 6.46 fully reversing the sharp rise earlier in the week.
Credit: Wednesday's sentiment improvement continued into yesterday where iTraxx Xover tightened 2bp (to 233bp) and Main ½bp (to 46bp). HY bonds tightened 2bp and IG was unchanged.
BTCUSD Bullish Hold
Technical analysis
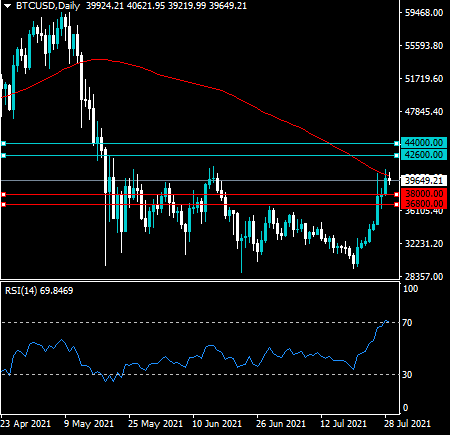
The daily time frame shows that the BTCUSD pair is trading above its key 50-day moving average and attempting to break its 100-day moving average.
The RSI indicator is approaching overbought territory across the daily time frame, however it is noteworthy that the RSI is not yet extremely overbought.
What the possible outcomes are
In our most likely scenario, the BTCUSD pair starts to breakout towards its trend defining 200-day moving average, around the $44,000 price area.
Alternatively, the BTCUSD pair will drop back towards the $38,000 support area and then starts to rally towards its 200-day moving average.
Key levels
Support $39,000 $38,000
Resistance $42,600 $44,000
XRPUSD Bullish Bias
Technical analysis
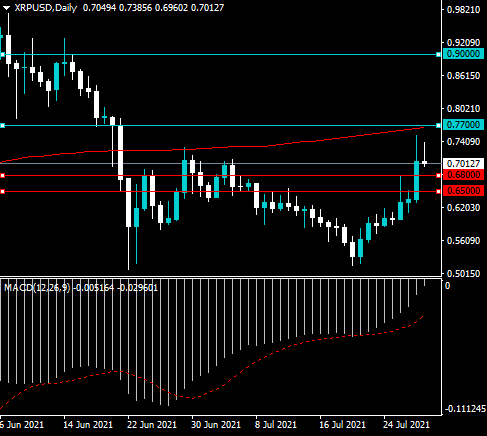
The XRPUSD pair has broken sharply to the upside and is fast approaching its key 200-day moving average, which is located close to the 0.7700 level.
According to the MACD indicator on the daily time frame the XRPUSD pair still has significant upside potential and the ongoing rally is not yet finished.
What the possible outcomes are
In our most likely scenario, the XRPUSD pair will start to rally towards the $0.9000 level after breaking above its key 200-day moving average.
Alternatively, XRPUSD test lower towards the 0.6800 supprot area to attract fresh buying interest and then start to test and eventually break above its key 200-day moving average.
Key levels
Support 0.6800 0.6500
Resistance 0.7700 0.9000